Communication

Research on High-Density Discrete Seismic Signal Denoising Processing Method Based on the SFOA-VMD Algorithm

1
Key Laboratory of Earth Exploration and Information Techniques of Ministry of Education, Chengdu University of Technology, Chengdu 610059, China
2
College of Geophysics, Chengdu University of Technology, Chengdu 610059, China
3
Materials Branch, PetroChina Southwest Oil & Gasfield Company, Chengdu 610017, China
*
Author to whom correspondence should be addressed.
Geosciences 2025, 15(11), 409; https://doi.org/10.3390/geosciences15110409
Submission received: 27 July 2025 / Revised: 25 September 2025 / Accepted: 21 October 2025 / Published: 25 October 2025
(This article belongs to the Section Geophysics)

Abstract

With the increasing demand for precision in seismic exploration, high-resolution surveys and shallow-layer identification have become essential. This requires higher sampling frequencies during seismic data acquisition, which shortens seismic wavelengths and enables the capture of high-frequency signals to reveal finer subsurface structural details. However, the insufficient sampling rate of existing petroleum instruments prevents the effective capture of such high-frequency signals. To address this limitation, we employ high-frequency geophones together with high-density and high-frequency acquisition systems to collect the required data. Meanwhile, conventional processing methods such as Fourier transform-based time–frequency analysis are prone to phase instability caused by frequency interval selection. This instability hinders the accurate representation of subsurface structures and reduces the precision of shallow-layer phase identification. To overcome these challenges, this paper proposes a denoising method for high-sampling-rate seismic data based on Variational Mode Decomposition (VMD) optimized by the Starfish Optimization Algorithm (SFOA). The denoising results of simulated signals demonstrate that the proposed method effectively preserves the stability of noise-free regions while maintaining the integrity of peak signals. It significantly improves the signal-to-noise ratio (SNR) and normalized cross-correlation coefficient (NCC) while reducing the root mean square error (RMSE) and relative root mean square error (RRMSE). After denoising the surface mountain drilling-while-drilling signals, the resulting waveforms show a strong correspondence with the low-velocity zone interfaces, enabling clear differentiation of shallow stratigraphic distributions.

1. Introduction

Seismic data contain a wealth of valuable information related to subsurface stratigraphy, geological structures, and natural resources. By analyzing seismic data, geologists can obtain accurate insights into subsurface structures, enabling more precise interpretation of subsurface formation processes. However, during the acquisition of seismic data, various types of noise and interfering signals are inevitably mixed with the effective signal. Effectively removing these interferences while preserving and extracting the key features of the useful signal remains a major challenge in seismic data analysis. This challenge is also a primary driving force behind the widespread development and application of advanced signal processing techniques in seismic exploration in recent years.
Different seismic instruments support slightly varying sampling intervals, with conventional seismic exploration typically using intervals of 1 ms or 2 ms. Assuming a seismic wave propagation velocity of 4000 m/s and a sampling interval of 1 ms, even a one-sample error would result in a 2 m deviation on the seismic section due to two-way travel time. This level of inaccuracy makes it difficult to identify thin layers effectively. By increasing the sampling interval to 0.1 ms, the resulting deviation on the seismic section reduces to only 0.2 m, thereby significantly enhancing the resolution of seismic signals. However, when processing high-sampling-rate signals, traditional denoising methods—such as time–frequency analysis based on the Fourier Transform—are prone to phase instability caused by the selection of frequency bands, which impairs the accurate representation of subsurface structures. In contrast, Variational Mode Decomposition (VMD) can leverage the non-stationary characteristics of seismic signals and the oscillatory differences between effective signals and noise to perform modal decomposition and data reconstruction, thereby achieving effective denoising of seismic data. This paper focuses on the effective denoising of high-sampling-rate seismic signals to enhance the accuracy of their representation of subsurface media [1,2,3,4,5,6,7,8].
Due to the presence of noise interference during seismic signal acquisition, it is necessary to perform signal decomposition and data reconstruction as preliminary steps. Huang et al. (1998) proposed Empirical Mode Decomposition (EMD), which decomposes complex signals into a finite number of Intrinsic Mode Functions (IMFs) through local feature extraction [9]. As an adaptive signal processing tool, EMD has been widely applied across numerous fields. SMITH, J.S. (2005) proposed Local Mean Decomposition (LMD), which iteratively extracts the local mean and envelope functions of a signal to decompose it into multiple product functions [10]. However, during the decomposition processes of EMD and LMD, issues such as mode mixing and endpoint effects often arise. Wu et al. (2009) proposed Ensemble Empirical Mode Decomposition (EEMD), which mitigates mode mixing by adding white Gaussian noise during the decomposition process [11]. Yeh et al. (2010) proposed Complementary Ensemble Empirical Mode Decomposition (CEEMD), which adds pairs of complementary white noise (positive and negative noise pairs) to the original signal to generate multiple perturbed signals. Each is decomposed via EMD, and the noise effects are eliminated through ensemble averaging. This approach leverages the statistical properties of noise to cancel residual noise during decomposition while effectively suppressing mode mixing [12]. Torres et al. (2011) proposed Complete Ensemble Empirical Mode Decomposition with Adaptive Noise (CEEMDAN), which optimizes the noise addition strategy by incorporating adaptive noise ensembles to progressively decompose the signal into its constituent frequency components [13]. Dragomiretskiy et al. (2014) introduced a novel signal mode decomposition method—Variational Mode Decomposition (VMD)—to address signal denoising challenges [14]. Based on a variational optimization framework, VMD achieves efficient signal decomposition by constraining the bandwidth and center frequency of each mode. Due to its advantages in signal denoising, frequency band separation, and non-stationary signal analysis, VMD has become a classical method in the field of signal processing. Huang et al. (2018) combined Variational Mode Decomposition (VMD) with correlation coefficients to attenuate random noise in seismic data and achieved promising results [15]. Based on the characteristics of the signal to be decomposed, many researchers have proposed various methods to determine the optimal number of modes k, such as permutation entropy optimization (Wang et al., 2018), simulated annealing algorithm (Yang et al., 2019), and ensemble kurtosis (Miao et al., 2019) [16,17,18]. However, since the number of modes K and the penalty factor α in the VMD algorithm have a significant impact on the decomposition results—and both parameters are inherently uncertain—selecting an optimal combination of K and α is of great importance. A common approach for determining the optimal combination of K and α is the use of various heuristic optimization algorithms. Shi et al. (2020) combined VMD and wavelet thresholding to denoise hydrophone signals [19]. Zhang et al. (2021) proposed a VMD parameter optimization method based on the Grey Wolf Optimizer (GWO), achieving favorable results in filtering noise from eddy current detection (ECD) signals [20]. Li et al. (2024) proposed an improved Dung Beetle Optimizer (IDBO)-based VMD parameter optimization method and applied it to power quality disturbance (PQD) signals [21]. Li et al. (2025) proposed a VMD parameter optimization method based on the Sparrow Search Algorithm (SSA) and applied it to the denoising of steam trap signals [22]. The algorithm based on Empirical Mode Decomposition (EMD) has been widely applied in various fields such as bearing fault diagnosis [23,24,25,26,27,28], bridge signal denoising [29], pulse signal denoising, and electrocardiogram (ECG) signal denoising [30], achieving notable results in each area [31,32]. Although GWO-, IDBO-, and SSA-based optimization methods have been reported to improve parameter selection for VMD in various applications, these algorithms may still exhibit limitations such as slow convergence, premature convergence, or limited robustness when dealing with highly complex and non-stationary seismic data. In contrast, SFOA incorporates parallel bidirectional search and regeneration mechanisms that more effectively balance exploration and exploitation. This design improves both global optimization accuracy and convergence efficiency, making SFOA particularly suitable for identifying optimal VMD parameters under the challenging conditions posed by high-sampling-rate seismic signals. Zhong et al. (2024) proposed the Starfish Optimization Algorithm (SFOA), which mimics the behavioral patterns of starfish to solve optimization problems. The algorithm demonstrated significant improvements in both accuracy and optimization efficiency and achieved stable performance in real-world engineering optimization tasks, effectively enabling global solution discovery [33].
In summary, although methods such as EMD, LMD, EEMD, CEEMDAN, and VMD optimized by heuristic algorithms (e.g., GWO, IDBO, SSA) have been successfully applied to various signal denoising tasks, they still exhibit certain limitations. Specifically, many of these algorithms suffer from mode mixing, endpoint effects, slow convergence, or premature stagnation when processing highly complex seismic data. Recent studies—such as RIME-VMD for rolling bearing diagnosis, AO-VMD for bridge signal denoising, and ICEEMDAN-PSO-VMD for ICG signal processing—further demonstrate the broad applicability of optimized VMD approaches, yet also underscore the persistent difficulty in achieving both robustness and efficiency in parameter selection. These findings highlight the need for an optimization strategy that can simultaneously deliver strong global search capability, fast convergence, and stable performance. Motivated by this gap, our study introduces the Starfish Optimization Algorithm (SFOA) for VMD parameter optimization, with the goal of overcoming the aforementioned limitations and enhancing denoising performance for high-sampling-rate seismic signals. In view of this, based on existing research, this paper proposes a seismic signal denoising method based on the SFOA-VMD approach. This study uses high-sampling-rate drilling-while-drilling signals acquired during the drilling process as an example for processing. First, the Starfish Optimization Algorithm (SFOA), which demonstrates strong performance in accuracy and optimization efficiency, is employed with the minimum envelope entropy as the objective function to optimize the key parameters of the VMD method: the number of modes k and the penalty factor α, thereby obtaining the optimal parameter combination k , α . Then, the cross-correlation coefficient is used to analyze the main components within each IMF. IMFs with cross-correlation coefficients greater than 0.1 are combined and reconstructed to obtain the denoised signal. The denoising performance of the proposed method is validated using four evaluation metrics: signal-to-noise ratio (SNR), root mean square error (RMSE), relative root mean square error (RRMSE), and normalized cross-correlation (NCC).
The main contributions of this study can be summarized as follows:
(1) A novel denoising method for high-sampling-rate seismic signals is proposed, based on Variational Mode Decomposition (VMD) optimized by the Starfish Optimization Algorithm (SFOA).
(2) By using minimum envelope entropy as the fitness function, the proposed method achieves optimal VMD parameter selection, improving decomposition accuracy and robustness compared to conventional heuristic optimization algorithms.
(3) The method is validated using both synthetic and field logging-while-drilling seismic data. Results show that the proposed approach significantly improves the signal-to-noise ratio (SNR) and normalized correlation coefficient (NCC) while reducing the root mean square error (RMSE) and relative root mean square error (RRMSE). Furthermore, it more effectively preserves the integrity of seismic waveform characteristics compared to traditional methods.
The remainder of this paper is structured as follows: Section 2 introduces the principles of VMD and the Starfish Optimization Algorithm. Section 3 describes the denoising framework and performance evaluation metrics. Section 4 presents applications to synthetic and field data along with comparative analyses. Section 5 summarizes the key findings and suggests future research directions.

2. Materials and Methods

2.1. Variational Mode Decomposition (VMD)

The Variational Mode Decomposition (VMD) algorithm, originally proposed by Dragomiretskiy and Zosso, formulates the signal decomposition process as a constrained variational optimization problem. This method decomposes the input signal f t into multiple Intrinsic Mode Function (IMF) components, each with a center frequency ω k , where k is a predefined parameter. The constrained variational model of the VMD algorithm is formulated as follows:
m i n u k , ω k k t δ t + j π t u k t e j ω k t 2 2 s . t . k u k t = f t
In the equation, t denotes the partial derivative with respect to time t , δ t represents the Dirac delta function, ω k is the center frequency of the k -th mode, u k denotes the k -th IMF component, and f t is the original input signal. To solve for the minimum of Equation (1), a Lagrange multiplier λ and a quadratic penalty factor α are introduced, transforming the original constrained variational problem into an unconstrained one.
L u k , ω k , λ = α k t δ t + j π t u k t e j ω k t 2 2 + f t k u k t 2 2 + λ t , f t k u k t
Split it into subproblems using the Alternating Direction Multiplier Method (ADMM):
u k n + 1 = arg min u k X α t δ t + j π t u k t e j ω k t 2 2 + f t i u i t + λ t 2 2 2
ω k n + 1 = arg min ω k t δ t + j π t u k t e j ω k t 2 2
Finally, iteratively solve for the center frequency and bandwidth of each IMF component. The iterative update procedure is as follows:
u k n + 1 ω = f ^ ω i < k u ^ i n + 1 ω i < k u ^ i n ω + λ ^ n ω 2 1 + 2 α ω ω k n 2
ω k n + 1 = 0 ω u ^ k n + 1 ω 2 d ω 0 u ^ k n + 1 ω 2 d ω
λ ^ n + 1 ω = λ ^ n ω + τ f ^ ω k u ^ k n + 1 ω
In the equation, τ represents the update rate of the Lagrange multiplier. As shown in Equation (2), the decomposition result of VMD depends heavily on the predefined number of modes k and the penalty factor α . However, selecting appropriate values for k and α based solely on empirical knowledge is often insufficient to accommodate varying signal characteristics. Therefore, the Starfish Optimization Algorithm (SFOA) is introduced to optimize these parameters, aiming to achieve more effective signal decomposition.

2.2. The Starfish Optimization Algorithm (SFOA)

The optimization algorithm SFOA is a meta-heuristic inspired by the behavioral patterns of starfish, designed to address global and engineering optimization problems. SFOA consists of two main phases: the exploration phase and the exploitation phase. The exploration phase mimics the starfish’s foraging and exploratory behavior, while the exploitation phase is structured around predation and regeneration strategies to enhance solution refinement. The implementation steps of the algorithm are as follows:

2.2.1. Initialization

In the initialization phase, the positions of the starfish are randomly generated within the boundaries of the design variables and can be represented as a matrix:
X = X 11 X 12 X 1 D X 21 X 22 X 2 D X N 1 X N 2 X N D N × D
In the equation, X denotes the matrix storing the positions of the starfish, with a size of N × D , where N represents the population size and D is the dimensionality of the design variables.
During the initialization phase, the position of each starfish in Equation (6) is evaluated as follows:
X i j = l j + r u j l j , i = 1 , 2 , , N , j = 1 , 2 , , D
In the equation, X i j represents the position of the i -th starfish in the j -th dimension, r is a random number uniformly distributed between 0 and 1, and u j and l j denote the lower and upper bounds of the design variable in the j -th dimension, respectively. After generating the initialization position matrix, the fitness values of all starfish can be obtained by evaluating the objective function, which can be stored in the vector:
F = F X 1 F X 2 F X N N × 1
In the equation, F is a matrix used to store and update the obtained fitness values, with a size of N × 1 . After initialization, the SFOA enters the main loop, commencing the exploration and exploitation phases.

2.2.2. Exploration Phase

In the exploration phase, a one-dimensional search strategy is employed to update positions. Each starfish uses only one arm to explore, leveraging the positional information of other starfish to search for food sources. The updated position can be expressed as:
Y i , q T = E t X i , p T + A 1 X k 1 , p T X i . p T + A 2 X k 2 , p T X i , p T
In the equation, X k 1 , p T and X k 2 , p T represent the p -th dimensional positions of two randomly selected starfish, A 1 and A 2 are two random numbers uniformly distributed in the range (−1, 1), and p is a random number in the D-th dimension. E t denotes the energy of the starfish, which is calculated as follows:
E t = T m a x T T m a x c o s θ
In the equation, T denotes the current iteration number, T max represents the maximum number of iterations, and θ varies with the iteration progress. Its calculation is given by:
θ = π 2 × T T m a x
When the updated position falls outside the boundaries of the design variables, the starfish arm tends to remain in its previous position rather than move to the new, invalid location. This constraint handling is expressed as:
X i , p T + 1 = Y i , p T l b , p Y i , p T u b , p X i , p T o t h e r w i s e

2.2.3. Exploitation Phase

In SFOA, the exploitation phase incorporates predation and regeneration behaviors to search for the global optimum. To achieve this, two update strategies are designed. To simulate the predation behavior, SFOA employs a parallel bidirectional search strategy, which utilizes information from other starfish as well as the current global best position in the population. First, five distances between the best position and other starfish are calculated. Then, two of these distances are randomly selected for confirmation. Using this parallel bidirectional search mechanism, each starfish updates its position according to the following equation:
d m = X b e s t T X m p T , m = 1 , , 5
In the equation, d m represents the five distance vectors between the global best position and five randomly selected starfish, while m p denotes the positions of these five randomly chosen starfish. Accordingly, the position update rule for each starfish during the predation behavior is calculated as follows:
Y i T = X i T + r 1 d m 1 + r 2 d m 2
In the equation, r 1 and r 2 are random numbers uniformly distributed in the range (0, 1), d m 1 and d m 2 are randomly selected from the set d m , respectively.
In addition, due to their slow movement during predation, starfish are vulnerable to attacks from other predators. If a predator captures a starfish, the starfish may detach and lose an arm to escape. As a result, the regeneration phase in SFOA is applied only to the last starfish in the population ( i = N ). Since regeneration takes several months, the movement of the starfish during this phase is extremely slow. The position update during the regeneration phase is thus calculated as follows:
Y i T = e x p T × N / T m a x X i T
In the equation, T denotes the current iteration number, T max is the maximum number of iterations, and N represents the population size. If the positions calculated by Equations (16) and (17) exceed the boundaries of the design variables, the positions are adjusted using the following formula:
X i T + 1 = Y i T l b Y i T u b l b Y i T < l b u b Y i T > u b
Finally, this paper selects minimum envelope entropy as the fitness function for the SFOA to optimize the parameters of VMD.
Pseudocode of the Starfish Optimization Algorithm (SFOA):
(1) Initialize population of starfish positions randomly within variable bounds.
(2) Evaluate the fitness of each starfish using the objective function (minimum envelope entropy).
(3) If the termination condition is not met (maximum iterations):
a. Exploration phase: Update starfish positions using a one-dimensional search and energy-based strategy.
b. Exploitation phase (predation): Perform parallel bidirectional search guided by global best and neighbor distances.
c. Exploitation phase (regeneration): Apply the regeneration mechanism to the last starfish to enhance diversity.
d. Enforce boundary conditions on updated positions.
e. Evaluate fitness and update the global best solution.
(4) Return the global best position (optimal VMD parameters k and α ).

3. Denoising Principle and Evaluation Parameters

3.1. Denoising Principle

Figure 1 depicts the flowchart of the proposed denoising method. The specific procedural steps are described below:
(1) Initialize the parameters of the Starfish Optimization Algorithm (SFOA). Using minimum envelope entropy as the objective function, employ SFOA to determine the optimal number of VMD modes k and the penalty factor α .
(2) Decompose the noisy signal using VMD with the optimized parameters to obtain the Intrinsic Mode Functions (IMFs).
(3) Calculate the correlation coefficients between each IMF and the original signal. Reconstruct the denoised signal by combining IMFs whose correlation coefficients exceed 0.1.

3.2. Denoising Performance Evaluation Methods

This study employs four widely used evaluation metrics—signal-to-noise ratio (SNR), root mean square error (RMSE), relative root mean square error (RRMSE), and normalized cross-correlation (NCC)—to comprehensively assess denoising performance. Among these, SNR and RMSE serve as classical measures for evaluating noise attenuation and reconstruction fidelity, while RRMSE and NCC are adopted from recent literature to provide normalized error comparison and robust similarity assessment [34,35,36].
S N R = 10 l g i = 1 n x i 2 i = 1 n x i y i 2
R M S E = 1 n i = 1 n x i y i 2
R R M S E = i = 1 n x i y i 2 i = 1 n y i 2
N C C = i = 1 n x i y i i = 1 n x i 2 i = 1 n y i 2

4. Denoising Application

4.1. Synthetic Signal Test

The synthetic seismic model signal is generated by convolving a reflection coefficient series with a seismic wavelet. The reflection coefficient series is calculated from acoustic impedance contrasts, following standard seismic modeling principles [37].
A one-dimensional synthetic record is generated using acoustic logging data from a well location in the southwestern region to test the proposed method. First, the interval velocity V i is calculated based on the travel time per unit distance ( Δ t i ) using the following formula:
V i = 1 0 6 Δ t i i = 1 , 2 , 3 , , N
In the equation, Δ t i represents the acoustic travel time per unit distance in the i -th layer, which is derived from the sonic transit-time curve. The total number of layers is set to N = 100 .
According to Gardner’s empirical formula, layer density can be calculated from interval velocity as follows:
ρ i = B V i m m = 0.25 , B = 0.31
In the equation, B and m are empirical constants used for calculating layer density, V i is the interval velocity of the i -th layer, and ρ i is the corresponding density of the i -th layer [38].
The calculation formula for the vertical two-way travel time from the i -th formation interface to the surface is:
t i = t i 1 + 2 H i H i 1 V i i = 2 , 3 , 4 , , N = 100
The calculation formula for the initial value is as follows: t 1 = 2 H 1 V 1 .
By discretizing the two-way travel time t i , the discrete formula for the reflection coefficient index corresponding to the interface is obtained as:
n = t i Δ t r o u n d
In the equation, Δ t denotes the sampling interval.
The reflection coefficient at the i -th formation interface is calculated using the following formula:
R n = ρ i + 1 V i + 1 ρ i V i ρ i + 1 V i + 1 + ρ i V i
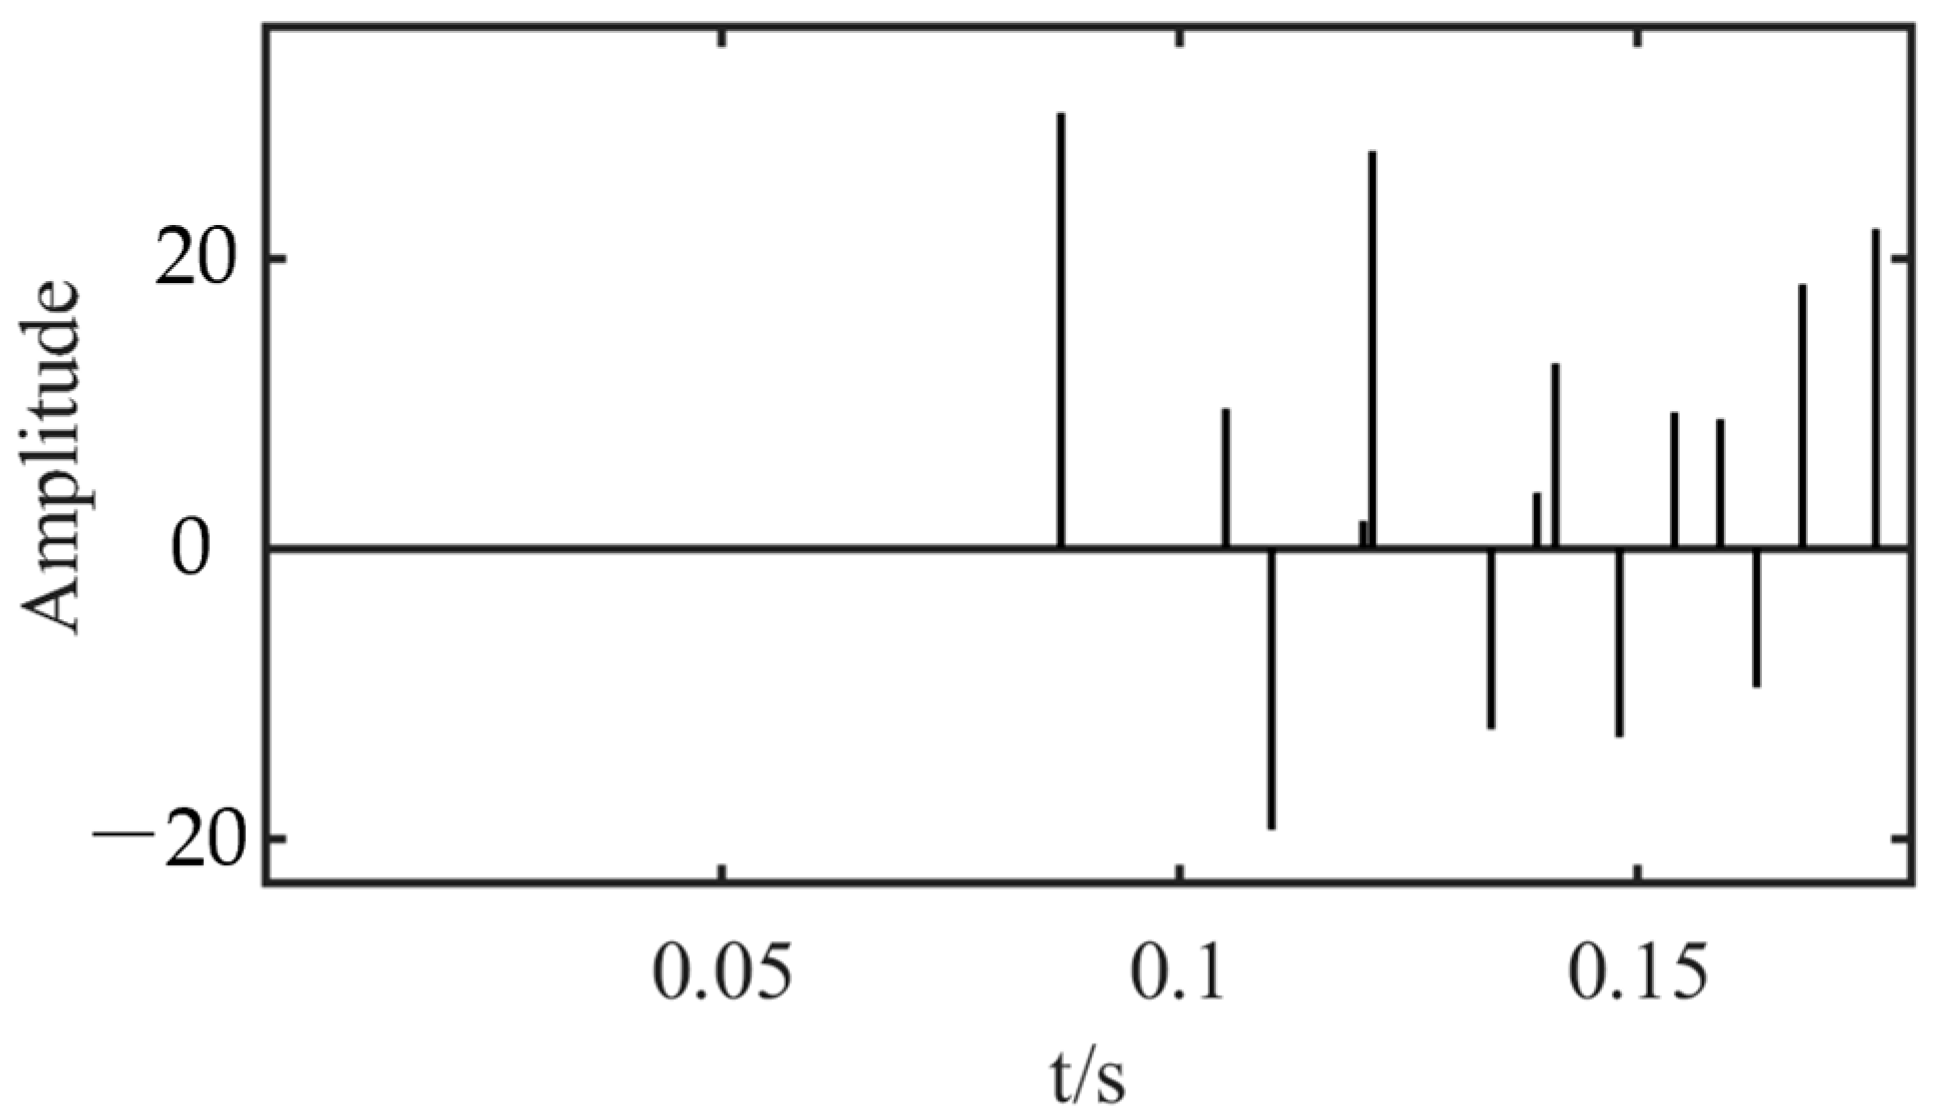
In the equation, n = i = 1 , 2 , , M 1 , M is the discrete index corresponding to the maximum two-way travel time t max . All other positions without reflection coefficients are filled with zeros. The reflection Coefficient Values are shown in Figure 2.
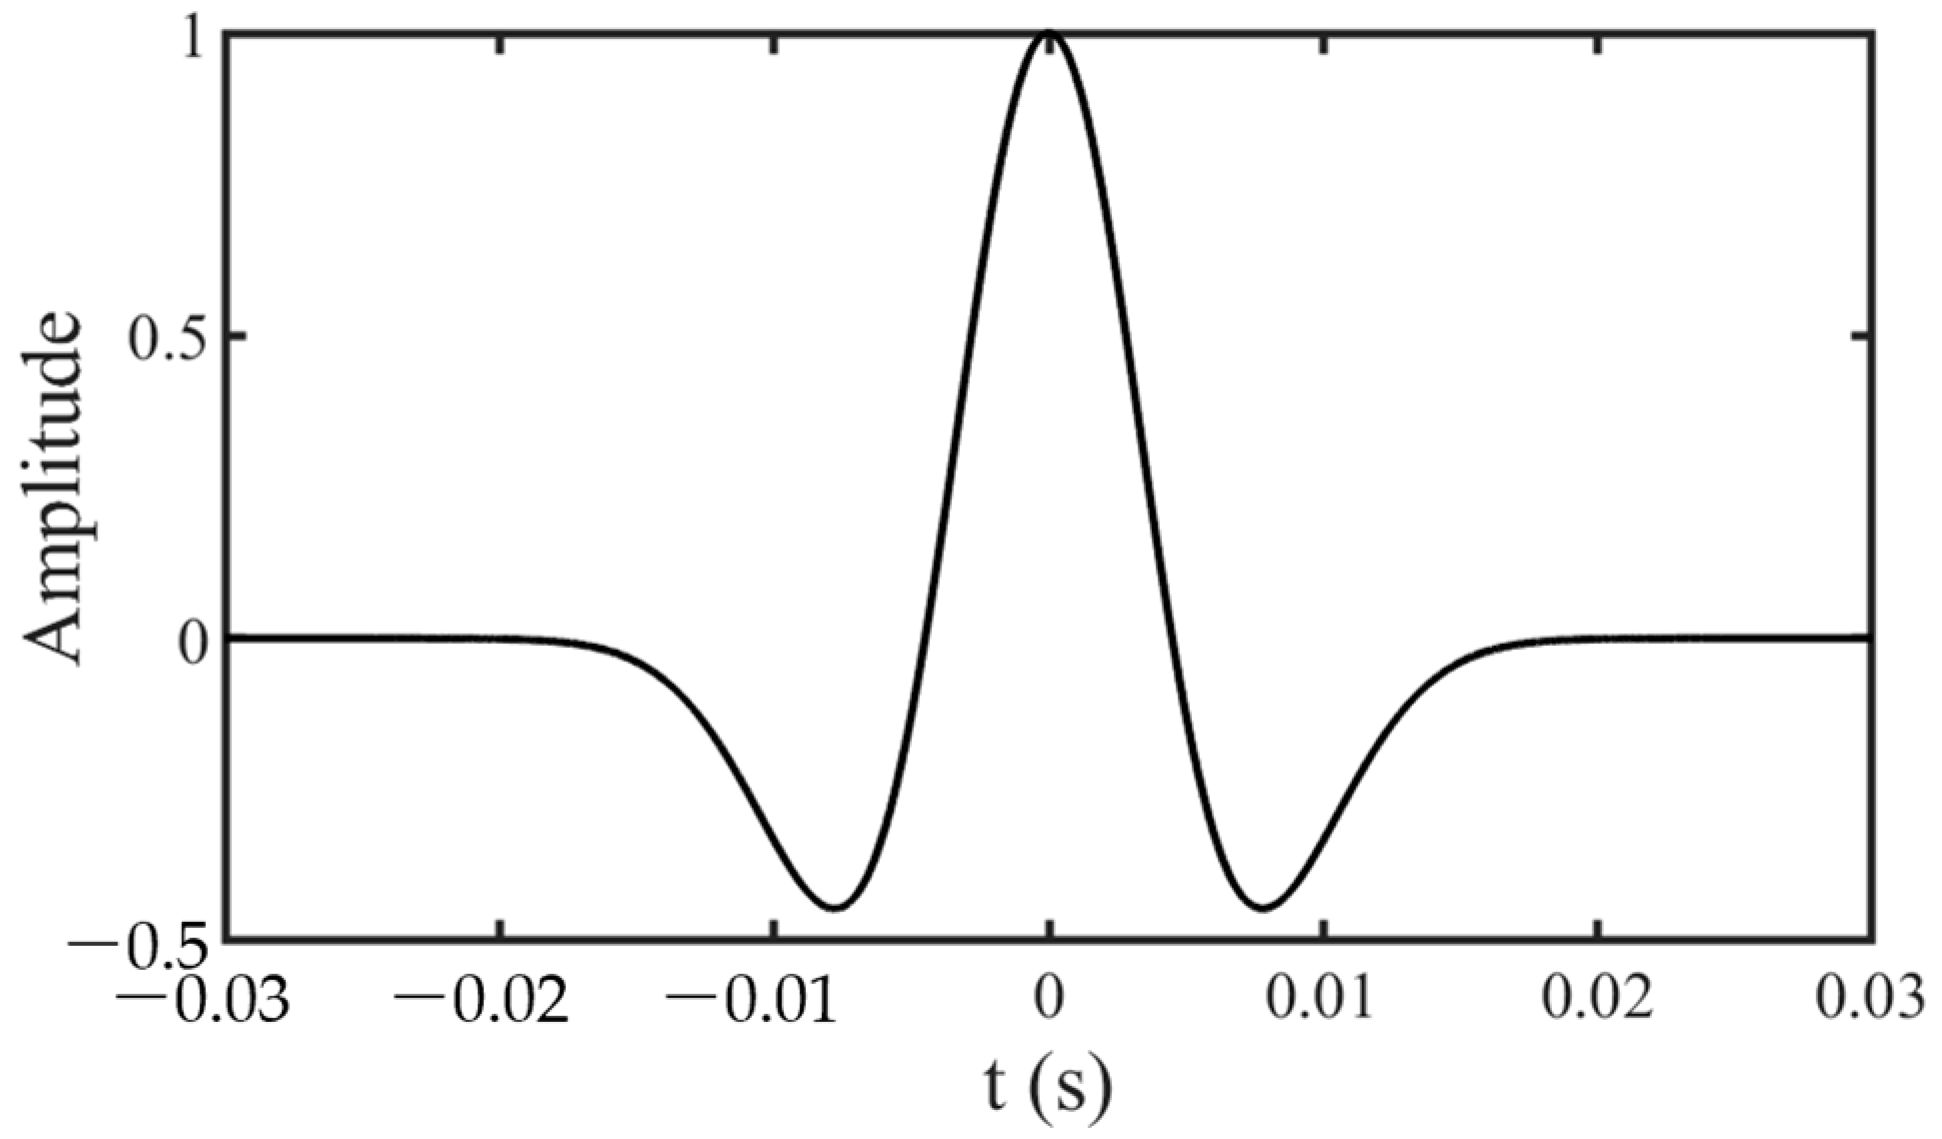
A Ricker wavelet with a central frequency of 50 Hz is designed as the seismic wavelet [39], as shown in Figure 3. Its mathematical expression is given by:
b ( t ) = e ( π f m t ) 2 1 2 ( π f m t ) 2
The reflection coefficient series was calculated using Equation (27), which is convolved with the theoretical wavelet from Equation (28) to generate the synthetic seismic record.
x t = R t b t
The corresponding discrete calculation formula is as follows:
x n = i = 1 L R n 1 · b L
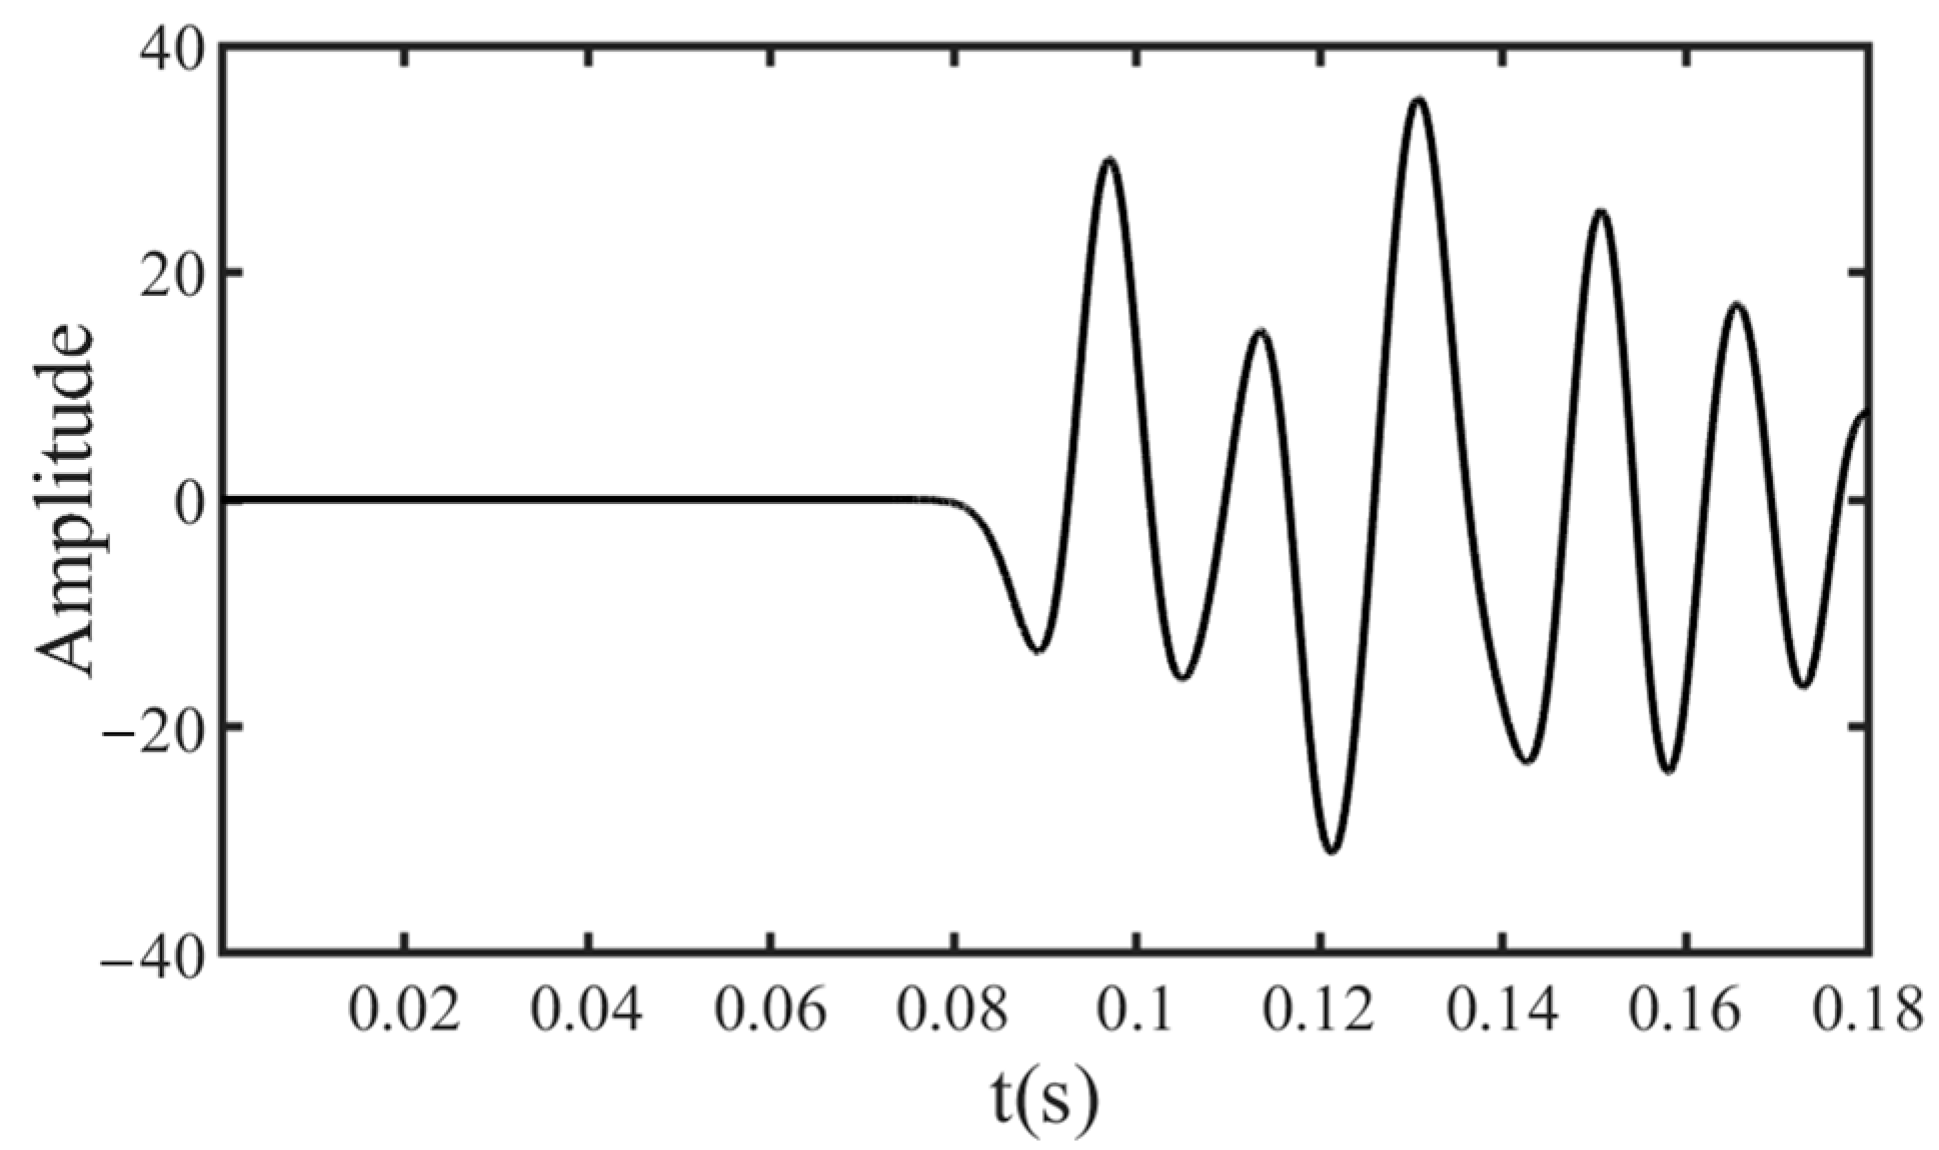
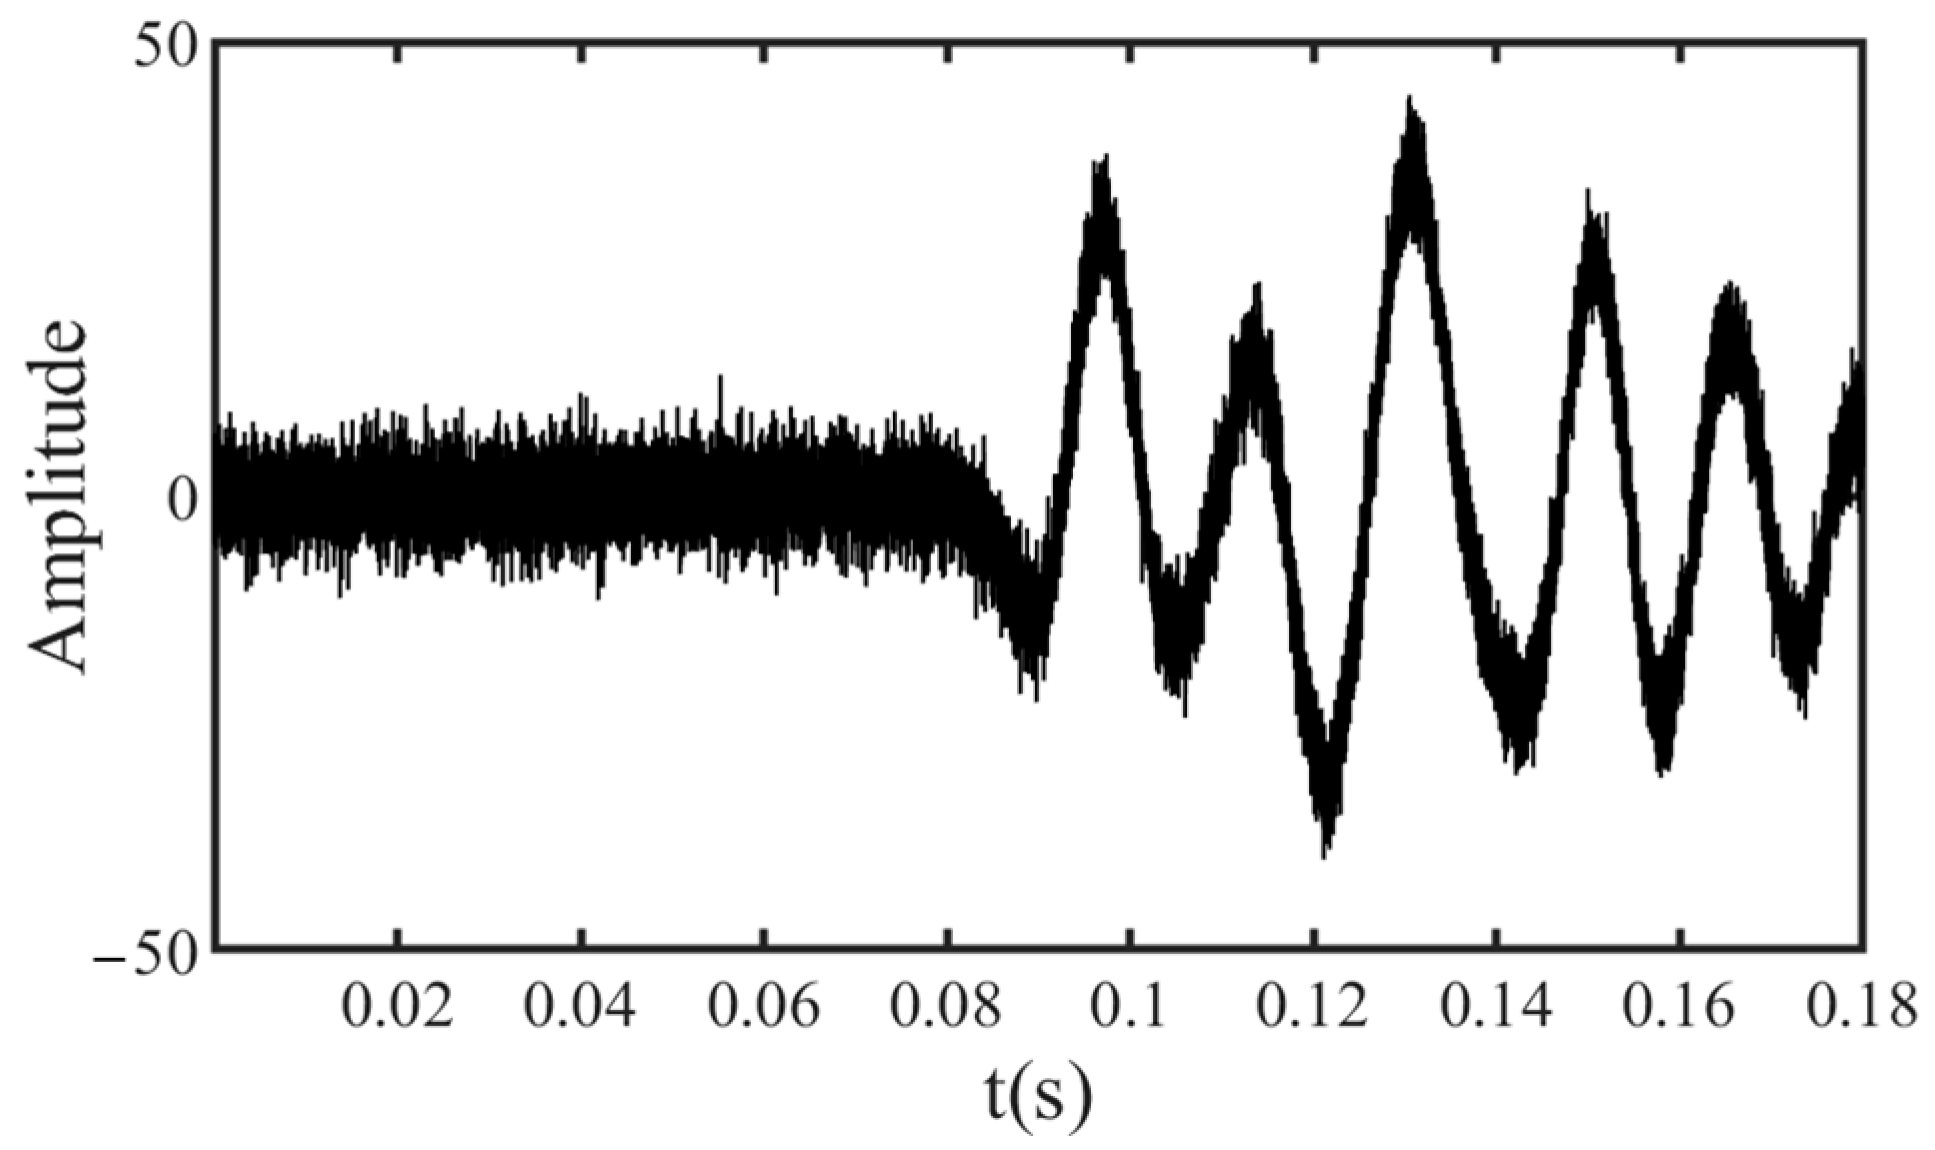
The synthetic seismic signal is obtained by convolving the reflection coefficient series with the seismic wavelet, as shown in Figure 4 [40]. In real-world scenarios, seismic data acquisition is often contaminated by noise. Therefore, random noise is added to the synthetic signal to simulate this condition, and the resulting noisy synthetic seismic signal is shown in Figure 5.
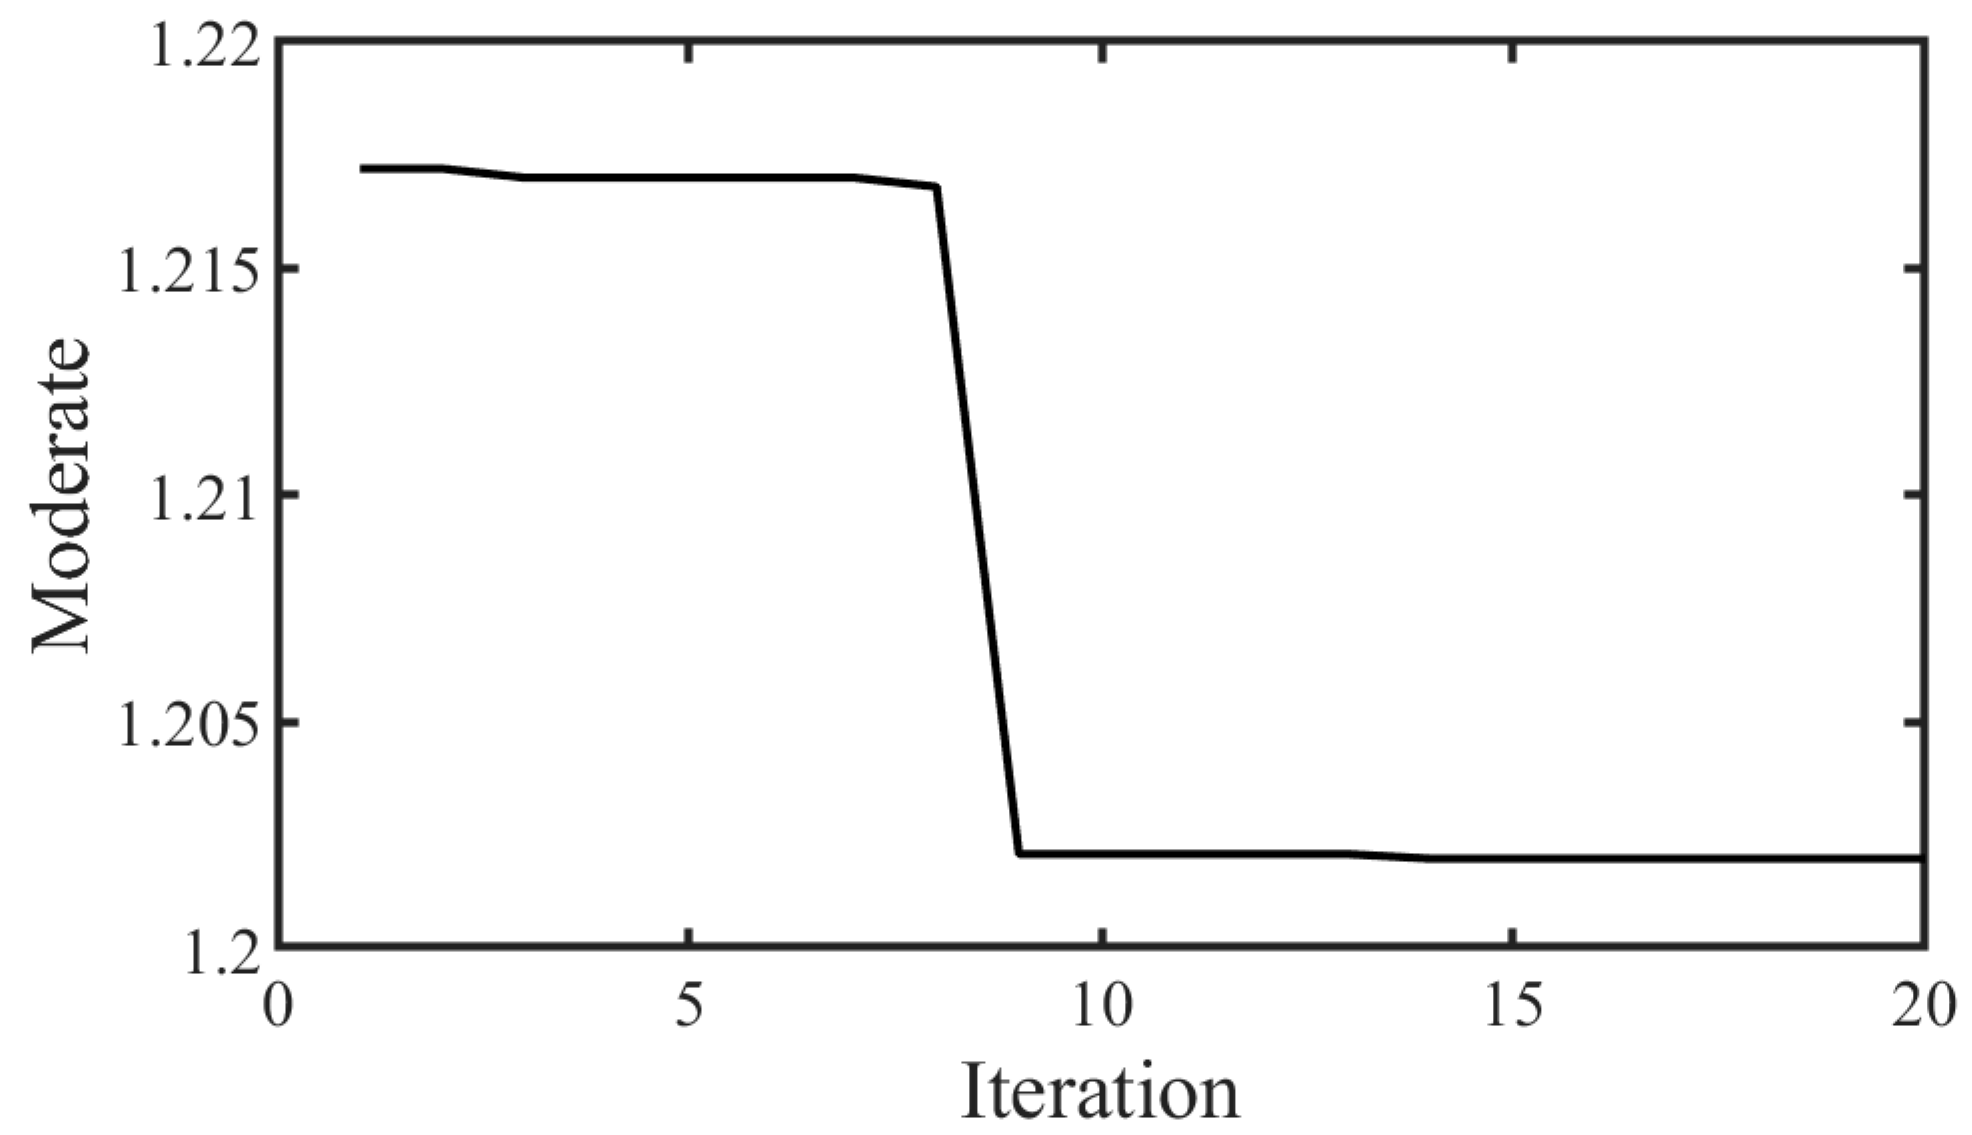
The SFOA optimization algorithm is employed to search for the optimal parameter combination for VMD to process the noisy synthetic signal. Using minimum envelope entropy as the fitness function, the curve of fitness values versus iteration number is shown in Figure 6. It can be observed that the fitness value decreases multiple times during the iterations, reaching its minimum at the 14-th iteration. At this point, the corresponding mode number k and penalty factor α constitute the optimal parameter combination.
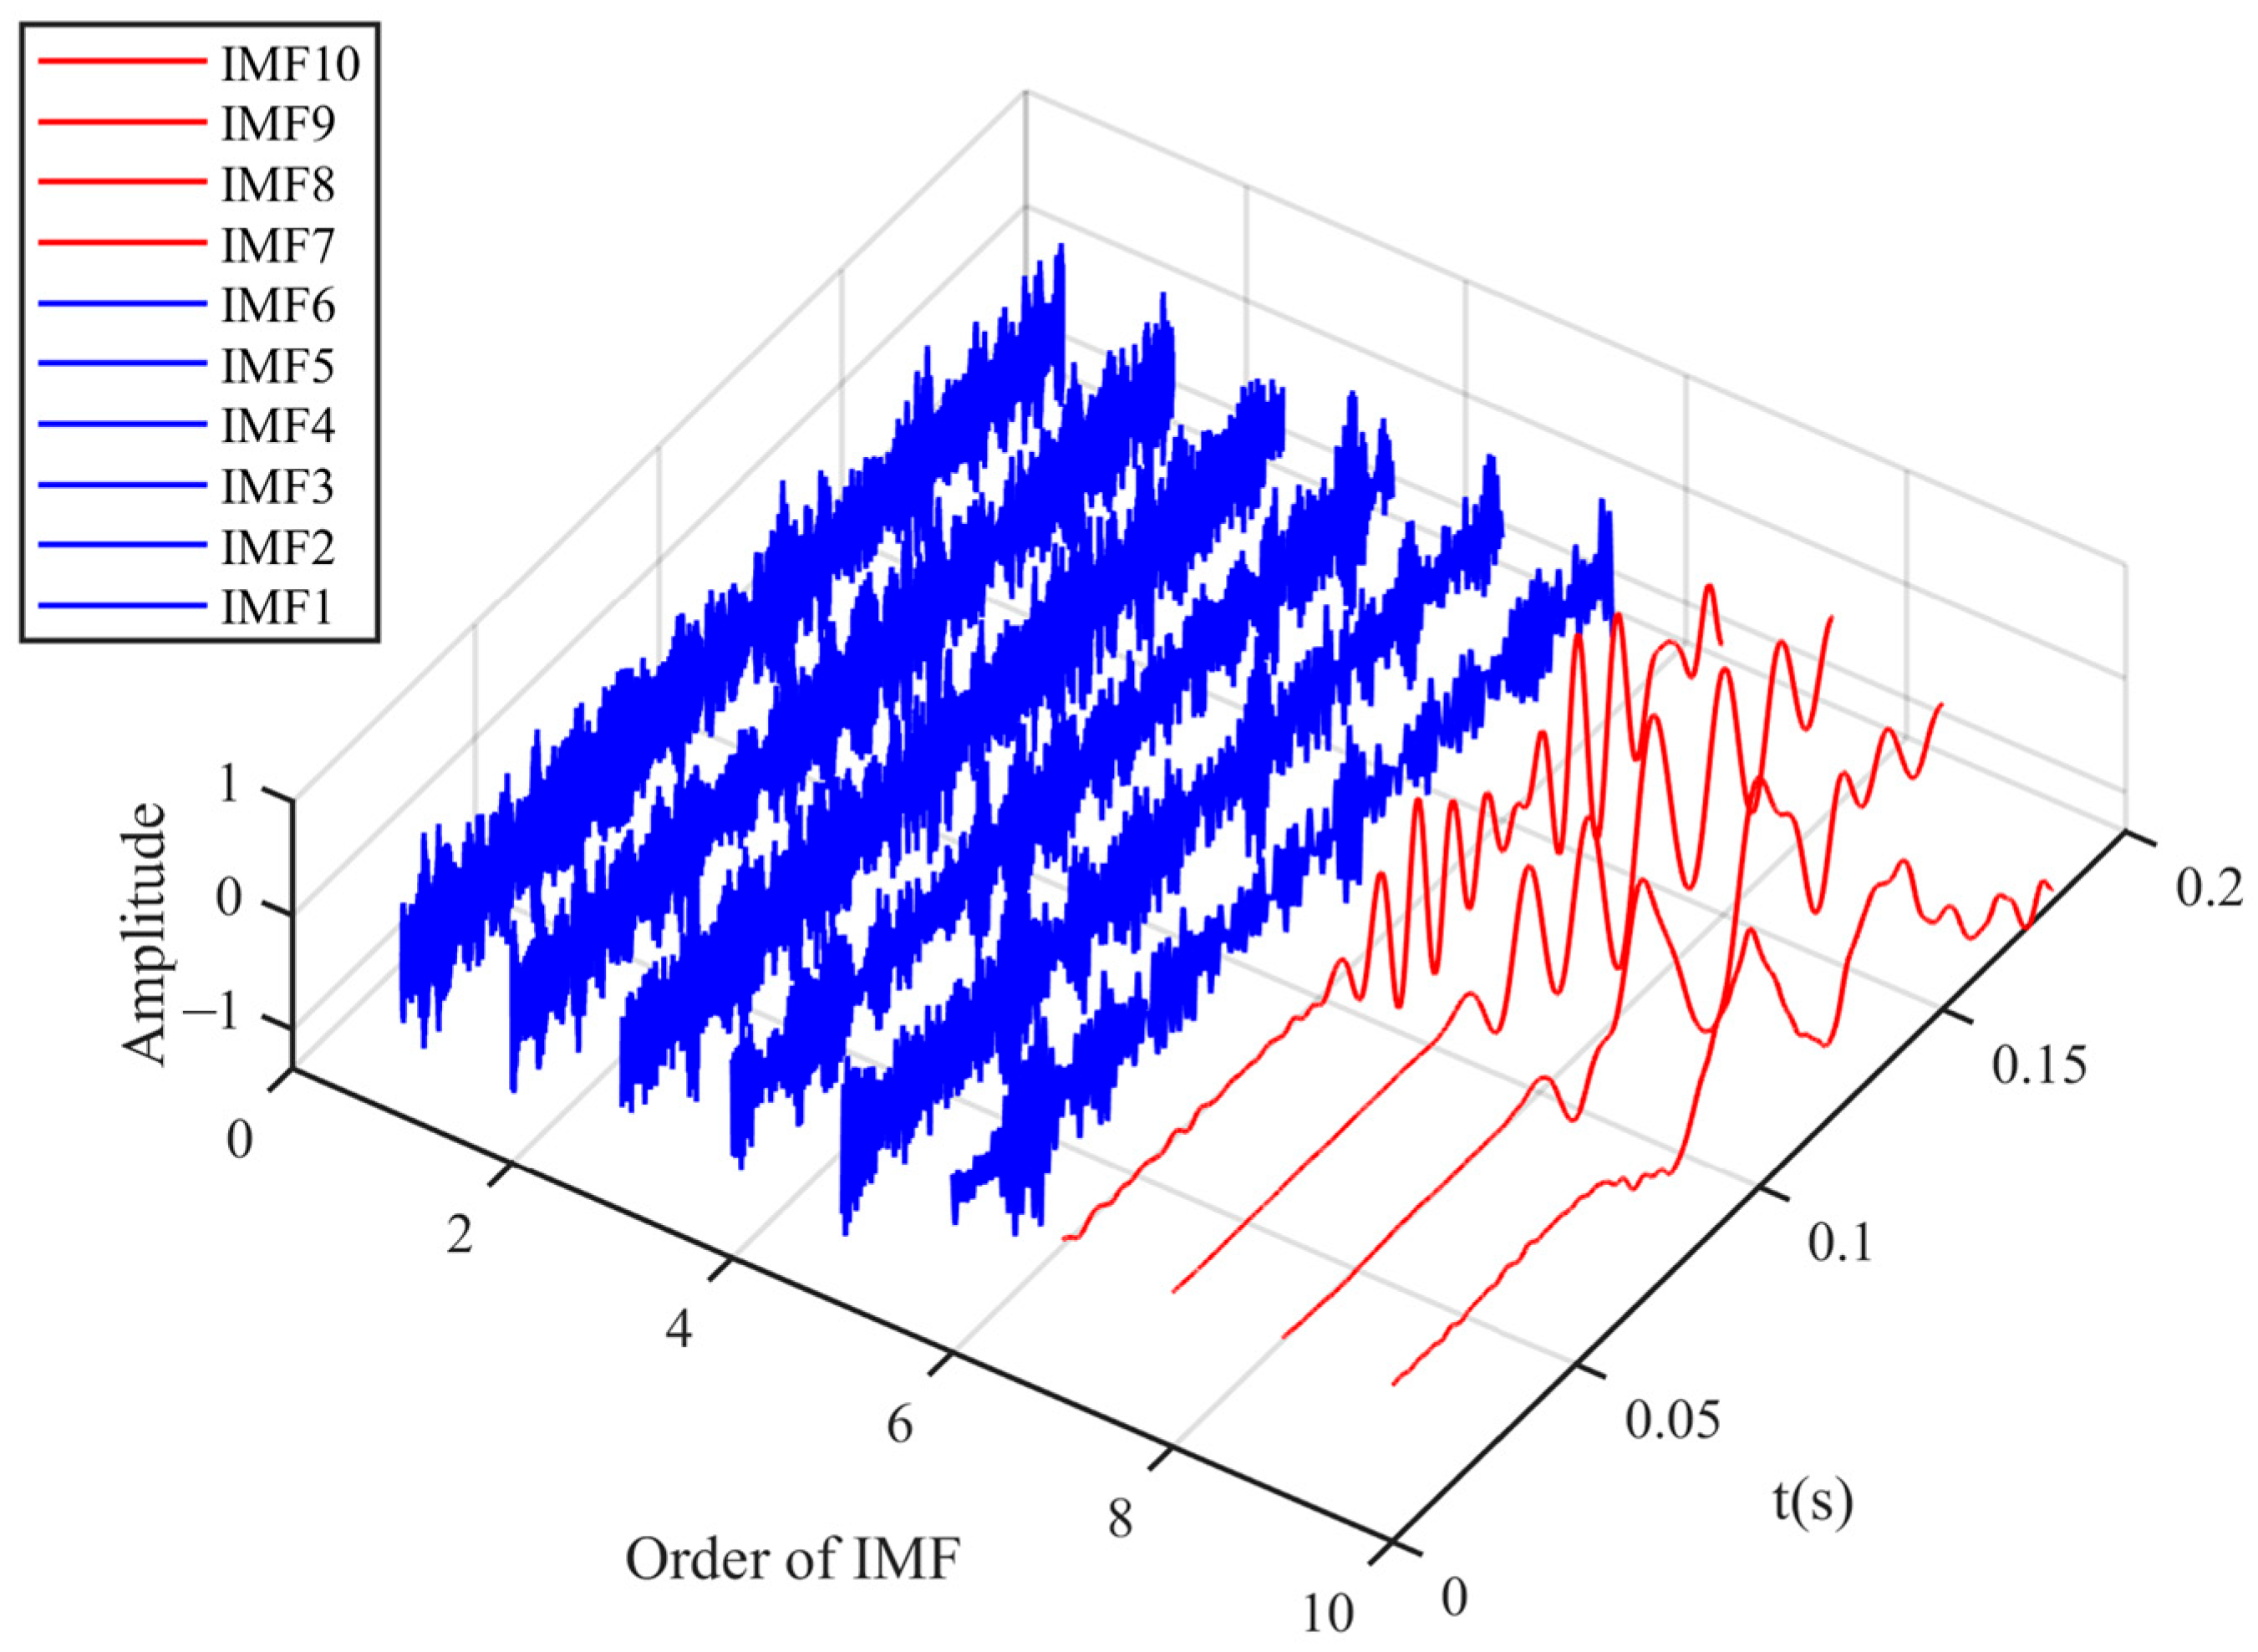
Using the optimal parameters, the noisy synthetic signal is decomposed via VMD, and the resulting modal components are shown in Figure 6. As observed in Figure 7, the IMF components gradually transition from smooth and simple waveforms to more fluctuating and complex patterns through the VMD process. Calculate the correlation coefficient between it and the original signal using the following formula:
ρ X , Y = E X Y E X E Y E X 2 E 2 X E Y 2 E 2 Y
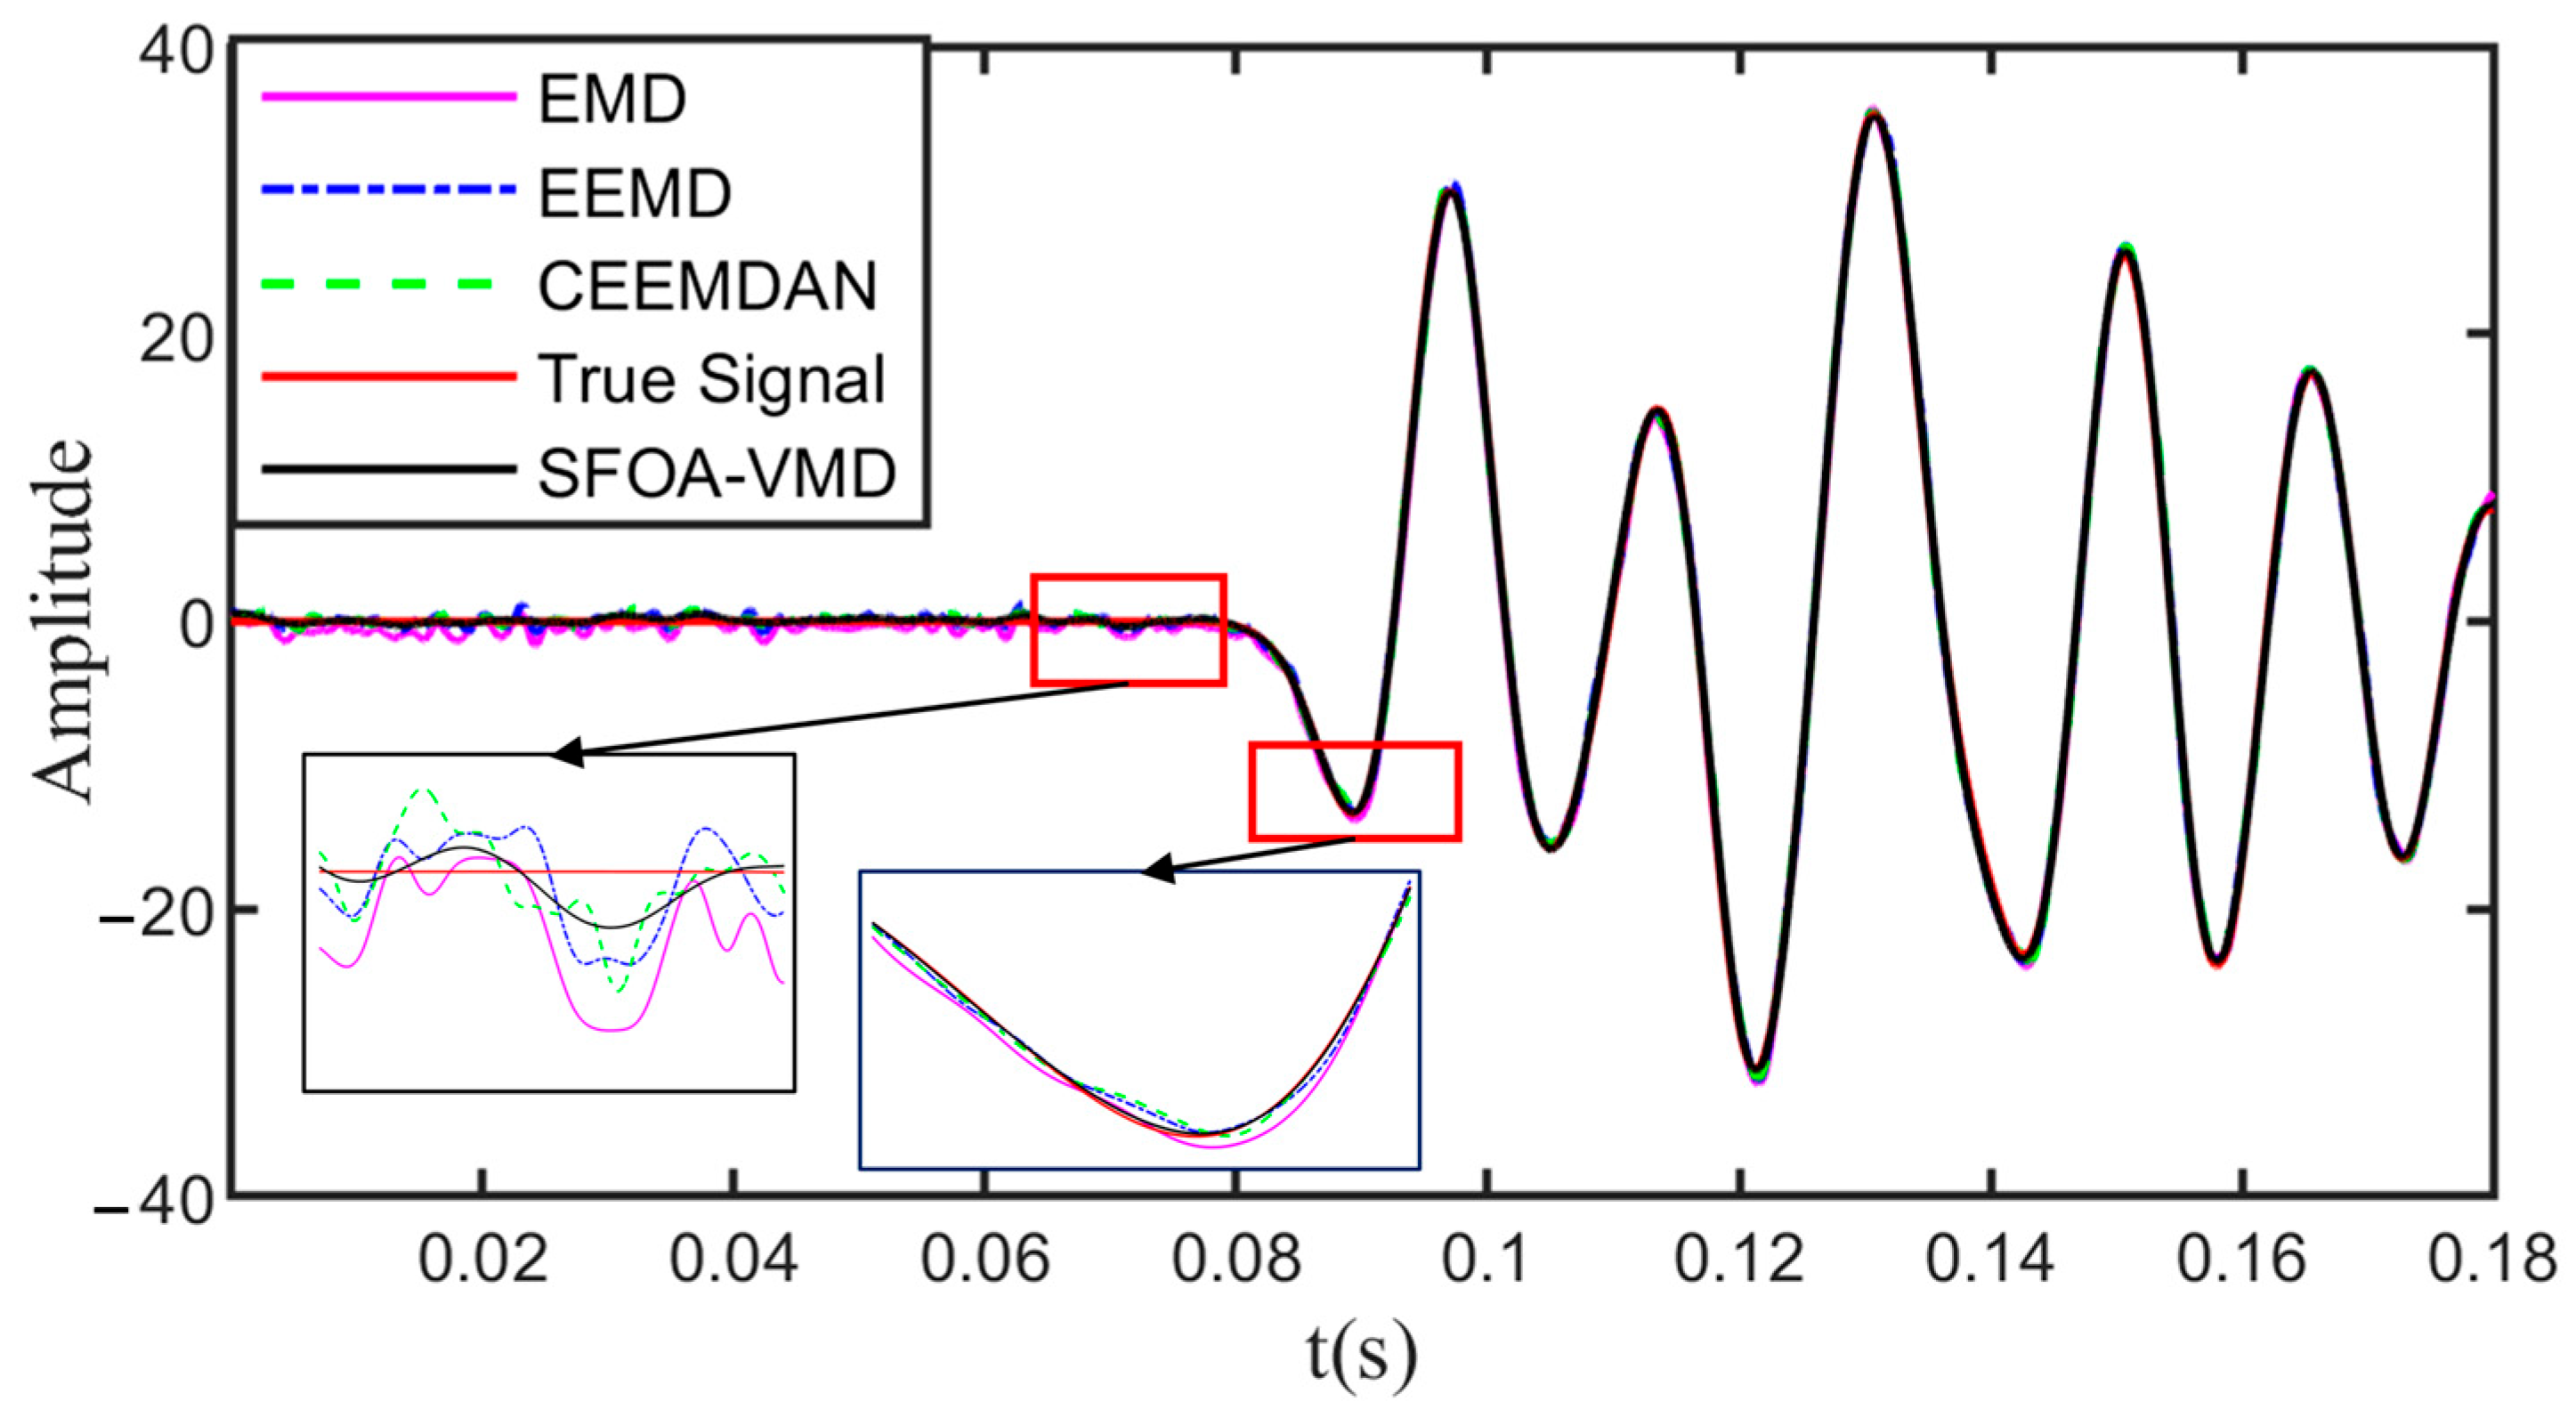
The correlation coefficients between each IMF and the noisy synthetic signal are listed in Table 1. As shown in Table 1, the correlation coefficients of IMF1, IMF2, and IMF3 are all greater than 0.1. These components are retained as effective signals and used for data reconstruction. The denoising results, compared with other methods, such as Empirical Mode Decomposition (EMD), Ensemble Empirical Mode Decomposition (EEMD) and Complete Ensemble Empirical Mode Decomposition with Adaptive Noise (CEEMDAN), are presented in Figure 8, and the evaluation metrics comparison is listed in Table 2.
As shown in Figure 8, the superior denoising performance of the proposed SFOA-VMD method can be physically interpreted through its adaptive matching of decomposition modes to the intrinsic oscillatory scales of seismic signals. By optimizing both the mode number K and the penalty factor α, SFOA ensures that effective seismic components are concentrated into distinct intrinsic mode functions (IMFs), whereas random noise—which lacks coherent oscillatory structure—is isolated within residual modes. Consequently, in noise-dominated portions of the record, the reconstructed signal exhibits improved stability, as the algorithm suppresses spurious modes caused by suboptimal parameter selection. In signal-rich regions, the preservation of peak amplitudes demonstrates the capability of VMD with optimized parameters to capture the resonant frequencies of subsurface reflections, thereby maintaining the physical integrity of seismic wave propagation characteristics. In the early portion of the signal where no effective signal is present, the denoising result of the proposed method exhibits smaller fluctuations compared to other methods, indicating stronger noise suppression and greater stability. In the region containing the effective signal, the proposed method better preserves the energy of the peak signals, thereby maintaining the key features of the useful signal more effectively. As shown in Table 2, the denoising results obtained by the proposed method demonstrate improvements in both SNR and NCC compared to other methods, while RMSE and RRMSE values are correspondingly reduced. These results indicate that the proposed approach achieves superior denoising performance, effectively maintaining signal stability in noise-free regions and preserving the integrity of peak signal components.

4.2. Field Data Test

The field data in this study were acquired from the Hexingchang–Xinsheng area, where the Xujiahe Formation shows significant exploration potential. However, current seismic data quality falls short of meeting the demands for efficient development. Geologically, thick sandstone reservoirs can be subdivided into multiple thin interlayers based on thin-bed characteristics, and horizontal wells must target one of these thin layers as the development window. Due to poor internal reflectivity in the existing seismic data, neither pre-stack nor post-stack inversion can effectively identify these thin interbeds. Therefore, it is essential to enhance vertical resolution to meet the requirements for thin interlayer identification.
To gain a deeper understanding of the complex near-surface structural characteristics in mountainous terrain and to clarify the stratigraphic and lithologic variations in the study area, a high-resolution, high-density, and high-sampling-rate near-surface survey was conducted. During the drilling process, energy generated by the drilling rig was utilized as the seismic source. By optimizing the surface observation layout, high-precision and high-density acquisition of while-drilling seismic data was achieved. Denoising tests conducted on real high-sampling-rate while-drilling data further validate the effectiveness of the proposed method in seismic data processing. The data were acquired from signals generated by the drill bit cutting through rock formations and were recorded using high-sampling-rate geophones, with a sampling rate of 106 Hz.
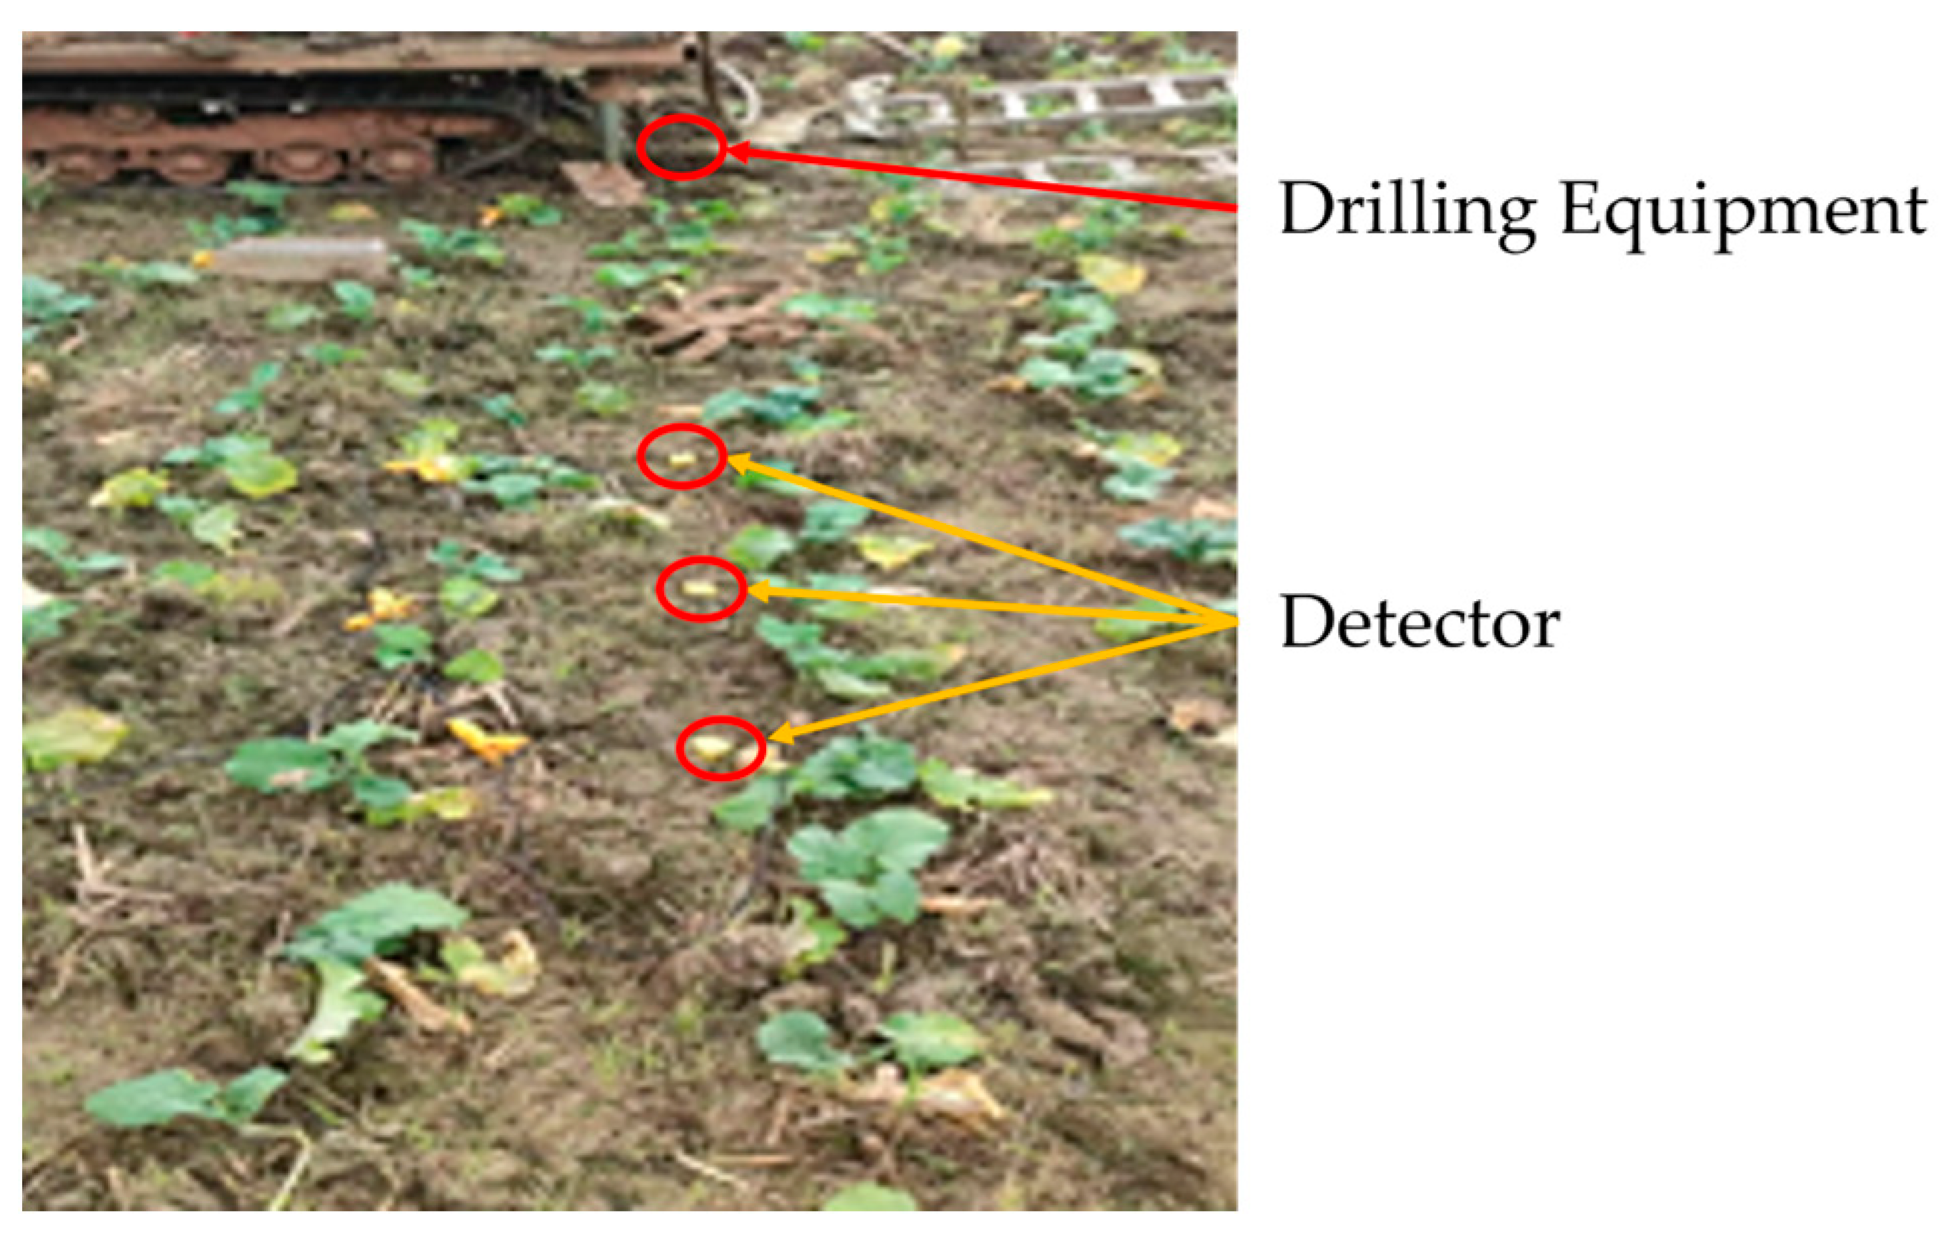
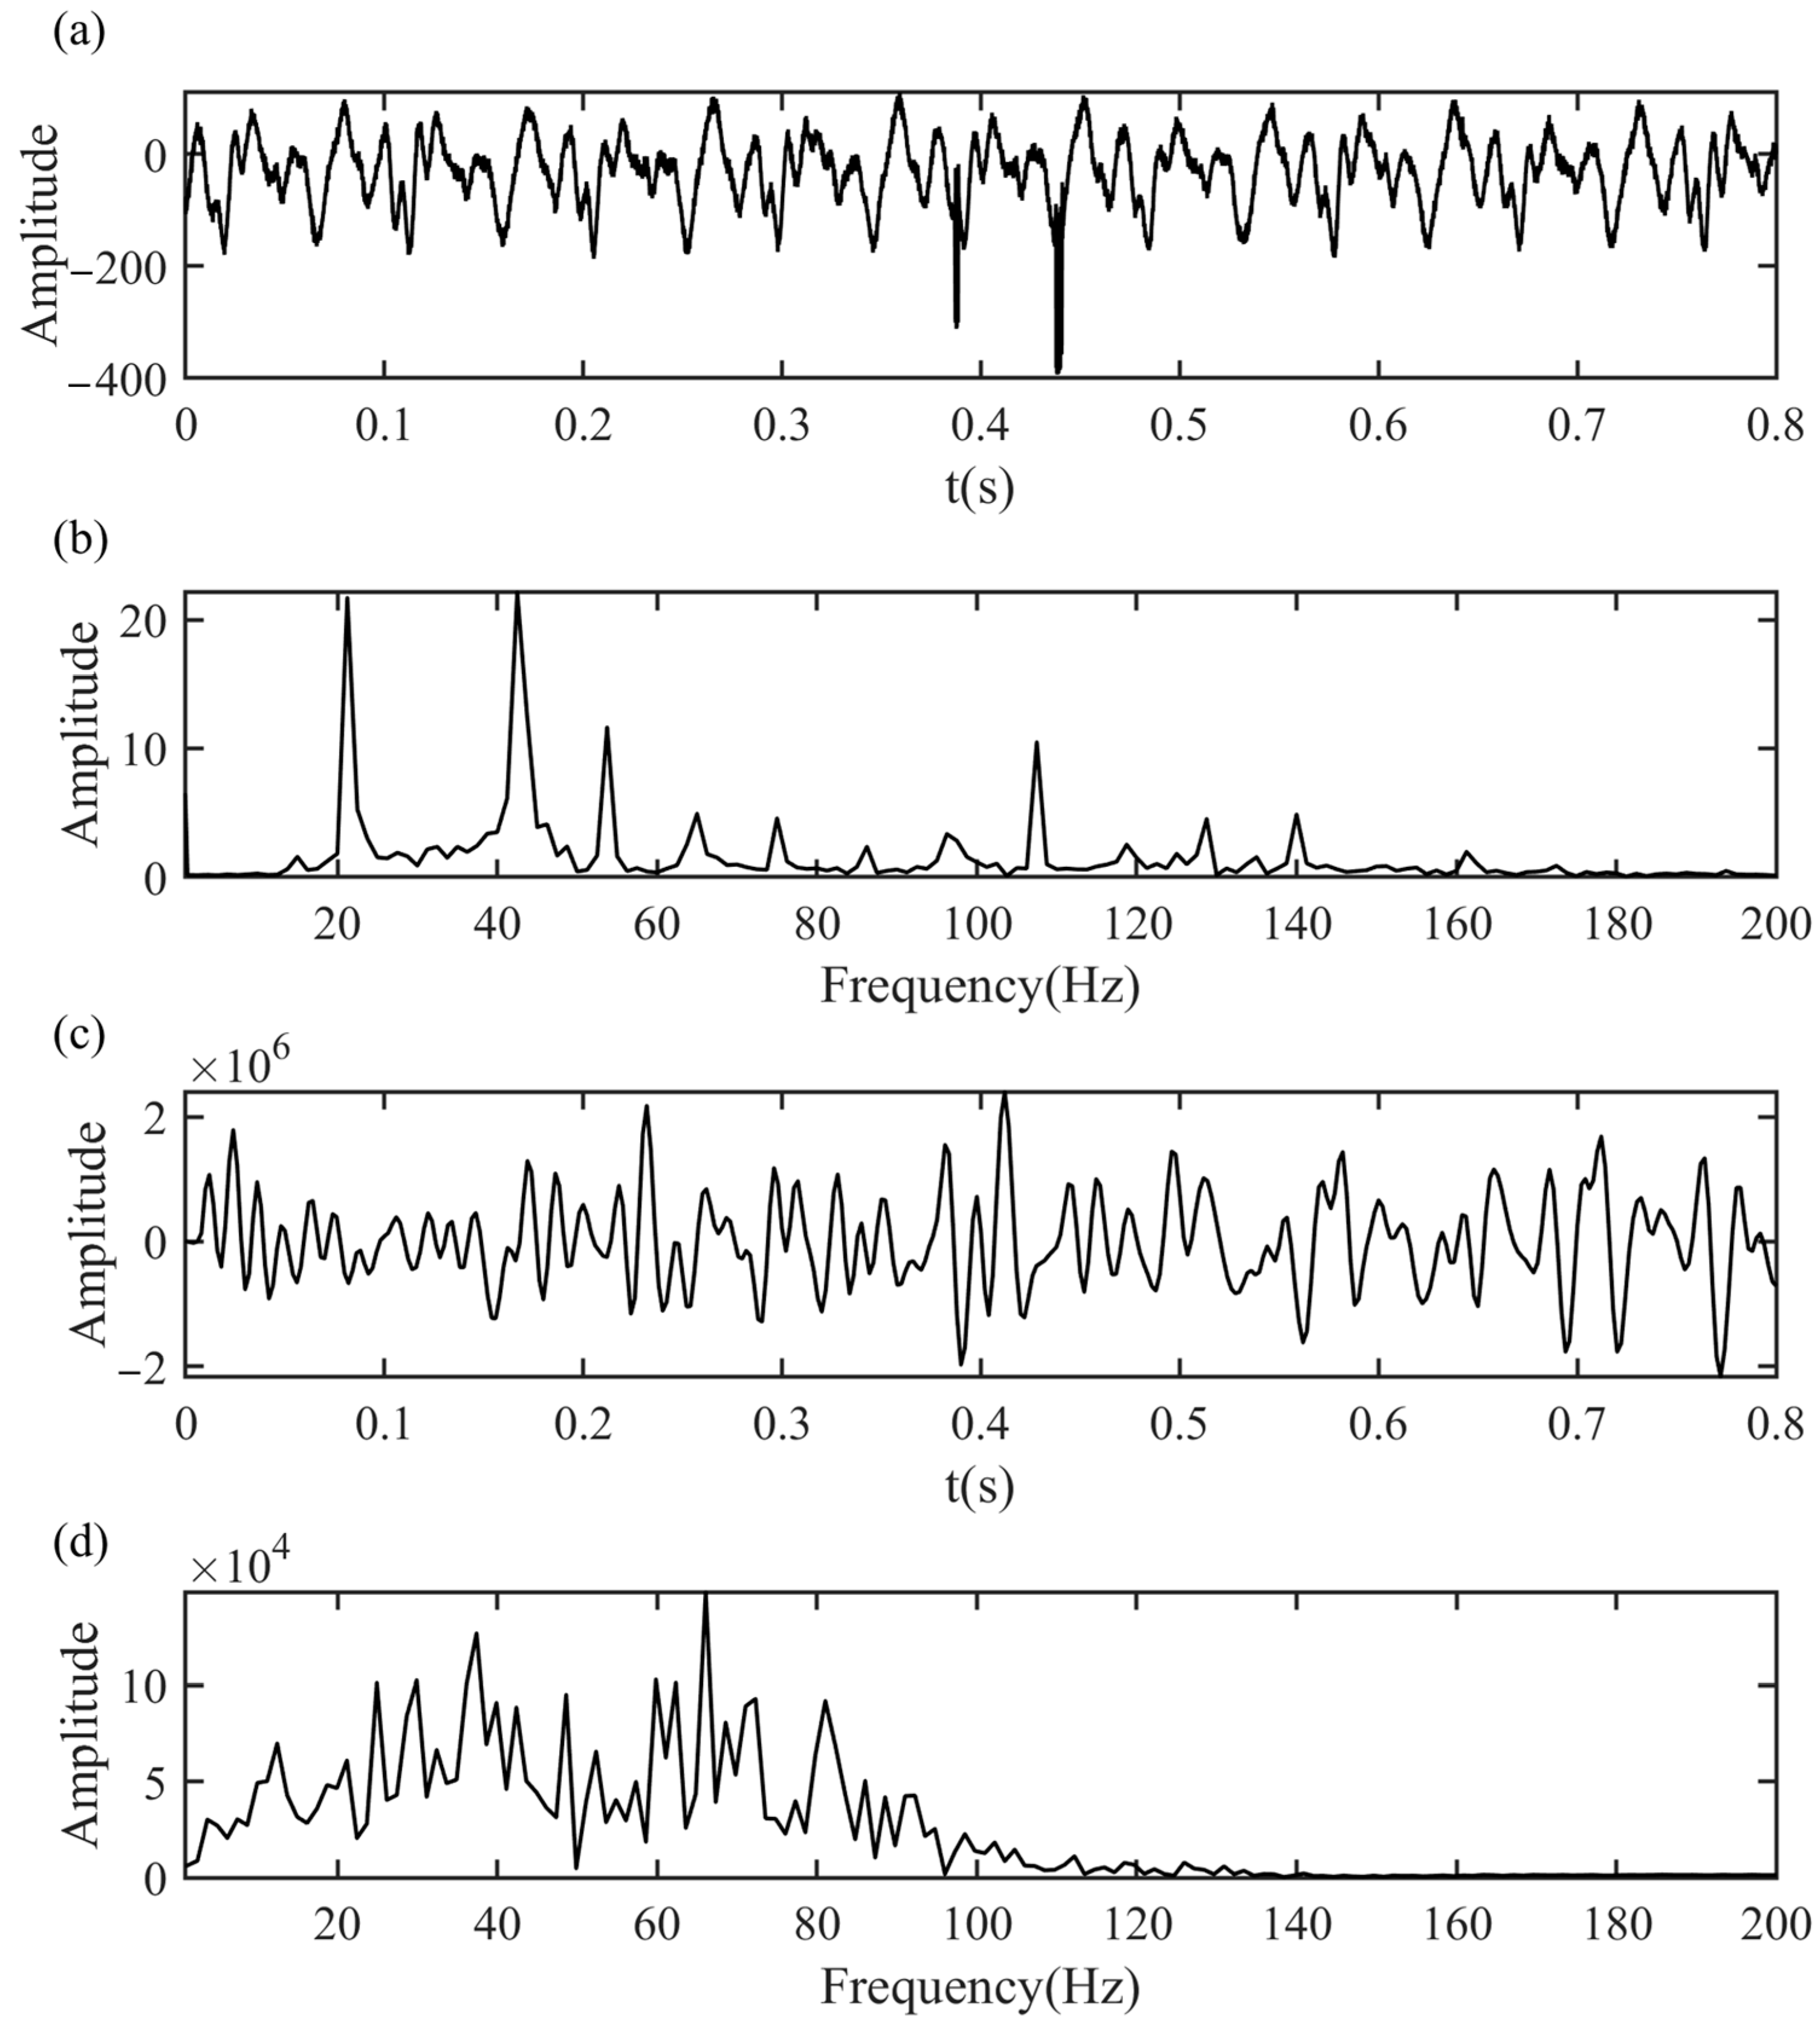
Figure 9 shows the field data acquisition site and schematic layout. The drilling rig acts as the seismic source, while geophones with a sampling rate of 1 MHz are deployed on the surface in a high-density array. The schematic diagram illustrates the positions of the drilling rig, geophone array, and seismic recording system to ensure the reproducibility of the acquisition setup. The recorded signal is shown in Figure 10a; the total duration of the record is 2 s, containing 2 × 10⁶ sampling points, with a sampling frequency of 1 × 10⁶ Hz. Its frequency spectrum is displayed in Figure 10b. For comparison, a conventional seismic signal is shown in Figure 10c, with its corresponding frequency spectrum in Figure 10d. The comparison reveals that, due to the high sampling rate, while-drilling signals offer significantly higher resolution in both the time and frequency domains. Their frequency content is more concentrated, and the overall frequency range is broader than that of conventional seismic signals. The conventional seismic data were processed using a conventional workflow including band-pass filtering (10–80 Hz), amplitude recovery, velocity analysis, normal moveout (NMO) correction, and stacking. While these steps are effective for suppressing random noise and enhancing coherent reflections in deep targets, the relatively low sampling rate and narrow frequency band limit their ability to capture high-frequency components. As a result, the vertical resolution of conventional seismic data is reduced, making it difficult to accurately delineate thin interlayers and shallow stratigraphic variations. In contrast, the high-sampling-rate while-drilling data combined with the proposed SFOA-VMD denoising method provide much finer resolution, enabling clearer identification of lithological boundaries and low-velocity zones.
The actual signal decomposition process is illustrated in Figure 11, and the correlation coefficients between each IMF and the original data are listed in Table 3. IMFs with correlation coefficients greater than 0.1—specifically, IMF8, IMF9, and IMF10—are identified as effective components and retained for signal reconstruction.
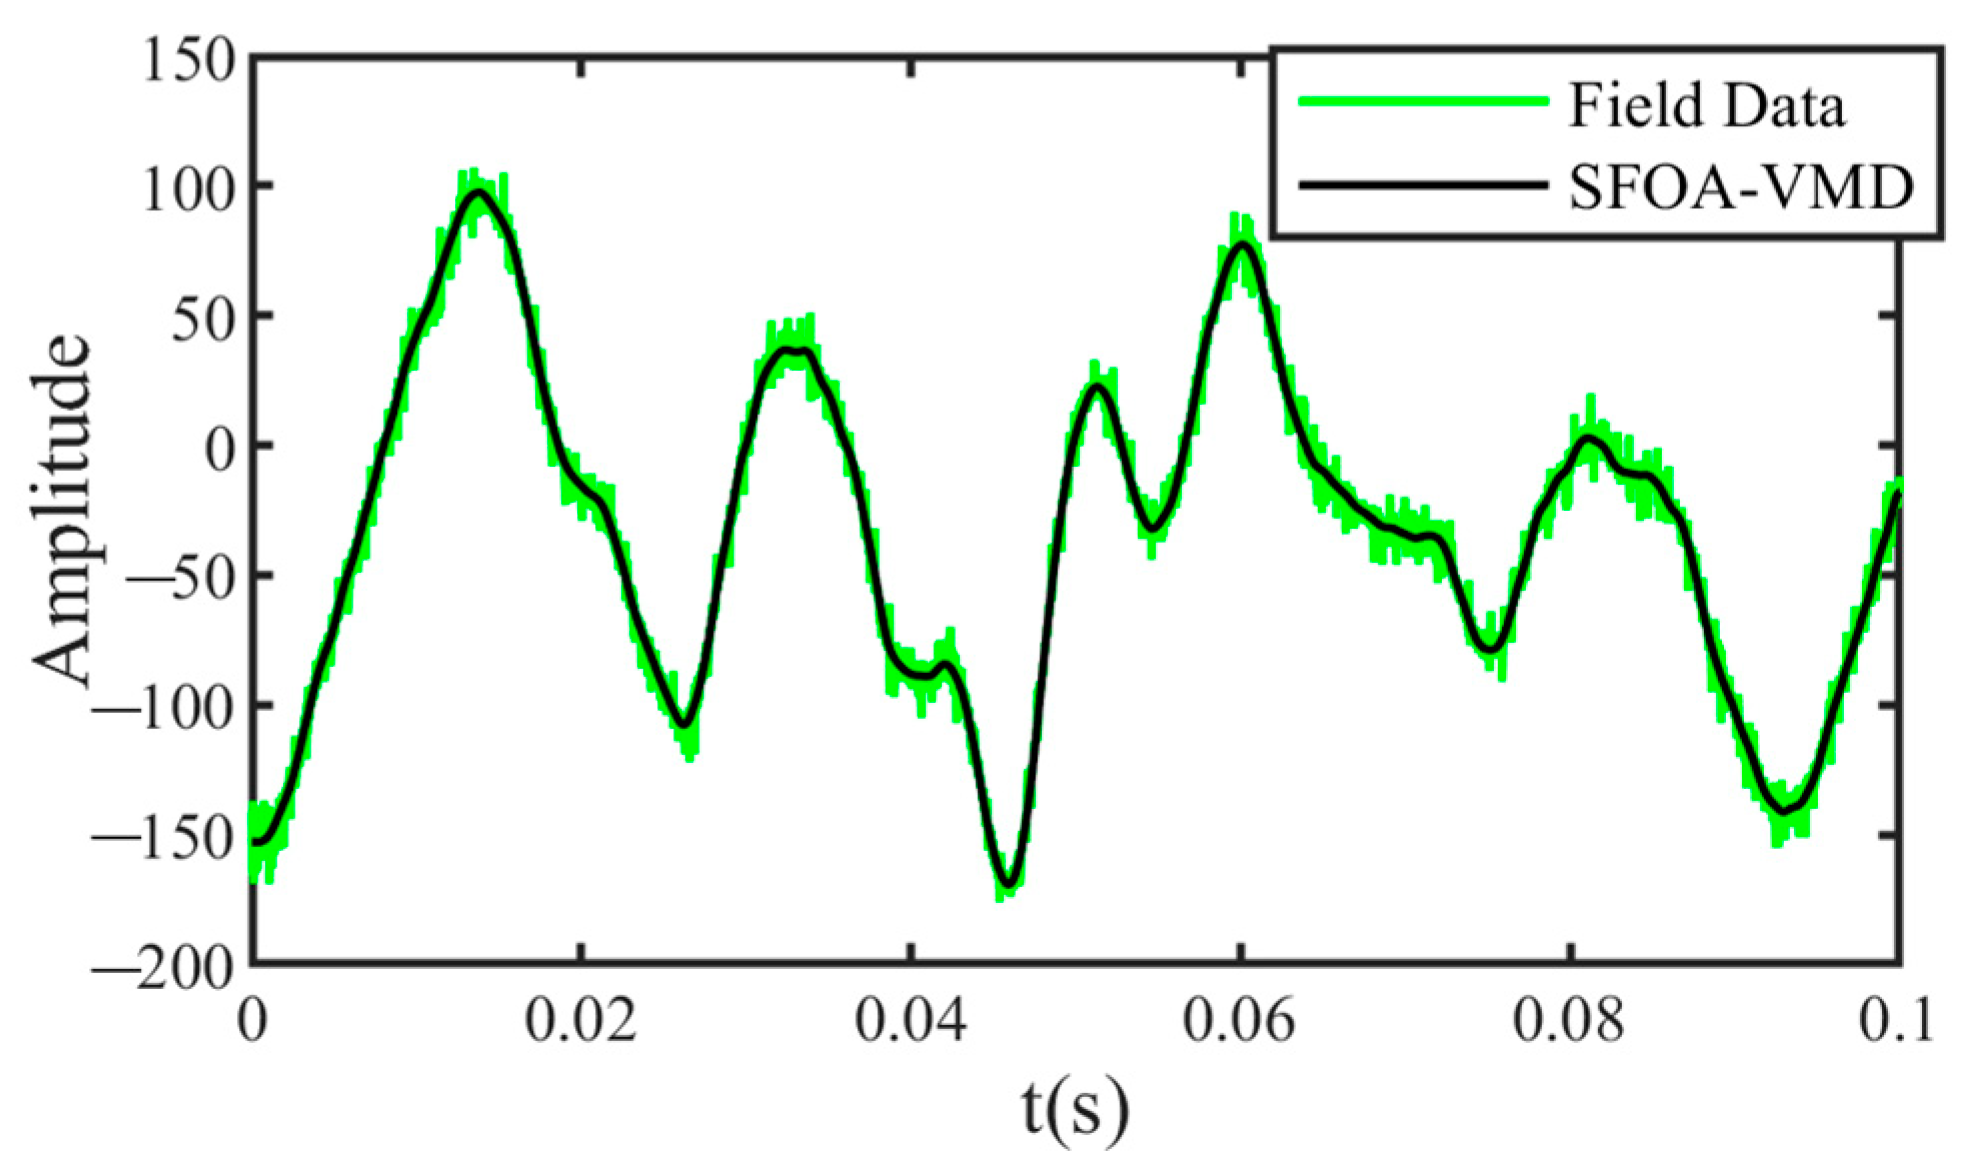
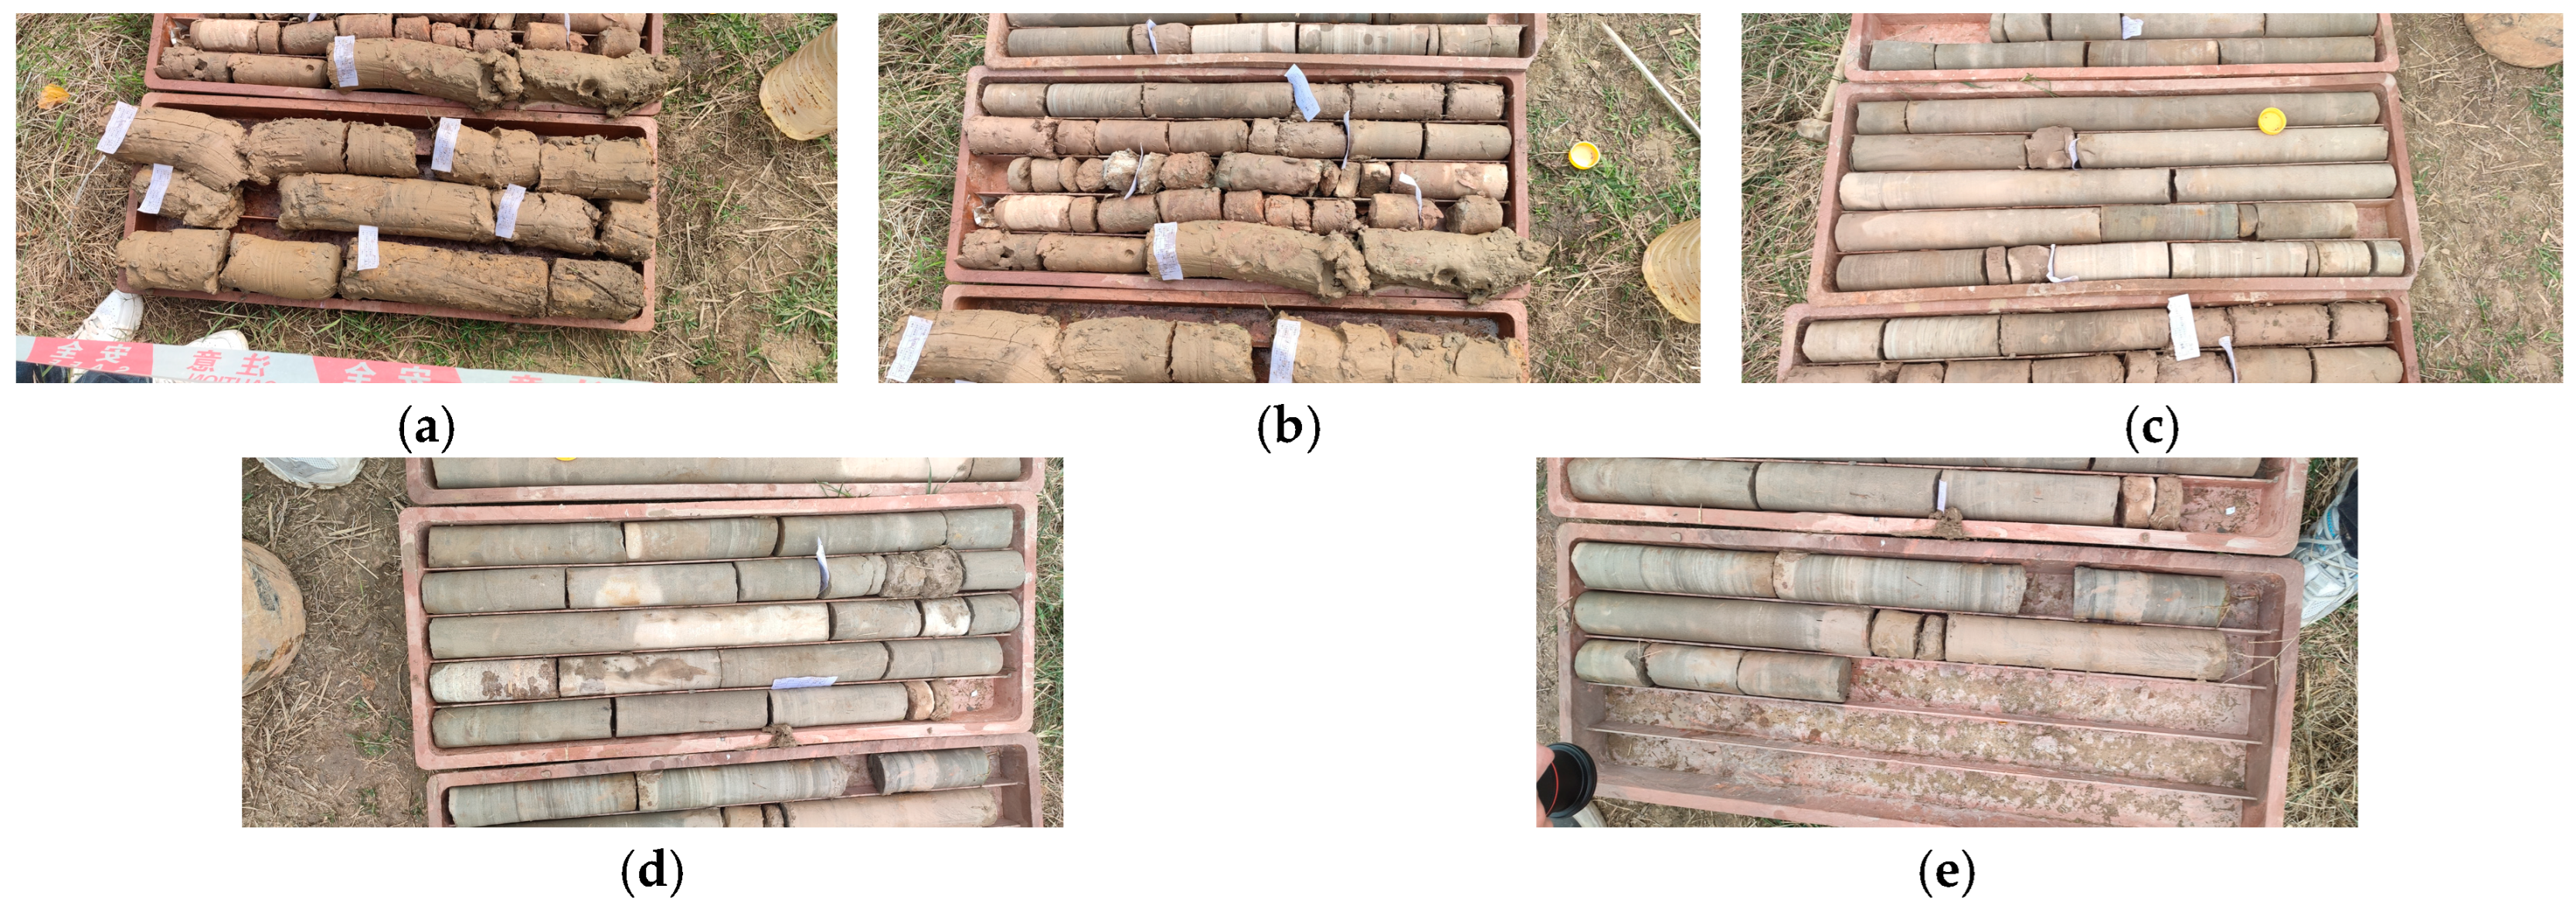
The comparison between the denoised signal and the original signal is shown in Figure 12. As observed, the original signal (in green) is heavily contaminated by random noise, which obscures the effective seismic reflections. After applying the proposed method, the waveform becomes significantly clearer, and the peak amplitudes are largely preserved, effectively enhancing the visibility of detailed waveform features. The processed data are further compared with actual core samples in Figure 13. The results demonstrate that lithological variations are well reflected in the waveform characteristics of the processed signal, with clear transitions at acoustic impedance boundaries. This confirms that the denoised while-drilling signal provides reliable indications of stratigraphic boundaries. The core samples acquired during drilling are presented in Figure 14. For the field drilling-while-drilling data, the clearer alignment between denoised waveforms and stratigraphic boundaries can be explained by the suppression of incoherent surface noise and the enhanced retention of coherent reflection events. High-frequency random noise typically exhibits broadband and uncorrelated characteristics, whereas genuine seismic reflections demonstrate consistent phase relationships corresponding to acoustic impedance contrasts. By preserving intrinsic mode functions (IMFs) with high correlation coefficients, the proposed method preferentially retains components that correspond physically to reflections from low-velocity zones and lithological interfaces. Consequently, the improved correspondence between the denoised waveforms and core observations can be attributed to the algorithm’s ability to distinguish physically meaningful seismic energy from stochastic interference, thereby improving stratigraphic resolution.

5. Conclusions

To address the denoising problem of high-density, high-frequency seismic signals, this paper proposes a denoising method for high-sampling-rate seismic data based on the Starfish Optimization Algorithm (SFOA) and Variational Mode Decomposition (VMD). Aimed at mitigating the interference of random noise in seismic data interpretation, the proposed method leverages the characteristics of high-sampling-rate seismic records by applying Variational Mode Decomposition (VMD) with parameters optimized via the Starfish Optimization Algorithm (SFOA). The seismic signal is decomposed into a set of Intrinsic Mode Functions (IMFs), and the correlation coefficient between each IMF and the original signal is calculated. IMFs with correlation coefficients less than 0.1 are regarded as random noise and discarded, while those with correlation coefficients greater than 0.1 are retained and used to reconstruct the denoised seismic signal. Compared with VMD parameter optimization methods based on GWO, IDBO, and SSA, the proposed SFOA-VMD approach exhibits more distinct advantages. Specifically, SFOA avoids the local optimum problem common in GWO, converges faster than IDBO, and demonstrates greater stability than SSA when processing large-scale, high-dimensional seismic data. These characteristics allow SFOA to provide more reliable parameter combinations for VMD, thereby ensuring superior denoising performance and more accurate preservation of seismic waveform details. Experimental results demonstrate that the proposed method outperforms traditional approaches in model-based denoising tests, effectively maintaining signal stability in noise-free regions while preserving the integrity of peak signal components. In real-data tests, the method successfully retains the majority of peak features and accurately captures waveform details, further validating its effectiveness and reliability.

Author Contributions

Conceptualization, X.W. (Xiaoji Wang) and K.L.; Data curation, D.C.; Formal analysis, X.W. (Xiaoji Wang) and G.G.; Funding acquisition, K.L., X.W. (Xiaotao Wen) and D.C.; Investigation, X.W. (Xiaoji Wang) and G.G.; Methodology, X.W. (Xiaoji Wang) and K.L.; Project administration, X.W. (Xiaoji Wang) and K.L.; Resources, K.L., X.W. (Xiaotao Wen) and D.C.; Software, X.W. (Xiaoji Wang) and G.G.; Supervision, K.L. and X.W. (Xiaotao Wen); Validation, X.W. (Xiaoji Wang), K.L., G.G. and X.W. (Xiaotao Wen); Visualization, X.W. (Xiaoji Wang) and K.L.; Writing—original draft, X.W. (Xiaoji Wang) and G.G.; Writing—review and editing, X.W. (Xiaoji Wang), K.L. and X.W. (Xiaotao Wen). All authors have read and agreed to the published version of the manuscript.

Funding

This research received no external funding.

Institutional Review Board Statement

Not applicable.

Informed Consent Statement

Not applicable.

Data Availability Statement

The code and data can be obtained from the Github repository, which is located at https://github.com/wxj-hub-123/SFOA-VMD-denoising, accessed on 30 June 2025.

Conflicts of Interest

Author Dan Chen was employed by the company Materials Branch, PetroChina Southwest Oil & Gasfield Company. The remaining authors declare that the research was conducted in the absence of any commercial or financial relationships that could be construed as a potential conflict of interest.

References

  1. Luo, B. Research and Application Effect of Logging While Drilling Seismic Technology. Ph.D. Thesis, China University of Geosciences, Beijing, China, 2005. [Google Scholar]
  2. Liu, J.; Zhang, P.; Liu, S.; Hu, X.; Zhang, W.; Liu, H.; Cao, Y. Research on Lithology Identification Technology of Logging While Drilling Seismic Based on EEMD and DE-PNN [J/OL]. J. China Coal Soc. 2025, 1–12. [Google Scholar] [CrossRef]
  3. Cao, L. Microseismic Signal Denoising Research Based on Wavelet Threshold and Autoencoder. Master’s Thesis, Dalian University of Technology, Dalian, China, 2022. [Google Scholar] [CrossRef]
  4. Wang, L. Research on Key Technologies of Logging While Drilling Seismic Exploration. Ph.D. Thesis, Ocean University of China, Qingdao, China, 2009. [Google Scholar]
  5. Wu, M. Research and Application of Time-Frequency Analysis of Seismic Data Based on Empirical Mode Decomposition (EMD). Master’s Thesis, Chengdu University of Technology, Chengdu, China, 2020. [Google Scholar] [CrossRef]
  6. Wang, P. Numerical Simulation Study of Logging While Drilling Seismic Wavefield. Master’s Thesis, Institute of Geophysics, China Earthquake Administration, Beijing, China, 2009. [Google Scholar]
  7. Liu, W.; Liu, Y.; Li, S.; Chen, Y. A Review of Variational Mode Decomposition in Seismic Data Analysis. Surv. Geophys. 2022, 44, 323–355. [Google Scholar] [CrossRef]
  8. Xue, Y.J.; Cao, J.X.; Wang, X.J.; Li, Y.X.; Du, J. Recent Developments in Local Wave Decomposition Methods for Understanding Seismic Data: Application to Seismic Interpretation. Surv. Geophys. 2019, 40, 1185–1210. [Google Scholar] [CrossRef]
  9. Huang, N.E.; Shen, Z.; Long, S.R.; Wu, M.C.; Shin, Q.; Zheng, H.H.; Yen, N.C.; Tung, C.C.; Liu, H.H. The Empirical Mode Decomposition and the Hilbert spectrum for nonlinear and non-stationary time series analysis. Proc. Royal Soc. Lond. A 1998, 454, 903–995. [Google Scholar] [CrossRef]
  10. Smith, J.S. The Local Mean Decomposition and Its Application to EEG Perception Data. J. R. Soc. Interface 2005, 2, 443–454. [Google Scholar] [CrossRef] [PubMed]
  11. Wu, Z.; Huang, N.E. Ensemble Empirical Mode Decomposition: A Noise-assisted Data Analysis Method. Adv. Adapt. Data Anal. 2009, 1, 1–41. [Google Scholar] [CrossRef]
  12. Yeh, J.R.; Shieh, J.S.; Huang, N.E. Complementary ensemble empirical mode decomposition: A novel noise enhanced data analysis method. Adv. Adapt. Data Anal. 2010, 2, 135–156. [Google Scholar] [CrossRef]
  13. Torres, M.E.; Colominas, M.A.; Schlotthauer, G.; Flandrin, P. A complete ensemble empirical mode decomposition with adaptive noise. In Proceedings of the 2011 IEEE International Conference on Acoustics, Speech and Signal Processing (ICASSP), Prague, Czech Republic, 22–27 May 2011; pp. 4144–4147. [Google Scholar] [CrossRef]
  14. Dragomiretskiy, K.; Zosso, D. Variational Mode Decomposition. IEEE Trans. Signal Process. 2014, 62, 531–544. [Google Scholar] [CrossRef]
  15. Huang, Y.; Bao, H.; Qi, X. Seismic Random Noise Attenuation Method Based on Variational Mode Decomposition and Correlation Coefficients. Electronics 2018, 7, 280. [Google Scholar] [CrossRef]
  16. Wang, Z.; Chang, X.; Wang, J.; Du, W.; Duan, N. Dang changying. Gearbox fault diagnosis based on permutation entropy optimized variational mode decomposition. Trans. Chin. Soc. Agric. Eng. (Trans. CSAE) 2018, 34, 59–66. [Google Scholar] [CrossRef]
  17. Yang, K.; Kwak, G.; Cho, K.; Huh, J. Wind farm layout optimization for wake effect uniformity. Energy 2019, 183, 983–995. [Google Scholar] [CrossRef]
  18. Miao, Y.; Zhao, M.; Lin, J. Identification of mechanical compound-fault based on the improved parameter-adaptive variational mode decomposition. ISA Trans. 2019, 84, 82–95. [Google Scholar] [CrossRef]
  19. Shi, J.; Zhu, M.; Shen, H.; Bian, Y.X.; Cui, K.; Zhu, R.H. Denoising Method of Hydrophone Signals Based on VMD and Wavelet Threshold. J. Sens. Technol. 2020, 33, 1003–1012. [Google Scholar]
  20. Lin, Z.; Chengbo, Y.; Yong, T. A Method for Pulse Signal Denoising Based on VMD Parameter Optimization and Grey Wolf Optimizer. J. Phys. Conf. Ser. 2021, 1920, 012100. [Google Scholar]
  21. Li, Q.; Li, M.; Fu, C.; Wang, J. Fault Diagnosis of Wind Turbine Component Based on an Improved Dung Beetle Optimization Algorithm to Optimize Support Vector Machine. Electronics 2024, 13, 3621. [Google Scholar] [CrossRef]
  22. Li, S.; Zhao, Q.; Liu, J.; Zhang, X.; Hou, J. Noise Reduction of Steam Trap Based on SSA-VMD Improved Wavelet Threshold Function. Sensors 2025, 25, 1573. [Google Scholar] [CrossRef]
  23. Wang, H.; Wang, H.; Chen, P.; Wu, S.; Ma, Y. Bearing Small Sample Fault Diagnosis Model Based on IVYA-FMD and EELM-Yager. Mech. Electr. Eng. 2025, 42, 1093–1101. [Google Scholar]
  24. Liang, T.; Lu, H.; Sun, H. Application of Parameter Optimized Variational Mode Decomposition Method in Fault Feature Extraction of Rolling Bearing. Entropy 2021, 23, 520. [Google Scholar] [CrossRef]
  25. Ma, Z.; Zhang, Y. A study on rolling bearing fault diagnosis using RIME-VMD. Sci. Rep. 2025, 15, 4712. [Google Scholar] [CrossRef] [PubMed]
  26. Ying, L.; Peng, W.; Wu, S.; Peng, B. Fault Feature Extraction Method of Reciprocating Compressor Based on AO-VMD. Mech. Electr. Eng. 2023, 40, 673–681. [Google Scholar]
  27. Wang, X.-B.; Yang, Z.-X.; Yan, X.-A. Novel Particle Swarm Optimization-Based Variational Mode Decomposition Method for the Fault Diagnosis of Complex Rotating Machinery. IEEE/ASME Trans. Mechatron. 2018, 23, 68–79. [Google Scholar] [CrossRef]
  28. Liu, Y.; Zhao, W.; Zou, Y. Fault Diagnosis Method of Rolling Bearing Based on Optimized VMD Combined with BP Neural Network. J. Jilin Eng. Norm. Univ. 2023, 39, 91–96. [Google Scholar]
  29. Jiang, T.; Yu, C.; Huang, K.; Zhao, J.; Wang, L. Bridge Signal Denoising Method Based on AO Algorithm Optimized VMD Parameters Combined with Wavelet Threshold. China J. Highw. Transp. 2023, 36, 158–168. [Google Scholar] [CrossRef]
  30. Huang, L.; Fu, J.; Yuan, C.; Lv, Q.; Gao, J. Millimeter-Wave Radar Heart Rate Detection Based on GWO-VMD [J/OL]. J. Univ. Electron. Sci. Technol. China 2025, 54, 1–7. Available online: http://kns.cnki.net/kcms/detail/51.1207.TN.20250115.1401.004.html (accessed on 26 June 2025).
  31. Li, X.; Ni, R.; Ji, Z. ICG signal denoising based on ICEEMDAN and PSO-VMD methods. Phys. Eng. Sci. Med. 2024, 47, 1547–1556. [Google Scholar] [CrossRef]
  32. Bai, Y.; Chen, Z.; Zhang, X.; Liu, B.; Chen, G. Denoising Method of Partial Discharge Ultrasonic Signals of Oil-Immersed Transformers Based on Improved VMD-WT. J. Electron. Meas. Instrum. 2024, 38, 237–249. [Google Scholar] [CrossRef]
  33. Zhong, C.; Li, G.; Meng, Z.; Li, H.; Yildiz, A.R.; Mirjalili, S. Starfish optimization algorithm (SFOA): A bio-inspired metaheuristic algorithm for global optimization compared with 100 optimizers. Neural Comput. Appl. 2024, 37, 3641–3683. [Google Scholar] [CrossRef]
  34. Chen, L.; Bai, X.; He, Y.; Jia, D.; Li, Y.; Li, Z. Multi-fault diagnosis and damage assessment of rolling bearings based on IDBO-VMD and CNN-BiLSTM. Sci. Rep. 2025, 15, 31121. [Google Scholar] [CrossRef] [PubMed]
  35. Xiong, L.; Fan, K.; Huang, J.; Liu, Z.; Fan, A. Adaptive filtering of UAV acoustic signals based on MFDE-LOF fundamental frequency filtering and PSO-VMD harmonic reconstruction. Appl. Acoust. 2025, 240, 110923. [Google Scholar] [CrossRef]
  36. Li, H.; Li, S.; Sun, J.; Huang, B.; Zhang, J.; Gao, M. Ultrasound signal processing based on joint GWO-VMD wavelet threshold functions. Measurement 2024, 226, 114143. [Google Scholar] [CrossRef]
  37. Lay, T. Quantitative Seismology, Second Edition. Eos Trans. Am. Geophys. Union 2003, 84, 202. [Google Scholar] [CrossRef]
  38. Gardner, G.H.F.; Gardner, L.W.; Gregory, A.R. Formation Velocity and Density—The Diagnostic Basics for Stratigraphic Traps. Geophysics 1974, 39, 770–780. [Google Scholar] [CrossRef]
  39. Ricker, N.H. Transient Waves in Visco-Clastic Media; Elsevier: New York, NY, USA, 1977; Volume 45. [Google Scholar] [CrossRef]
  40. Yilmaz, O. Seismic Data Analysis: Processing, Inversion, and Interpretation of Seismic Data; Society of Exploration Geophysicists: Tulsa, OK, USA, 2001; 1028p. [Google Scholar]
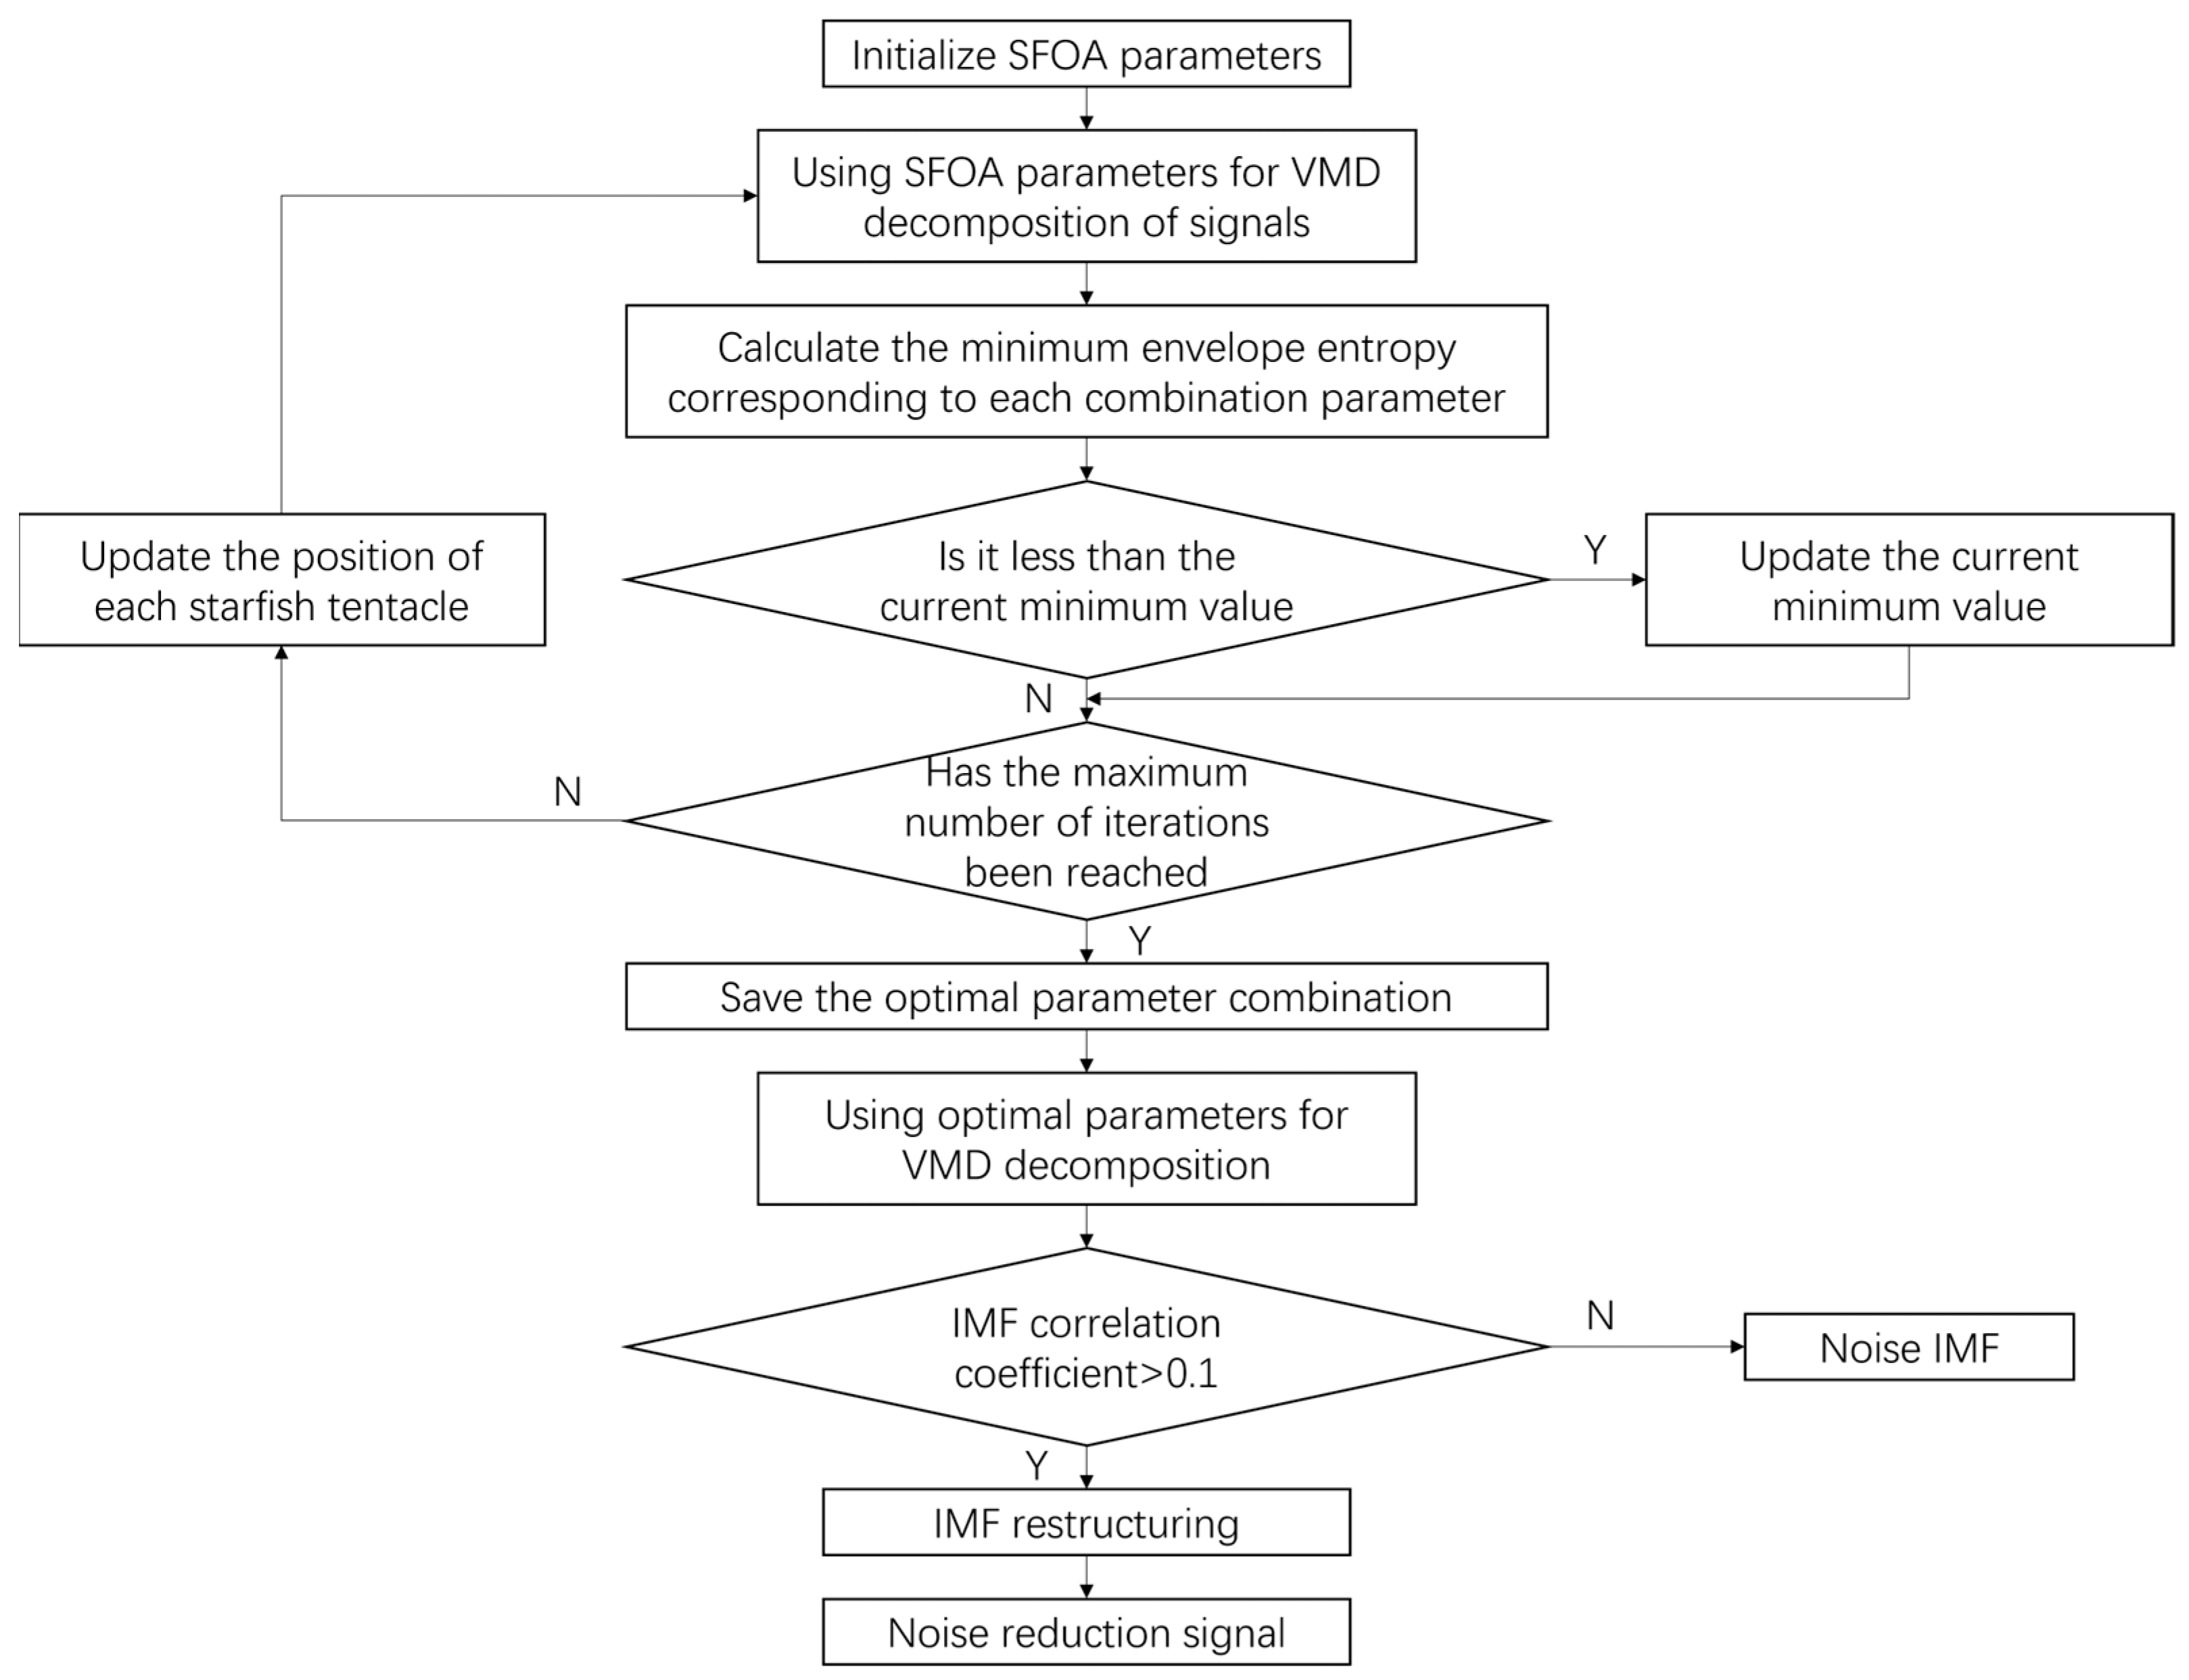
Figure 1. Framework of a Variational Mode Decomposition-Based Denoising Process for High-Sampling-Rate Seismic Data Using the Starfish Optimization Algorithm.
Geosciences 15 00409 g001
Figure 2. Reflection Coefficient.
Geosciences 15 00409 g002
Figure 3. The Synthetic 50 Hz Ricker Wavelet.
Geosciences 15 00409 g003
Figure 4. The Synthetic Seismic Signal Generated by Convolving a Reflectivity Series with a 50 Hz Ricker Wavelet.
Geosciences 15 00409 g004
Figure 5. Noisy Synthetic Seismic Signal with White Gaussian Noise.
Geosciences 15 00409 g005
Figure 6. Convergence Curve Using Minimum Envelope Entropy as the Fitness Function.
Geosciences 15 00409 g006
Figure 7. IMF Components Derived from the Decomposition of a Noisy Synthetic Seismic Signal.
Geosciences 15 00409 g007
Figure 8. Comparison of Denoised Waveforms from a Synthetic Seismic Signal by Different Algorithms.
Geosciences 15 00409 g008
Figure 9. Acquisition System and Equipment Deployment for High-Sampling-Rate, Real-Time Seismic Monitoring While Drilling.
Geosciences 15 00409 g009
Figure 10. Comparison Between While-Drilling Acquired Signals and Conventional Seismic Signals. (a) Actual While-Drilling Acquired Signal. (b) Frequency Spectrum of While-Drilling Acquired Signal. (c) Conventional Seismic Signal. (d) Frequency Spectrum of Conventional Seismic Signal.
Geosciences 15 00409 g010
Figure 11. IMF Components Derived from the Decomposition of Field Seismic Data.
Geosciences 15 00409 g011
Figure 12. Denoising Results of Field Seismic Data Using the SFOA-Optimized VMD Method.
Geosciences 15 00409 g012
Figure 13. A Direct Comparison of Denoised Field Seismic Data with Physical Core Measurements.
Geosciences 15 00409 g013
Figure 14. Actual Core Samples (a) The first section of core; (b) the second section of core; (c) the third section of core; (d) the fourth section of core; and (e) the fifth section of core.
Geosciences 15 00409 g014
Table 1. Correlation Coefficients of Each IMF for the Synthetic Seismic Signal.
IMFCorrelation Coefficient
IMF10.0348
IMF20.0291
IMF30.0280
IMF40.0298
IMF50.0312
IMF60.0393
IMF70.0952
IMF80.5002
IMF90.9622
IMF100.3379
Table 2. Comparison of Denoising Results (Evaluation Metrics).
MethodsSNRRMSERRMSENCC
EMD28.24434.691 × 10−40.03870.99925
EEMD30.68133.543 × 10−40.02920.99957
CEEMDAN31.41083.258 × 10−40.02690.99964
SFOA-VMD34.25142.349 × 10−40.01940.99981
Table 3. Correlation Coefficients of Each IMF for the Field Data.
IMFCorrelation Coefficient
IMF 10.0071
IMF20.0038
IMF30.0045
IMF40.0038
IMF50.0050
IMF60.0075
IMF70.0355
IMF80.3650
IMF90.4778
IMF100.9987
Disclaimer/Publisher’s Note: The statements, opinions and data contained in all publications are solely those of the individual author(s) and contributor(s) and not of MDPI and/or the editor(s). MDPI and/or the editor(s) disclaim responsibility for any injury to people or property resulting from any ideas, methods, instructions or products referred to in the content.