
Landslides in the Himalayas: The Role of Conditioning Factors and Their Resolution in Susceptibility Mapping


Abstract
:1. Introduction
2. Materials and Methods
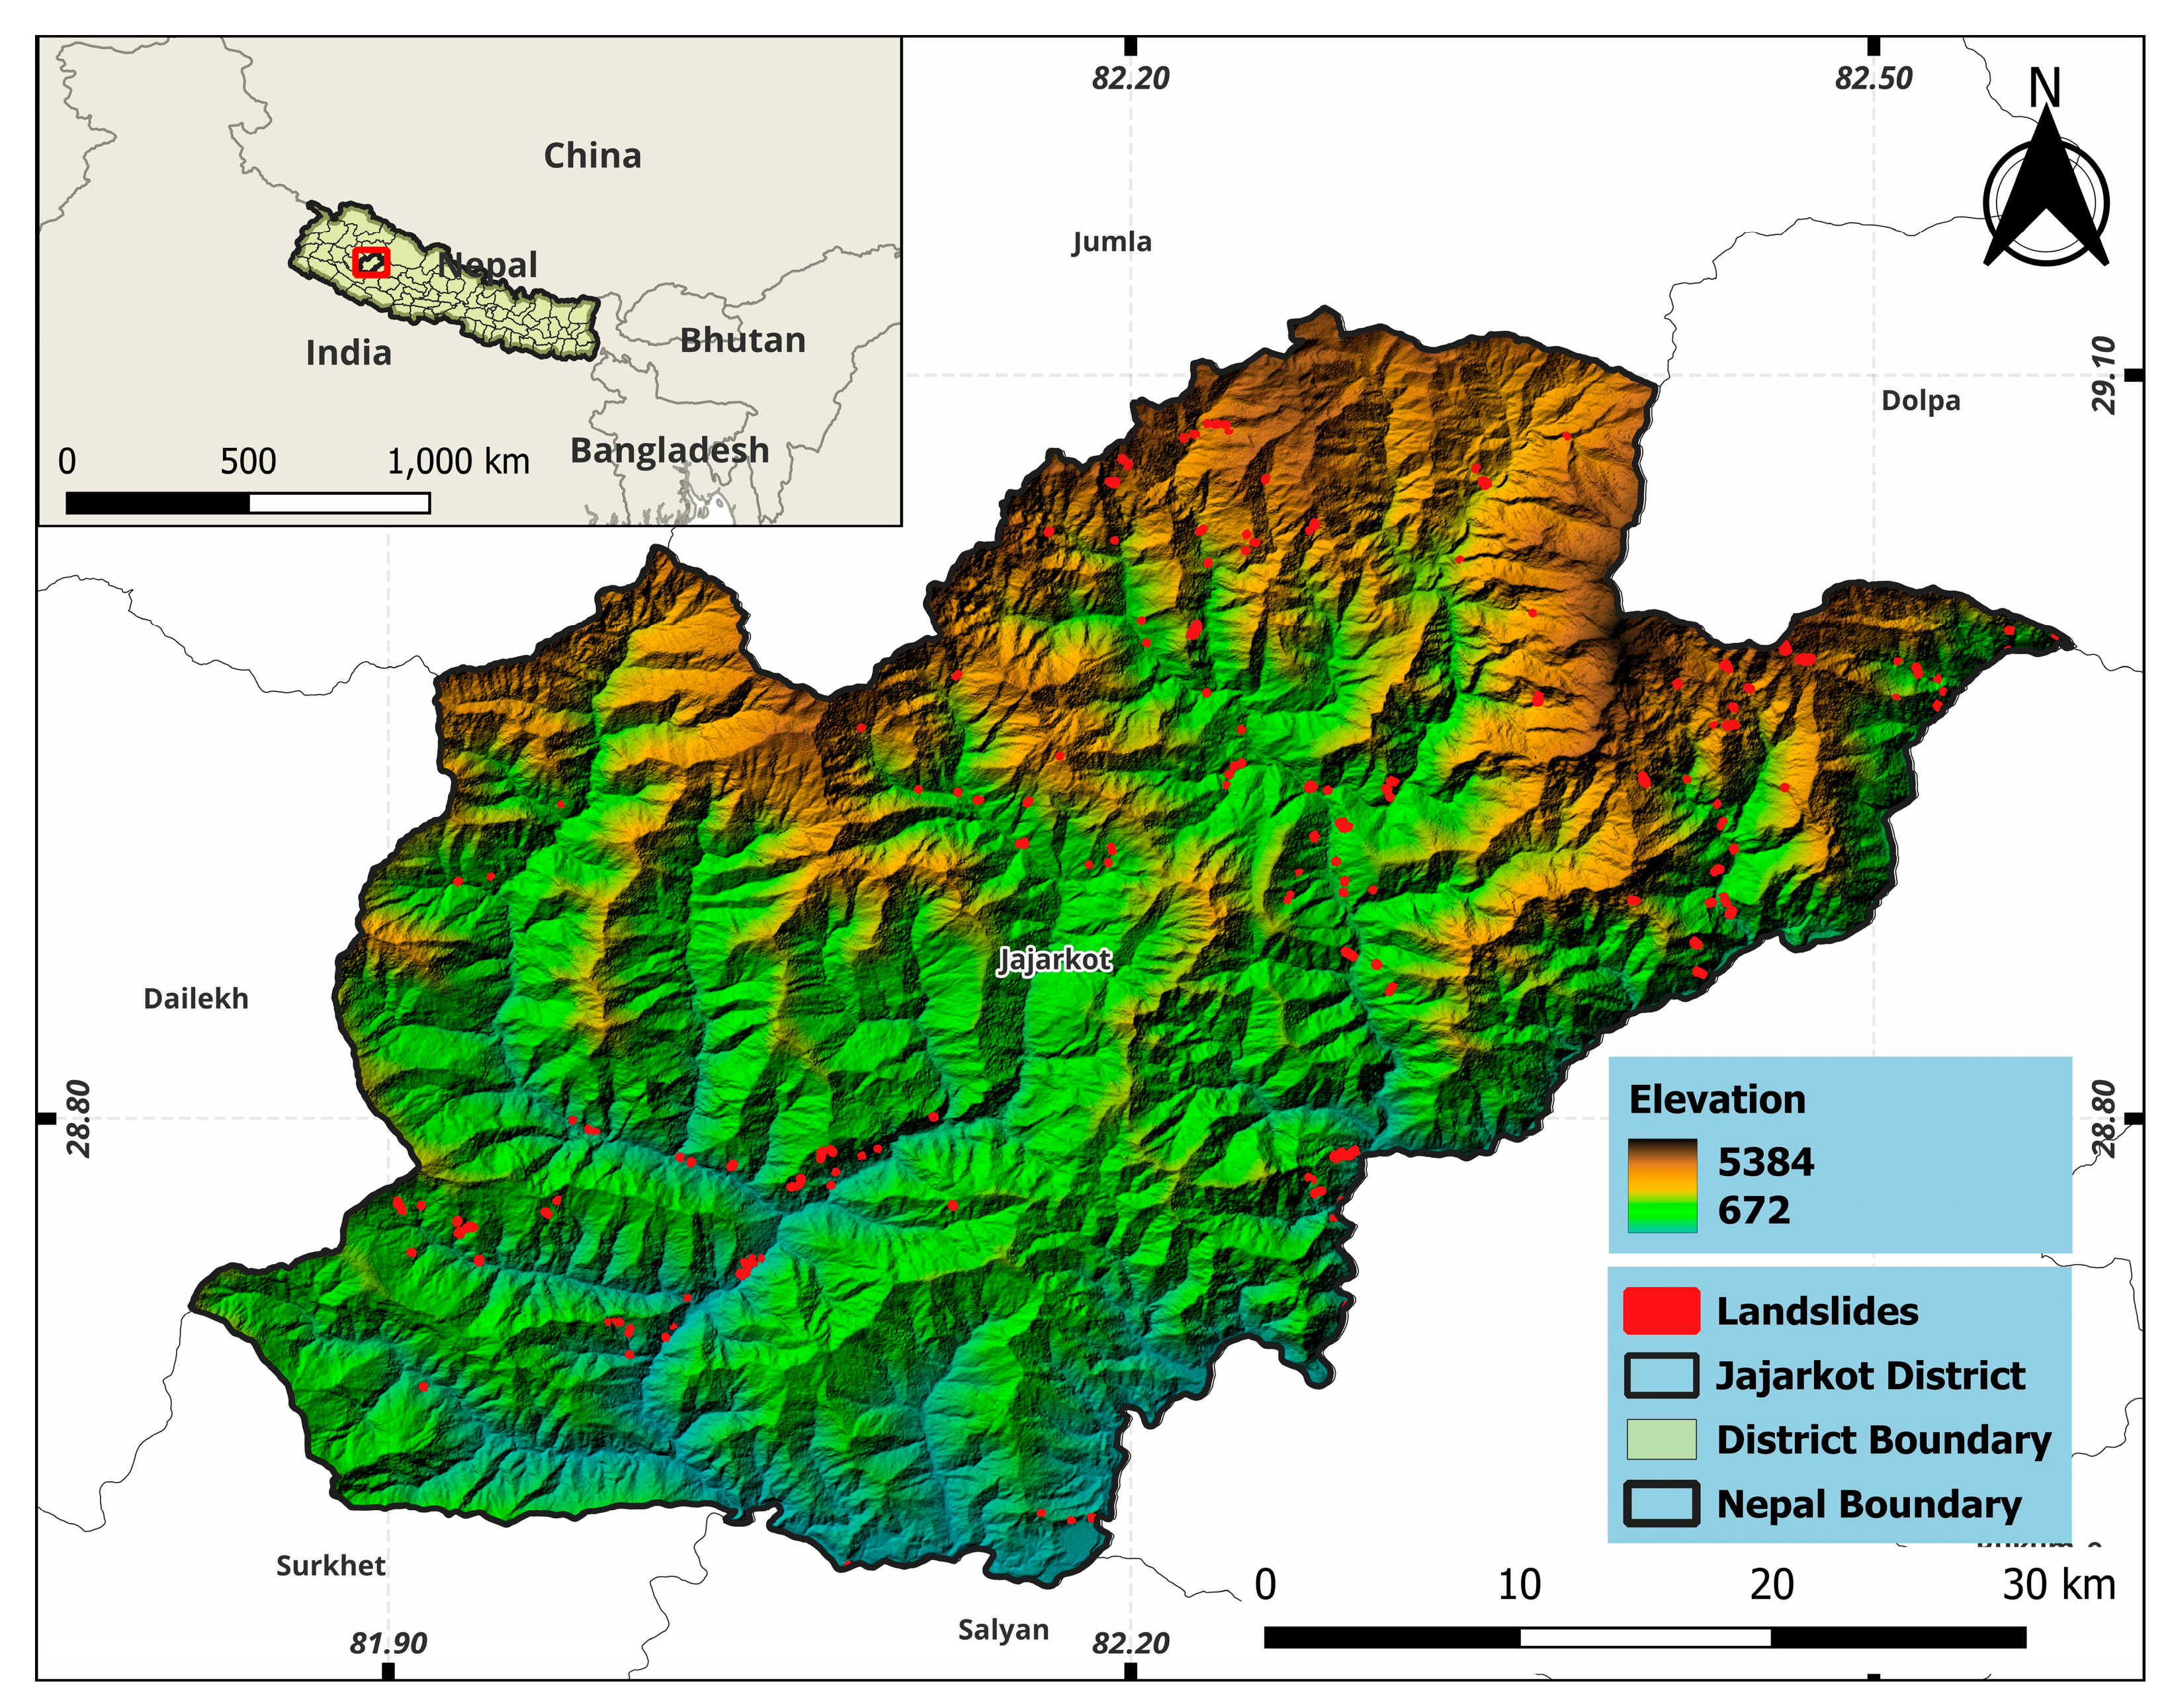
2.1. Study Area
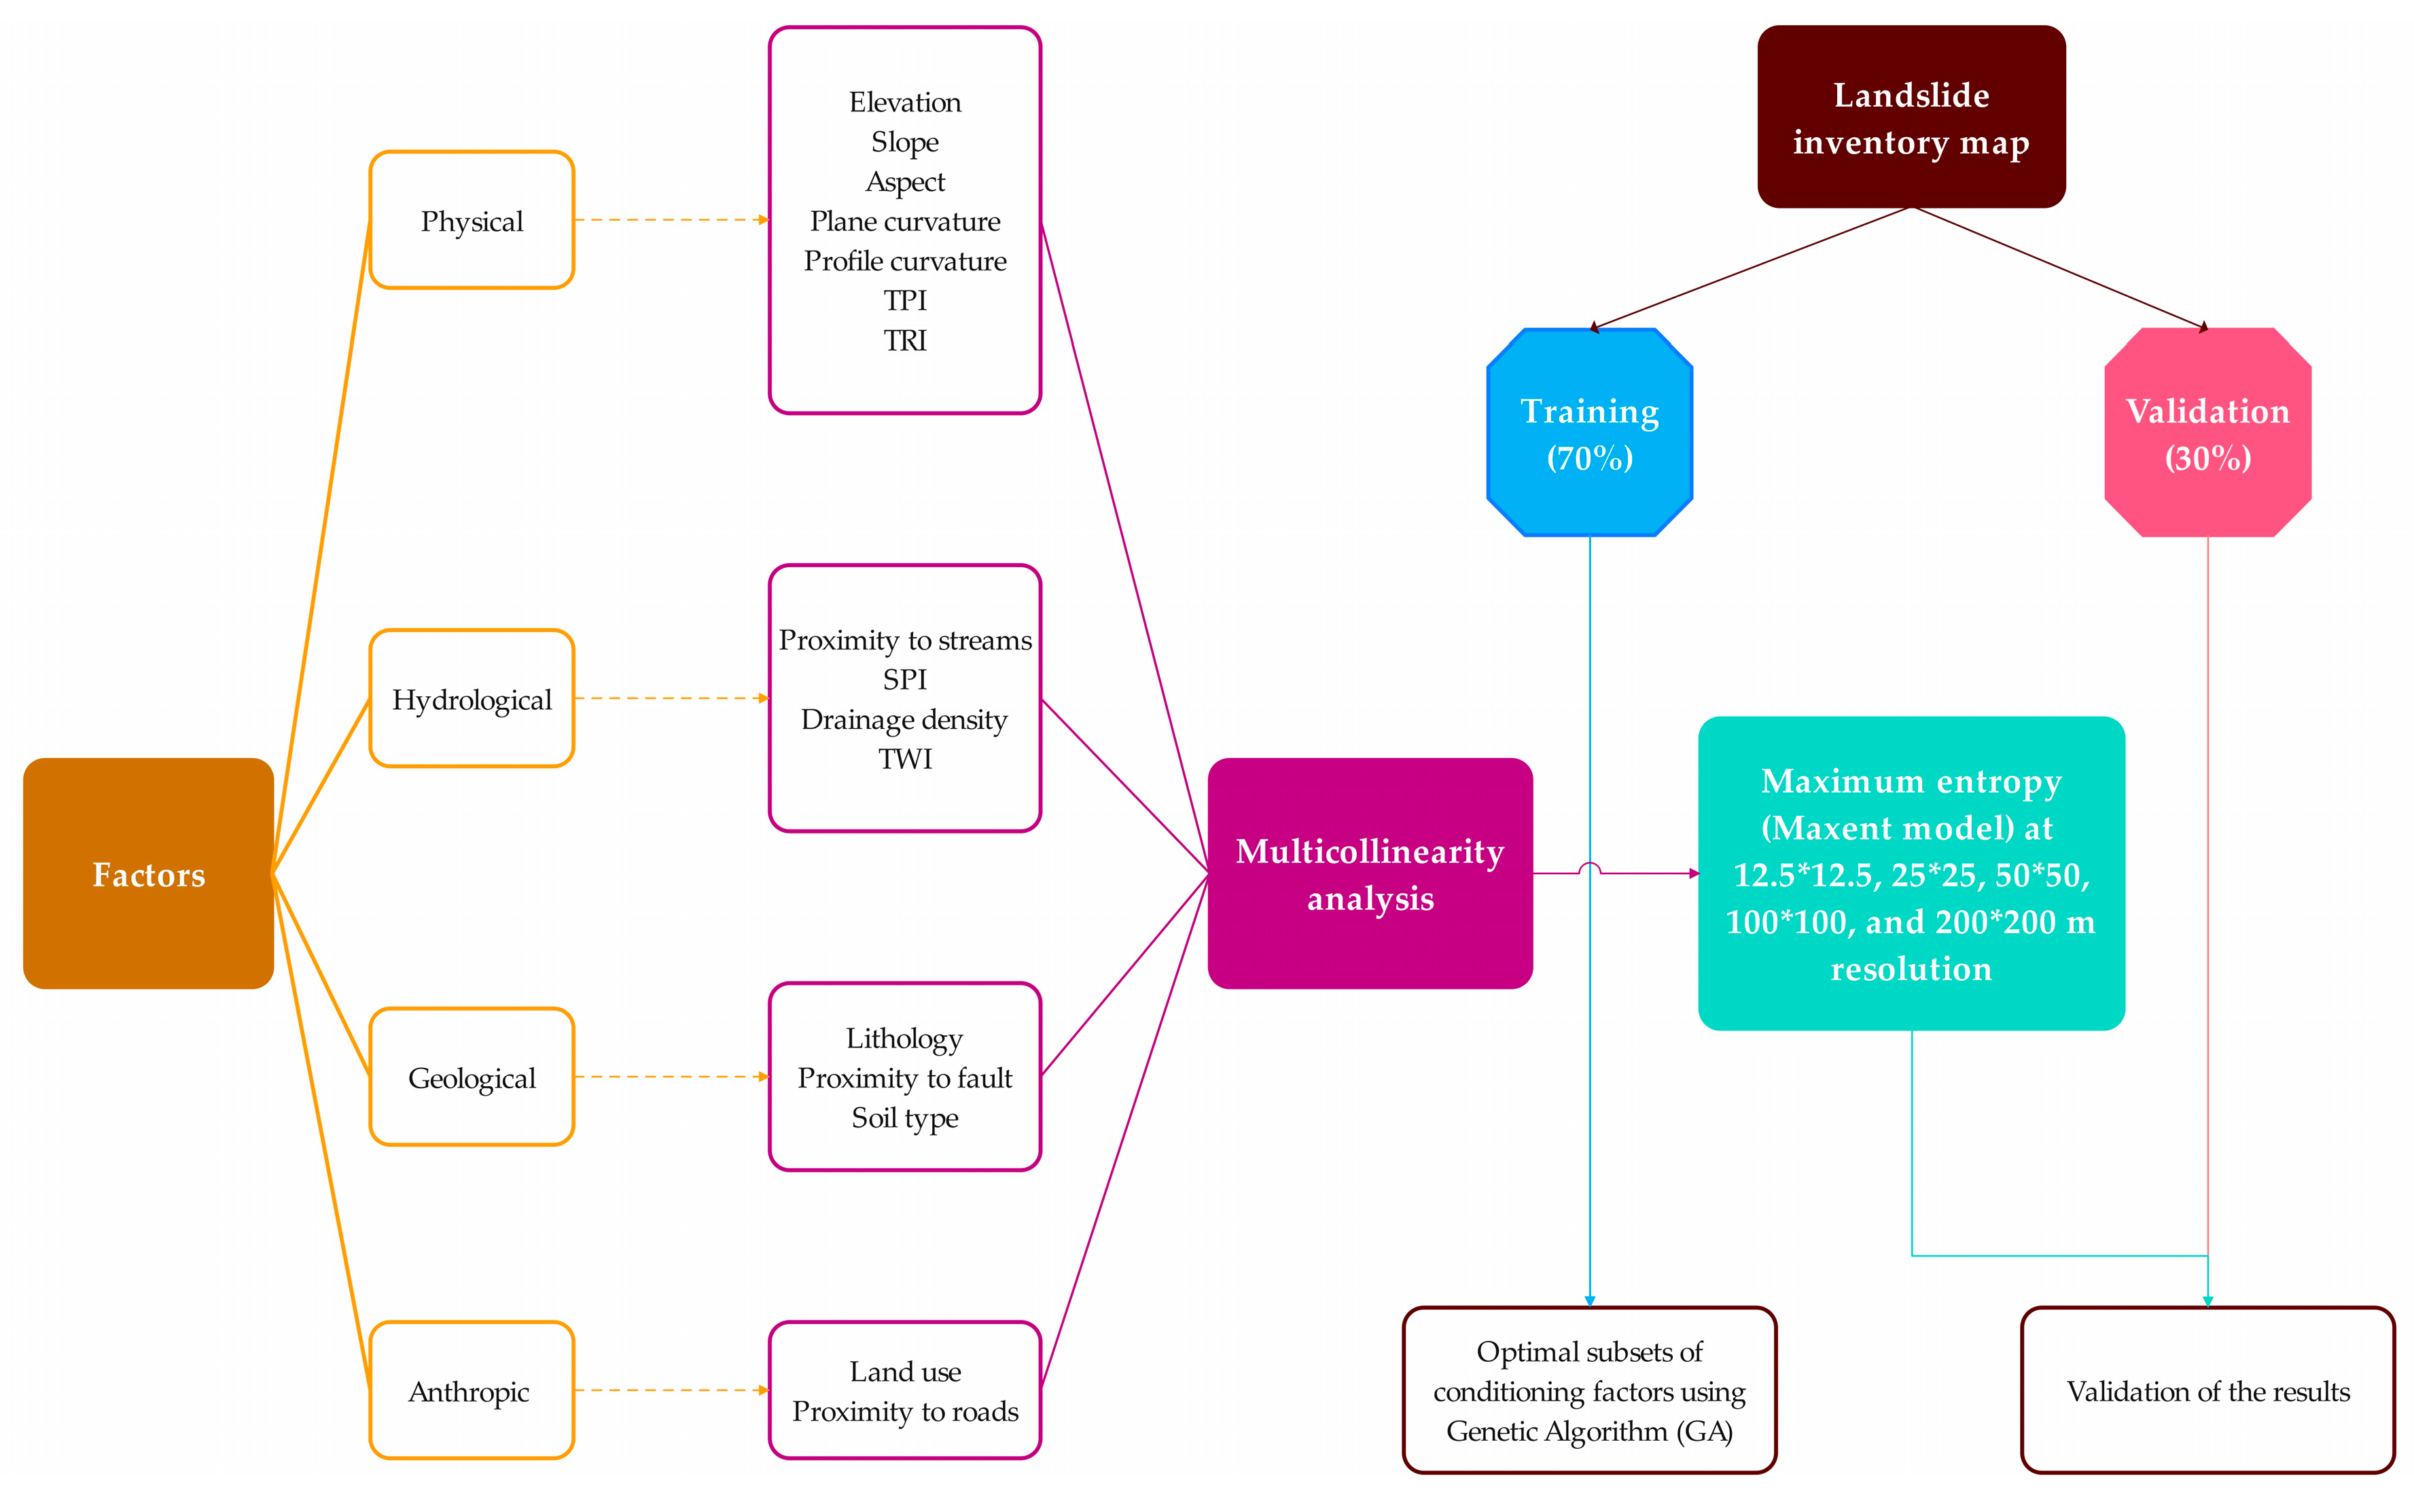
2.2. Methods
2.2.1. Landslide Inventory Mapping
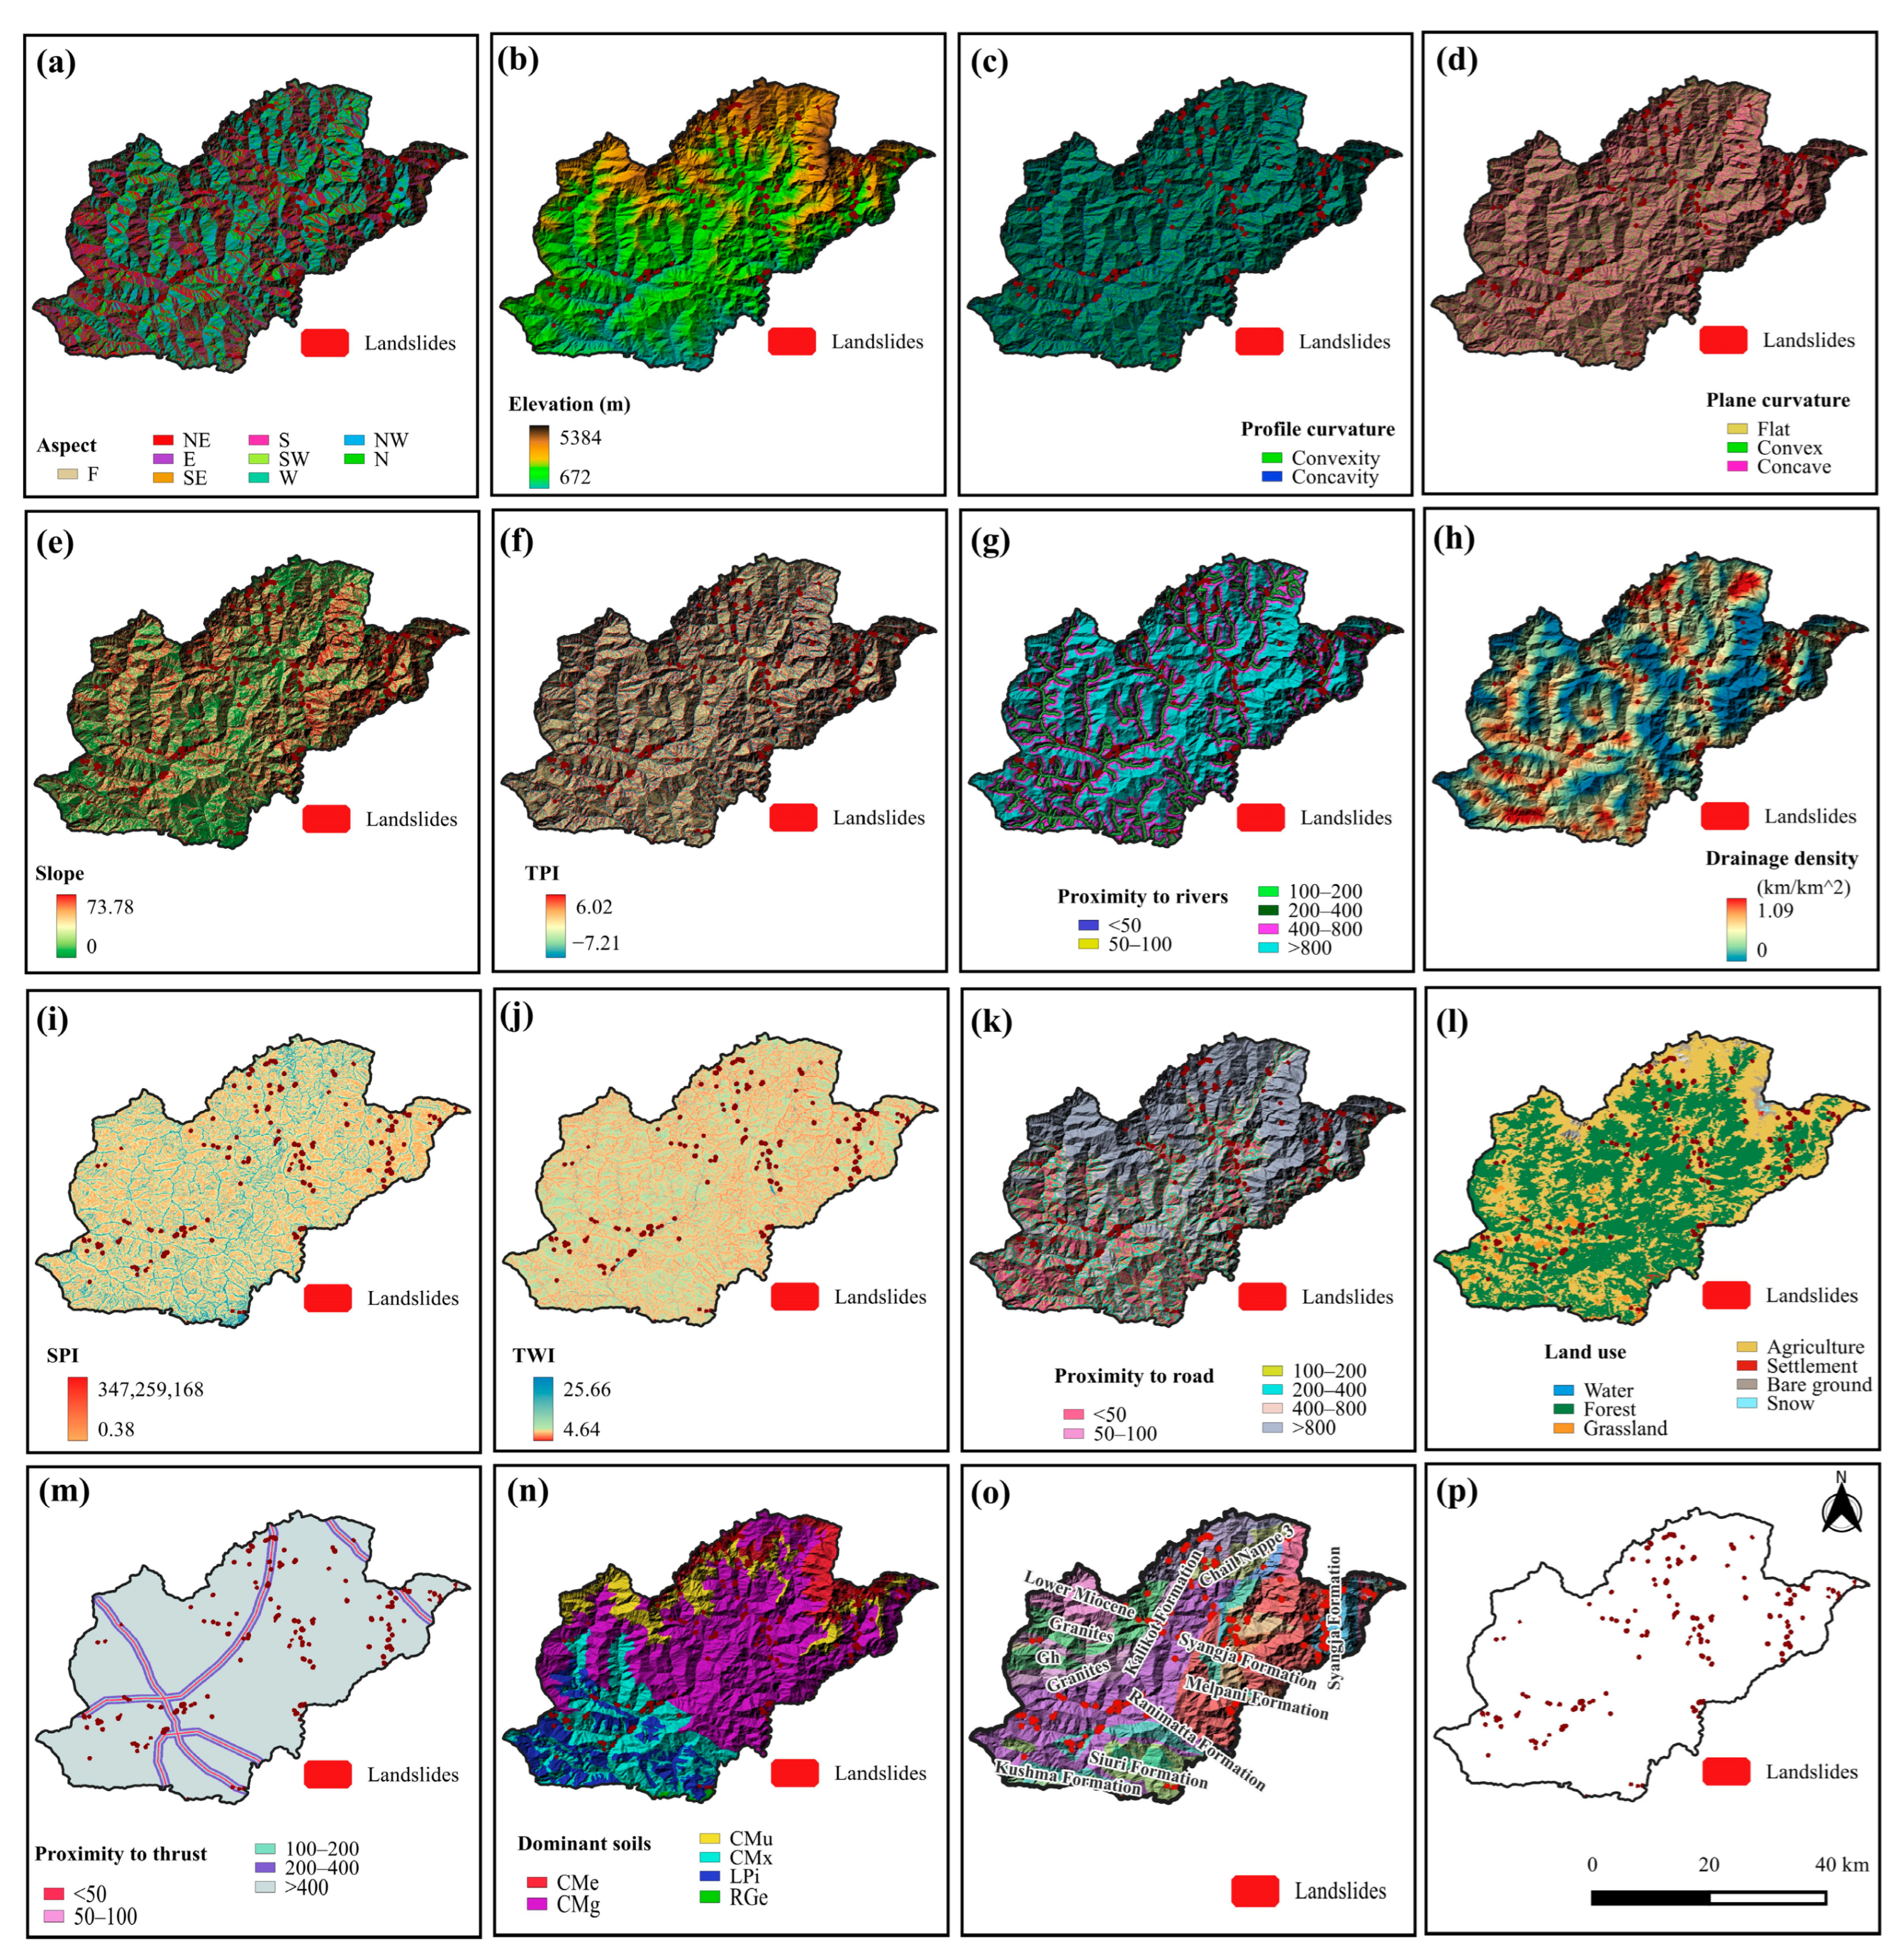
2.2.2. Conditioning Factors (CFs)
2.2.3. Multicollinearity Test
2.2.4. Optimal Subsets of Conditioning Factors
2.2.5. Maximum Entropy Model for Landslide Susceptibility
2.2.6. Assessment of the Optimal Resolution
3. Results
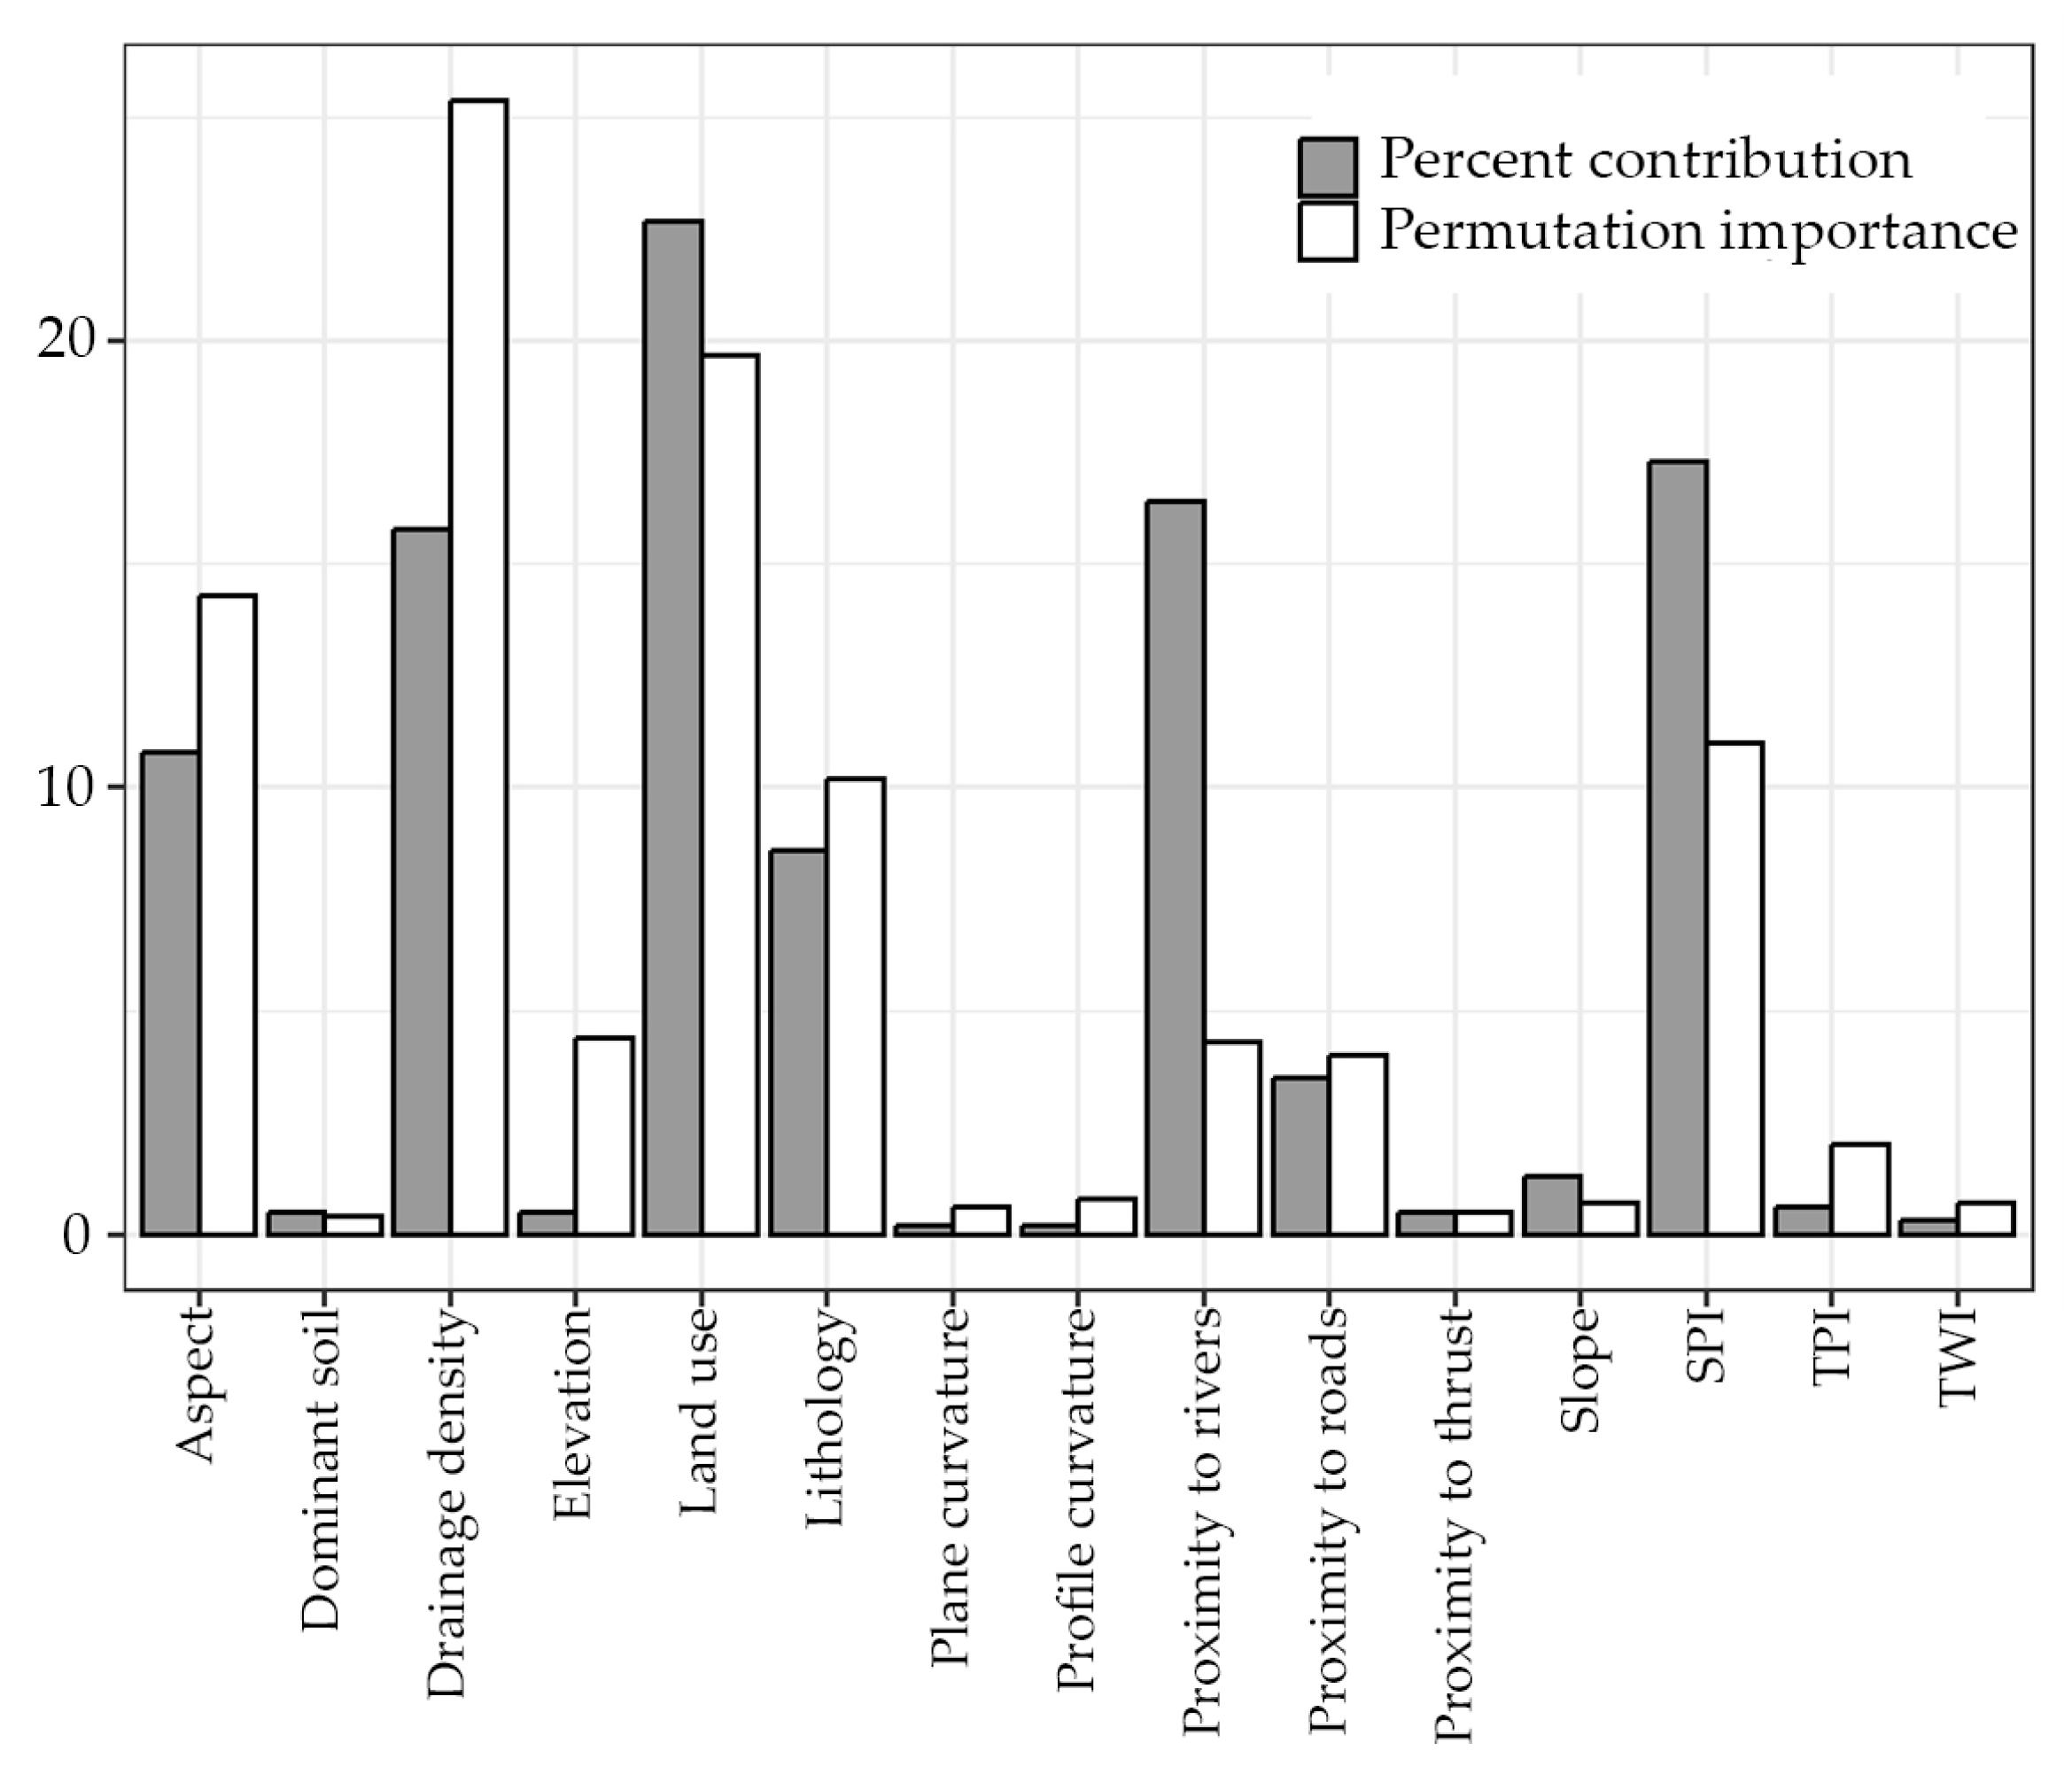
3.1. Factor Assignment and Importance
3.2. CF Selection
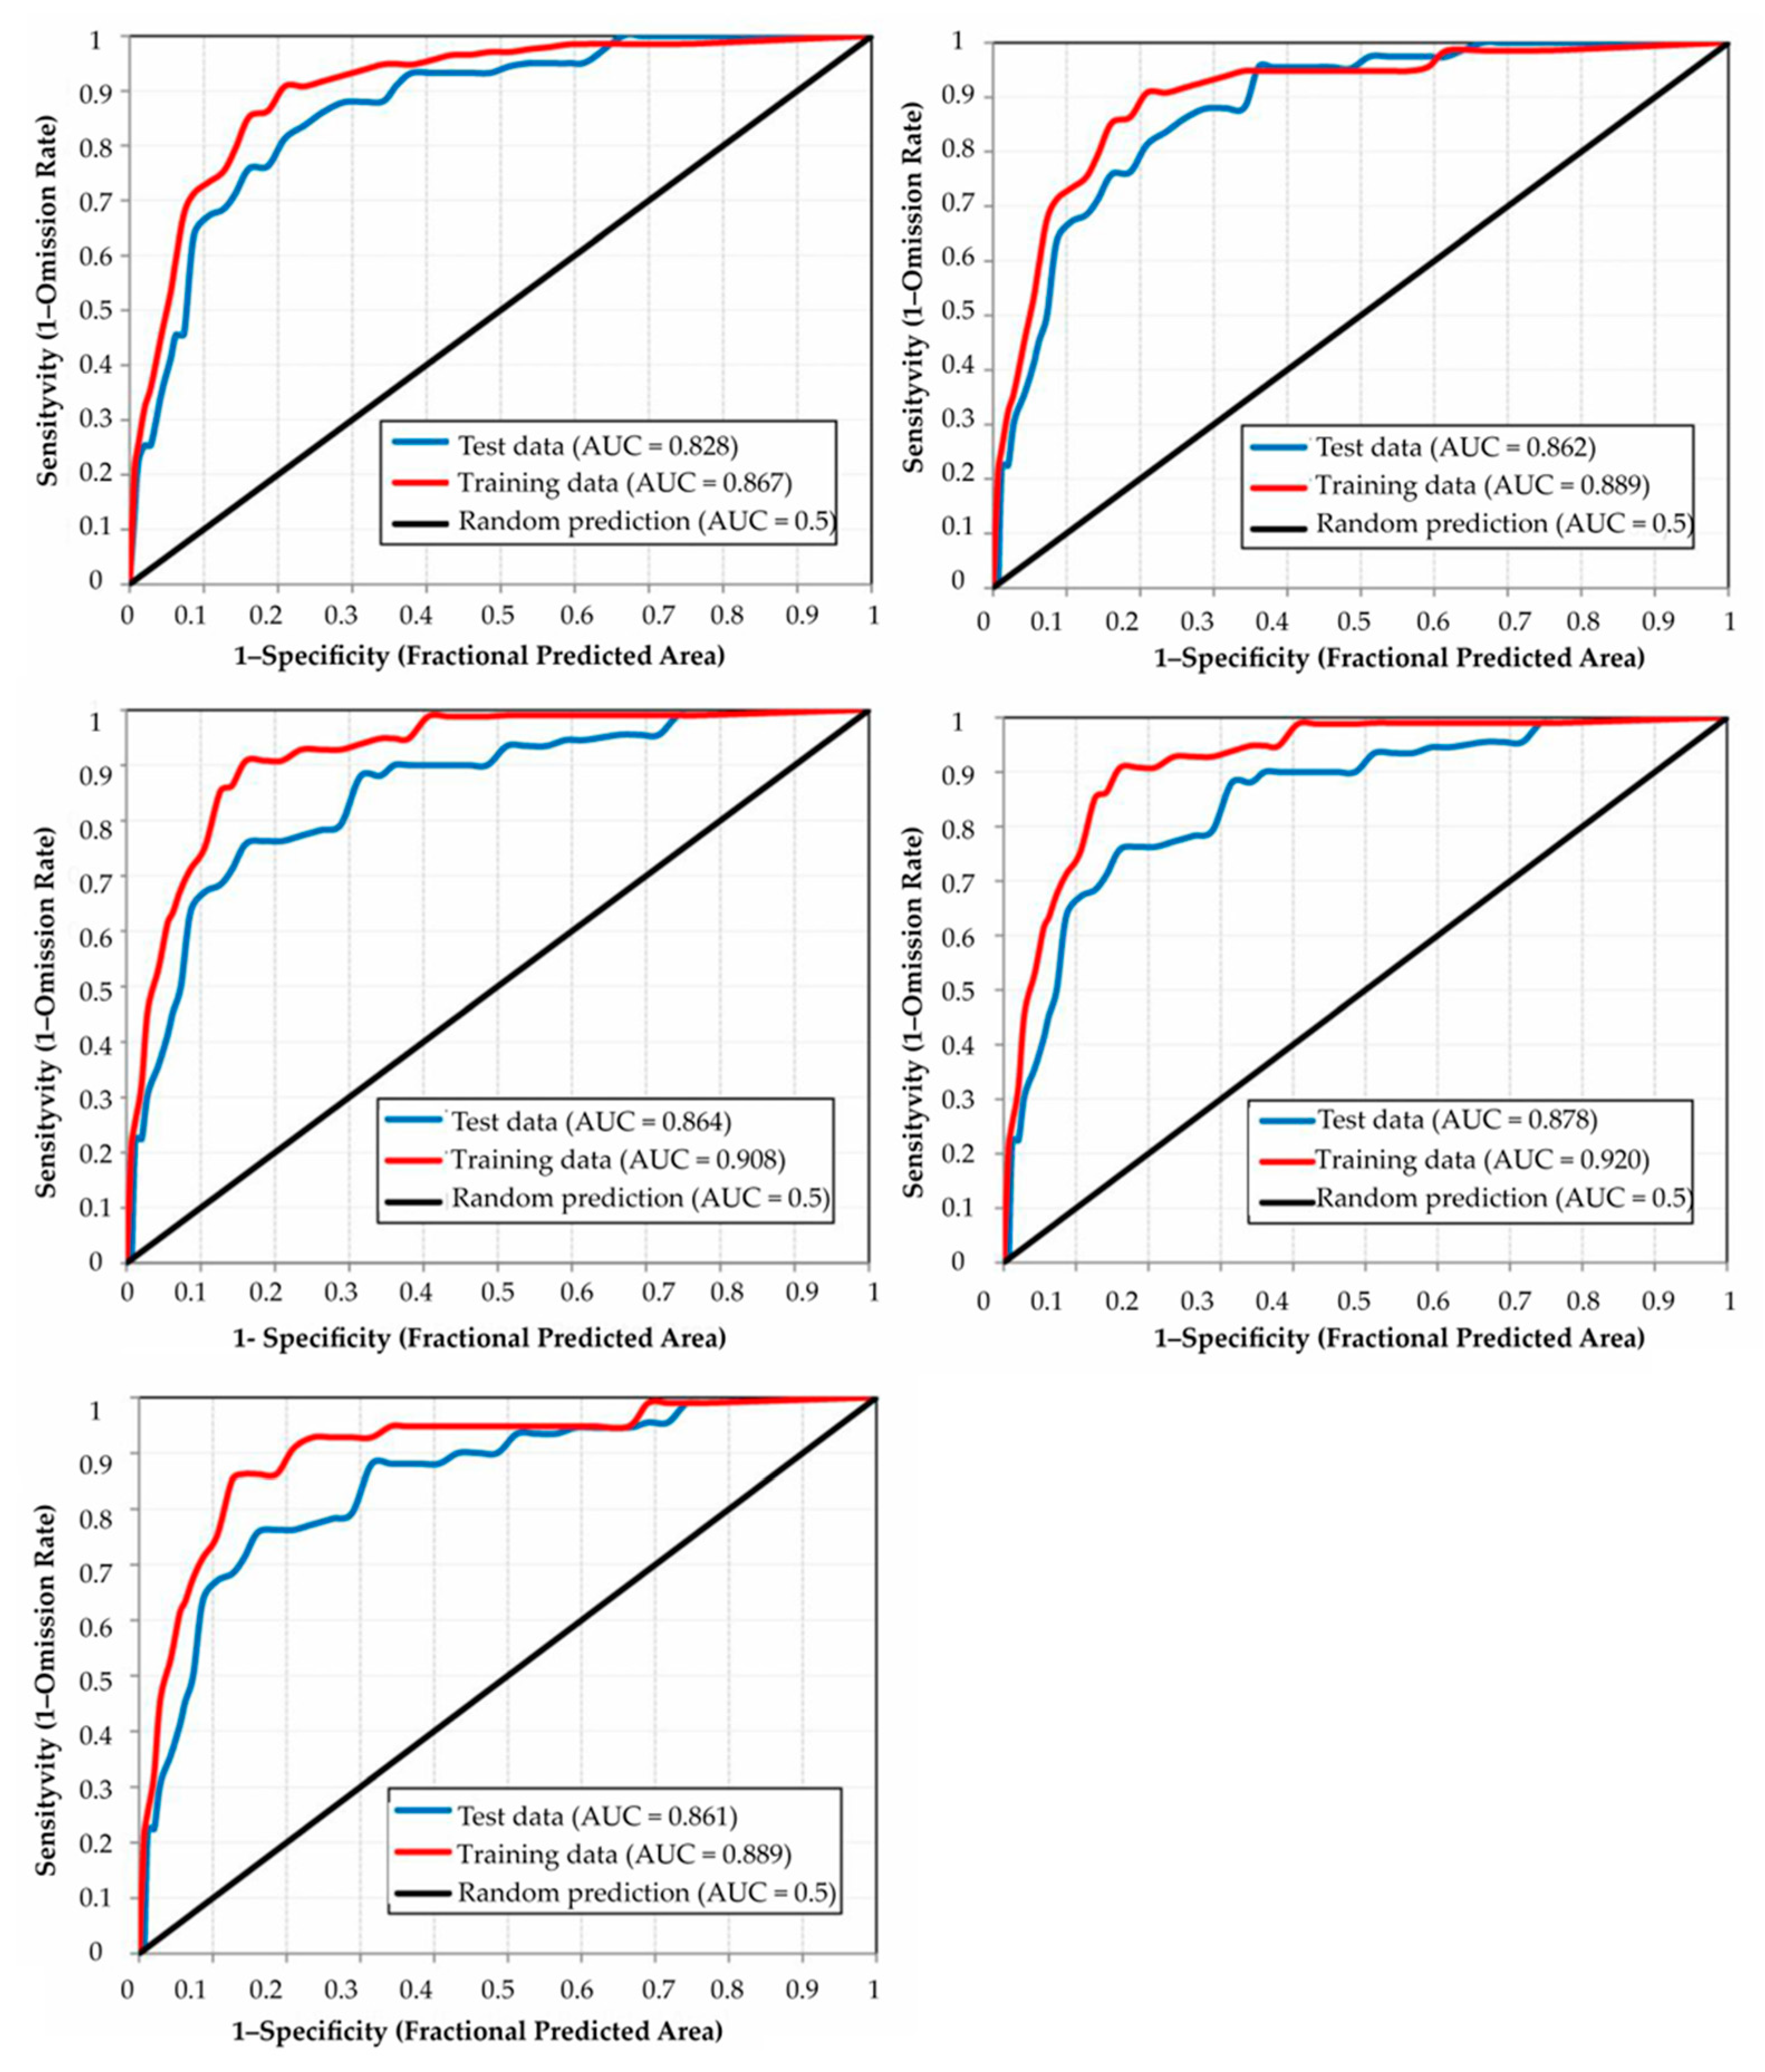
3.3. Best Performing Resolution
4. Discussion
5. Conclusions
Author Contributions
Funding
Data Availability Statement
Conflicts of Interest
References
- Dikshit, A.; Sarkar, R.; Pradhan, B.; Segoni, S.; Alamri, A.M. Rainfall Induced Landslide Studies in Indian Himalayan Region: A Critical Review. Appl. Sci. 2020, 10, 2466. [Google Scholar] [CrossRef]
- Mirdda, H.A.; Bera, S.; Chatterjee, R. Vulnerability Assessment of Mountainous Households to Landslides: A Multidimensional Study in the Rural Himalayas. Int. J. Disaster Risk Reduct. 2022, 71, 102809. [Google Scholar] [CrossRef]
- Pathak, L.; Devkota, K.C. Distribution and Dynamic Behaviors of Landslide in Rangun Khola Watershed of the Western Nepal. J. Environ. Sci. 2022, VIII, 68–79. [Google Scholar] [CrossRef]
- Dhakal, S. Geological Divisions and Associated Hazards in Nepal. In Contemporary Environmental Issues and Methods in Nepal; Springer: Berlin/Heidelberg, Germany, 2014; pp. 100–109. [Google Scholar]
- Dhital, M. Geology of the Nepal Himalaya: Regional Perspective of the Classic Collided Orogen; Springer: Berlin/Heidelberg, Germany, 2015; ISBN 978-3-319-02495-0. [Google Scholar]
- Brabb, E.E. Innovative Approaches to Landslide Hazard and Risk Mapping. In Proceedings of the International Landslide Symposium Proceedings, Toronto, ON, Canada, 23–31 August 1985; Volume 1, pp. 17–22. [Google Scholar]
- Chung, C.J.F.; Fabbri, A.G. Probabilistic Prediction Models for Landslide Hazard Mapping. Photogramm. Eng. Remote Sens. 1999, 65, 1389–1399. [Google Scholar]
- Cignetti, M.; Godone, D.; Bertolo, D.; Paganone, M.; Thuegaz, P.; Giordan, D. Rockfall Susceptibility along the Regional Road Network of Aosta Valley Region (Northwestern Italy). J. Maps 2021, 17, 54–64. [Google Scholar] [CrossRef]
- Dahal, R.K.; Hasegawa, S. Representative Rainfall Thresholds for Landslides in the Nepal Himalaya. Geomorphology 2008, 100, 429–443. [Google Scholar] [CrossRef]
- Devkota, K.C.; Regmi, A.D.; Pourghasemi, H.R.; Yoshida, K.; Pradhan, B.; Ryu, I.C.; Dhital, M.R.; Althuwaynee, O.F. Landslide Susceptibility Mapping Using Certainty Factor, Index of Entropy and Logistic Regression Models in GIS and Their Comparison at Mugling-Narayanghat Road Section in Nepal Himalaya. Nat. Hazards 2012, 65, 135–165. [Google Scholar] [CrossRef]
- Guzzetti, F.; Cardinali, M.; Reichenbach, P.; Carrara, A. Comparing Landslide Maps: A Case Study in the Upper Tiber River Basin, Central Italy. Environ. Manag. 2000, 25, 247–263. [Google Scholar] [CrossRef]
- Pathak, L.; Devkota, K.C. Landslide Susceptibility Assessment in the Rangun Khola Watershed of Far Western Nepal. J. Nepal. Geol. Soc. 2022, 63, 33–44. [Google Scholar] [CrossRef]
- Regmi, N.R.; Giardino, J.R.; Vitek, J.D.; Dangol, V. Mapping Landslide Hazards in Western Nepal: Comparing Qualitative and Quantitative Approaches. Environ. Eng. Geosci. 2010, 16, 127–142. [Google Scholar] [CrossRef]
- McColl, S.T. Landslide Causes and Triggers. In Landslide Hazards, Risks, and Disasters; Elsevier: Amsterdam, The Netherlands, 2022; pp. 13–41. [Google Scholar]
- Meena, S.R.; Puliero, S.; Bhuyan, K.; Floris, M.; Catani, F. Assessing the Importance of Conditioning Factor Selection in Landslide Susceptibility for the Province of Belluno (Region of Veneto, Northeastern Italy). Nat. Hazards Earth Syst. Sci. 2022, 22, 1395–1417. [Google Scholar] [CrossRef]
- Shano, L.; Raghuvanshi, T.K.; Meten, M. Landslide Susceptibility Evaluation and Hazard Zonation Techniques–A Review. Geoenviron. Disasters 2020, 7, 18. [Google Scholar]
- Das, J.; Saha, P.; Mitra, R.; Alam, A.; Kamruzzaman, M. GIS-Based Data-Driven Bivariate Statistical Models for Landslide Susceptibility Prediction in Upper Tista Basin, India. Heliyon 2023, 9, e16186. [Google Scholar] [PubMed]
- Schicker, R.; Moon, V. Comparison of Bivariate and Multivariate Statistical Approaches in Landslide Susceptibility Mapping at a Regional Scale. Geomorphology 2012, 161, 40–57. [Google Scholar]
- Yalcin, A. A Geotechnical Study on the Landslides in the Trabzon Province, NE, Turkey. Appl. Clay Sci. 2011, 52, 11–19. [Google Scholar] [CrossRef]
- Li, Y.; Liu, X.; Han, Z.; Dou, J. Spatial Proximity-Based Geographically Weighted Regression Model for Landslide Susceptibility Assessment: A Case Study of Qingchuan Area, China. Appl. Sci. 2020, 10, 1107. [Google Scholar] [CrossRef]
- Mandal, K.; Saha, S.; Mandal, S. Applying Deep Learning and Benchmark Machine Learning Algorithms for Landslide Susceptibility Modelling in Rorachu River Basin of Sikkim Himalaya, India. Geosci. Front. 2021, 12, 101203. [Google Scholar]
- Lee, S.; Talib, J.A. Probabilistic Landslide Susceptibility and Factor Effect Analysis. Environ. Geol. 2005, 47, 982–990. [Google Scholar] [CrossRef]
- Ghimire, M. Landslide Occurrence and Its Relation with Terrain Factors in the Siwalik Hills, Nepal: Case Study of Susceptibility Assessment in Three Basins. Nat. Hazards 2011, 56, 299–320. [Google Scholar] [CrossRef]
- Pourghasemi, H.R.; Teimoori Yansari, Z.; Panagos, P.; Pradhan, B. Analysis and Evaluation of Landslide Susceptibility: A Review on Articles Published during 2005–2016 (Periods of 2005–2012 and 2013–2016). Arab. J. Geosci. 2018, 11, 193. [Google Scholar] [CrossRef]
- Gautam, P.; Kubota, T.; Aditian, A. Evaluating Underlying Causative Factors for Earthquake-Induced Landslides and Landslide Susceptibility Mapping in Upper Indrawati Watershed, Nepal. Geoenviron. Disasters 2021, 8, 30. [Google Scholar] [CrossRef]
- Pradhan, B.; Oh, H.J.; Buchroithner, M. Weights-of-Evidence Model Applied to Landslide Susceptibility Mapping in a Tropical Hilly Area. Geomat. Nat. Hazards Risk 2010, 1, 199–223. [Google Scholar] [CrossRef]
- Kavzoglu, T.; Kutlug Sahin, E.; Colkesen, I. Selecting Optimal Conditioning Factors in Shallow Translational Landslide Susceptibility Mapping Using Genetic Algorithm. Eng. Geol. 2015, 192, 101–112. [Google Scholar] [CrossRef]
- Sharma, K.; Saraf, A.K.; Das, J.; Baral, S.S.; Borgohain, S.; Singh, G. Mapping and Change Detection Study of Nepal-2015 Earthquake Induced Landslides. J. Indian Soc. Remote Sens. 2018, 46, 605–615. [Google Scholar] [CrossRef]
- Regmi, A.D.; Devkota, K.C.; Yoshida, K.; Pradhan, B.; Pourghasemi, H.R.; Kumamoto, T.; Akgun, A. Application of Frequency Ratio, Statistical Index, and Weights-of-Evidence Models and Their Comparison in Landslide Susceptibility Mapping in Central Nepal Himalaya. Arab. J. Geosci. 2014, 7, 725–742. [Google Scholar] [CrossRef]
- Pandey, V.K.; Pourghasemi, H.R.; Sharma, M.C. Landslide Susceptibility Mapping Using Maximum Entropy and Support Vector Machine Models along the Highway Corridor, Garhwal Himalaya. Geocarto Int. 2020, 35, 168–187. [Google Scholar] [CrossRef]
- Hearn, G.J.; Hart, A.B. Landslide Susceptibility Mapping: A Practitioner’s View. Bull. Eng. Geol. Environ. 2019, 78, 5811–5826. [Google Scholar]
- Jebur, M.N.; Pradhan, B.; Tehrany, M.S. Optimization of Landslide Conditioning Factors Using Very High-Resolution Airborne Laser Scanning (LiDAR) Data at Catchment Scale. Remote Sens. Environ. 2014, 152, 150–165. [Google Scholar] [CrossRef]
- Nhu, V.-H.; Shirzadi, A.; Shahabi, H.; Singh, S.K.; Al-Ansari, N.; Clague, J.J.; Jaafari, A.; Chen, W.; Miraki, S.; Dou, J. Shallow Landslide Susceptibility Mapping: A Comparison between Logistic Model Tree, Logistic Regression, Naïve Bayes Tree, Artificial Neural Network, and Support Vector Machine Algorithms. Int. J. Environ. Res. Public. Health 2020, 17, 2749. [Google Scholar] [CrossRef]
- Palazzolo, N.; Peres, D.J.; Bordoni, M.; Meisina, C.; Creaco, E.; Cancelliere, A. Improving Spatial Landslide Prediction with 3d Slope Stability Analysis and Genetic Algorithm Optimization: Application to the Oltrepò Pavese. Water 2021, 13, 801. [Google Scholar] [CrossRef]
- Tian, Y.; Xiao, C.; Liu, Y.; Wu, L. Effects of Raster Resolution on Landslide Susceptibility Mapping: A Case Study of Shenzhen. Sci. China Ser. E Technol. Sci. 2008, 51, 188–198. [Google Scholar] [CrossRef]
- Zheng, B.; Wang, J.; Feng, T.; Wang, W.; Wang, Y.; Yang, Y.; Wang, G. Improving the Landslide Susceptibility Prediction Accuracy by Using Genetic Algorithm Optimized Machine Learning Approach. Int. J. Intell. Syst. 2023, 2023, 5525793. [Google Scholar]
- Arnone, E.; Francipane, A.; Scarbaci, A.; Puglisi, C.; Noto, L.V. Effect of Raster Resolution and Polygon-Conversion Algorithm on Landslide Susceptibility Mapping. Environ. Model. Softw. 2016, 84, 467–481. [Google Scholar] [CrossRef]
- Catani, F.; Lagomarsino, D.; Segoni, S.; Tofani, V. Landslide Susceptibility Estimation by Random Forests Technique: Sensitivity and Scaling Issues. Nat. Hazards Earth Syst. Sci. 2013, 13, 2815–2831. [Google Scholar]
- Meena, S.R.; Nachappa, T.G. Impact of Spatial Resolution of Digital Elevation Model on Landslide Susceptibility Mapping: A Case Study in Kullu Valley, Himalayas. Geosciences 2019, 9, 360. [Google Scholar] [CrossRef]
- Phillips, S.B.; Aneja, V.P.; Kang, D.; Arya, S.P. Modelling and Analysis of the Atmospheric Nitrogen Deposition in North Carolina. Int. J. Glob. Environ. Issues 2006, 6, 231–252. [Google Scholar] [CrossRef]
- Merow, C.; Smith, M.J.; Silander, J.A., Jr. A Practical Guide to MaxEnt for Modeling Species’ Distributions: What It Does, and Why Inputs and Settings Matter. Ecography 2013, 36, 1058–1069. [Google Scholar]
- Chen, W.; Li, W.; Hou, E.; Zhao, Z.; Deng, N.; Bai, H.; Wang, D. Landslide Susceptibility Mapping Based on GIS and Information Value Model for the Chencang District of Baoji, China. Arab. J. Geosci. 2014, 7, 4499–4511. [Google Scholar] [CrossRef]
- Reichenbach, P.; Busca, C.; Mondini, A.C.; Rossi, M. The Influence of Land Use Change on Landslide Susceptibility Zonation: The Briga Catchment Test Site (Messina, Italy). Environ. Manag. 2014, 54, 1372–1384. [Google Scholar] [CrossRef]
- Javidan, N.; Kavian, A.; Pourghasemi, H.R.; Conoscenti, C.; Jafarian, Z.; Rodrigo-Comino, J. Evaluation of Multi-Hazard Map Produced Using MaxEnt Machine Learning Technique. Sci. Rep. 2021, 11, 6496. [Google Scholar] [CrossRef]
- Soucy La Roche, R.; Godin, L.; Cottle, J.M.; Kellett, D.A. Tectonometamorphic Evolution of the Tip of the Himalayan Metamorphic Core in the Jajarkot Klippe, West Nepal. J. Metamorph. Geol. 2019, 37, 239–269. [Google Scholar] [CrossRef]
- Baral, B.; Pokharel, A.; Basnet, D.R.; Magar, G.B.; Shah, K.B. A First Photographic Record of a Yellow-Bellied Weasel Mustela Kathiah Hodgson, 1835 (Mammalia: Carnivora: Mustelidae) from Western Nepal. J. Threat. Taxa 2019, 11, 14753–14756. [Google Scholar] [CrossRef]
- Shahi, Y.B.; Kadel, S.; Dangi, H.; Adhikari, G.; KC, D.; Paudyal, K.R. Geological Exploration, Landslide Characterization and Susceptibility Mapping at the Boundary between Two Crystalline Bodies in Jajarkot, Nepal. Geotechnics 2022, 2, 1059–1083. [Google Scholar] [CrossRef]
- KC, R.; Pokhrel, R.; Acharya, P.; Sharma, K.; Subedi, M.; Bhandari, S.; Lamichhane, K. Geotechnical Assessment of the 2023 Jajarkot Nepal Earthquake Using Field Observations and Remote Sensing. Bull. Earthq. Eng. 2025, 1–25. [Google Scholar] [CrossRef]
- Yang, X.; Liu, R.; Yang, M.; Chen, J.; Liu, T.; Yang, Y.; Chen, W.; Wang, Y. Incorporating Landslide Spatial Information and Correlated Features among Conditioning Factors for Landslide Susceptibility Mapping. Remote Sens. 2021, 13, 2166. [Google Scholar] [CrossRef]
- Li, Z.; Zhu, C.; Gold, C. Digital Terrain Modeling: Principles and Methodology; CRC Press: Boca Raton, FL, USA, 2004; ISBN 0429205074. [Google Scholar]
- Moore, I.D.; Grayson, R.B. Terrain-based Catchment Partitioning and Runoff Prediction Using Vector Elevation Data. Water Resour. Res. 1991, 27, 1177–1191. [Google Scholar] [CrossRef]
- Pradhan, B.; Lee, S. Landslide Susceptibility Assessment and Factor Effect Analysis: Backpropagation Artificial Neural Networks and Their Comparison with Frequency Ratio and Bivariate Logistic Regression Modelling. Environ. Model. Softw. 2010, 25, 747–759. [Google Scholar] [CrossRef]
- Karra, K.; Kontgis, C.; Statman-Weil, Z.; Mazzariello, J.C.; Mathis, M.; Brumby, S.P. Global Land Use/Land Cover with Sentinel 2 and Deep Learning. In Proceedings of the 2021 IEEE International Geoscience and Remote Sensing Symposium IGARSS, Brussels, Belgium, 11–16 July 2021; IEEE: Piscataway, NJ, USA, 2021; pp. 4704–4707. [Google Scholar]
- Tien Bui, D.; Tuan, T.A.; Klempe, H.; Pradhan, B.; Revhaug, I. Spatial Prediction Models for Shallow Landslide Hazards: A Comparative Assessment of the Efficacy of Support Vector Machines, Artificial Neural Networks, Kernel Logistic Regression, and Logistic Model Tree. Landslides 2016, 13, 361–378. [Google Scholar] [CrossRef]
- Sujatha, E.R.; Sridhar, V. Landslide Susceptibility Analysis: A Logistic Regression Model Case Study in Coonoor, India. Hydrology 2021, 8, 41. [Google Scholar] [CrossRef]
- Cama, M.; Conoscenti, C.; Lombardo, L.; Rotigliano, E. Exploring Relationships between Grid Cell Size and Accuracy for Debris-Flow Susceptibility Models: A Test in the Giampilieri Catchment (Sicily, Italy). Environ. Earth Sci. 2016, 75, 238. [Google Scholar] [CrossRef]
- Arabameri, A.; Saha, S.; Roy, J.; Chen, W.; Blaschke, T.; Tien Bui, D. Landslide Susceptibility Evaluation and Management Using Different Machine Learning Methods in the Gallicash River Watershed, Iran. Remote Sens. 2020, 12, 475. [Google Scholar] [CrossRef]
- Reiss, H.; Cunze, S.; König, K.; Neumann, H.; Kröncke, I. Species Distribution Modelling of Marine Benthos: A North Sea Case Study. Mar. Ecol. Prog. Ser. 2011, 442, 71–86. [Google Scholar]
- Shi, J. Engineering Application of Landslide Susceptibility Mapping in Linear Engineering Optimization. Front. Earth Sci. 2022, 10, 861057. [Google Scholar] [CrossRef]
- Wang, Q.; Wang, D.; Huang, Y.; Wang, Z.; Zhang, L.; Guo, Q.; Chen, W.; Chen, W.; Sang, M. Landslide Susceptibility Mapping Based on Selected Optimal Combination of Landslide Predisposing Factors in a Large Catchment. Sustainability 2015, 7, 16653–16669. [Google Scholar] [CrossRef]
- Du, G.; Zhang, Y.; Iqbal, J.; Yang, Z.; Yao, X. Landslide Susceptibility Mapping Using an Integrated Model of Information Value Method and Logistic Regression in the Bailongjiang Watershed, Gansu Province, China. J. Mt. Sci. 2017, 14, 249–268. [Google Scholar]
- Pacheco Quevedo, R.; Velastegui-Montoya, A.; Montalván-Burbano, N.; Morante-Carballo, F.; Korup, O.; Daleles Rennó, C. Land Use and Land Cover as a Conditioning Factor in Landslide Susceptibility: A Literature Review. Landslides 2023, 20, 967–982. [Google Scholar] [CrossRef]
- Zhao, J.; Wang, Z.; Dong, Y.; Yang, Z.; Govers, G. How Soil Erosion and Runoff Are Related to Land Use, Topography and Annual Precipitation: Insights from a Meta-Analysis of Erosion Plots in China. Sci. Total Environ. 2022, 802, 149665. [Google Scholar] [CrossRef]
- Pathak, L.; Joshi, K.; Ghimire, P. Estimation of Soil Erosion Using the Revised Universal Soil Loss Equation (RUSLE) in Relation to Landslides in Mid-Hills of Nepal. J. Environ. Sci. 2023, 9, 82–93. [Google Scholar] [CrossRef]
- Weiss, A. Topographic Position and Landforms Analysis. In Proceedings of the Poster Presentation, ESRI User Conference, San Diego, CA, USA, 9–13 July 2001; Volume 200. [Google Scholar]
- Li, H.; Song, K.; Zhai, X.; Liang, M. Landslide Susceptibility Mapping Using Multiple Combination Weighting Determination: A Case Study of Collector Roads in Pingshan County, Hebei Province, China. Front. Earth Sci. (Lausanne) 2024, 12, 1403830. [Google Scholar]
- Giordan, D.; Cignetti, M.; Baldo, M.; Godone, D. Relationship between Man-Made Environment and Slope Stability: The Case of 2014 Rainfall Events in the Terraced Landscape of the Liguria Region (Northwestern Italy). Geomat. Nat. Hazards Risk 2017, 8, 1833–1852. [Google Scholar]
- Chen, Z.; Ye, F.; Fu, W.; Ke, Y.; Hong, H. The Influence of DEM Spatial Resolution on Landslide Susceptibility Mapping in the Baxie River Basin, NW China. Nat. Hazards 2020, 101, 853–877. [Google Scholar]
- Claessens, L.; Heuvelink, G.B.M.; Schoorl, J.M.; Veldkamp, A. DEM Resolution Effects on Shallow Landslide Hazard and Soil Redistribution Modelling. Earth Surf. Process. Landf. J. Br. Geomorphol. Res. Group. 2005, 30, 461–477. [Google Scholar]


| S.N. | Conditioning Factor | VIF (With TRI) | VIF (Without TRI) |
|---|---|---|---|
| 1. | Aspect | 1.01 | 1.01 |
| 2. | Elevation | 2.74 | 2.72 |
| 3. | Profile curvature | 2.13 | 2.09 |
| 4. | Plane curvature | 2.46 | 2.35 |
| 5. | Slope | 15.72 | 1.41 |
| 6. | TPI | 1.99 | 1.99 |
| 7. | Proximity to rivers | 1.67 | 1.63 |
| 8. | Drainage density | 1.73 | 1.74 |
| 9. | SPI | 1.10 | 1.11 |
| 10. | TWI | 2.10 | 2.16 |
| 11. | TRI | 15.09 | - |
| 12. | Proximity to roads | 2.00 | 1.97 |
| 13. | Land use | 1.21 | 1.19 |
| 14. | Proximity to thrust | 1.01 | 1.02 |
| 15. | Dominant soil | 1.54 | 1.59 |
| 16. | Lithology | 1.16 | 1.13 |
| Number of Factors | Selected Factors | Fitness Score (%) |
|---|---|---|
| 4 | Land use, SPI, Lithology, Proximity to rivers | 88.54 |
| 5 | Slope, Land use, SPI, Lithology, Proximity to rivers | 88.61 |
| 6 | Slope, Land use, SPI, Lithology, Proximity to roads, Aspect | 90.62 |
| 7 | Slope, Land use, SPI, Lithology, Proximity to roads, Aspect, Proximity to rivers | 91.03 |
| 8 | Slope, Land use, Drainage density, Dominant soil, Lithology, Proximity to roads, Aspect, Proximity to rivers | 91.26 |
| 9 | Slope, Land use, Elevation, Drainage density, Dominant soil, Lithology, Proximity to Roads, Aspect, Profile curvature | 92.46 |
| 10 | Slope, Land use, Elevation, Drainage density, Dominant soil, Lithology, Proximity to roads, Aspect, Profile curvature, Elevation | 92.03 |
| 11 | Slope, Land use, Lithology, Proximity to roads, Aspect, Proximity to rivers, Plane curvature, Proximity to thrust, SPI, TWI, Elevation | 89.98 |
| 12 | Slope, Land use, Dominant soil, Lithology, Proximity to roads, Aspect, Proximity to rivers, Plane curvature, Proximity to thrust, SPI, TWI, Elevation | 92.81 |
| 13 | Slope, Land use, Drainage density, Lithology, Proximity to roads, Aspect, Proximity to rivers, Plane curvature, Proximity to thrust, SPI, TWI, Elevation, TPI | 90.12 |
| 14 | Slope, Land use, Drainage density, Dominant soil, Lithology, Proximity to roads, Aspect, Proximity to rivers, Plane curvature, Proximity to thrust, TPI, SPI, TWI, Elevation | 91.39 |
| 15 | Slope, Land use, Drainage density, Dominant soil, Lithology, Proximity to roads, Aspect, Proximity to rivers, Profile curvature, Plane curvature, Proximity to thrust, TPI, SPI, TWI, Elevation | 91.46 |
Disclaimer/Publisher’s Note: The statements, opinions and data contained in all publications are solely those of the individual author(s) and contributor(s) and not of MDPI and/or the editor(s). MDPI and/or the editor(s) disclaim responsibility for any injury to people or property resulting from any ideas, methods, instructions or products referred to in the content. |
© 2025 by the authors. Licensee MDPI, Basel, Switzerland. This article is an open access article distributed under the terms and conditions of the Creative Commons Attribution (CC BY) license (https://creativecommons.org/licenses/by/4.0/).
Share and Cite
Pathak, L.; Baral, B.; Joshi, K.; Basnet, D.R.; Godone, D. Landslides in the Himalayas: The Role of Conditioning Factors and Their Resolution in Susceptibility Mapping. Geosciences 2025, 15, 131. https://doi.org/10.3390/geosciences15040131
Pathak L, Baral B, Joshi K, Basnet DR, Godone D. Landslides in the Himalayas: The Role of Conditioning Factors and Their Resolution in Susceptibility Mapping. Geosciences. 2025; 15(4):131. https://doi.org/10.3390/geosciences15040131
Chicago/Turabian StylePathak, Lalit, Badri Baral, Kamana Joshi, Dipak Raj Basnet, and Danilo Godone. 2025. "Landslides in the Himalayas: The Role of Conditioning Factors and Their Resolution in Susceptibility Mapping" Geosciences 15, no. 4: 131. https://doi.org/10.3390/geosciences15040131
APA StylePathak, L., Baral, B., Joshi, K., Basnet, D. R., & Godone, D. (2025). Landslides in the Himalayas: The Role of Conditioning Factors and Their Resolution in Susceptibility Mapping. Geosciences, 15(4), 131. https://doi.org/10.3390/geosciences15040131