Abstract
The present study aims at understanding the role of the structure and the geometry of the weathering profile on the hydrodynamic behavior of hard rock aquifers. We first described 2D geophysical cross sections of weathering profiles realized and validated on an experimental site. Next, we implemented five long-term pumping tests in wells drilled at various locations of these cross sections. Finally, we chose the appropriate analytical solutions to determine the hydrodynamic parameters in consistence with the structure and the geometry of the weathering profile. Results reveal that land covers, weathering type and thickness, presence of no flow boundaries, etc. are all factors that explain the flow regime, which appears therefore much less unpredictable. In other words, the 2D geophysical data are enough to locate the best permeable areas, or the areas where the structure of the aquifer without impervious boundaries and with leakage favor a good long-term behavior of the well. The values of aquifer’s transmissivity vary between 5.10−3 and 4.10−5 m2/s. The storage varies between 0.06 and 7.10−7. The variability of these parameters from site to site reflects the high heterogeneity of hard rock aquifers.
1. Introduction
In the geological context of hard rock, understanding groundwater flow mechanisms still remains a challenge. Most authors consider that the hydrodynamic properties of these geological formations are rather unpredictable at a local scale [1]. However, as difficult as the characterization of hard rock aquifers can be, it remains essential since groundwater aquifers constitute the only available water resource for certain regions with severe climatic conditions [2,3,4]. In recent decades, understanding of fractured hard rock aquifers has increased [5,6,7,8]. The structure of hard rock aquifers resulting from weathering processes, now well described, has been able to explain the origin of their contrasting behaviors [6,8,9]. The statement according to which hard rock aquifers are constituted a weathered fissured layer playing a transmissive function and overlain alloterite and isalterite ensuring a capacitive function [10] is widely accepted. Since this description has been used for the many conceptual geological models that develop under various climatic conditions, it is necessary to know if they are able to correctly describe flow behavior in hard rock aquifers. Many advances are to be noted in the determination of hydrodynamic parameters based on various well-test interpretation techniques. Most of these techniques today use diagnostic plots from the logarithmic derivative drawdown versus time [11,12]. Most commercial and open-source pumping-test interpretation software now provides the option to compute the logarithmic derivative. According to Renard et al. [12], these techniques have many advantages:
- -
- The logarithmic derivative is highly sensitive to subtle variations in the shape of the drawdown curve. It allows detecting behaviors that are difficult to observe on the drawdown curve alone.
- -
- The analysis of the diagnostic plot of a data set facilitates the selection of a conceptual model.
- -
- For certain models, the values of the derivative can directly be used to estimate rapidly the parameters of the model.
Despite these advantages, diagnostic plots cannot resolve the non-unicity problems inherent in the inverse nature of well-test interpretation, which means that interpretation will always require a critical examination of the local geology in terms of geometry, structure and flow conditions in order to provide meaningful results. This means that the preliminary determination of the geological conceptual model is indispensable to any rigorous well-test interpretation. To highlight the relevance of structure and geometry on hydrodynamic behavior in hard rock aquifers, this study is initiated at the experimental site of Sanon in Burkina Faso. The choice of this site is justified by its geology representative of that of the formations of hard rock in West Africa and also by the availability of existing data. We have previously proposed on this site a conceptual model of the weathering profile [8] and on the basis of this model, this paper aims to demonstrate the impact of the structure and the geometry of the weathering profile on the hydrodynamic properties of the aquifer.
In the following sections, we describe the weathering conceptual model of the Sanon experimental site. The methodological approaches adopted for pumping test implementation and data interpretation are then explained. Finally, the appropriate analytical solutions to determine the hydrodynamic parameters in consistence with the structure and the geometry of the weathering profiles are proposed.
2. Study Site
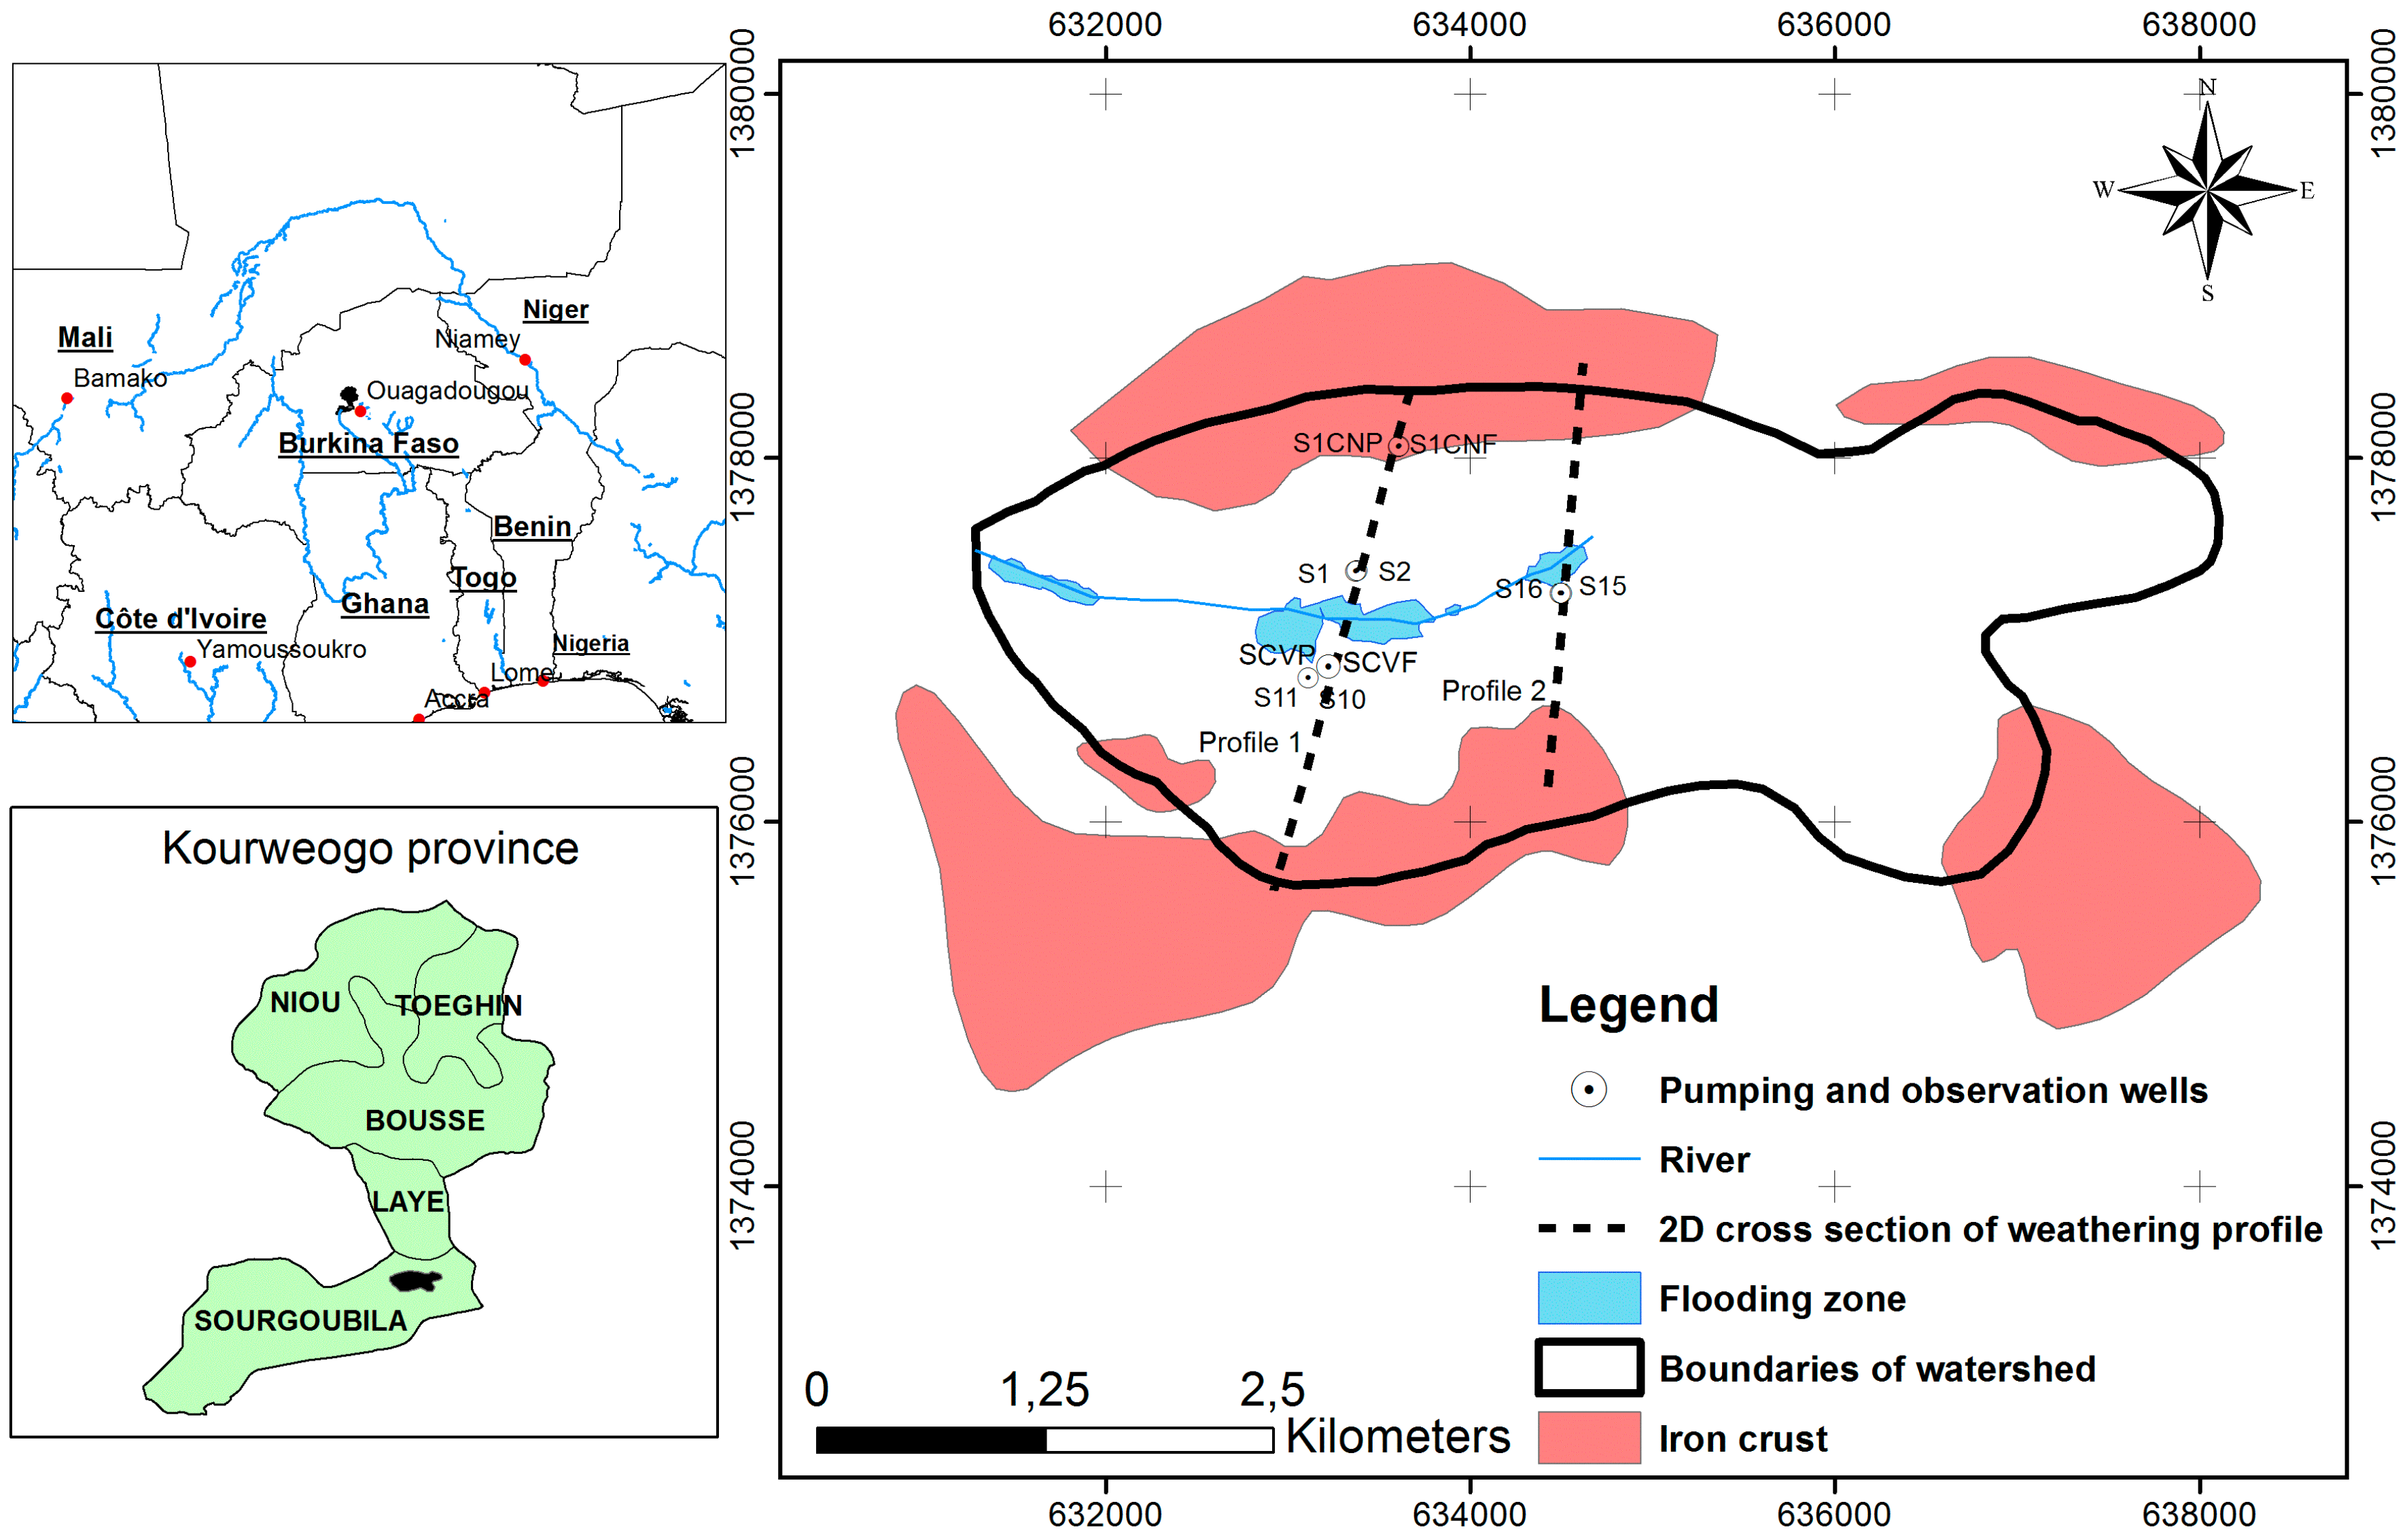
The Sanon experimental site (Figure 1) is located approximately 40 km Northwest of Ouagadougou (the capital city of Burkina Faso). It covers an area of 14 km2. The relief consists of a broad, relatively flat-bottomed valley (elevation about 340 m a.s.l.) surrounded by rather flat lateritic ridges mainly covered by iron crust and elevation between 350 and 370 m a.s.l. The valley drains westwards during the rainy season into the rivers, which converge towards the Nazinon catchment. The local geology of the site is characterized by a patchwork of migmatite, gneiss and granite, and green rocks [13].
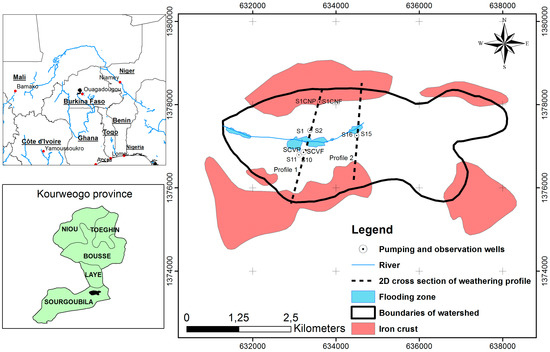
Figure 1.
Location of the Sanon experimental site showing boreholes used for well test, profile sections within the catchment.
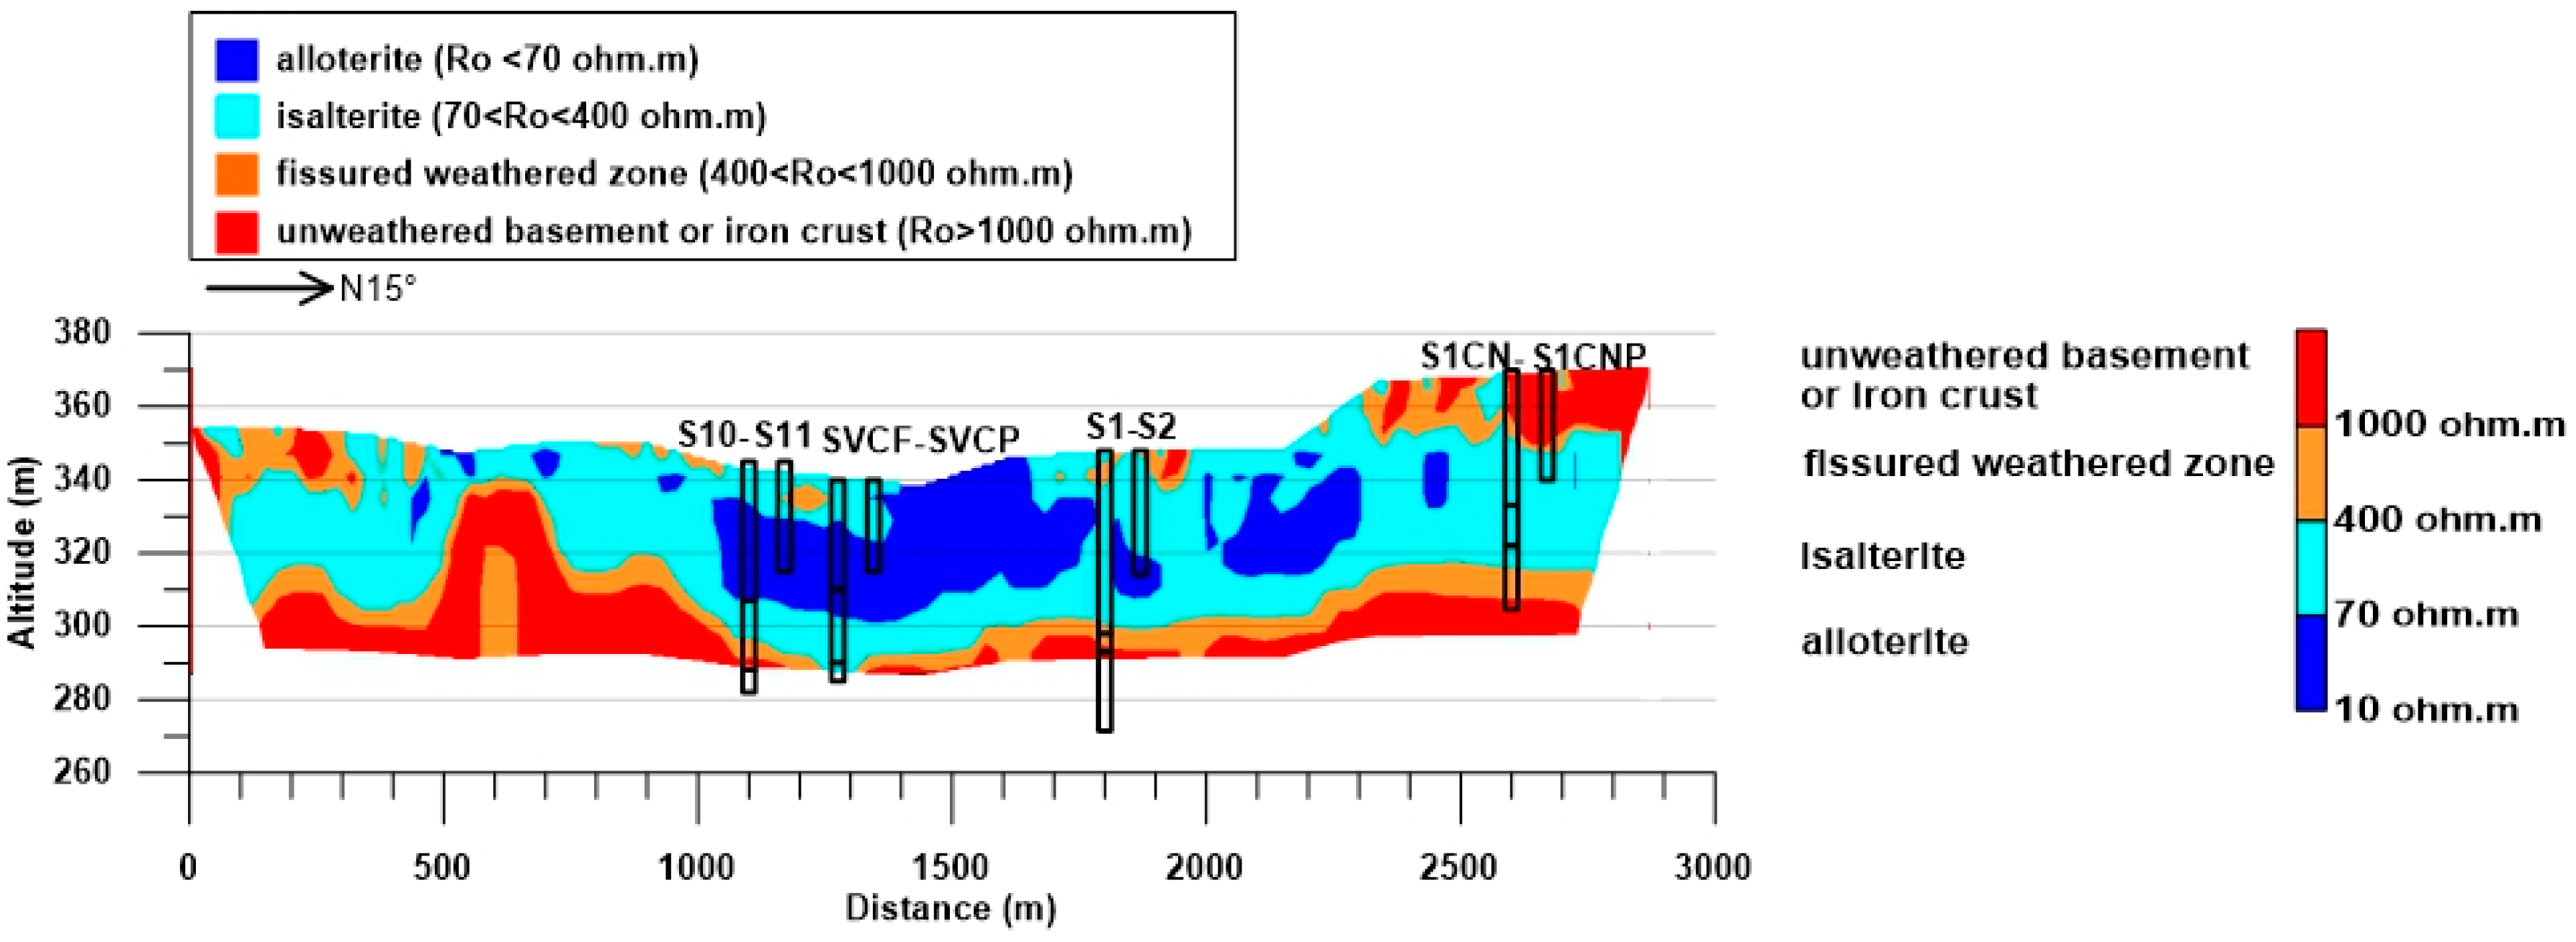
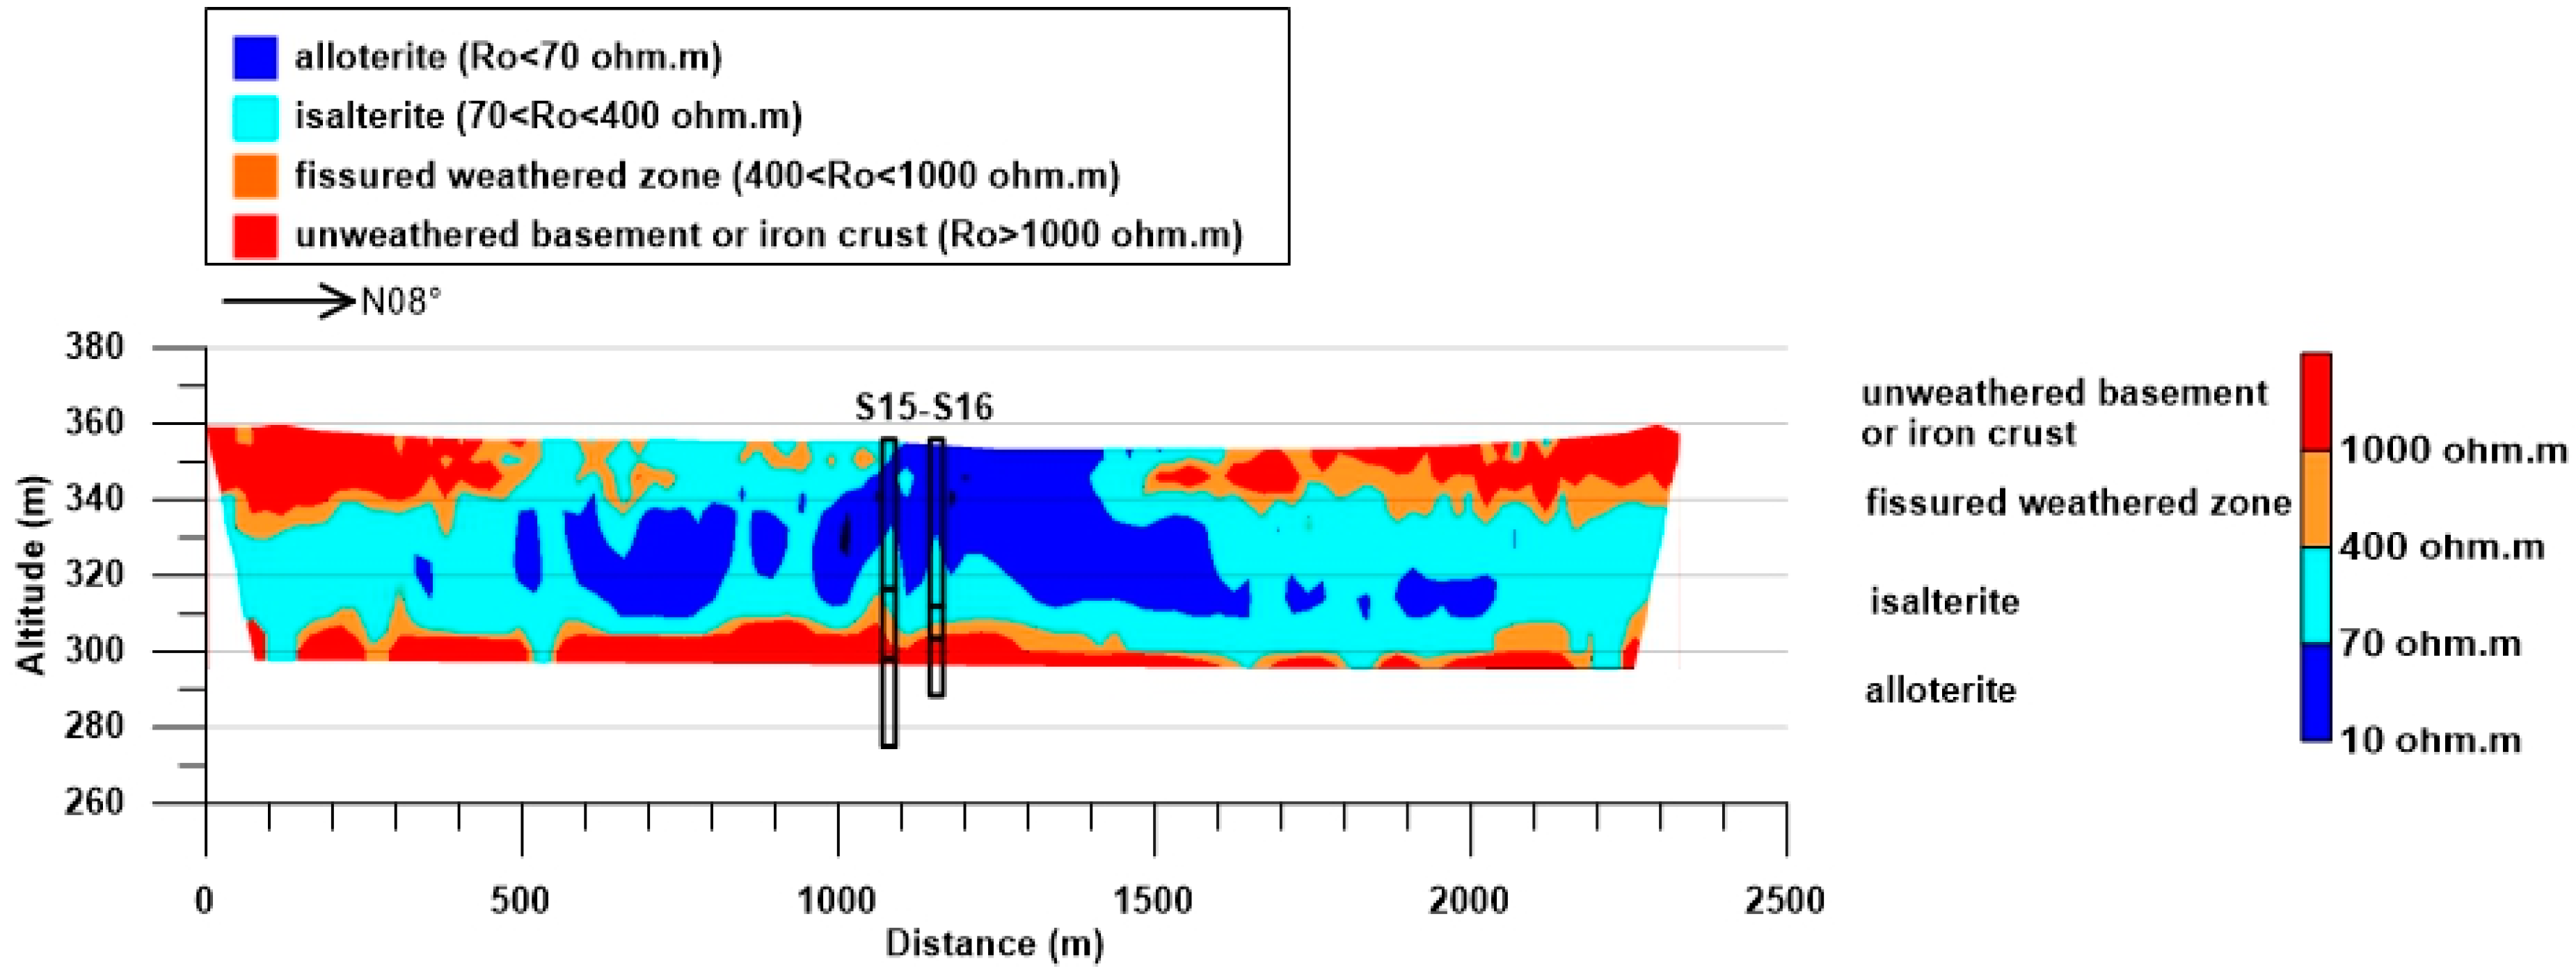
The recent study on the Sanon site [8] developed two 2D geophysical cross sections clustered according to the resistivity ranges corresponding to the “saprolite”, “fissured” and “unweathered rock” layers obtained from the electrical logs. The integrated hydrogeological and geophysical approach, using information acquired at different scales, reveals that the weathering profiles (Figure 1 and Figure 2) observed on two transects (from ridge to ridge) includes from the top to the bottom: the presence of four layers corresponding to the classical conceptual model for basement rocks, namely alloterite and isalterite layers which together form the “saprolite”, a weathered fissured layer and the unweathered basement. The resistive cover (resistivity greater than 1000 Ω·m) is due to the presence of an iron crust on the ridge, whereas in the valley it corresponds to lateritic dry sand. The iron crust, which outcrops on ridges, protects against dismantling.
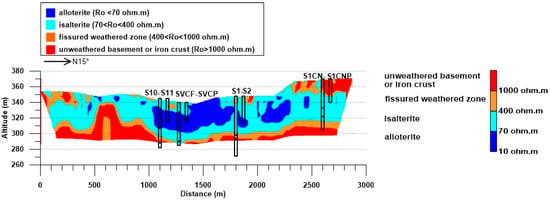
Figure 2.
Profile 1: geological model showing different parts (and related electrical resistivity values) of the weathering profile and well-test locations (modified from Soro et al. [8]).
Profile 1 (Figure 2), which is 2800 m long, is mainly characterized by a high thickness weathered layer in the central valley, by the presence of iron crust blocks especially at ridges and by the presence of a high elevation of the unweathered rock toward the southern ridge. Profile 2 (Figure 3), located slightly upstream in the catchment and 2400 m long, joins the northern and southern ridges of the catchment through a flooding area in the central valley. It is mainly characterized by a very clayey upper layer in the center and by iron crust at the ridges.
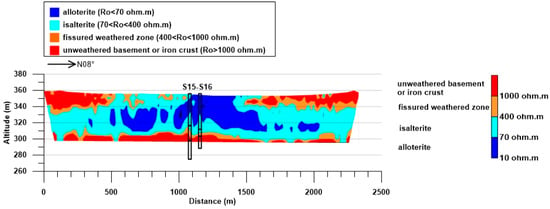
Figure 3.
Profile 2: geological model showing different parts (and related electrical resistivity values) of the weathering profile and well-test location (modified from Soro et al. [8]).
With the exception of some local anomalies (a high elevation of the unweathered rock from x = 500 to 800 m on Figure 2), the bottom of the weathering profile is rather flat, at an elevation between 290 and 310 m a.s.l. The iron crust is only present below the ridges where its thickness can, reach up to 20–30 m a.s.l., and where the alloterite is much thinner.
3. Materials and Methods
The methodological approach involved well-test implementation at different locations of each profile and interpreting the induced hydrodynamic behavior according to the weathering profile structure and geometry. On Profile 1 (Figure 2), four couples of boreholes, each consisting of a deep pumping well and a shallow observation well, are drilled at various locations: the couple S1CN/S1CNP on the north ridge are covered by high thicknesses of iron crust, the couple S1/S2 in the valley, preferential zone of recharge are characterized by a significant thickness of weathering where a piezometric dome is observed, the couple SVCF/SVCP in the center of the catchment where, during the winter period, the main surface runoff occurred are characterized by a considerable thickness of clayey saprolite; the couple S10/S11 near the resistant structure are observed towards the south ridge.
On Profile 2 (Figure 3), the couple S15/S16 are drilled in the central valley closed to the flooding area.
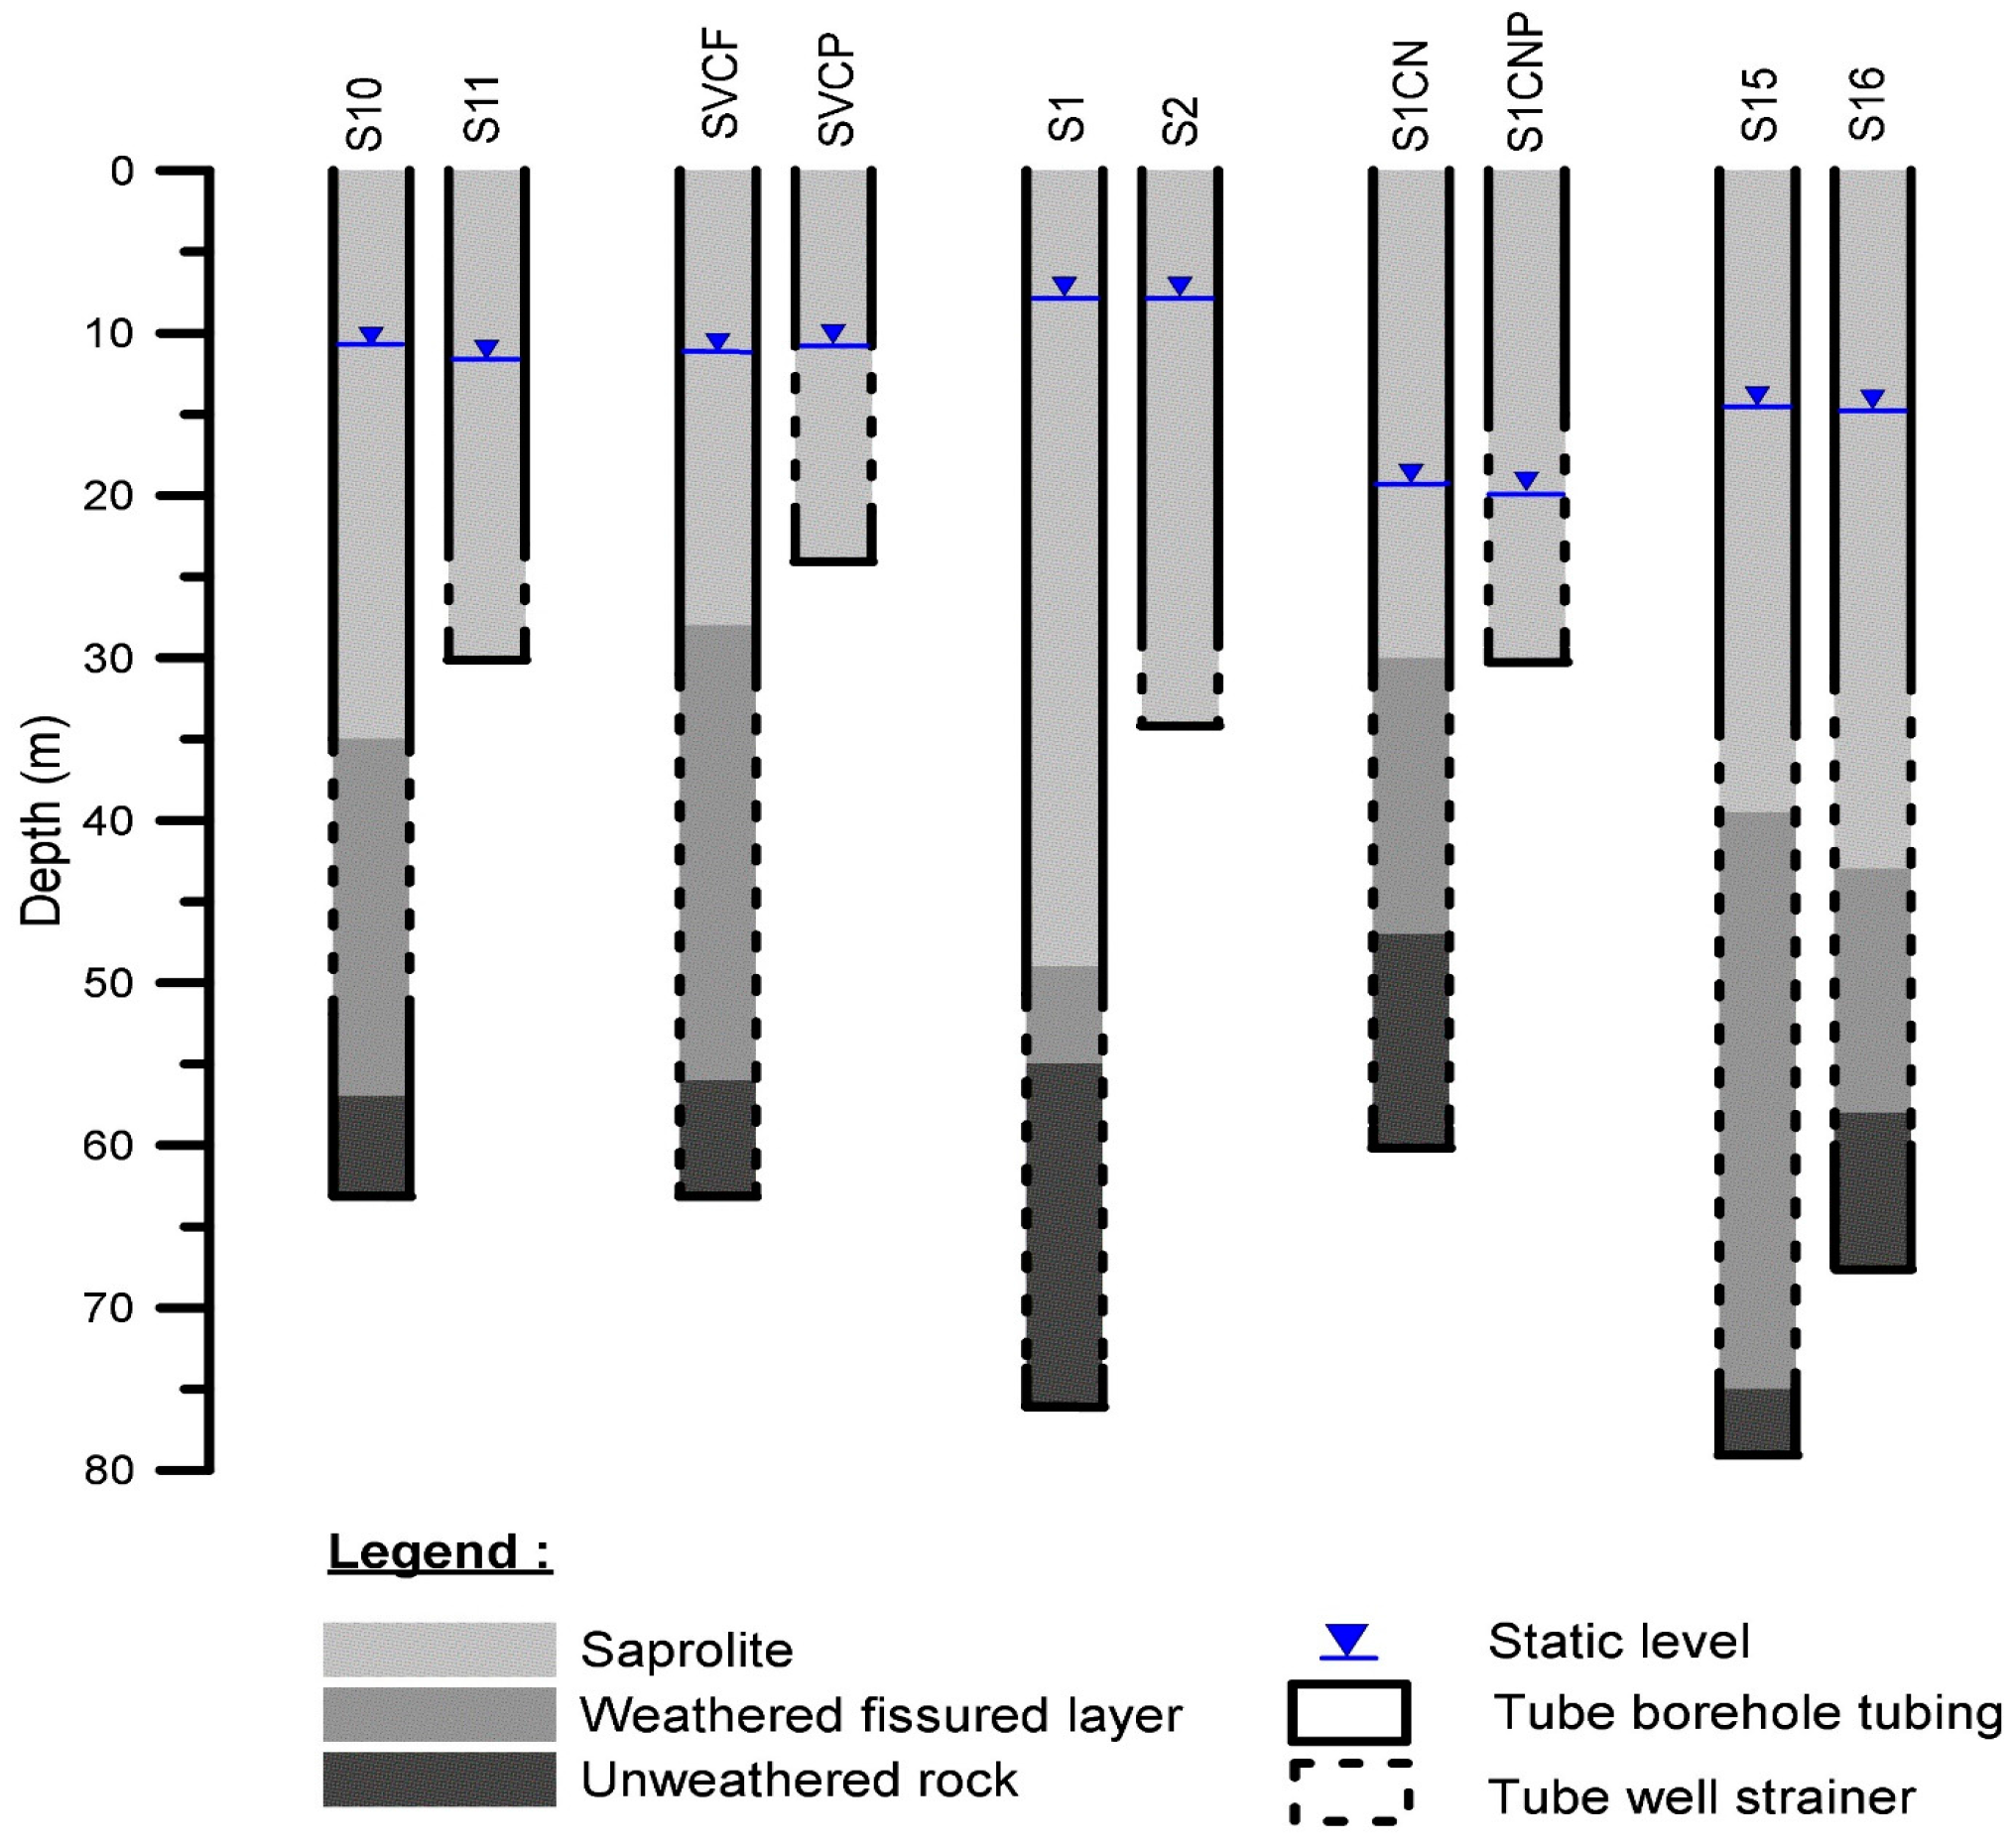
All the boreholes used for well tests have variable geometry in terms of total depth. The deep boreholes reach the unweathered basement and the shallow ones only tap the weathered layer. The following figure (Figure 4) gives more details concerning the boreholes characteristics.
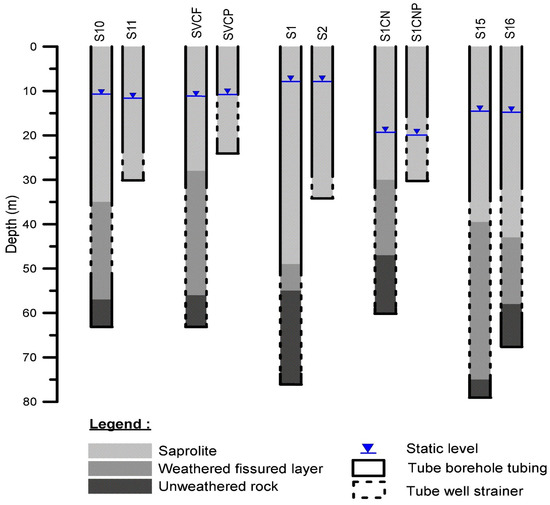
Figure 4.
Boreholes used for well tests showing the weathering profile, the total depth and position of screens.
3.1. Well Test Implementation
The characterization of the hydrodynamic parameters of an aquifer is commonly carried out by a conventional pumping test [14]. We therefore conducted five constant rate well tests in wells S1CN, S1, SVCF, S10 and S15 (Table 1) in order to quantitatively assess the characteristics of the aquifer at these locations where no long-term well test has ever been conducted. The drawdown versus time is measured both in pumping and nearby observation wells. At the end of each pumping, the recovery is followed both in pumping and observation wells until 90% of the drawdown is recovered.

Table 1.
Well test characteristics.
3.2. Pumping Test Data Interpretation
Field data interpretation consists of identifying the aquifer properties, its flow regime and its boundaries. Mathematically, this implies comparing the responses of the aquifer to a theoretical model, which will allow reproducing the drawdowns obtained during the test. This model represents a solution of the diffusivity equation (Equation (1)) in radial coordinates centered on the pumping well:
where
- r (m) is radial distance;
- h (m) is head;
- S (dimensionless) is storativity;
- T (m2/s) is transmissivity.
The solution of this equation developed by Theis [15] in which t (s) expresses the pumping time is as follows (Equation (2)):
Equation (2) is simplified by Cooper and Jacob [16] as follows (Equation (3)):
where
- s (m) is drawdown;
- r (m) is radial distance;
- Q (m3/s) is pumping rate;
- t (s) is time;
- S (dimensionless) is storativity;
- T (m2/s) is transmissivity.
Theis [15] and Copper and Jacob [16] solutions are the most widely used for the interpretation of pumping tests, although they are not suitable for all aquifers. The method we used is that of the logarithmic derivative of the drawdown. This method originally applied in petroleum prospecting [17] is increasingly used by hydrogeologists and is well described in the literature [12]. It provides guidance in the choice of the solution to be used for better interpretation and is particularly useful for complex media such as fractured hard rock aquifers.
• Logarithmic derivative computing
The logarithmic derivative of the drawdown (Equation (4)) is calculated from a discrete series of drawdowns si and instants ti by the equation below (Equation (5)):
This approximation is associated with the time tm corresponding to the center of the time interval (determined as the arithmetic mean tm = (ti + t(i−1))/2, or geometric mean tm = (ti t(i−1))1/2 of the successive time values). The derivative of the drawdown versus time is then plotted in a semi-logarithmic or bi-logarithmic graph.
• Derivative smoothing
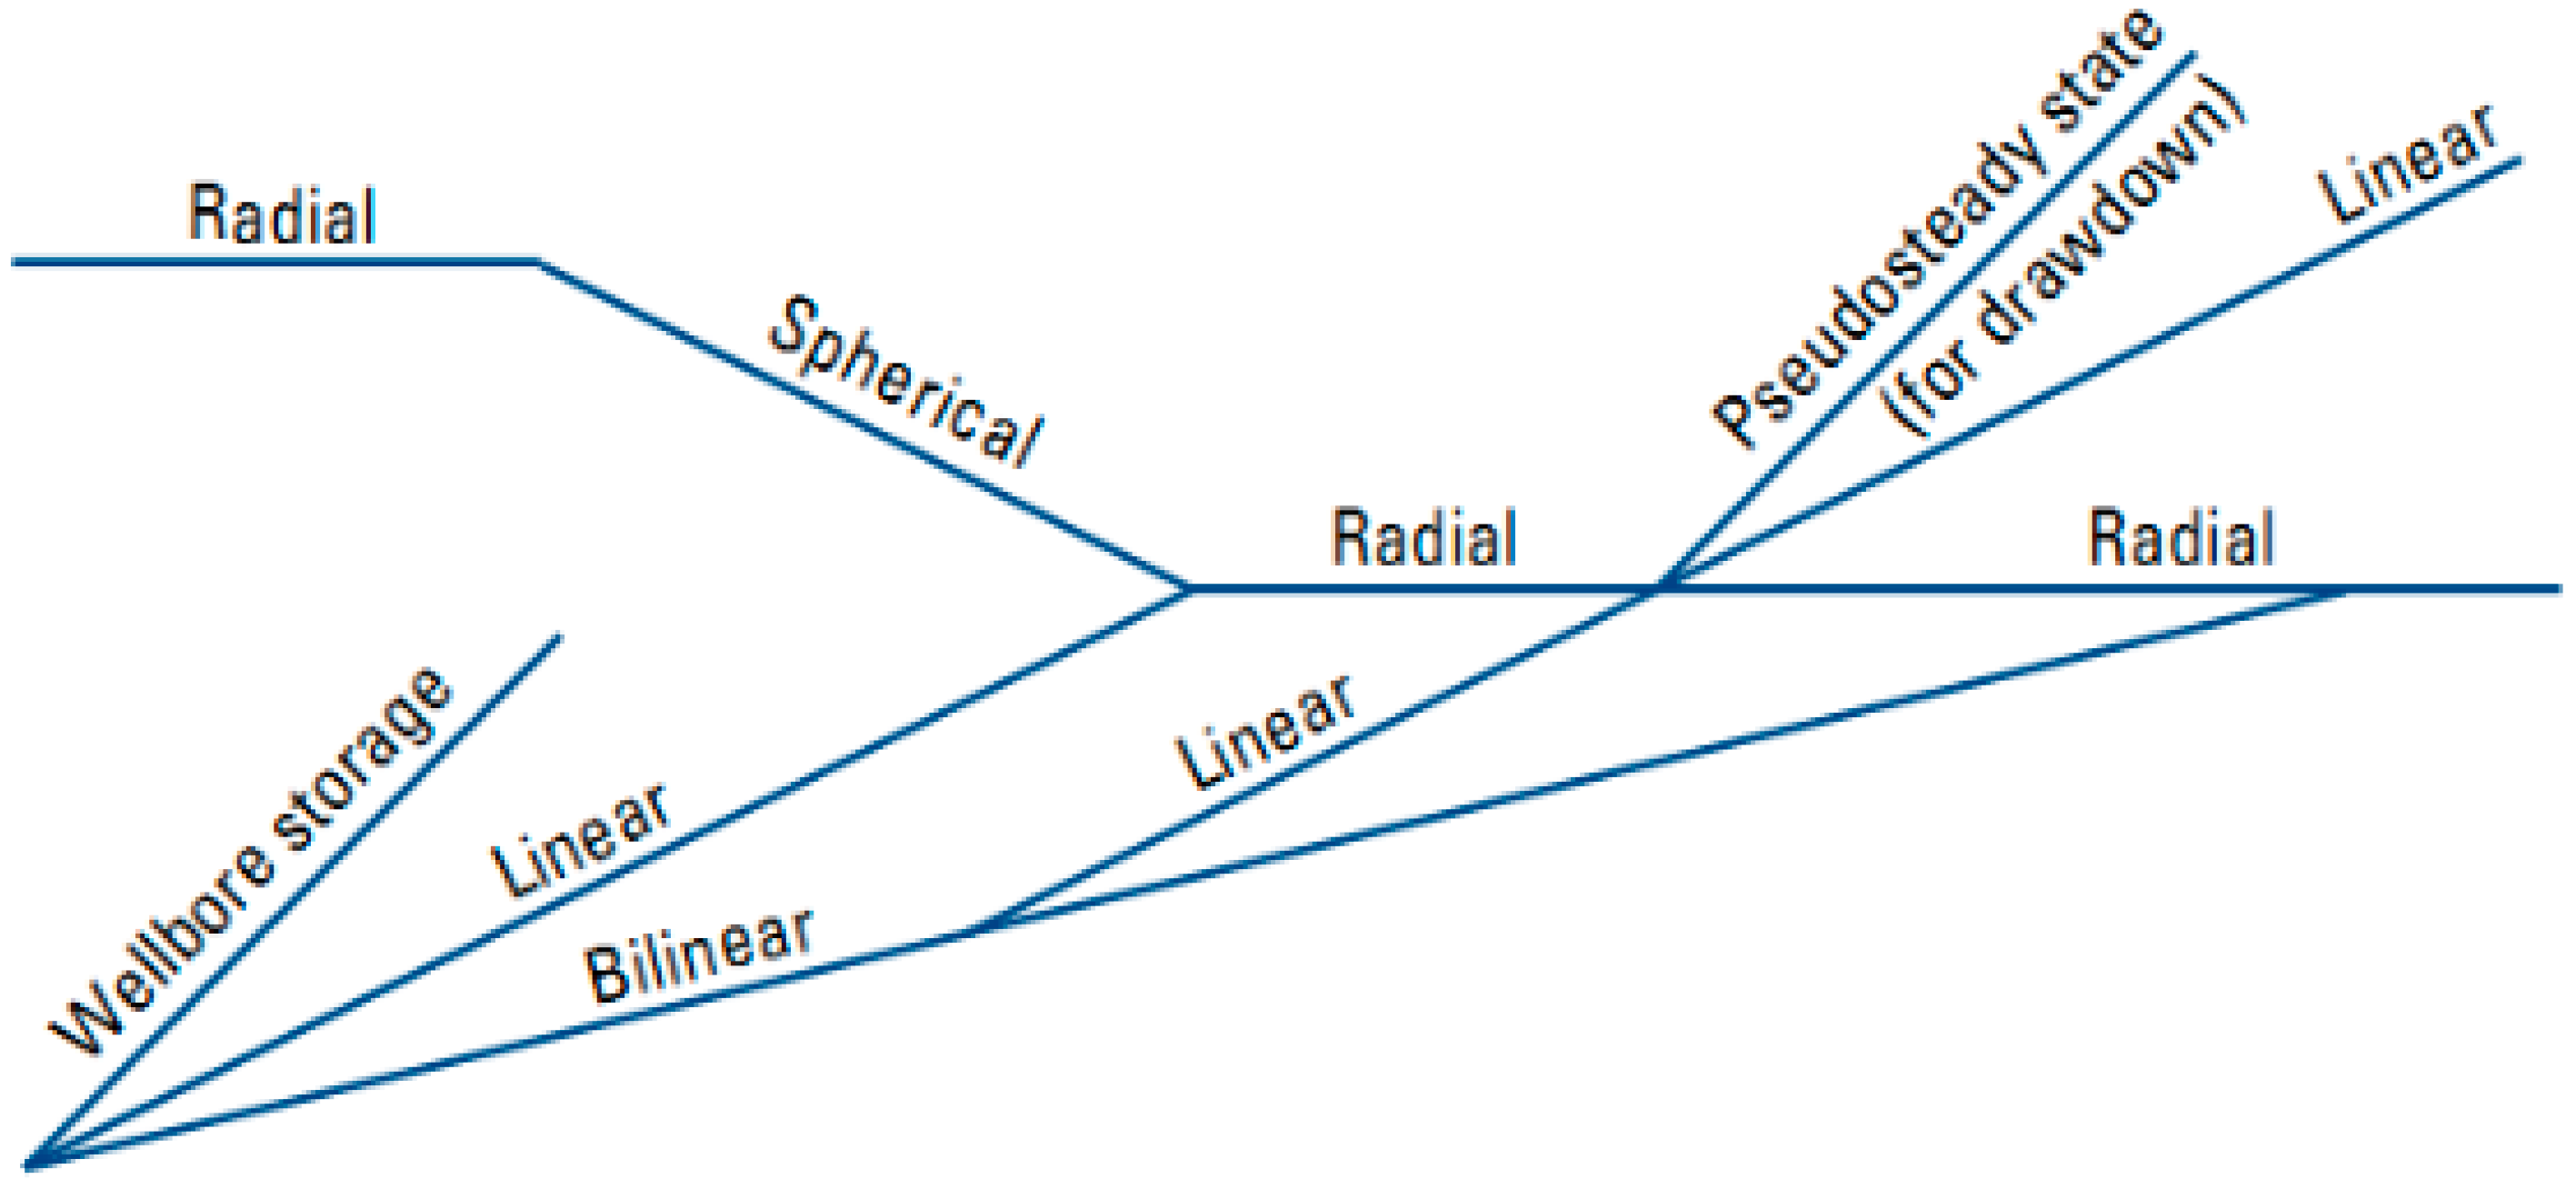
When the variation between two instants of measurements ti and t(i−1) is important, the measured drawdowns are affected by the measurement uncertainties. The derivative curve then becomes “noisy”, meaning that it has too many variations, making its interpretation difficult. In this study, whenever necessary, the derivative has been corrected by smoothing on the basis of an algorithm developed by Bourdet et al. [18]. This method performs the computation of the derivative by considering a series of instant ti separated logarithmically. The analysis of the derivative allows identifying flow regimes. These represent the geometry of the flow streamlines in the tested formation. The diagram (Figure 5) established by Ehlig-Economides et al. [17], which represents the various flow regimes in a bilogarithmic scale, allowed their identification. The diagnostic plots (in Appendix A, Figure A1) representing simultaneously the drawdown and the derivative of the drawdown facilitated the choice of the aquifer conceptual model as well as that of the appropriate analytical solution for the interpretation of each test. The selection of the model and the solution is assisted by the data collected by the geosciences [11]. The geological information available through the 2D weathering profile thus makes it possible to validate these choices. To overcome the head losses issues induced by the pumping, we have prioritized the interpretation of drawdown data measured in the observation wells.
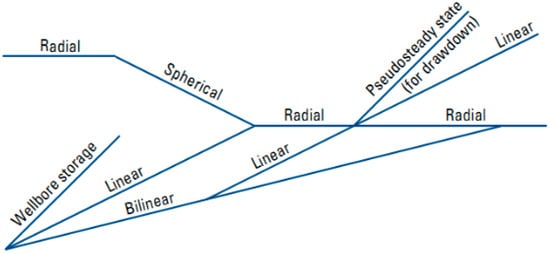
Figure 5.
Flow regime identification tool. Reproduced with permission by the Oil & Gas journal from [17].
4. Results
In this section, we present for each pumping site the results from the interpretation of the pumping data in consistence with the structure and the geometry of the weathering profiles. The link between the hydrodynamic results and data about the structure of the aquifer is discussed.
4.1. Pumping Test S1CN/S1CNP
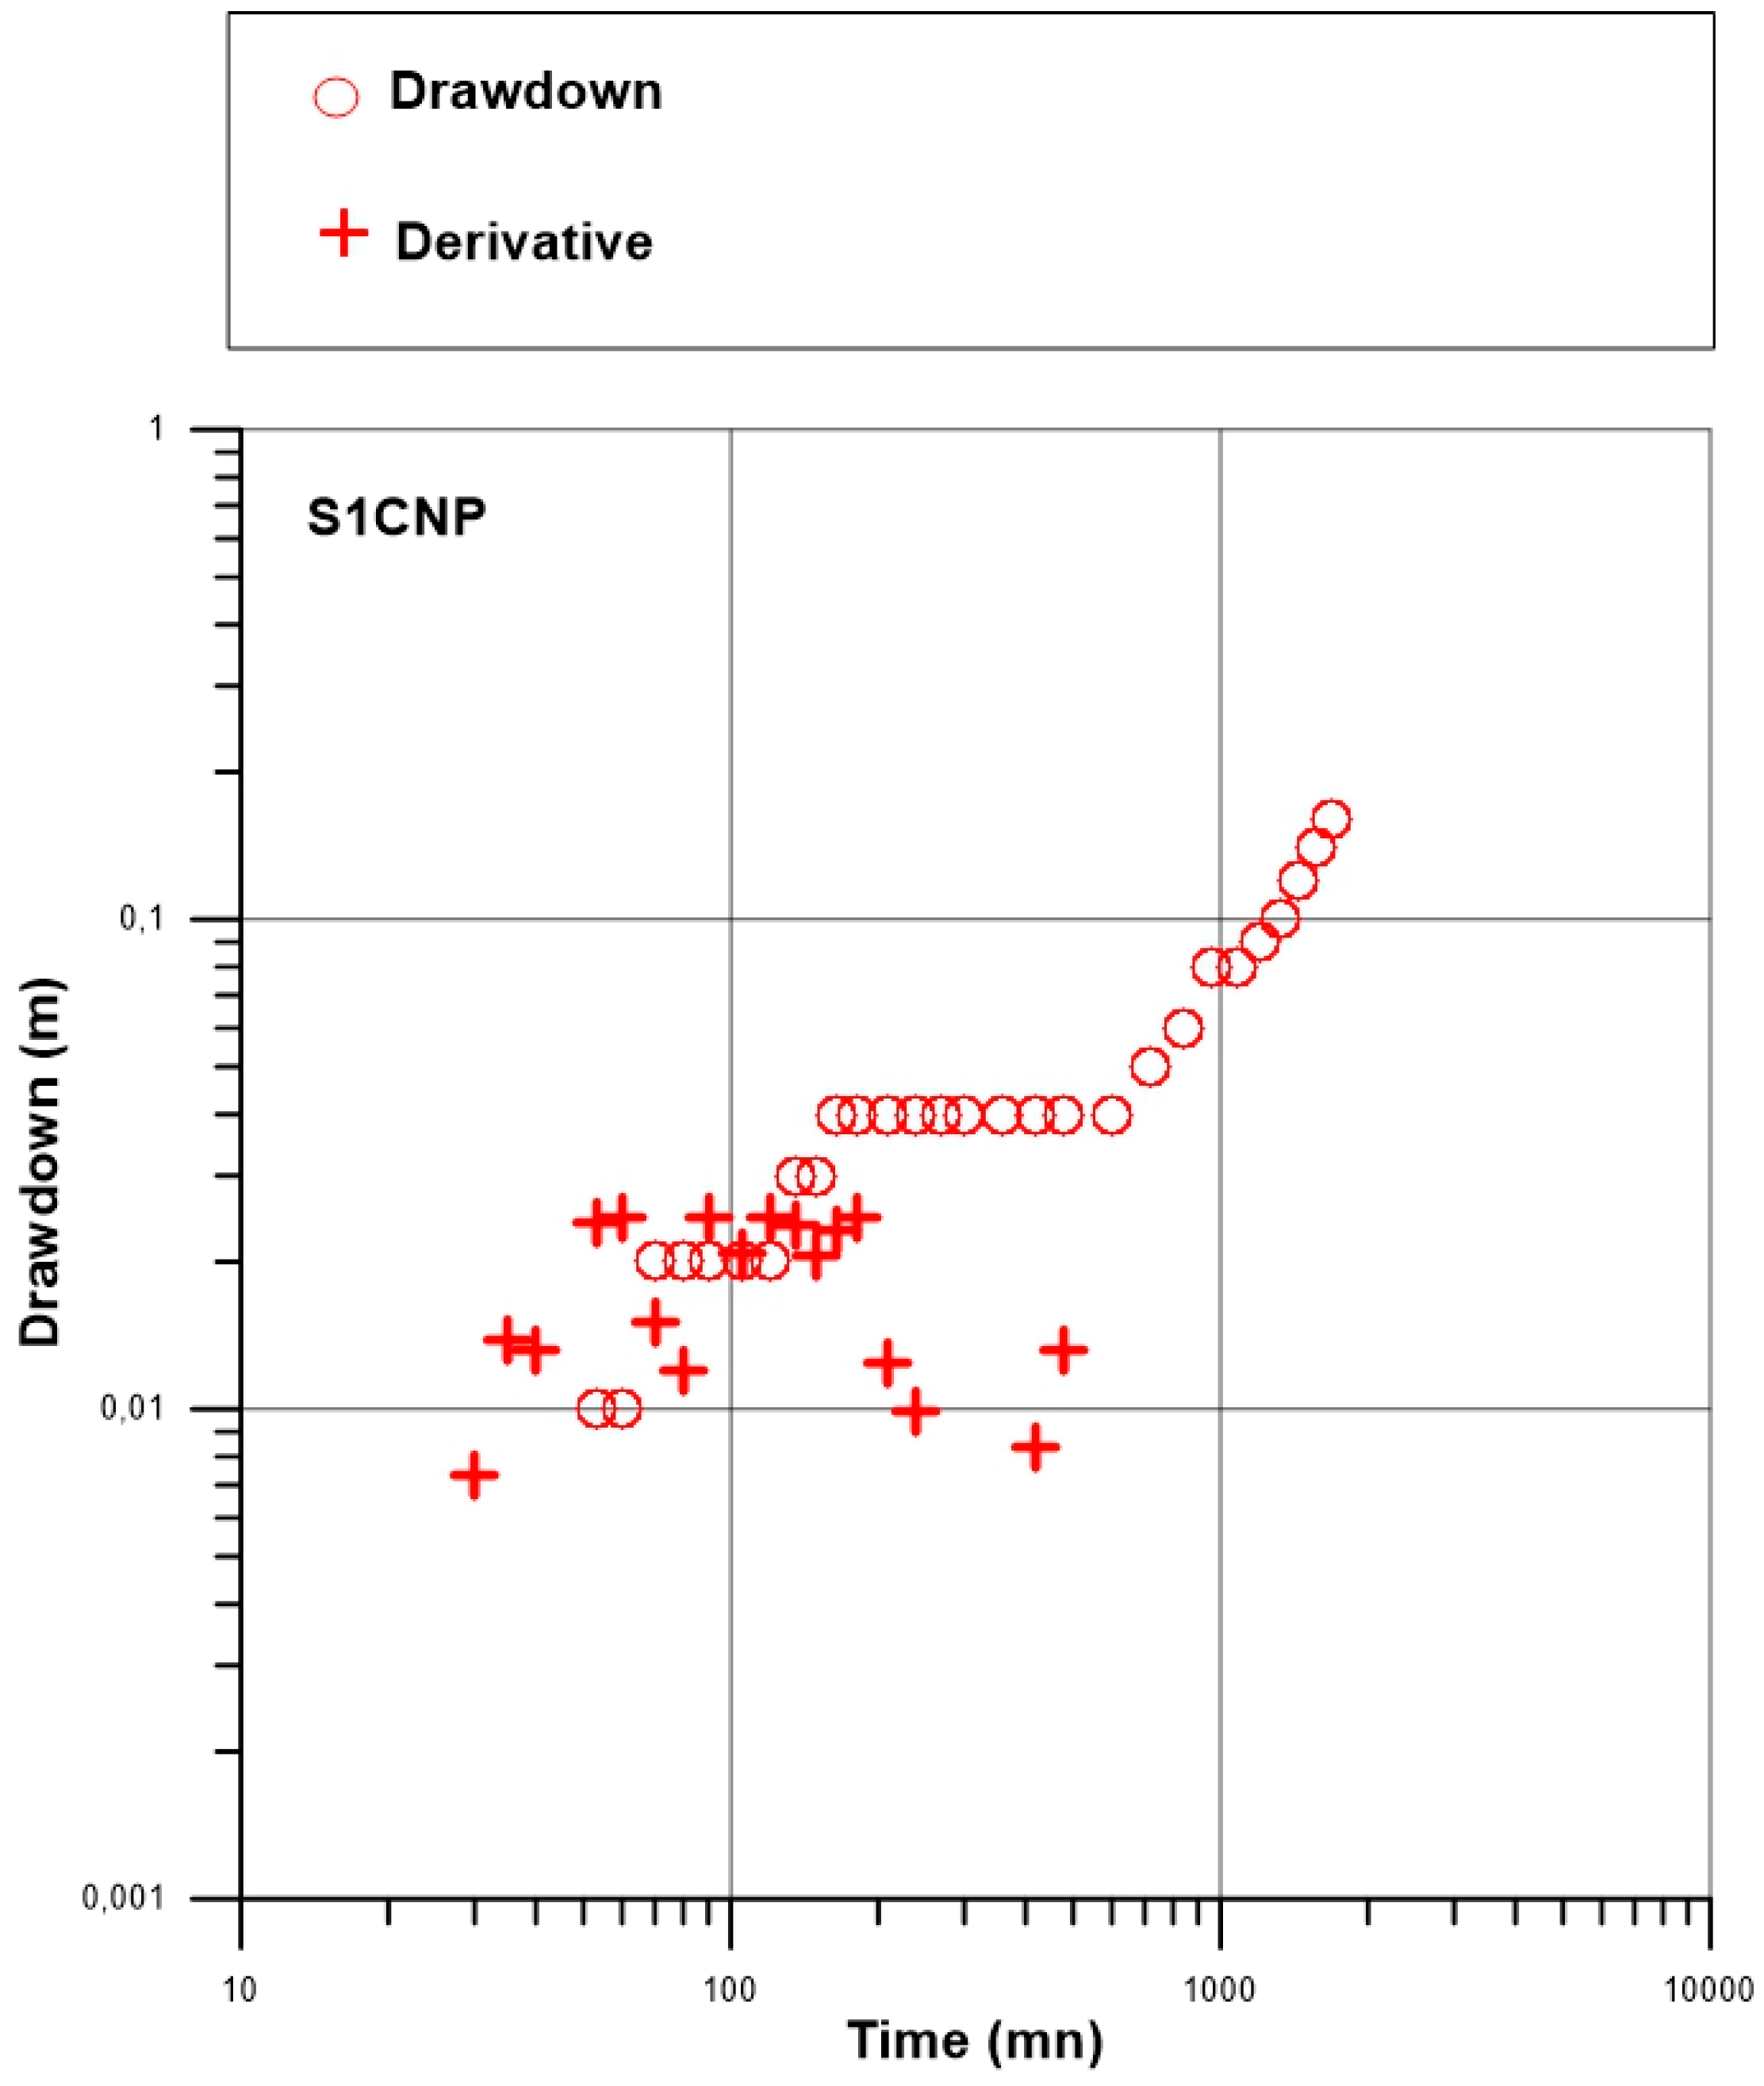
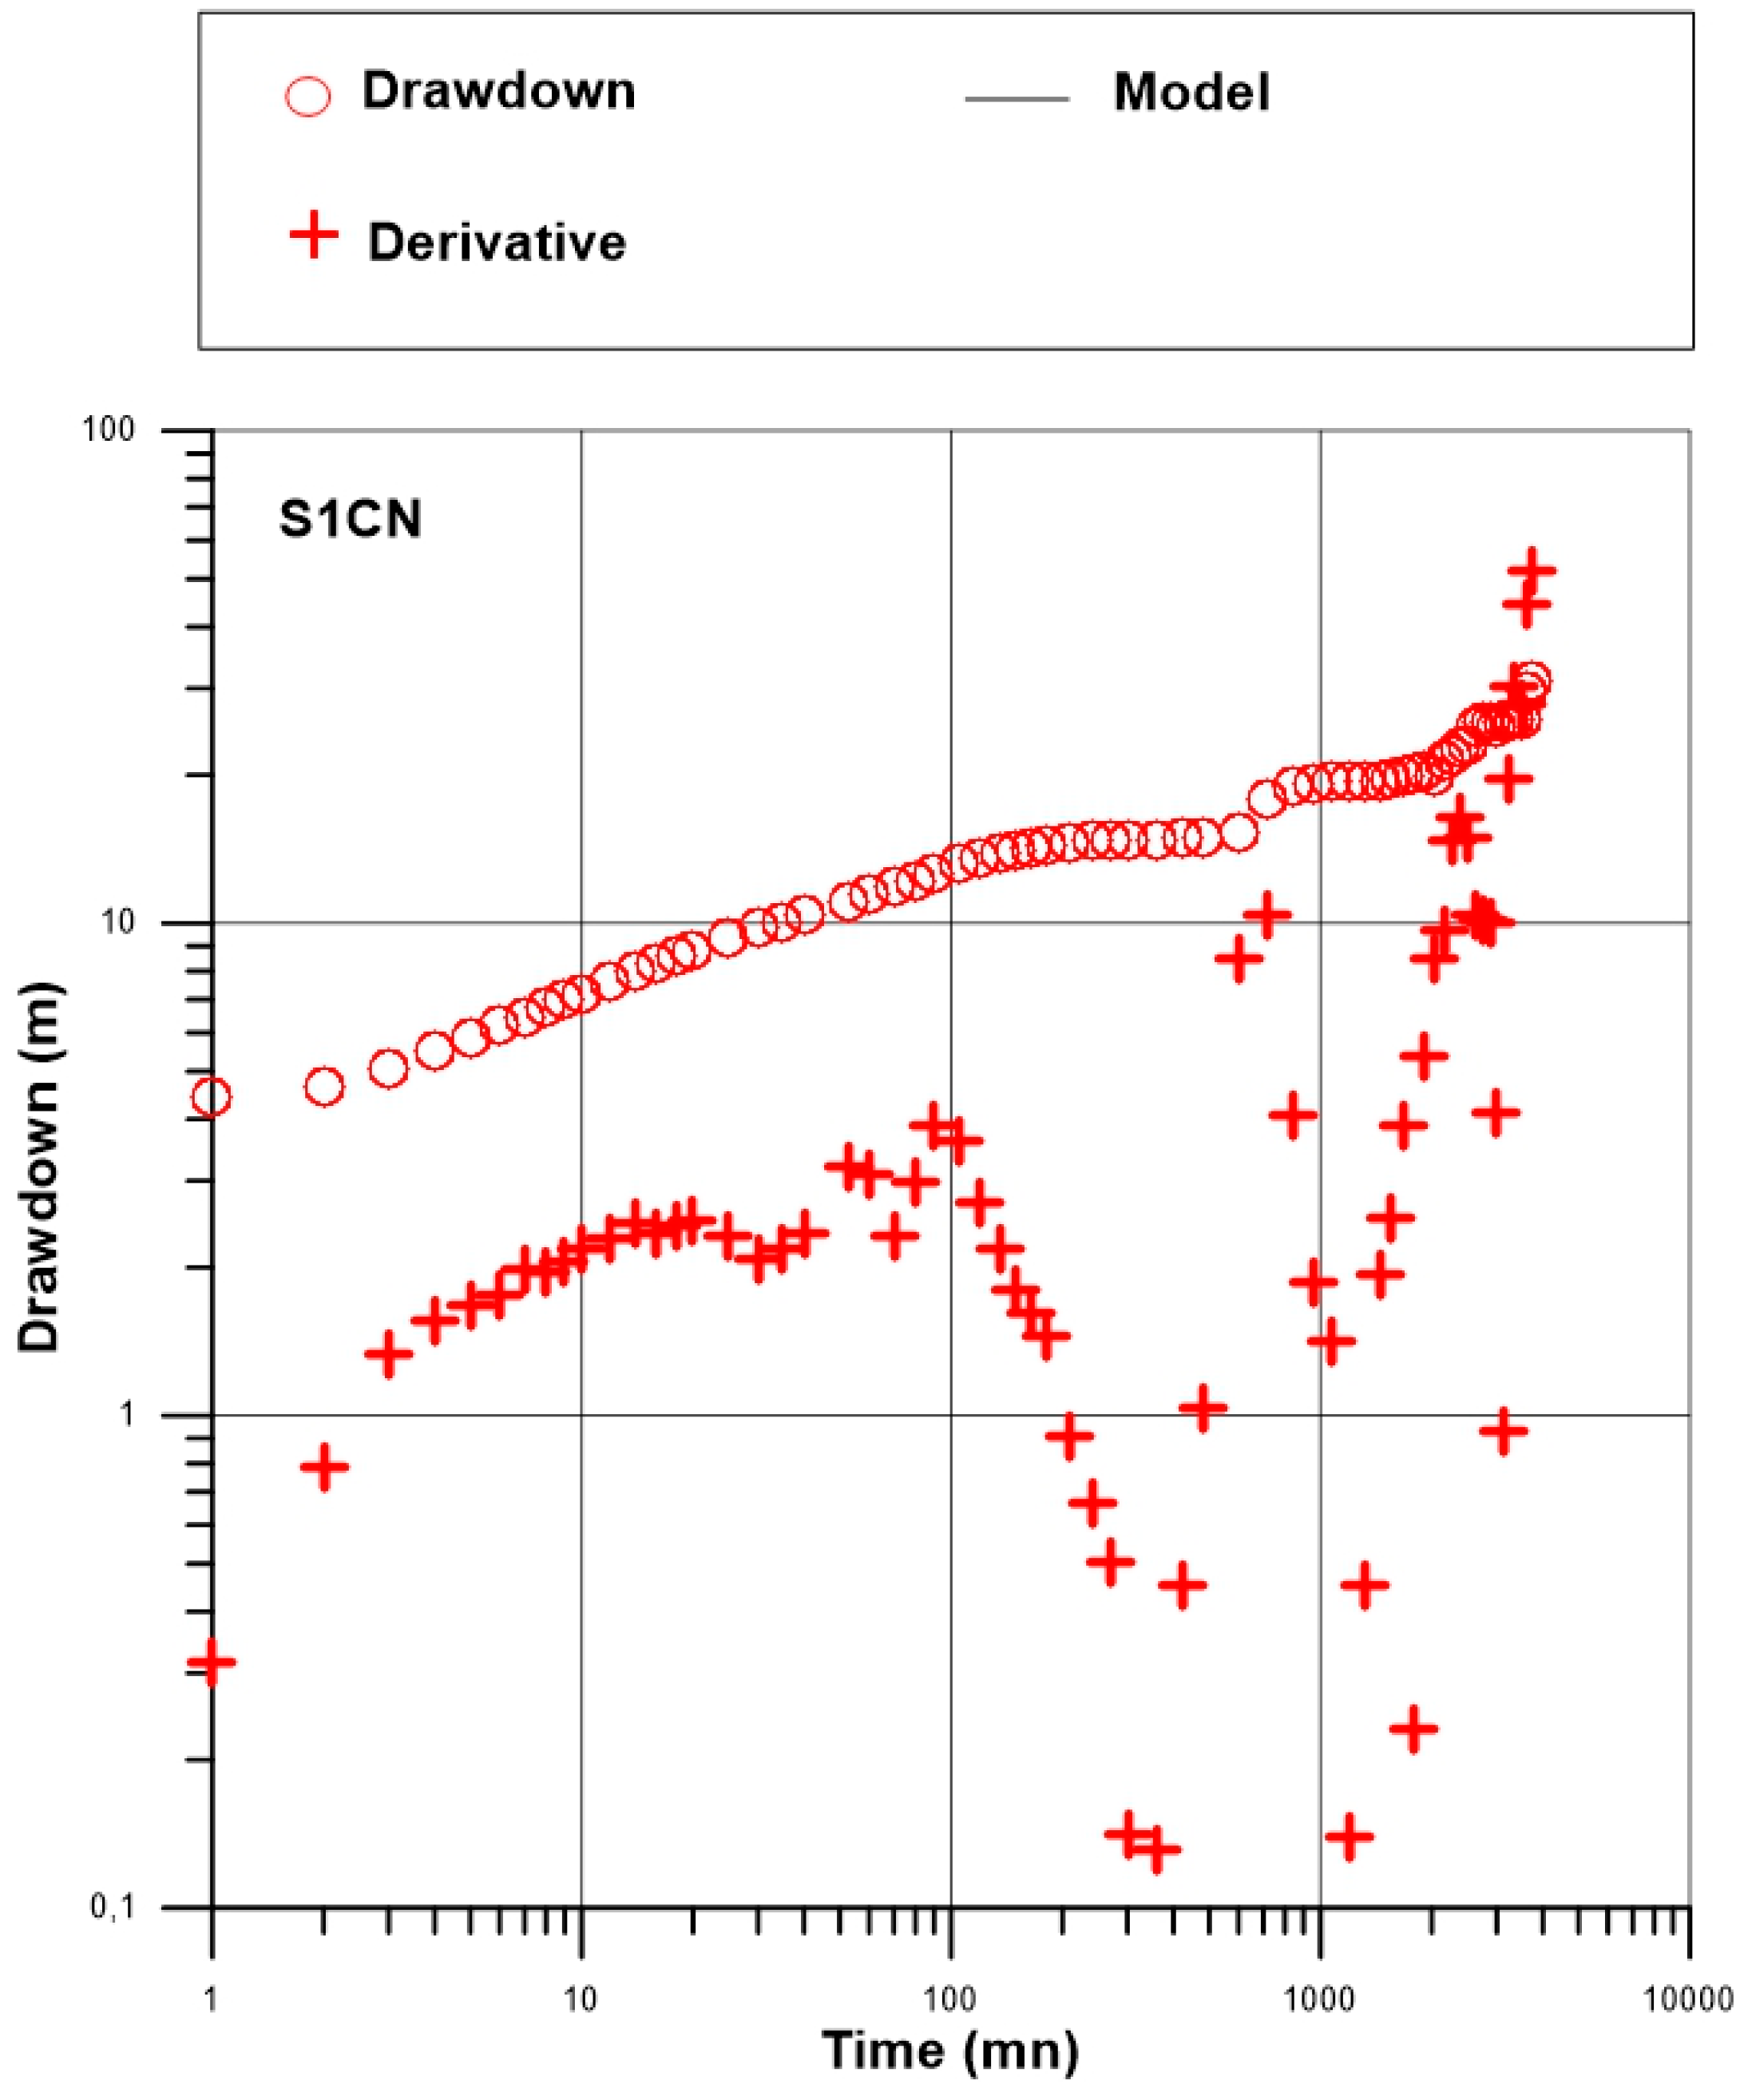
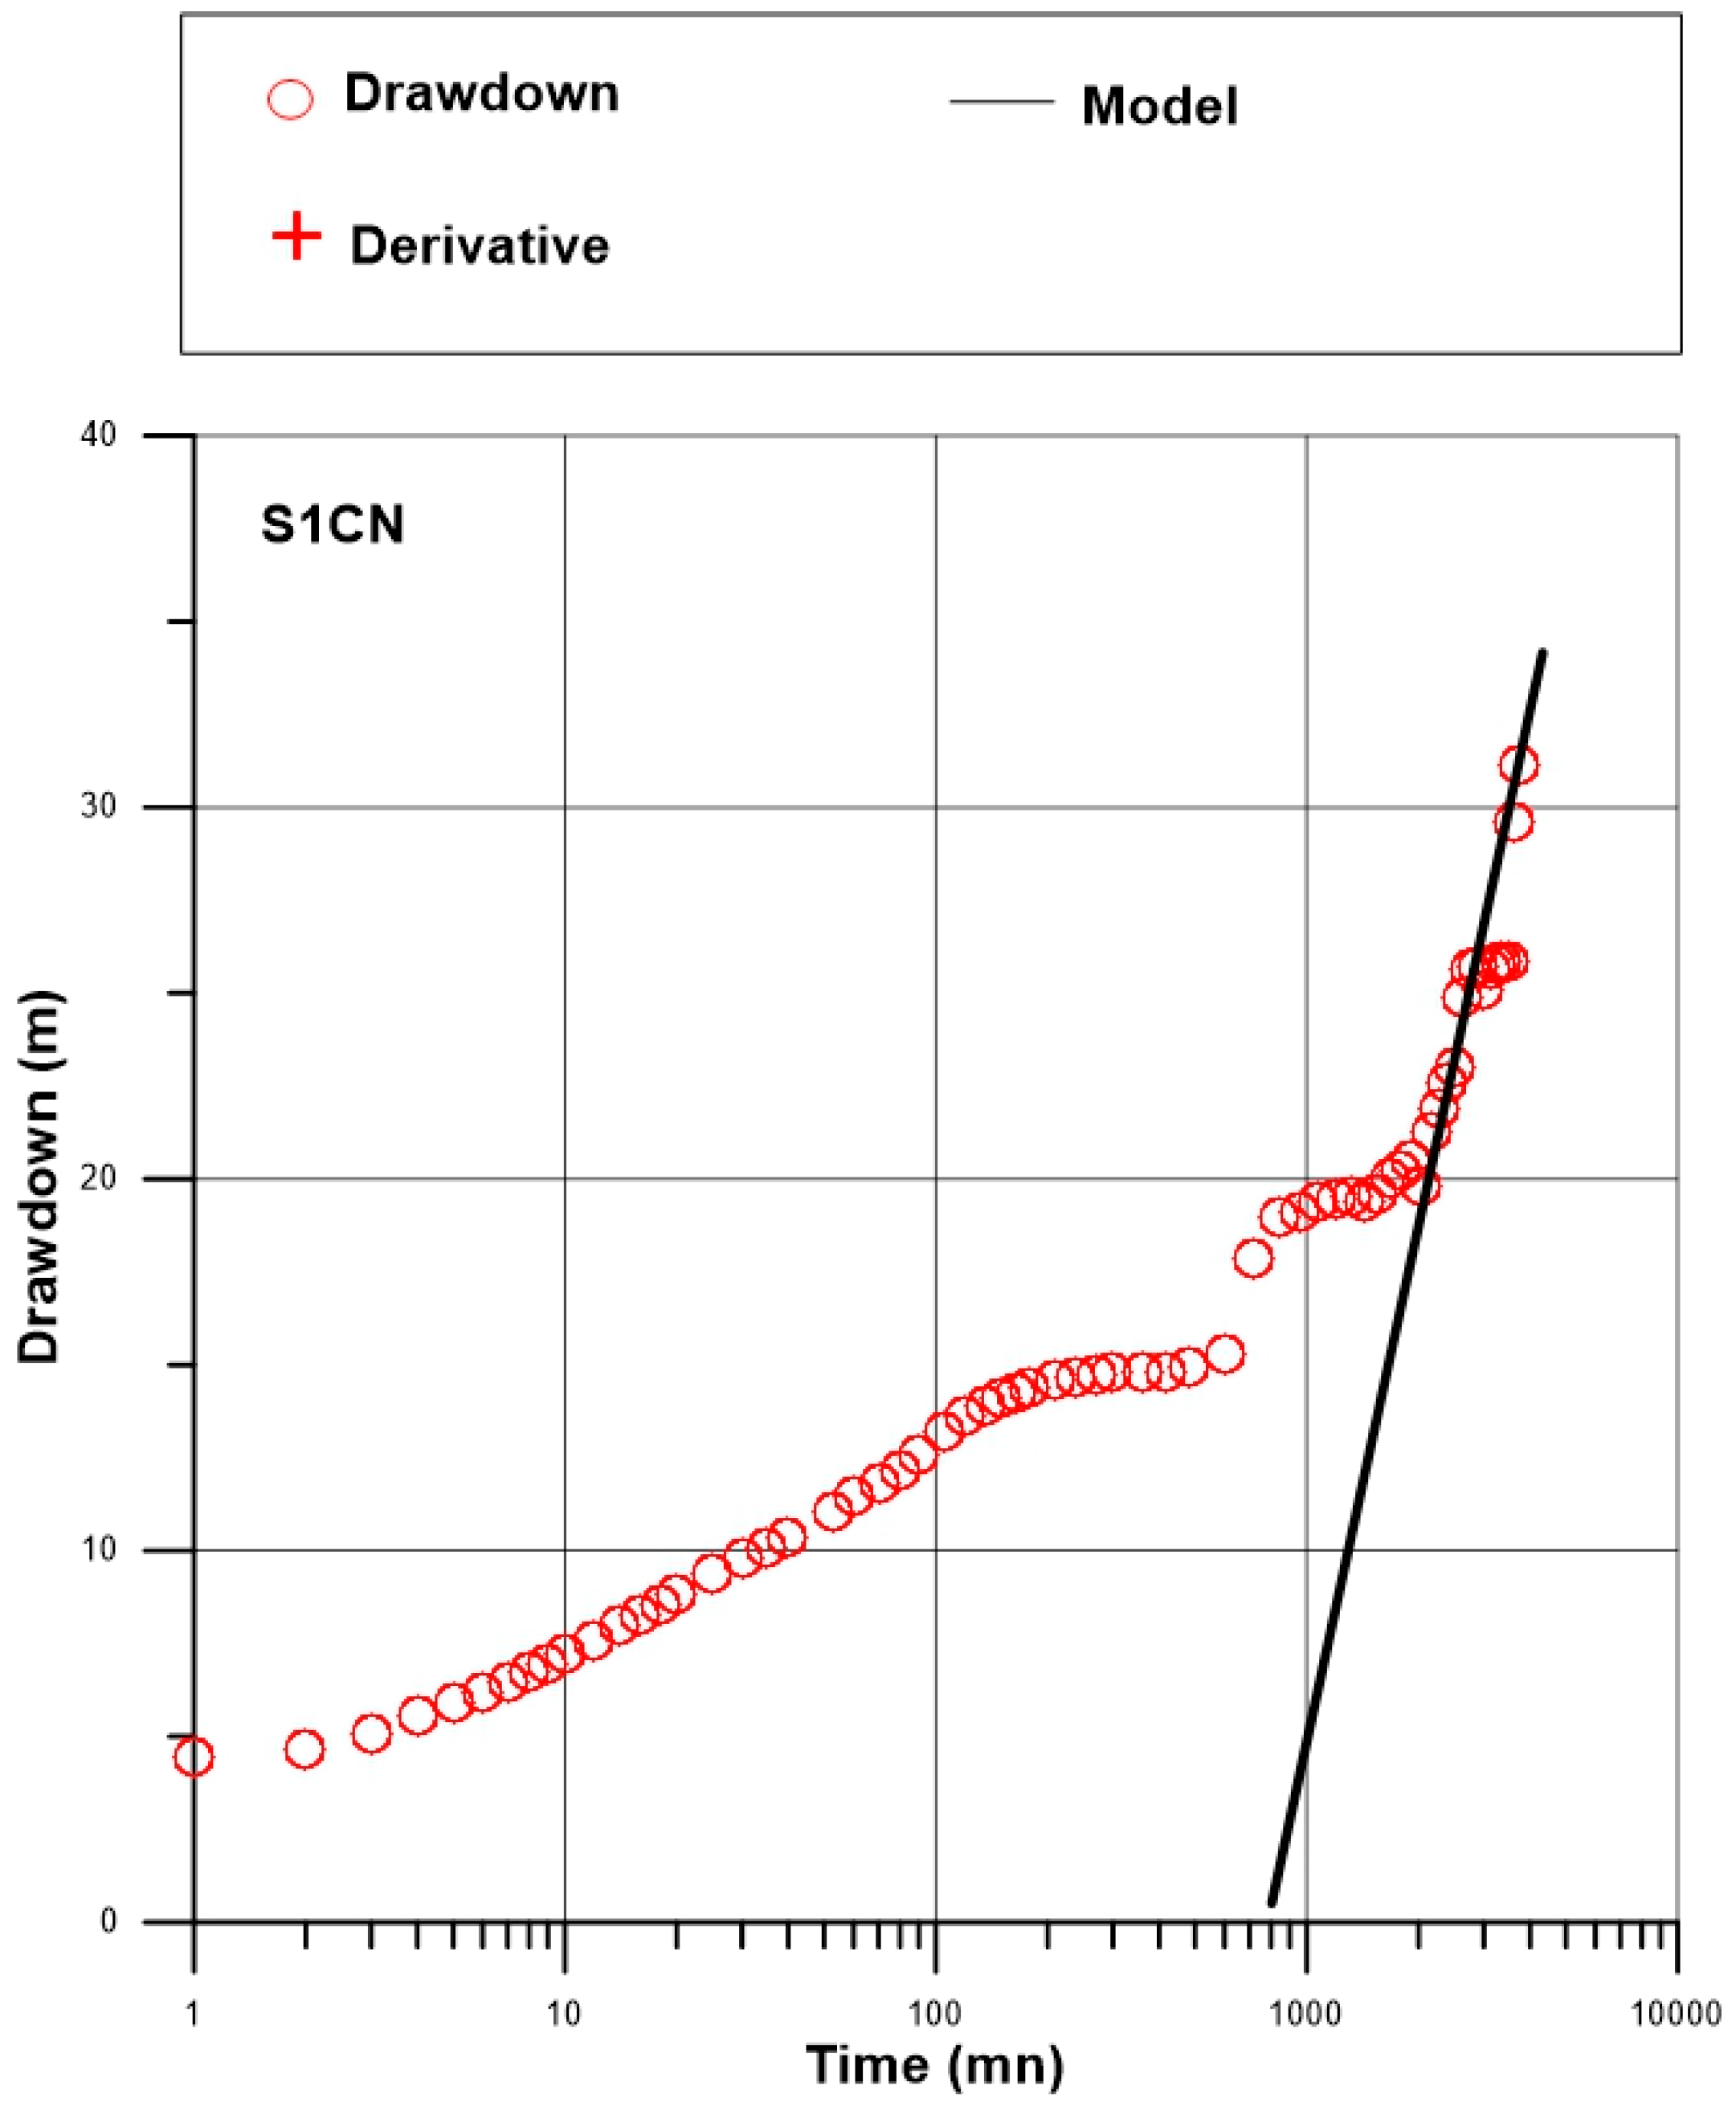
The pumping conducted in S1CN/S1CNP could not be interpreted using data from the observation well (S1CNP) because of the low drawdown observed in it during the test (Figure 6). Despite the proximity of the two wells (5 m), the drawdown reached only 40 cm. The low variations of the drawdown observed in S1CN do not make it possible to obtain a usable curve for the interpretation and the computation of the hydrodynamic parameters. Indeed, this pumping site is located on the north ridge covered with iron crust blocks whose thickness extends over nearly 20 m. These surface conditions make this site, a preferential runoff zone against any recharge. The impervious iron crust could probably confine the tested fissured layer and could not sustain the pumping of the fissured layer. For this site, we only analyze data from the pumping well itself. Thus, considering the pumping test S1CN/S1CNP as a single well test, it is known that the estimate of the storativity is not reliable. The Figure 7 shows the observed drawdown and its derivative in pumping well S1CN. The derivative is very noisy. The behavior of the drawdown and derivative is not similar to none of the diagnostic plots (Appendix A). This situation is probably due to potential quadratic head loss in well and skin effects. For this site, the classical Cooper-Jacob approximation (straight-line analysis) is applied for late time data (Figure 8) and the corresponding transmissivity is 7 × 10⁻⁷ m2/s. The hydraulic conductivity (computed with the thickness of fissured layer which is 10 m) is 7 × 10⁻⁶ m/s. Even if the transmissivity is computed using this approach, the assumptions underlying it application which state that the logarithmic derivative of Copper-Jacob asymptote should be constant (Equations (6) and (7)) is not valid.
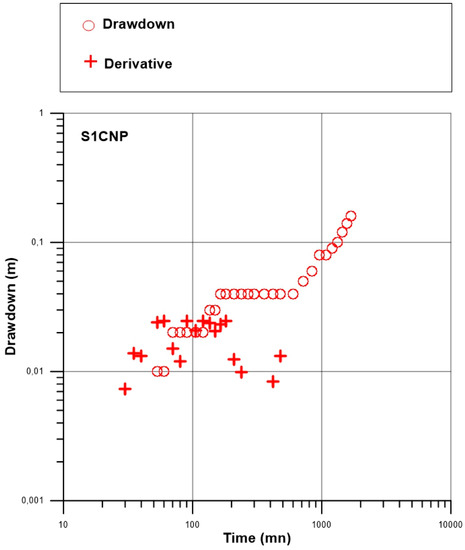
Figure 6.
Observed drawdown and its derivative in observation well S1CNP.
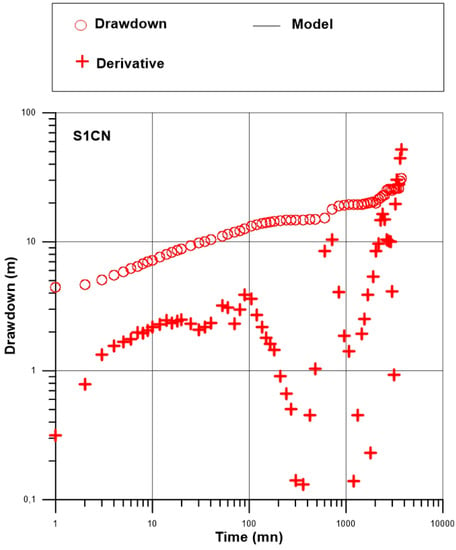
Figure 7.
Observed drawdown and its derivative in pumping well S1CN.
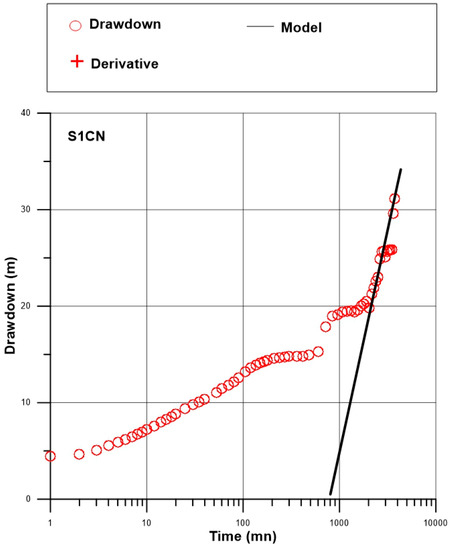
Figure 8.
Semi-logarithmic plot of pumping data form pumping well S1CN and straight-line interpretation of late time data.
The Figure 7 does not show any stabilization of the derivative and therefore the straight-line analysis presented in Figure 8 is wrong because the “infinite acting radial flow” period was not reached. It is recommended when conducting a test to stop it only when the data show at least 1 to 1.5 log-cycles during which the derivative is constant. This ensures that a reliable estimate of the transmissivity can be obtained with the straight-line analysis method [12]. This condition is not realized in most of the pumping tests on the Sanon site.
4.2. Pumping Test S1/S2
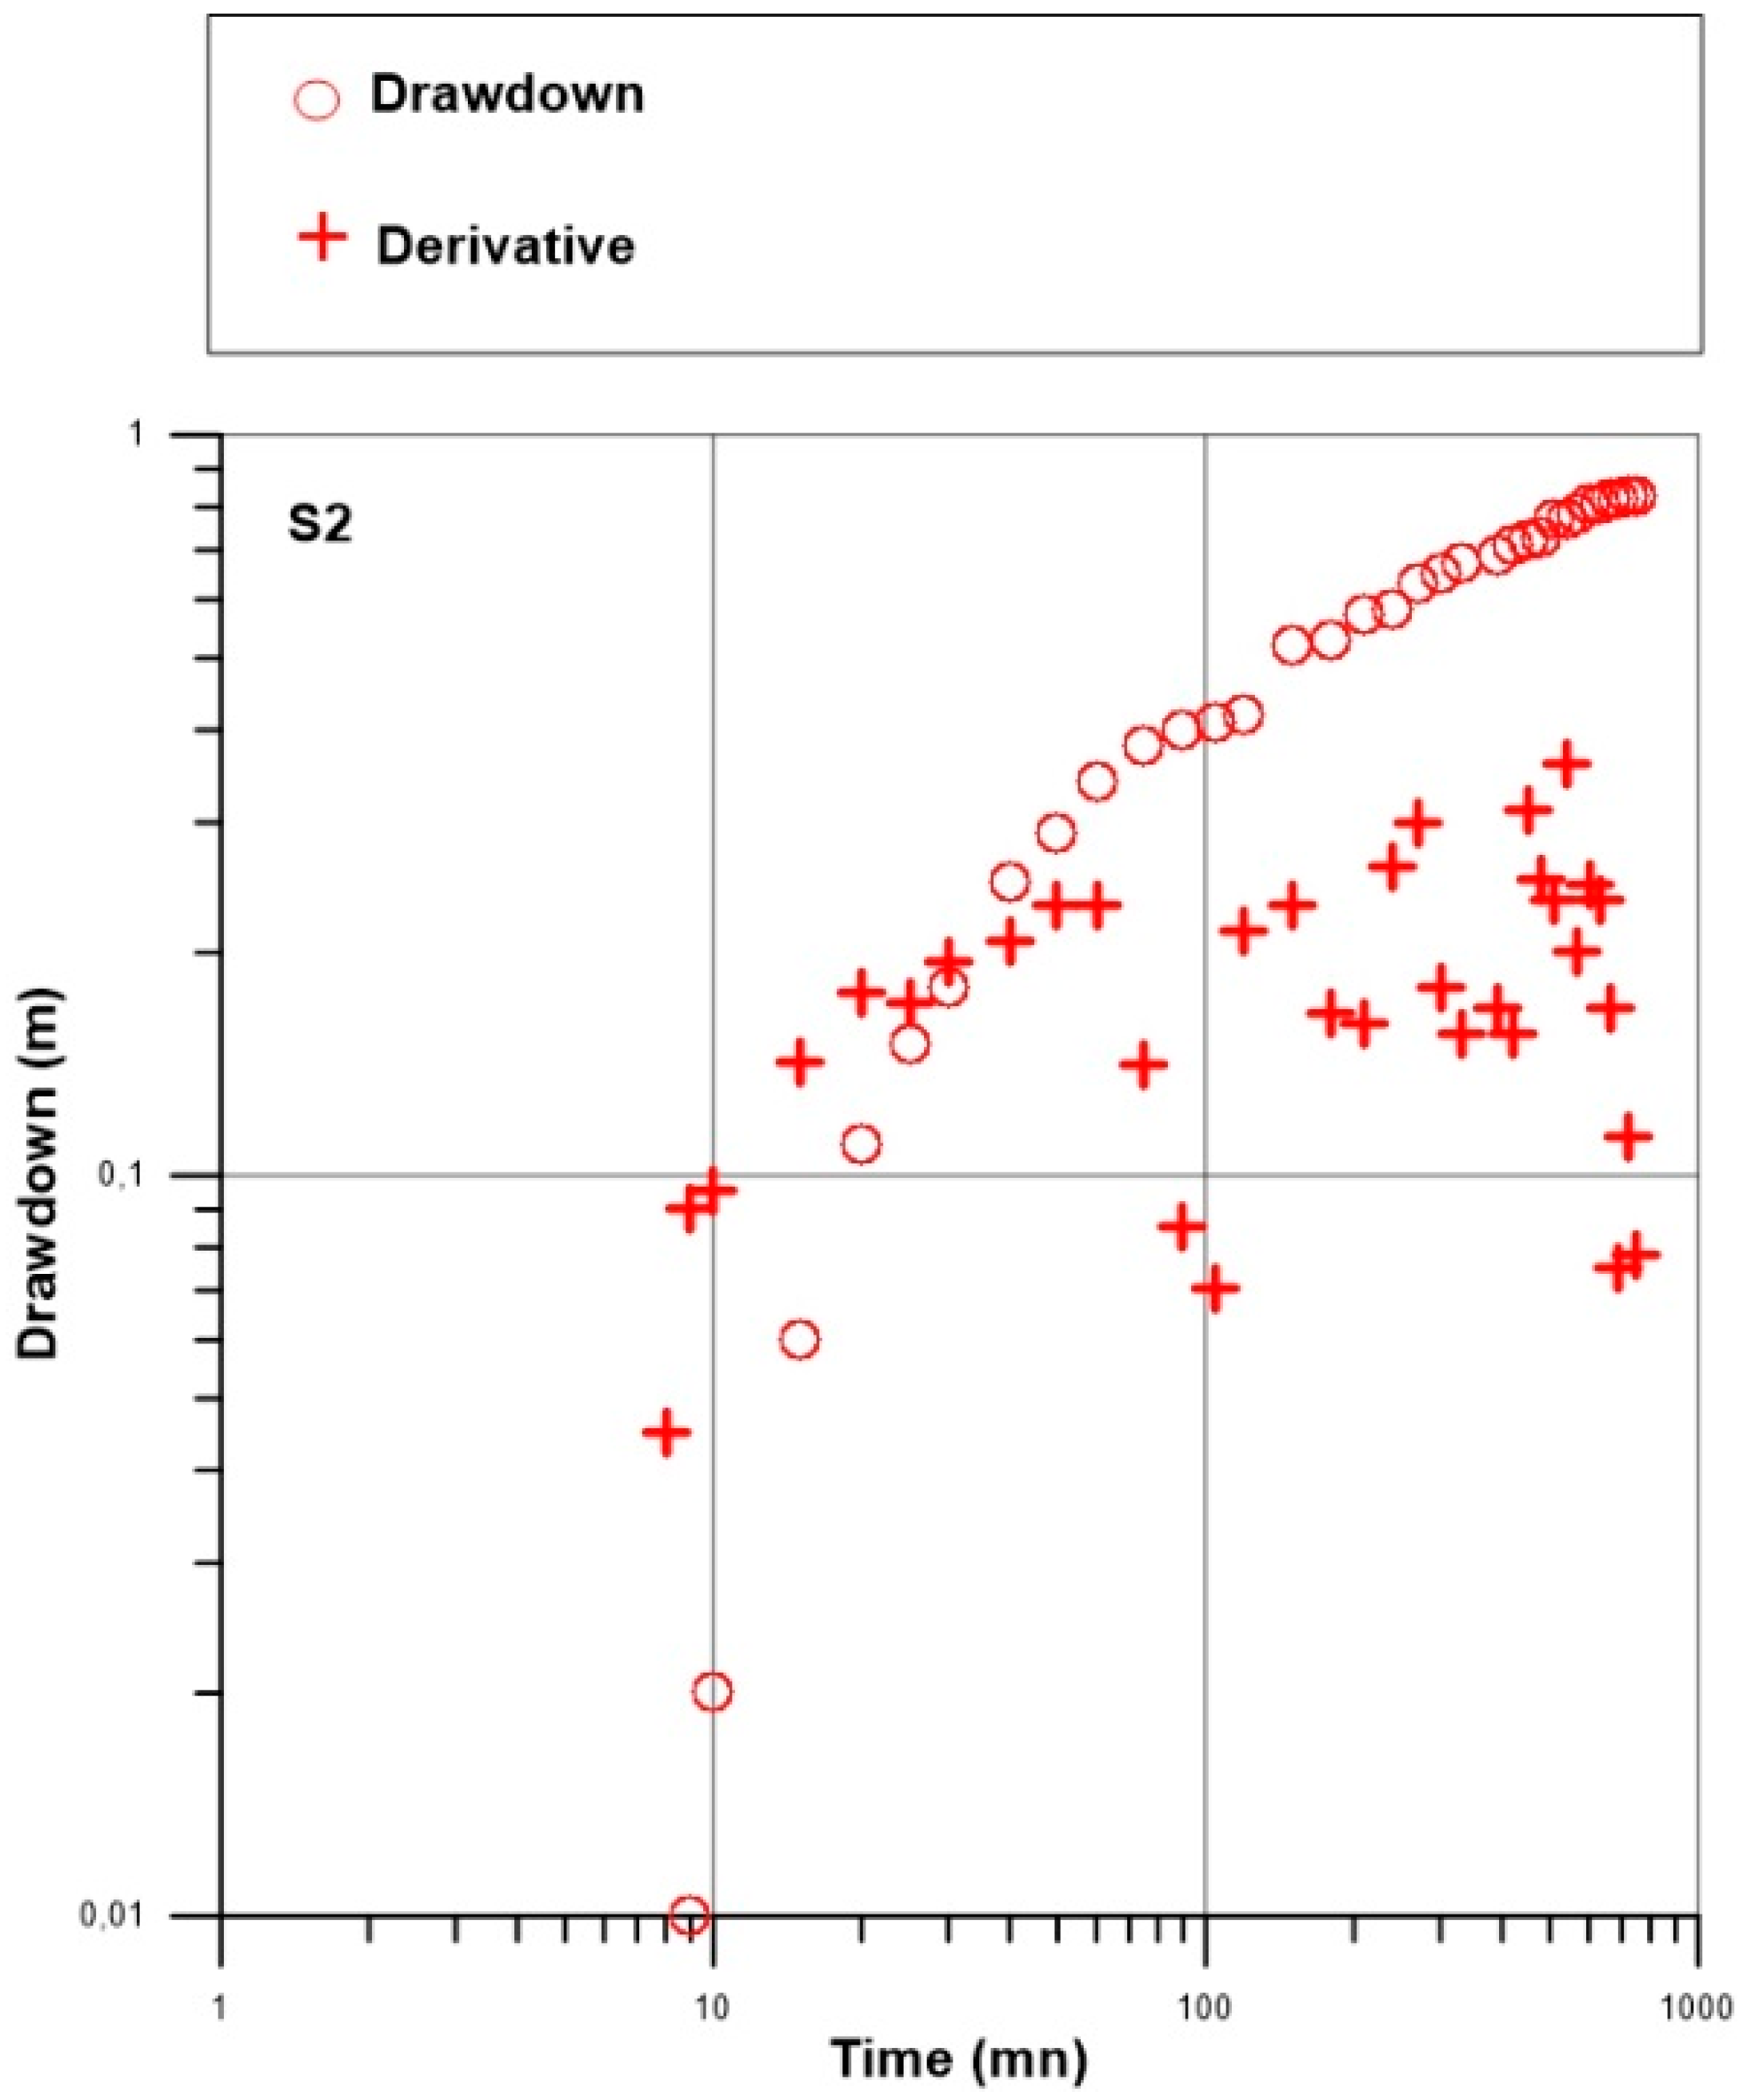
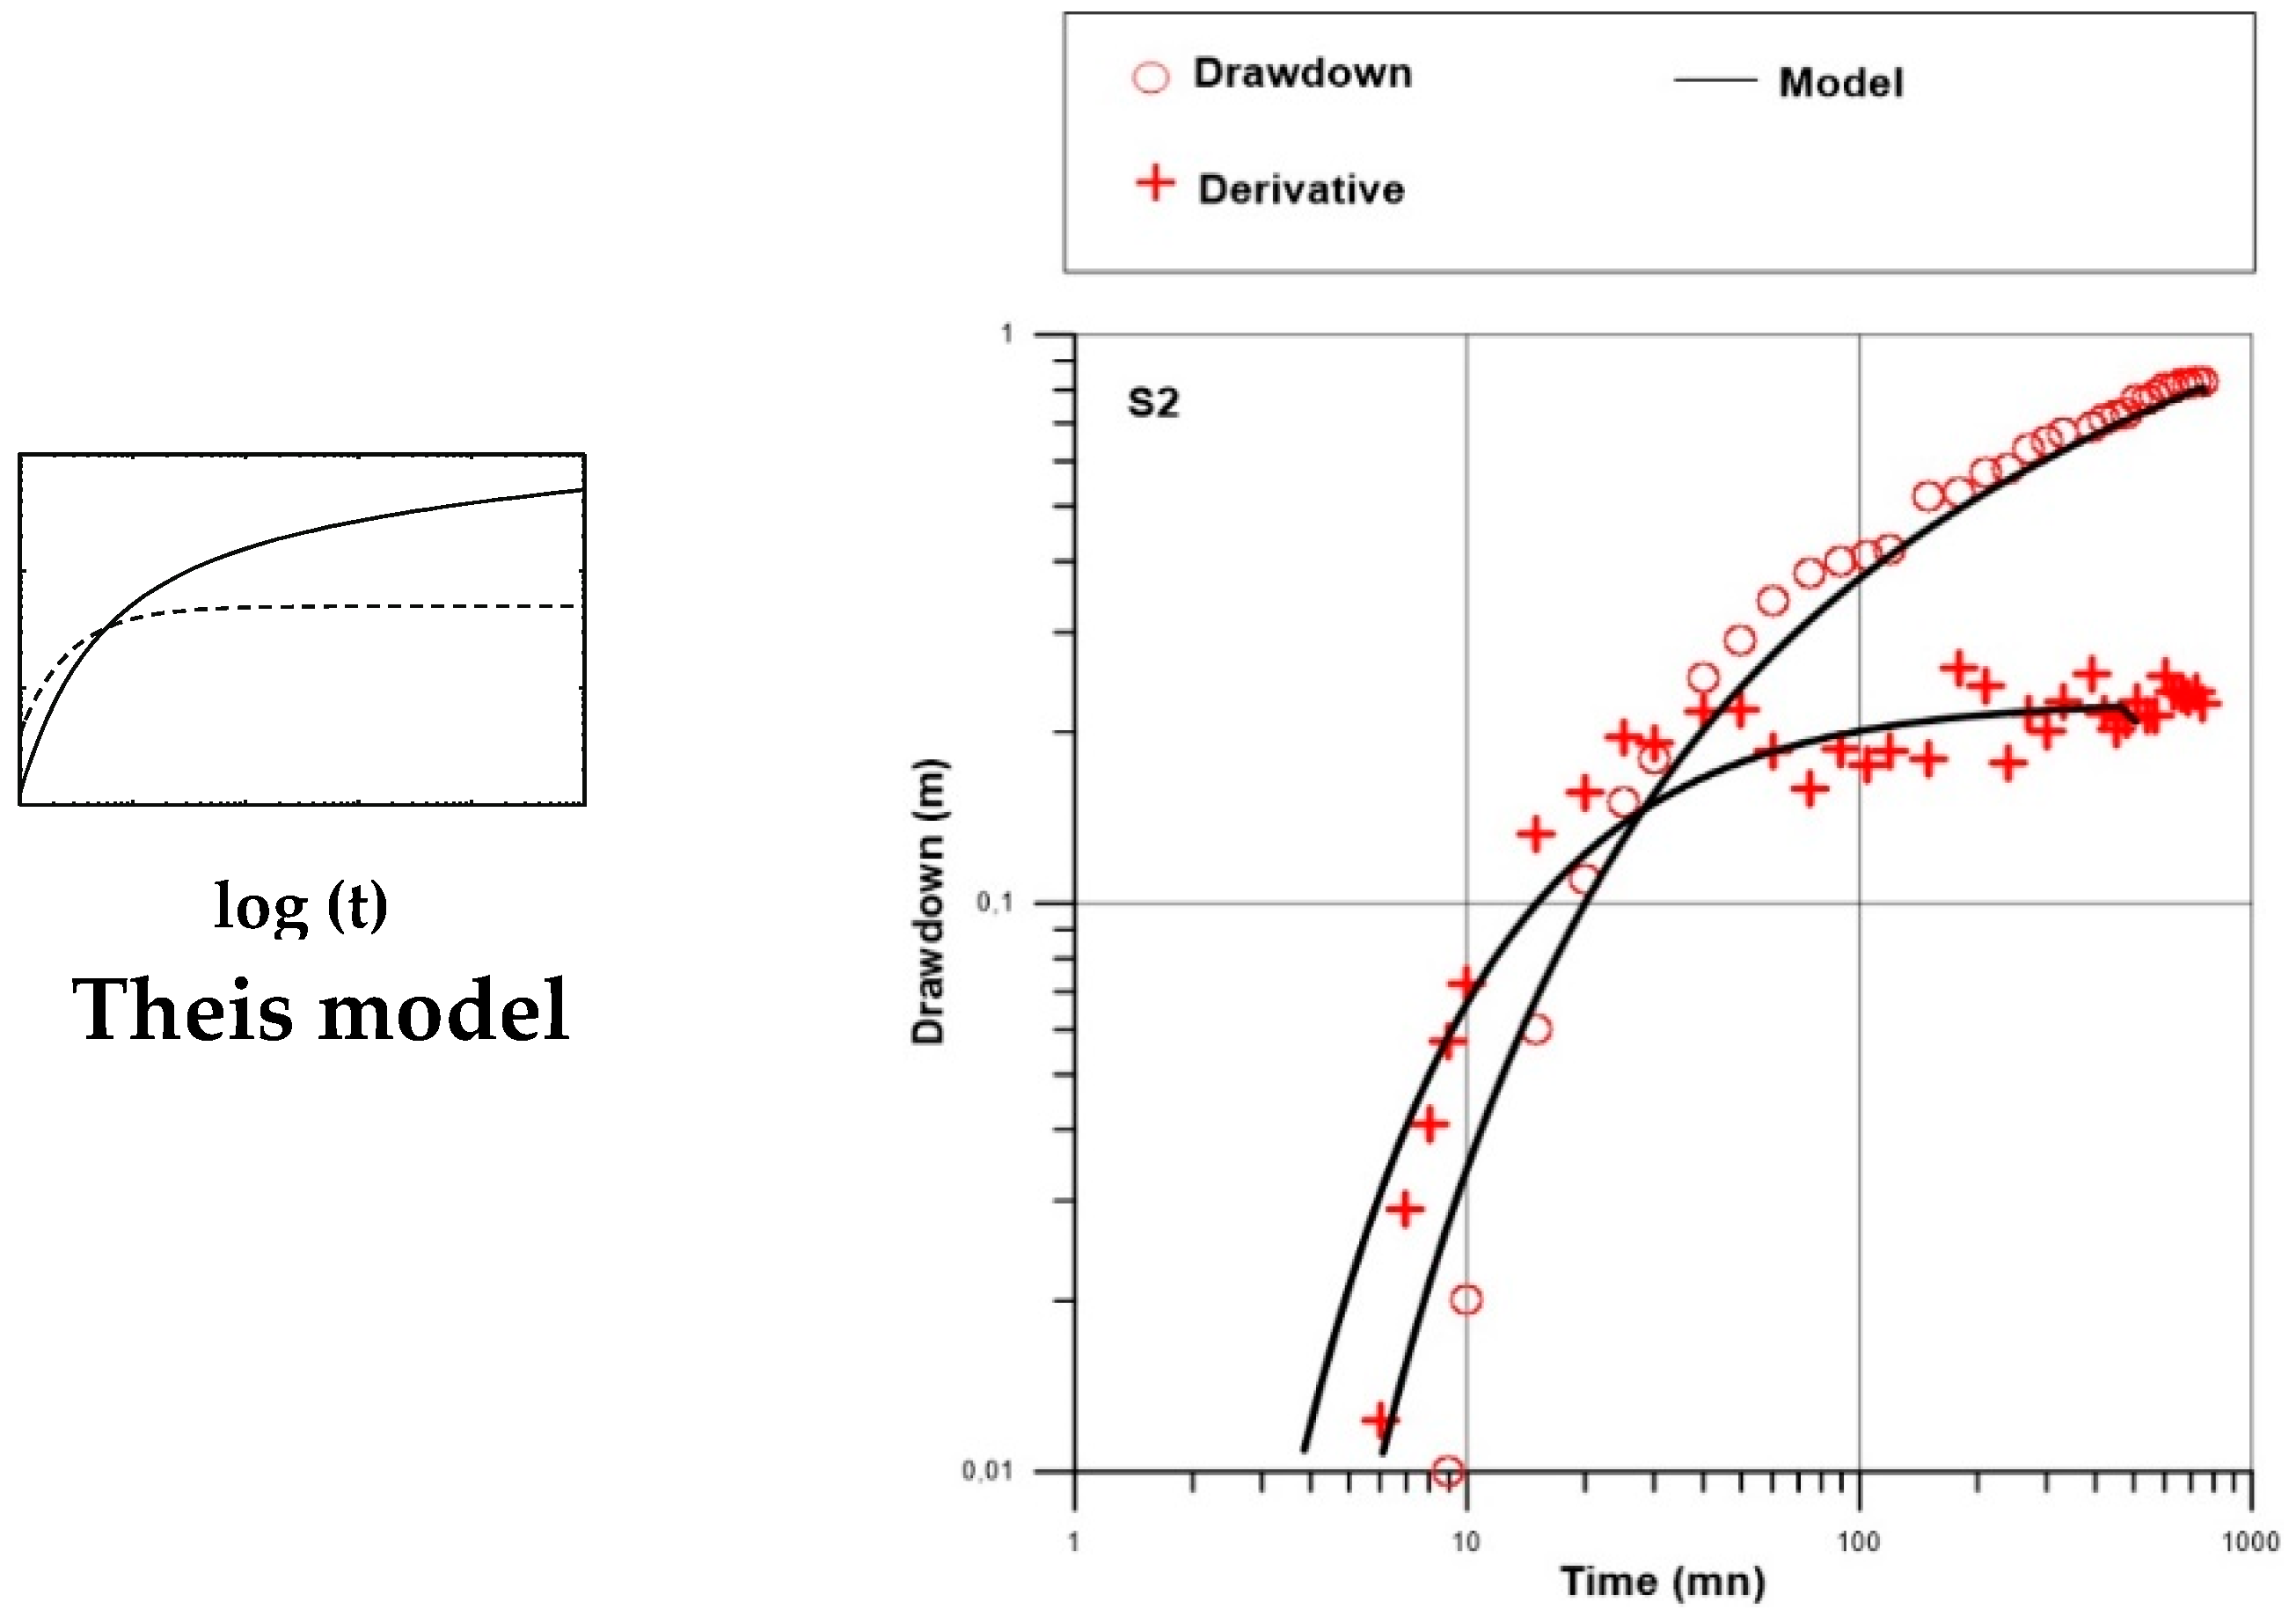
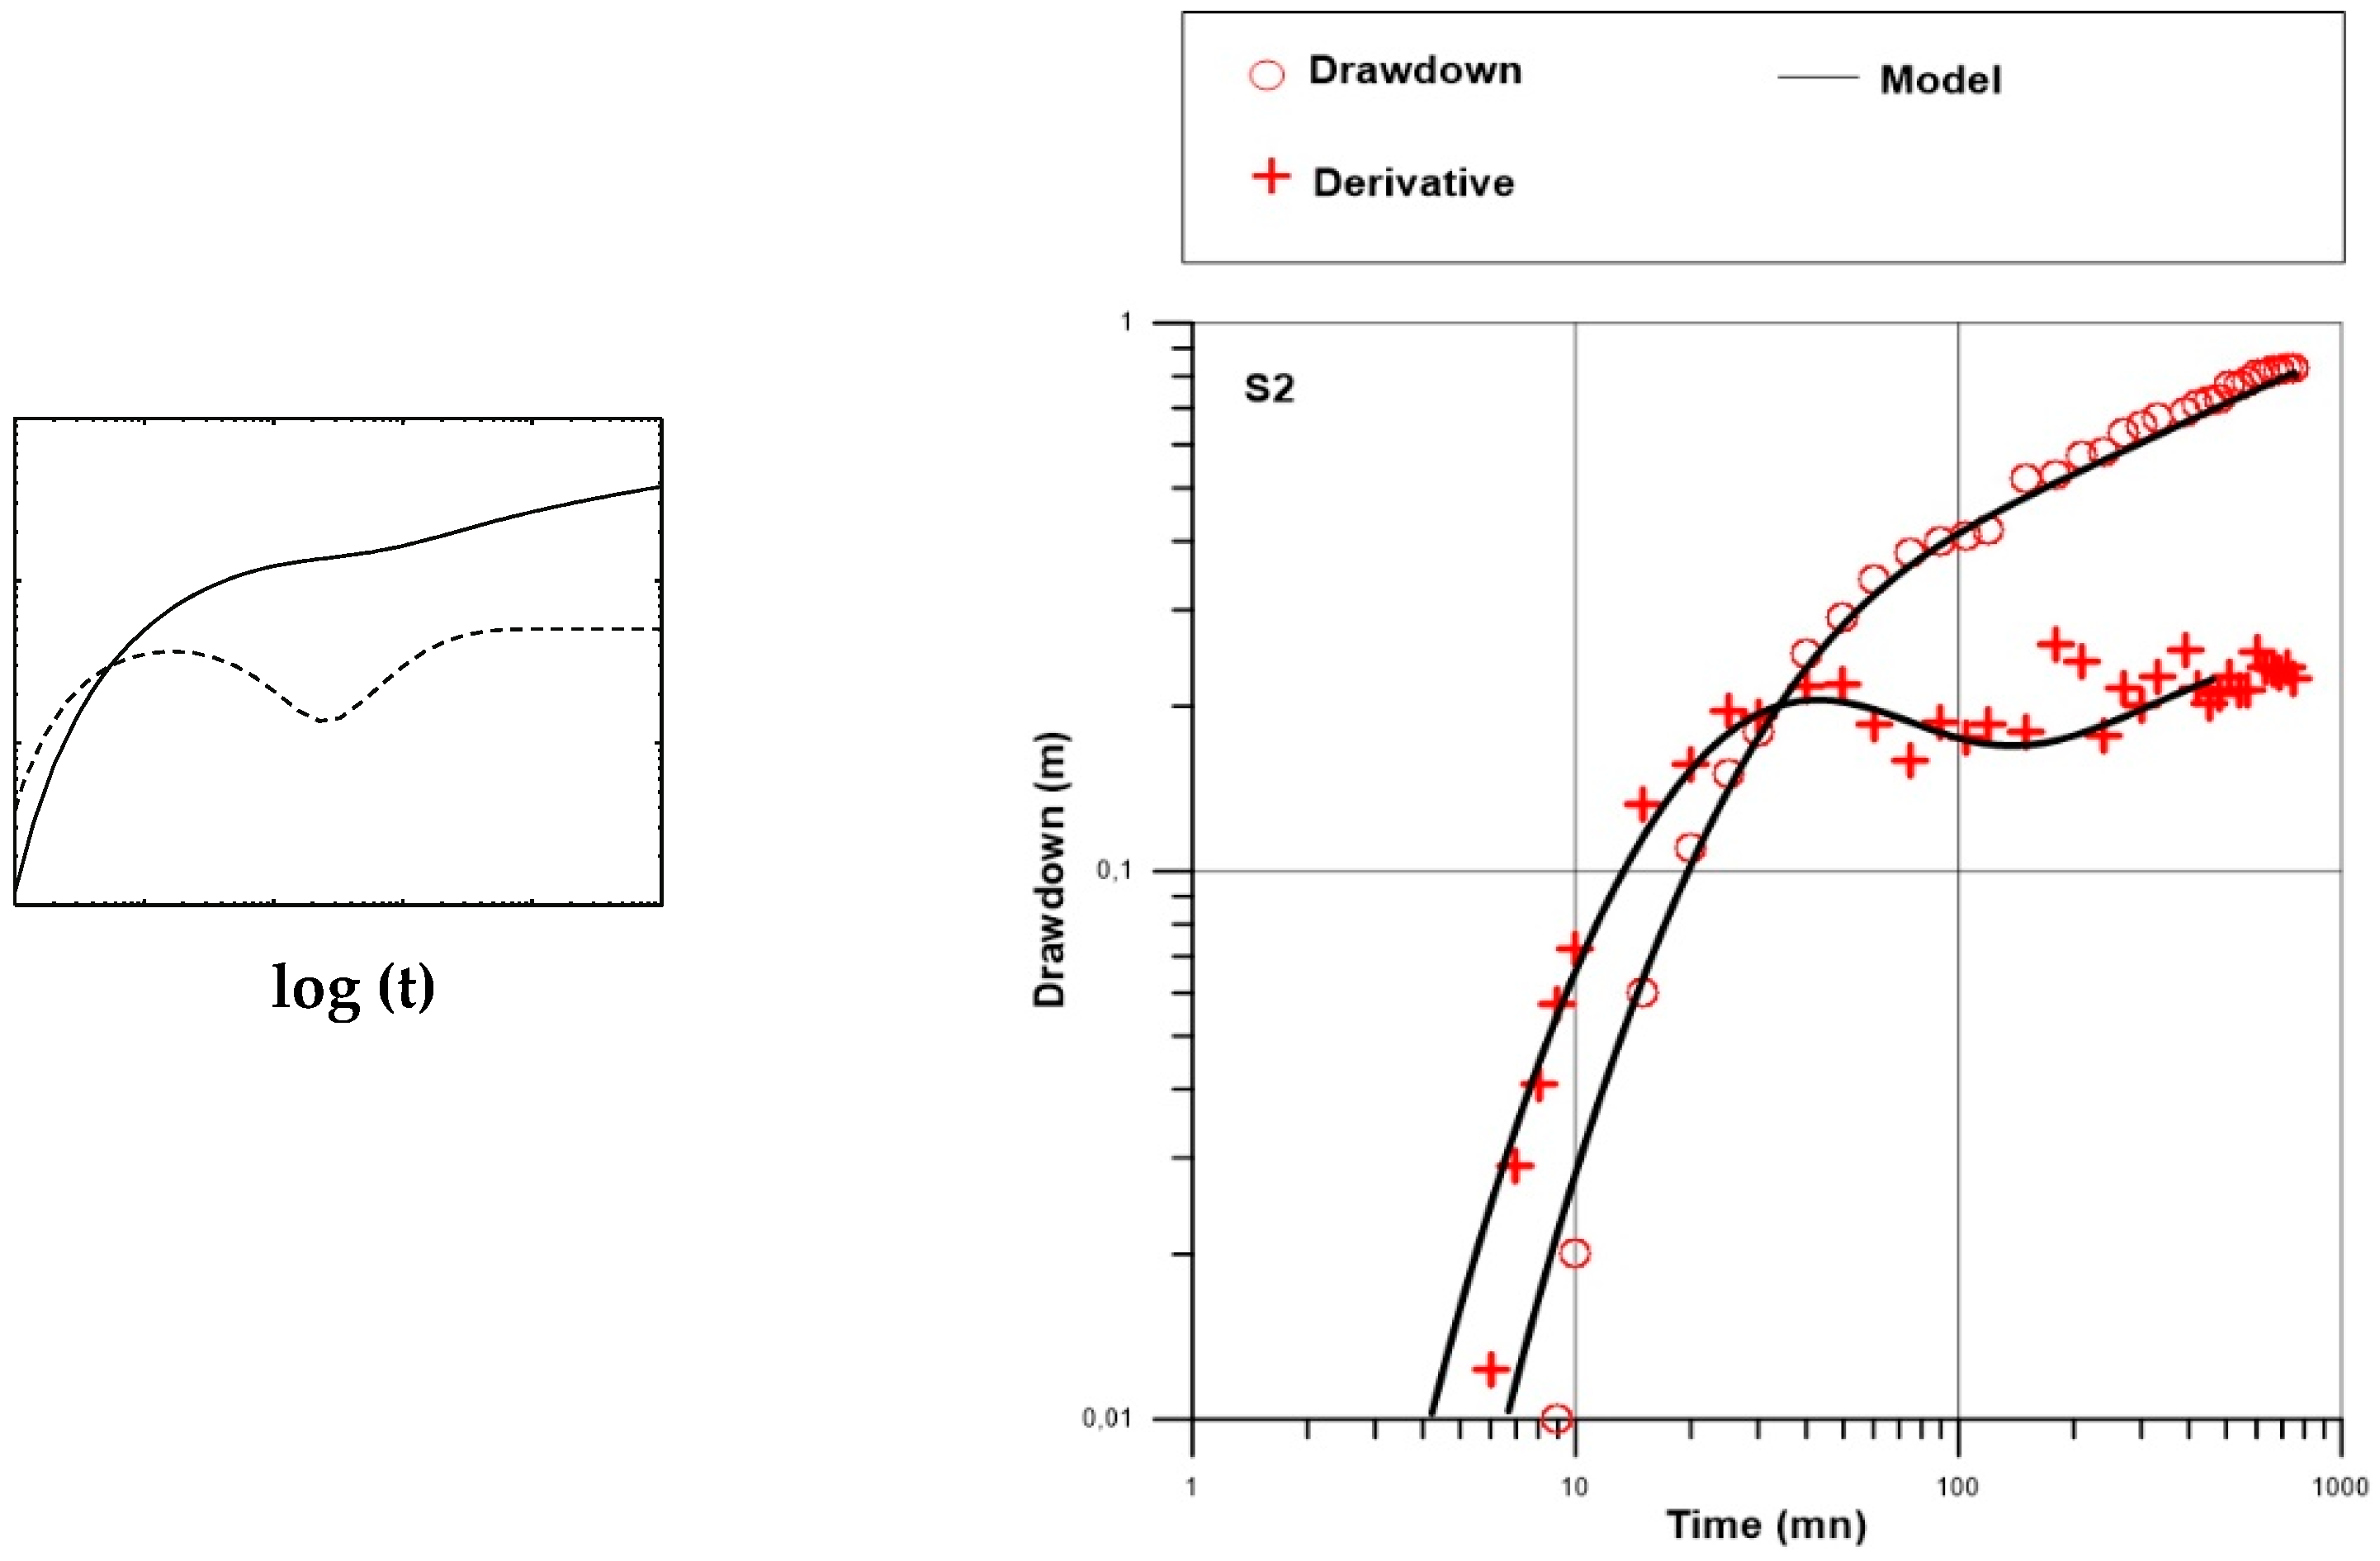
The weathering profile at the pumping site S1/S2 consists of a sandy clayey saprolite of about 50 m saturated over nearly 40 m. The latter overlays a fissured layer of about 7 m consisting of slightly weathered and densely fissured migmatite. Figure 9 shows the observed drawdown and its derivative (without smoothing) versus time in the observation well S2. During the early time, the derivative shows a unit slope, indicating that during this period, the pumping is dominated by wellbore storage effect. Therefore, during this period, it is not possible to determine the hydrodynamic parameters of the tested aquifer. Later time, the derivative is very noisy with many oscillations that not allow detecting a diagnostic plot. This often-classic behavior can lead to misinterpretations. According to Renard et al. [12], it is an artifact due to the amplification of measurement errors. To avoid these errors, the derivative data have been smoothed by applying the algorithm proposed by Bourdet et al. [18]. This smoothing allowed identification of two diagnostic plots: infinite two-dimensional confined aquifer and double porosity with respective smoothing coefficients of 0.5 and 0.4. The infinite two-dimensional confined aquifer behavior indicates that the Theis solution (Figure 10) can be applied. This solution is characterized by a pseudo stabilization of the derivative at late time even if slight oscillations are observed. In Figure 11, the derivative shows a hole corresponding to the deflection of the drawdown curve that is characteristic of the double porosity model. Subsequently, a better fit of those deconvoluted data is found with [19,20] model.
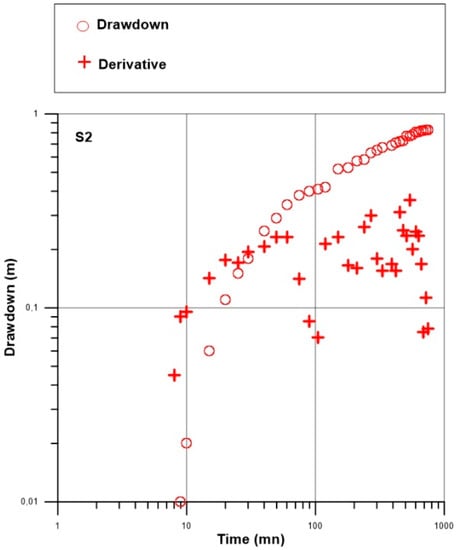
Figure 9.
Observed drawdown and its derivative (without smoothing) in observation well S2.
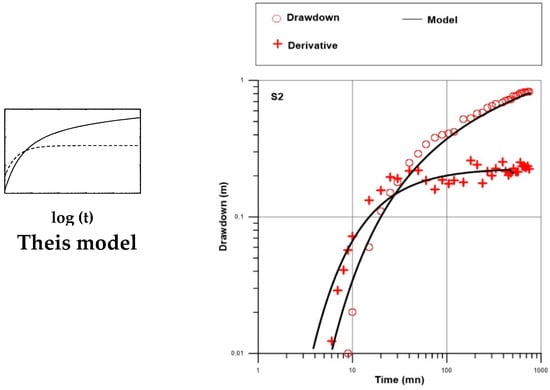
Figure 10.
Interpretation of pumping test S1/S2: diagnostic plot (left) and data superimposed with a fitted Theis model (right).
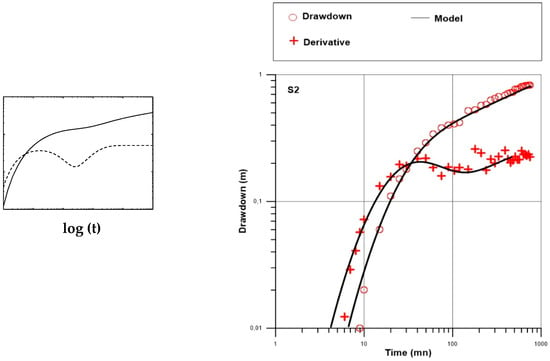
Figure 11.
Interpretation of pumping test S1/S2: diagnostic plot (left) and data superimposed with a fitted Double porosity model (right).
Concerning the interpretation of this pumping test, we note that at least two models allow interpreting the flow regime. For solving this non-uniqueness of interpretation, we used the geological model provided by the weathering profile available for the pumping site. The high sandy content of the saprolite layer overlying the weathered fissured layer does not advocate the application of Theis model, which is devoted to confined aquifers. The tested fissured layer consists of slightly weathered and densely fissured migmatite with horizontal tendency thus behaving like a double porosity aquifer where the weathered matrix plays a capacitive role and the fissured layer ensures a transmissive role. The corresponding transmissivity and storativity are T = 5.8 × 10⁻³ m2/s and S = 0.06 respectively. The corresponding hydraulic conductivity is 2.4 × 10⁻⁵ m/s.
4.3. Pumping Test S10/S11
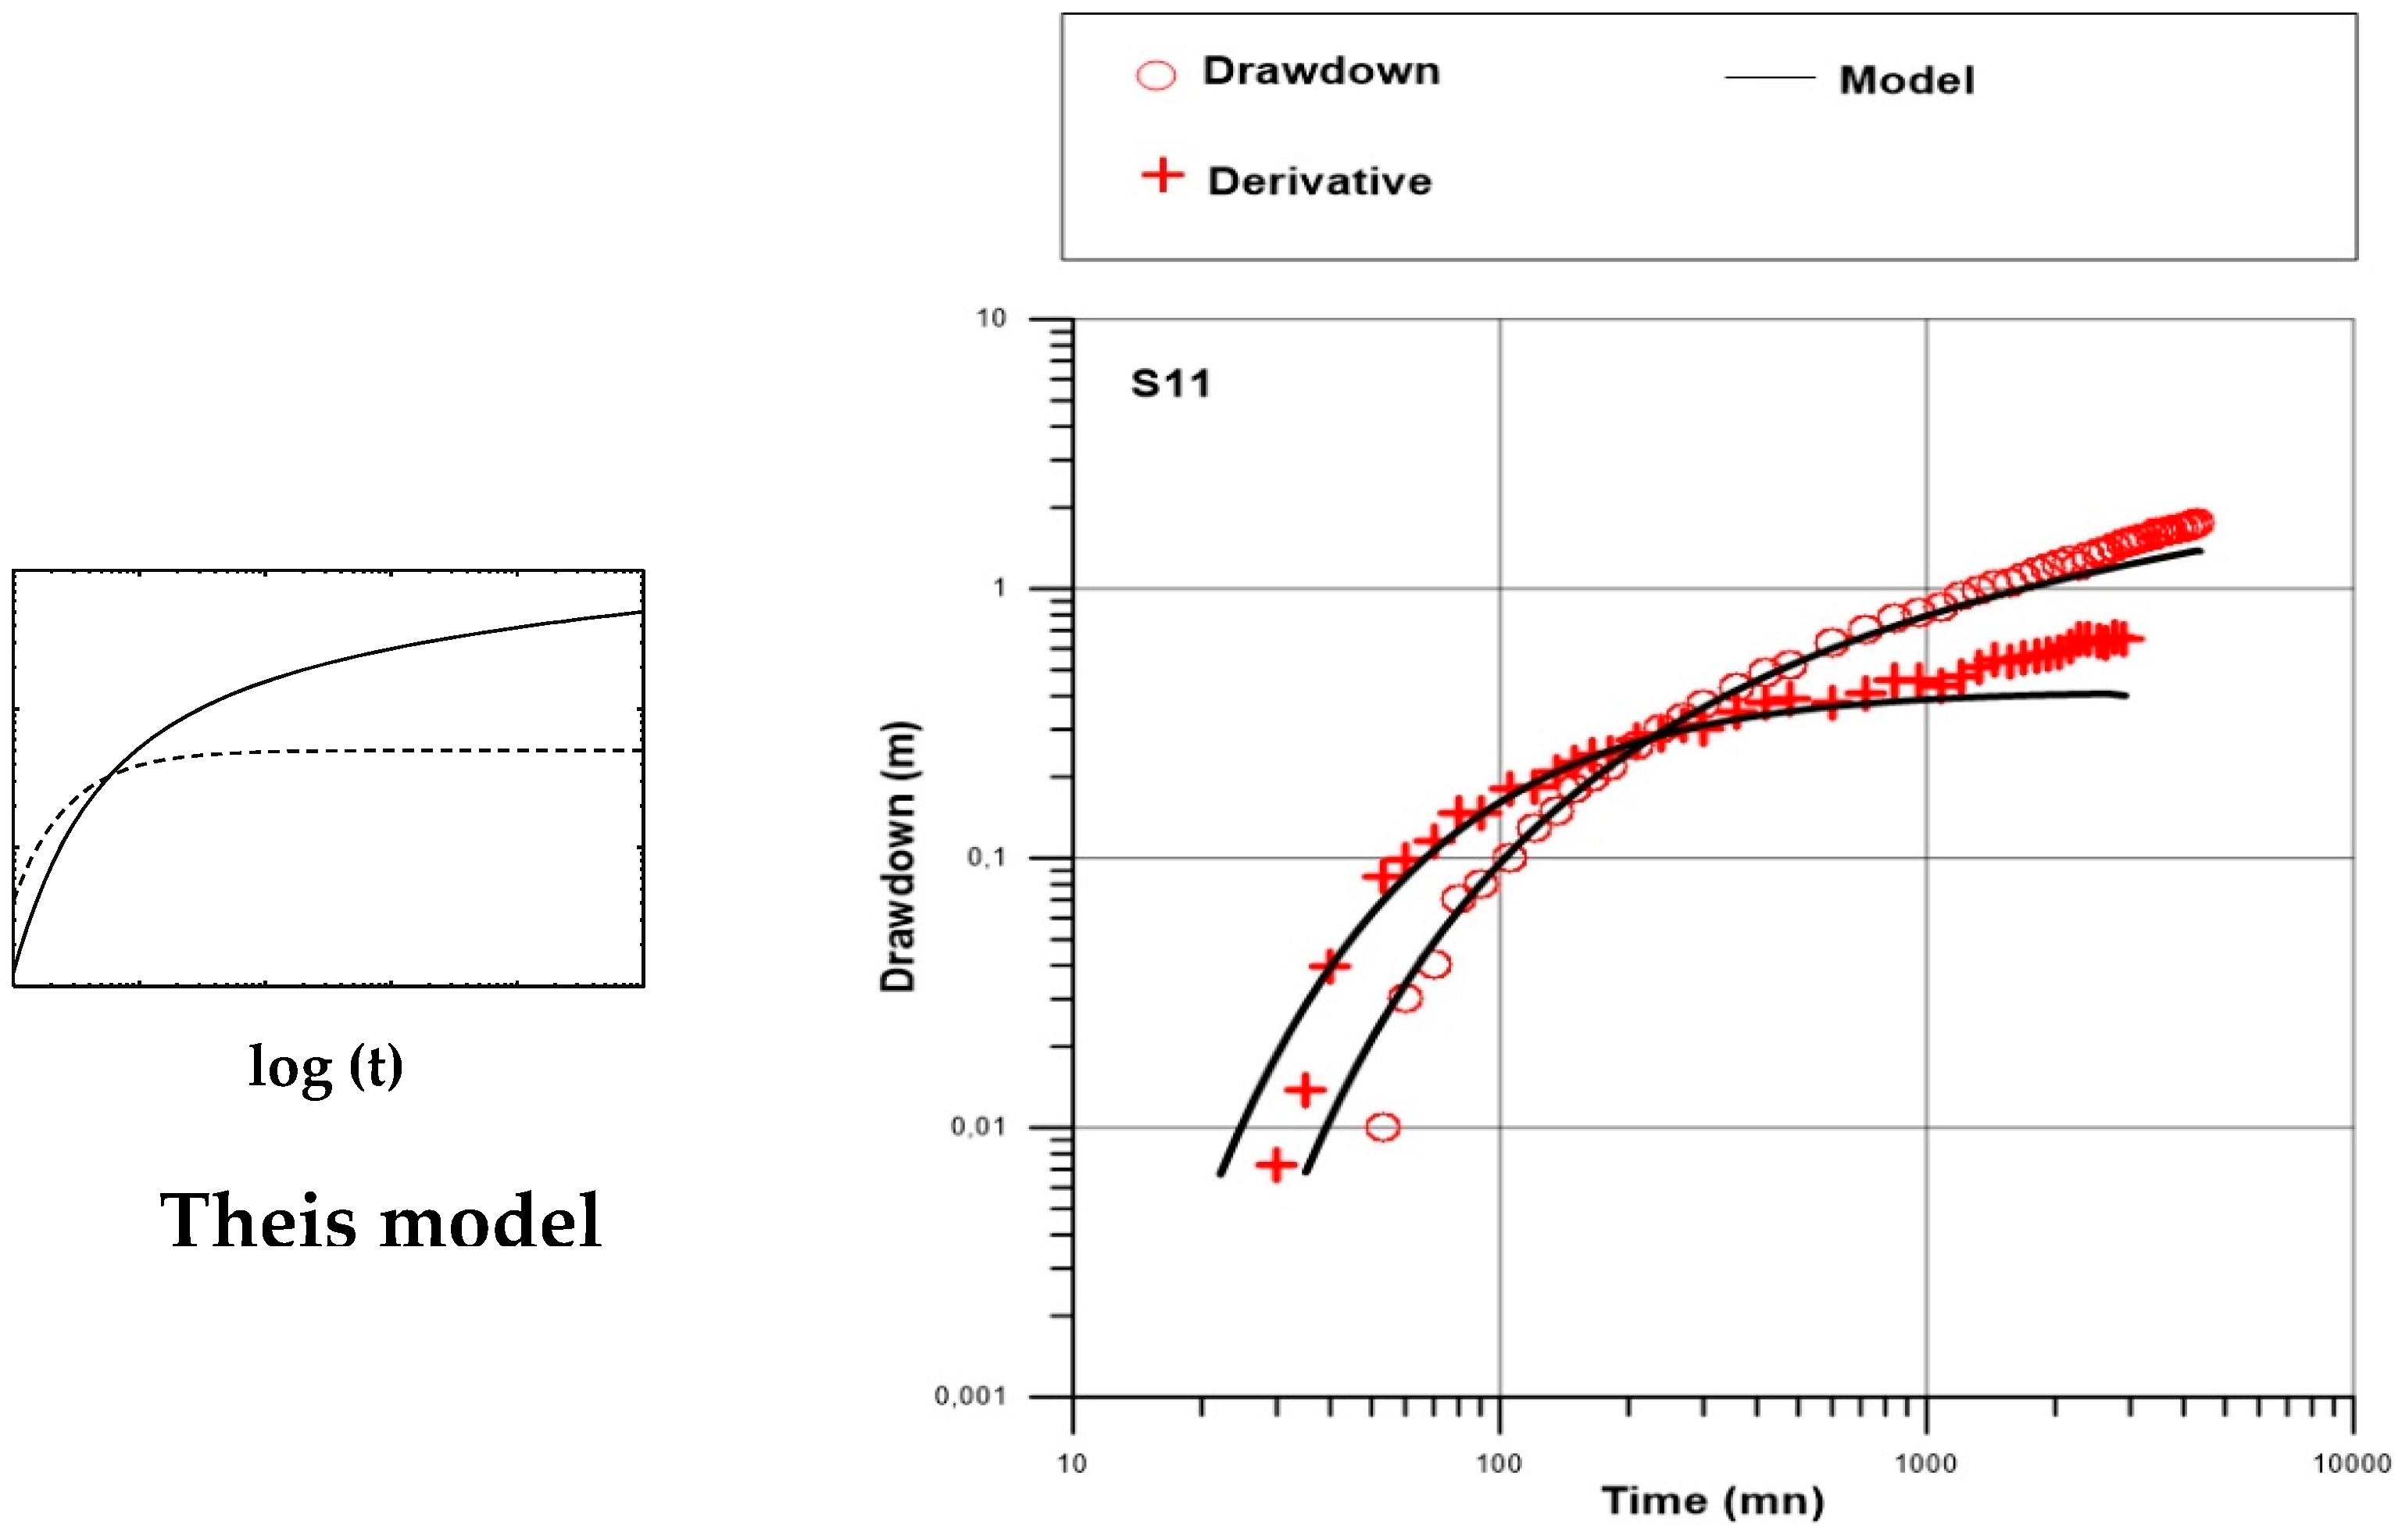
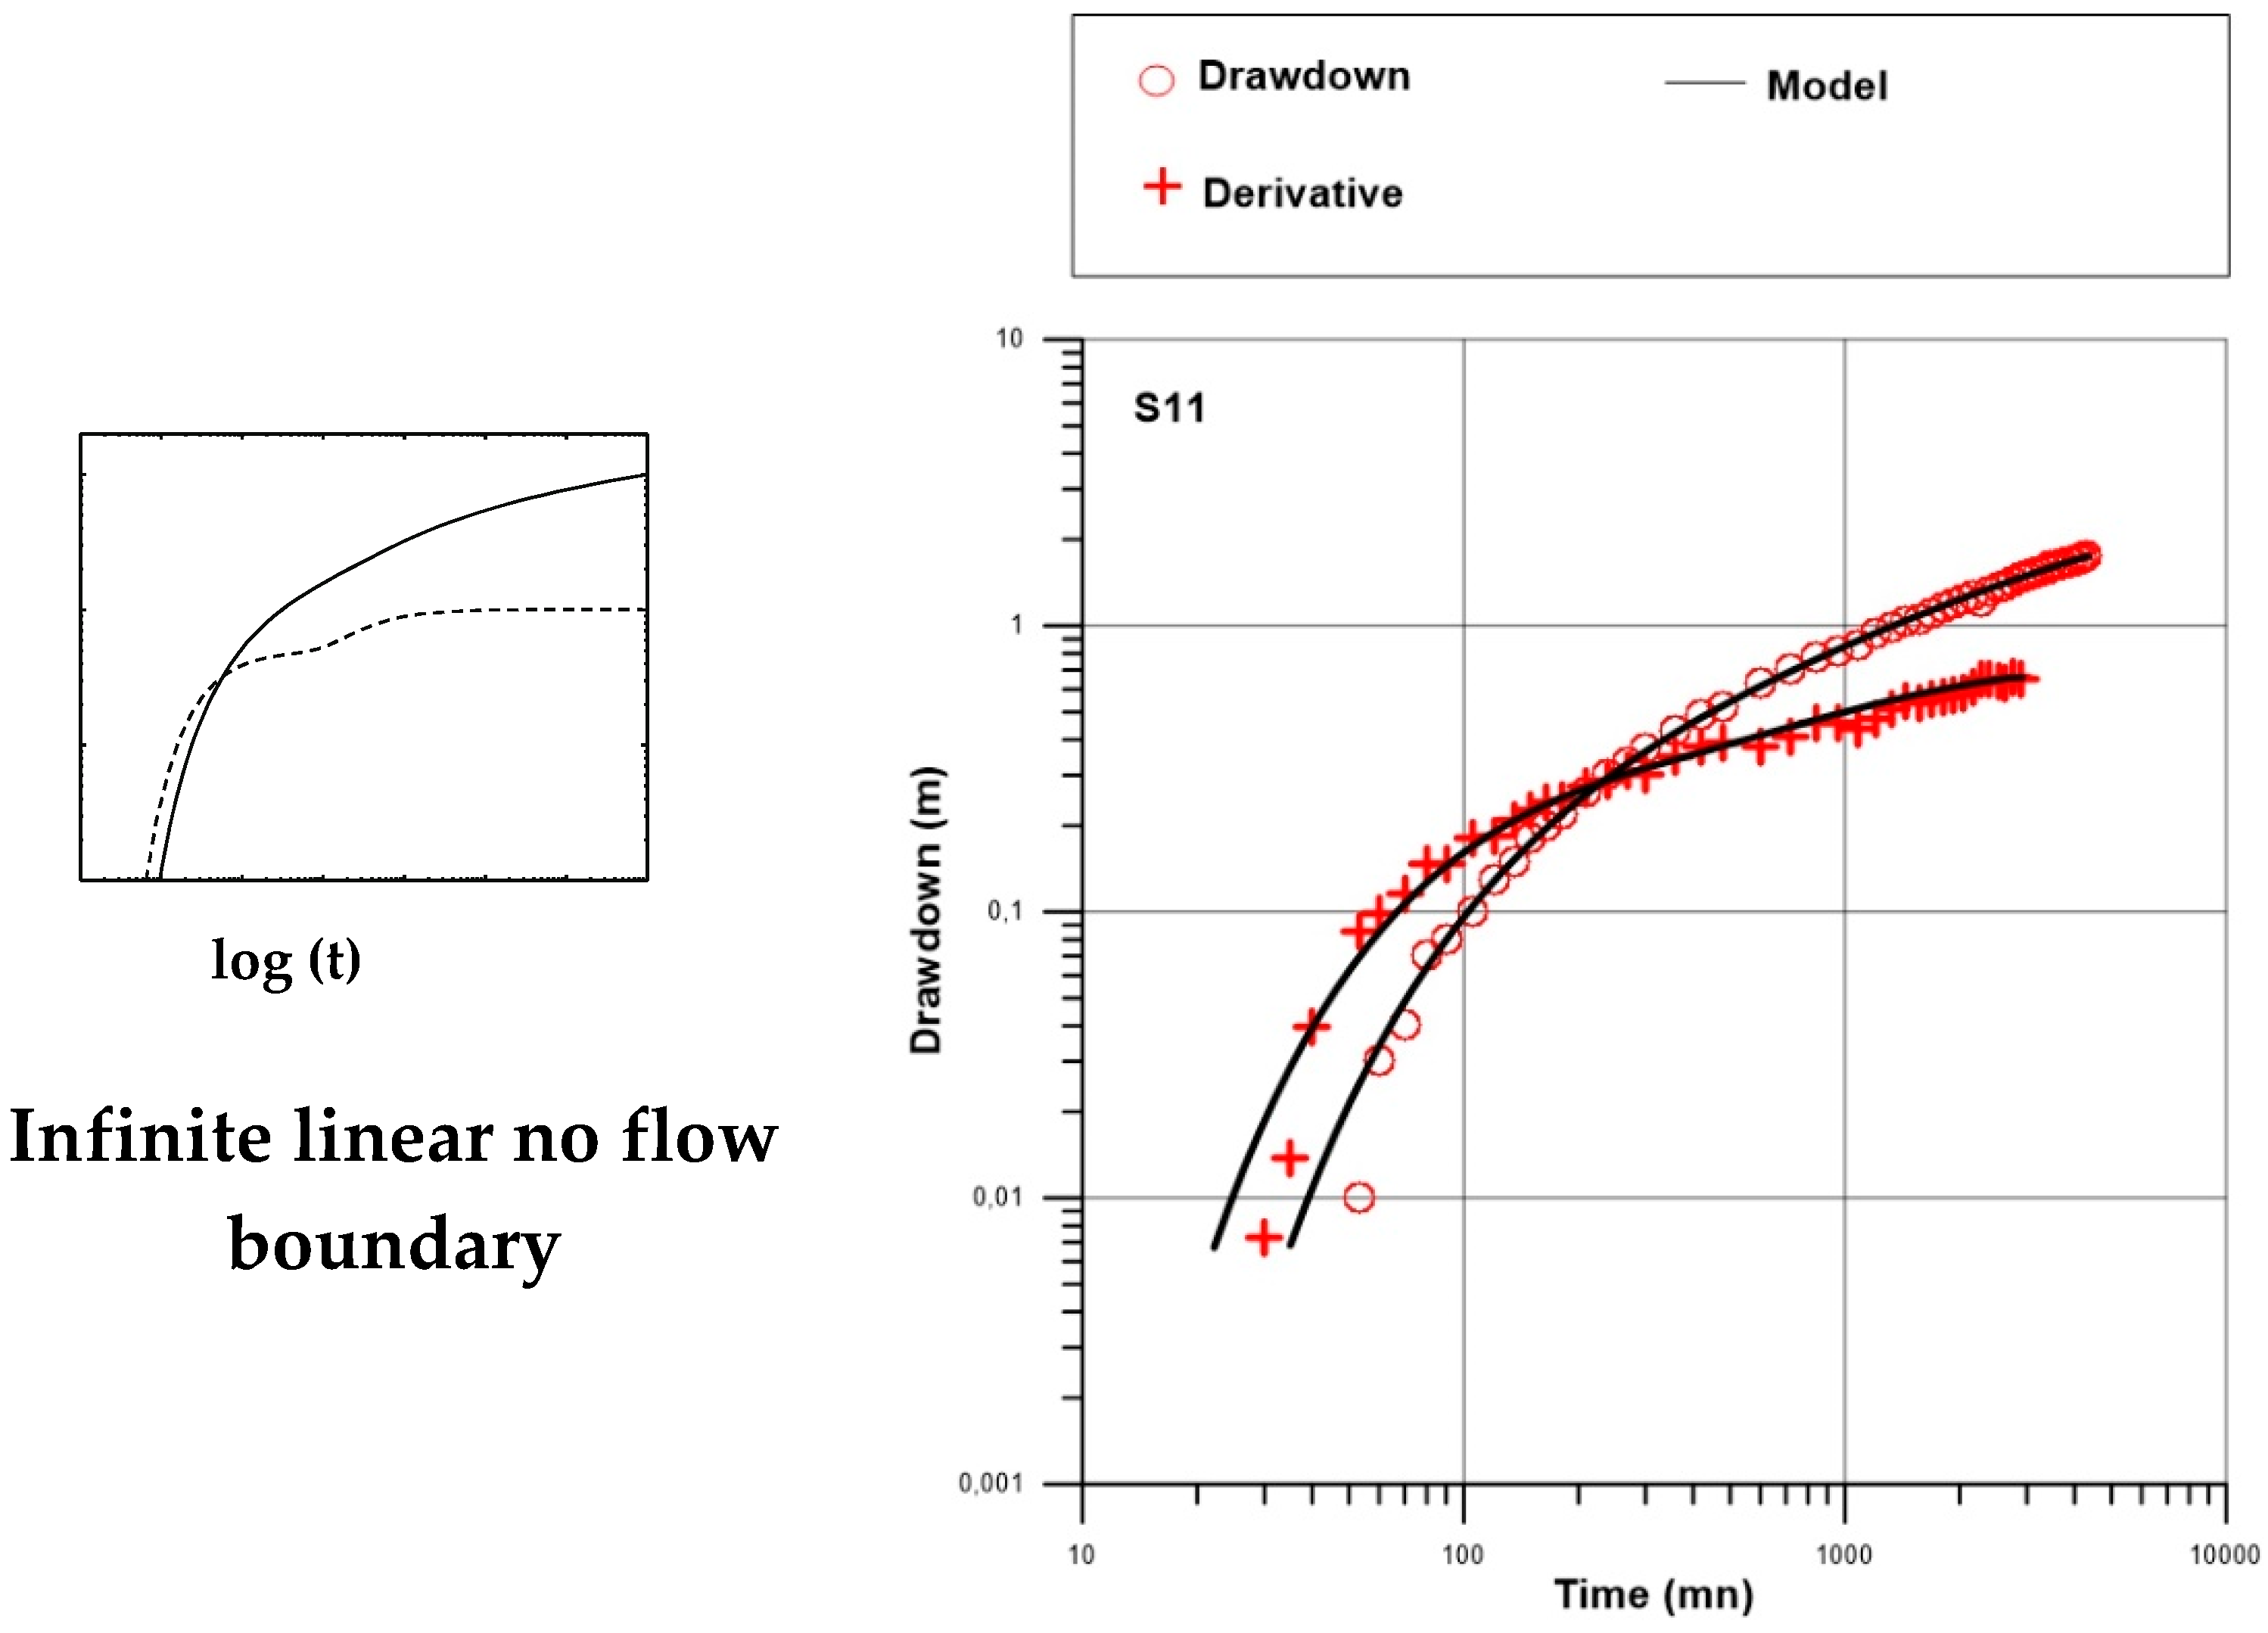
The pumping site S10/S11 is located on profile 1 at about 20 m from the resistant structure. The thickness of the tested fissured layer is about 22 m. The interpretation of the pumping tests reveals that the drawdown and its derivative curves are similar to the Theis model in the early time of pumping (Figure 12). Thereafter, the derivative continues to grow. This type of behavior is consistent with the presence of the no flow boundary of infinite extension (as regards the duration of the test) referring to the diagnostic curves. This is consistent with the observed structure in the vicinity of the pumping site. As a result, the Theis analytical solution to which a no flow boundary is added at variable distances from the pumping well has been used to determine the position of this limit for a better fit of the experimental data. We obtain a better fit for a limit located between 20 and 30 m from the pumping well (Figure 13), which is in agreement with the real distance between the pumping site and the resistant structure observed on the weathering profile. The corresponding transmissivity and storativity are T = 4.2 × 10⁻⁴ m²/s and S = 4.5 × 10⁻² respectively.
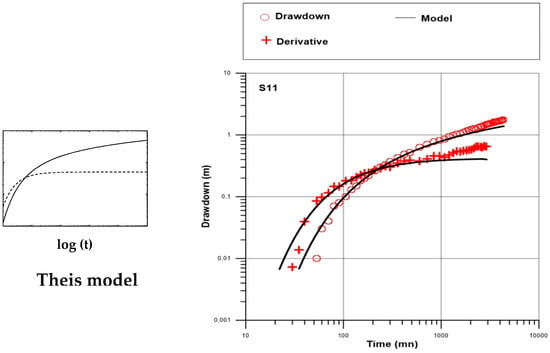
Figure 12.
Interpretation of pumping test S10/S11: diagnostic plot (left) and data superimposed with a fitted Theis model (right).
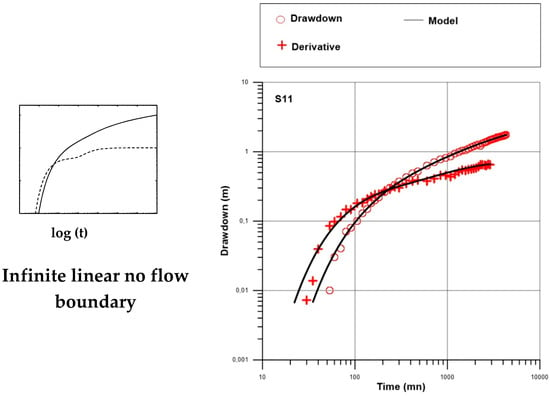
Figure 13.
Interpretation of pumping test S10/S11: diagnostic plot (left) and data superimposed with a fitted Theis solution with an infinite linear no flow boundary located between 20 and 30 m from the pumping site (right).
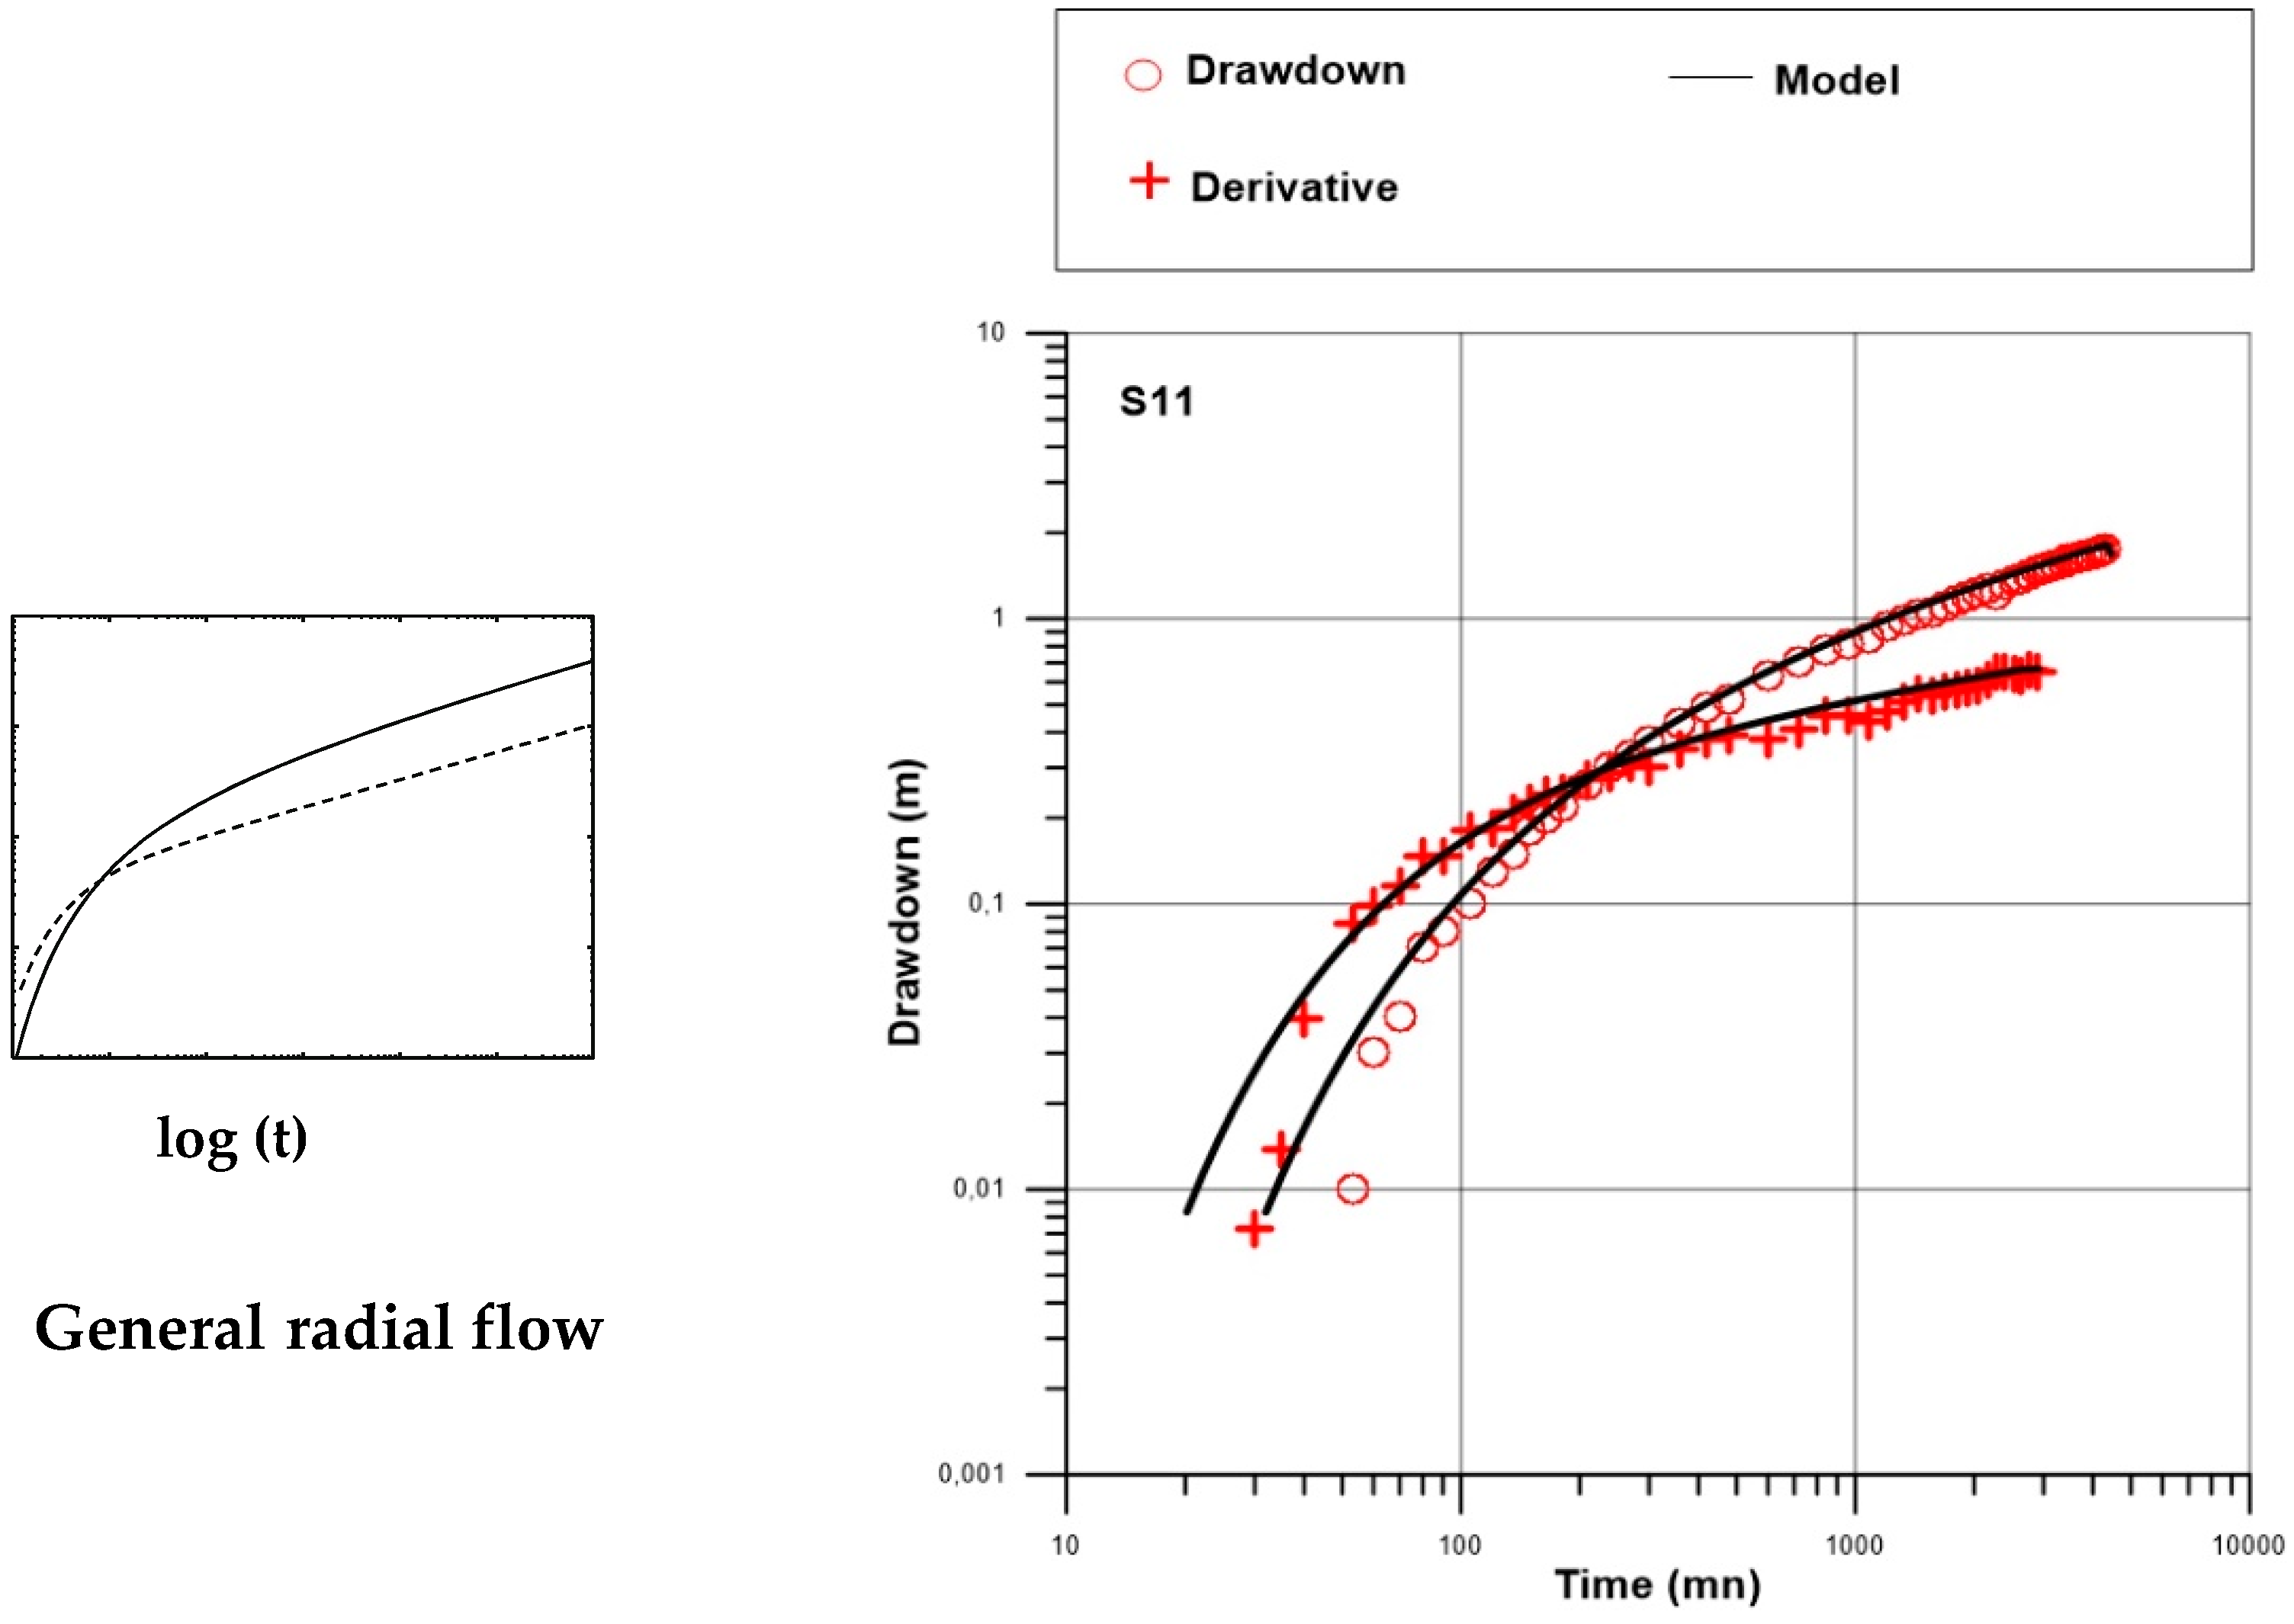
In addition to the Theis solution, the interpretation of this pumping test reveals that the drawdown and its derivative curves are also similar to the generalized radial flow model described by Renard et al. [12]. For this flow regime, the analytical solution of Barker [21] allows a better fit of the experimental data (Figure 14). The corresponding transmissivity and storativity T = 4.8 × 10⁻⁴ and S = 3.7 × 10⁻². The flow dimension for Barker solution is n = 1.578, being less than 2, it could also reflect the presence of an impermeable limit [22]. The corresponding hydraulic conductivity is 1.8 × 10⁻⁵ m/s.
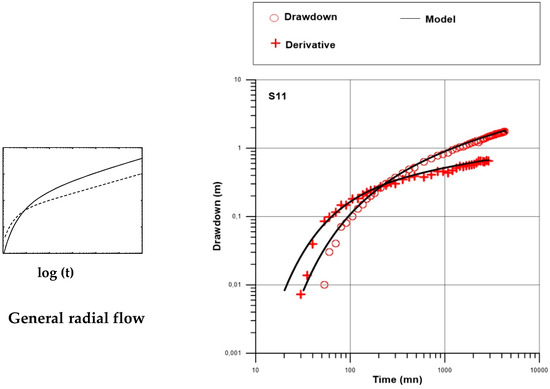
Figure 14.
Interpretation of pumping test S10/S11: diagnostic plot (left) and data superimposed with a fitted Barker model (right).
The two solutions lead to similar values of hydrodynamic parameters. We therefore postulate that the resistant vertical structure could constitute a no flow boundary suggested by the used solutions.
4.4. Pumping Test SVCF/SVCP
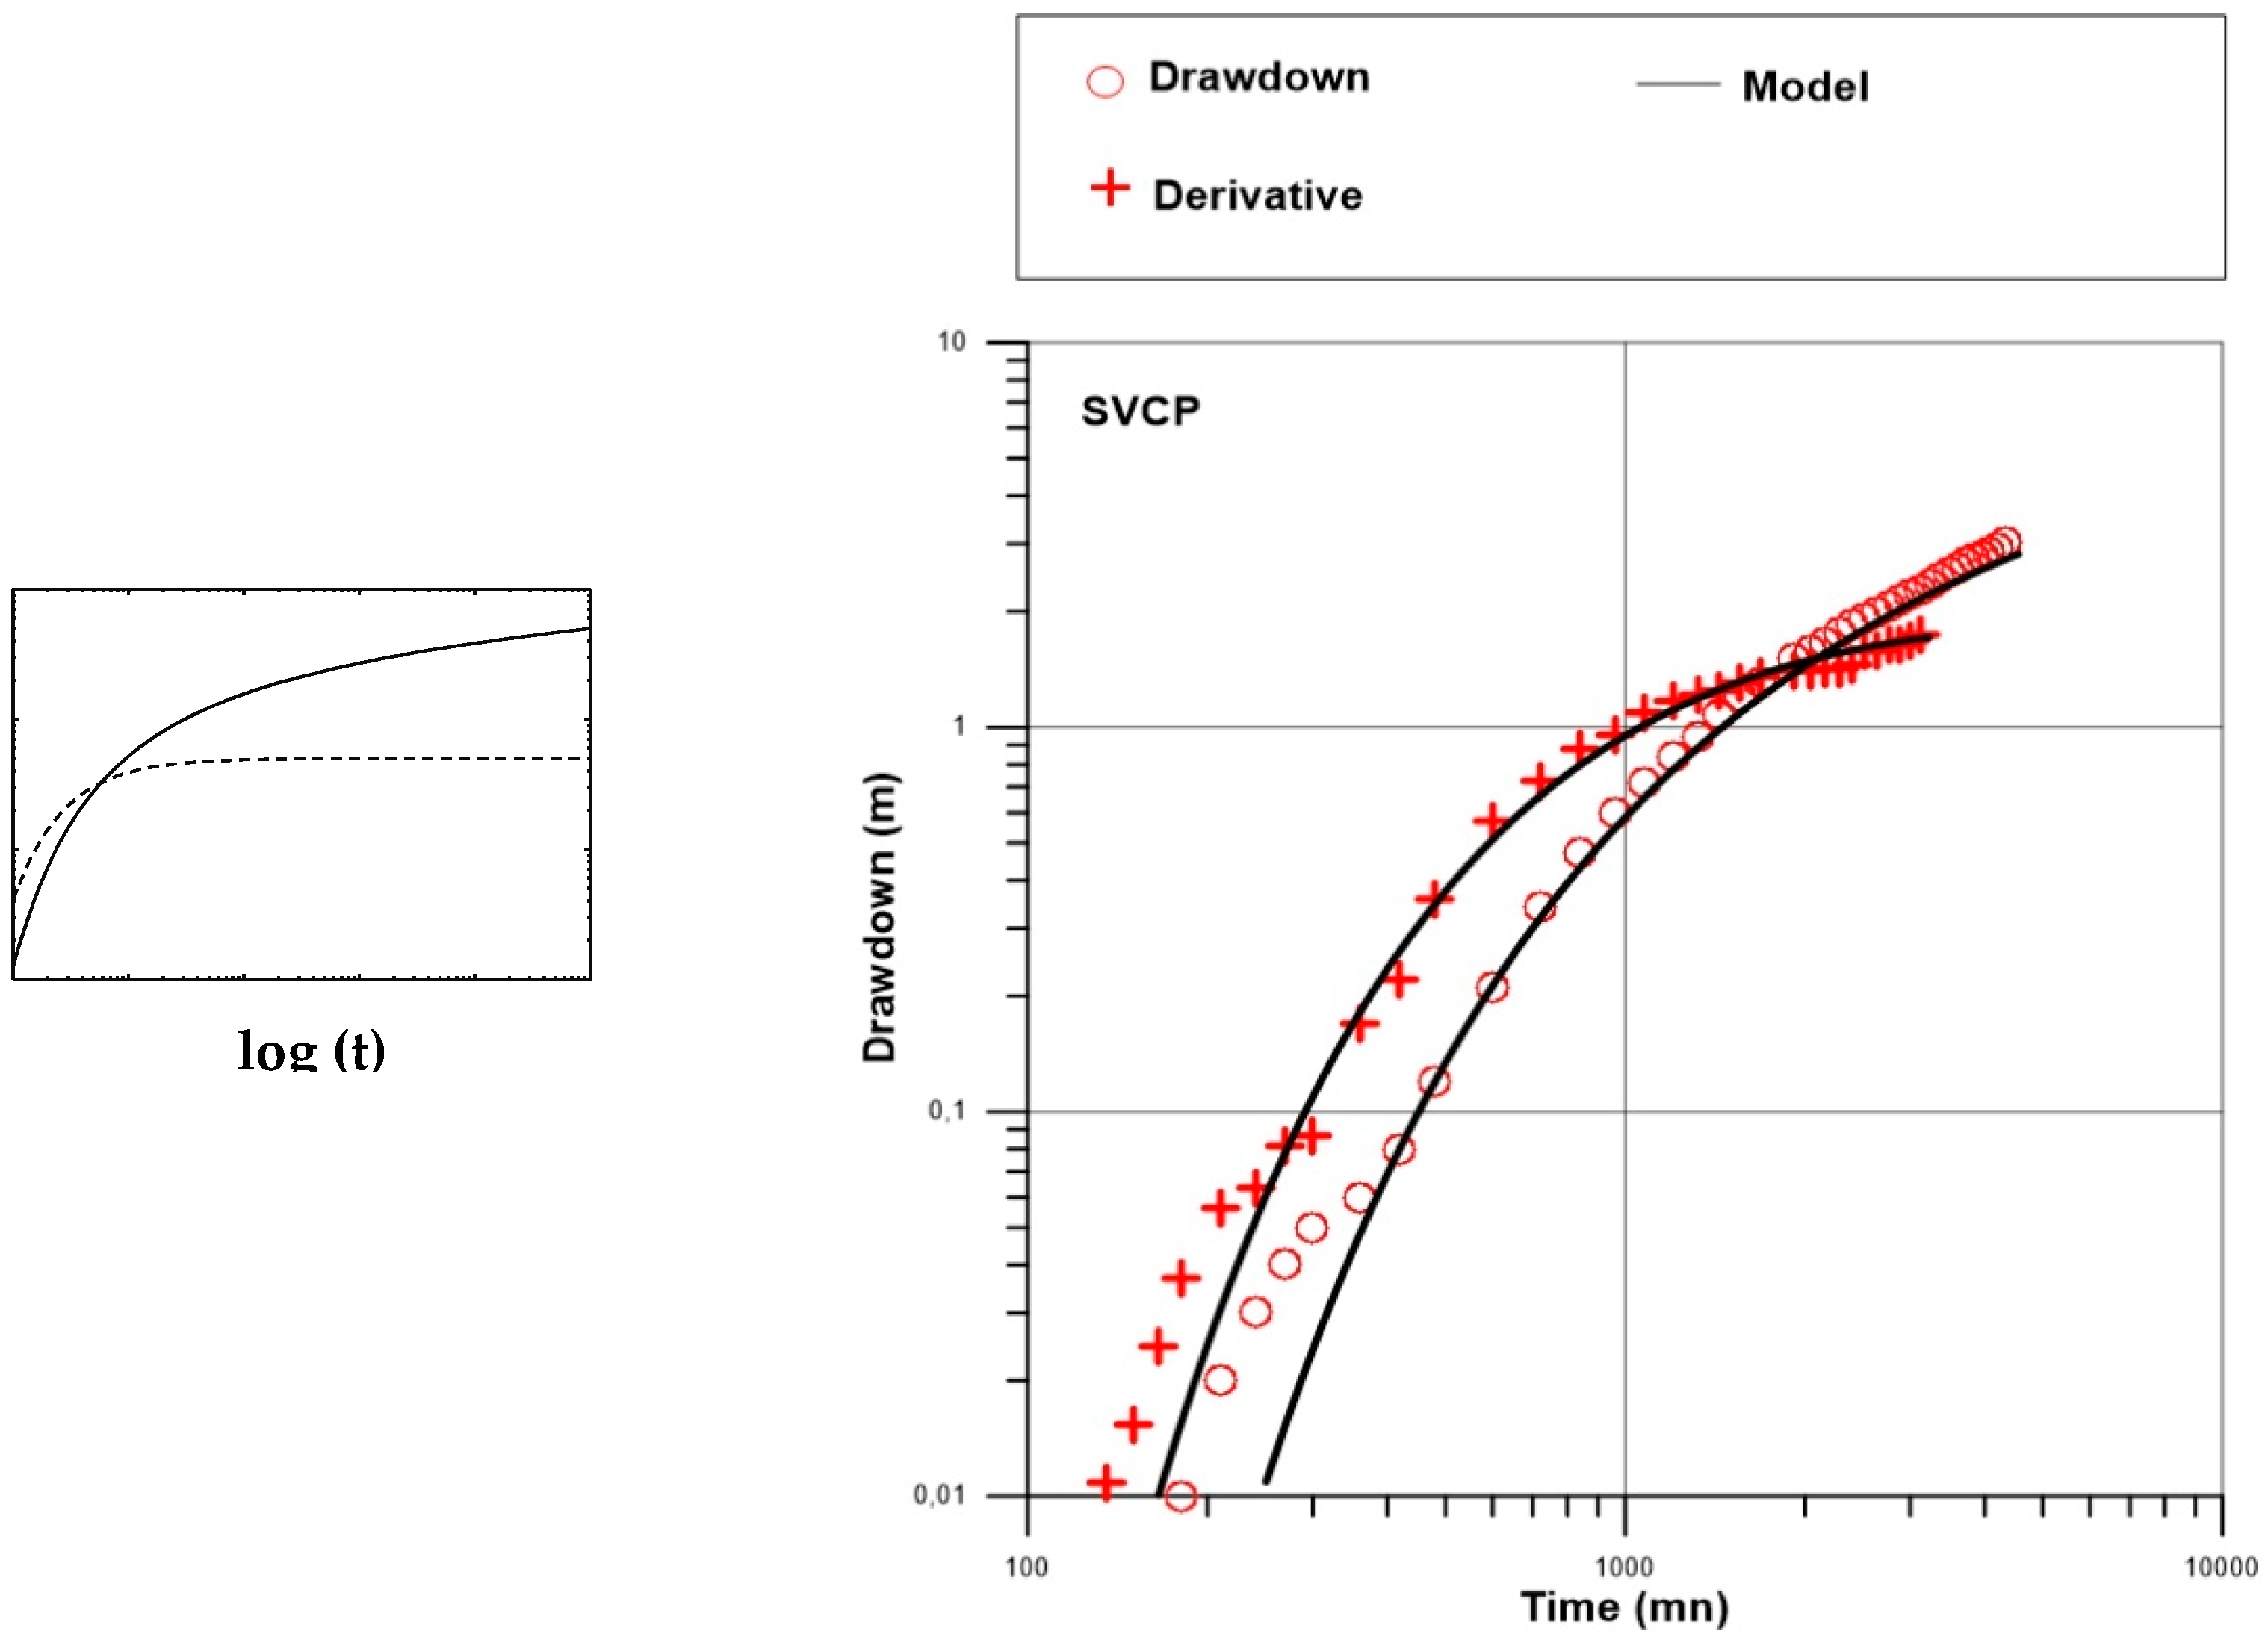
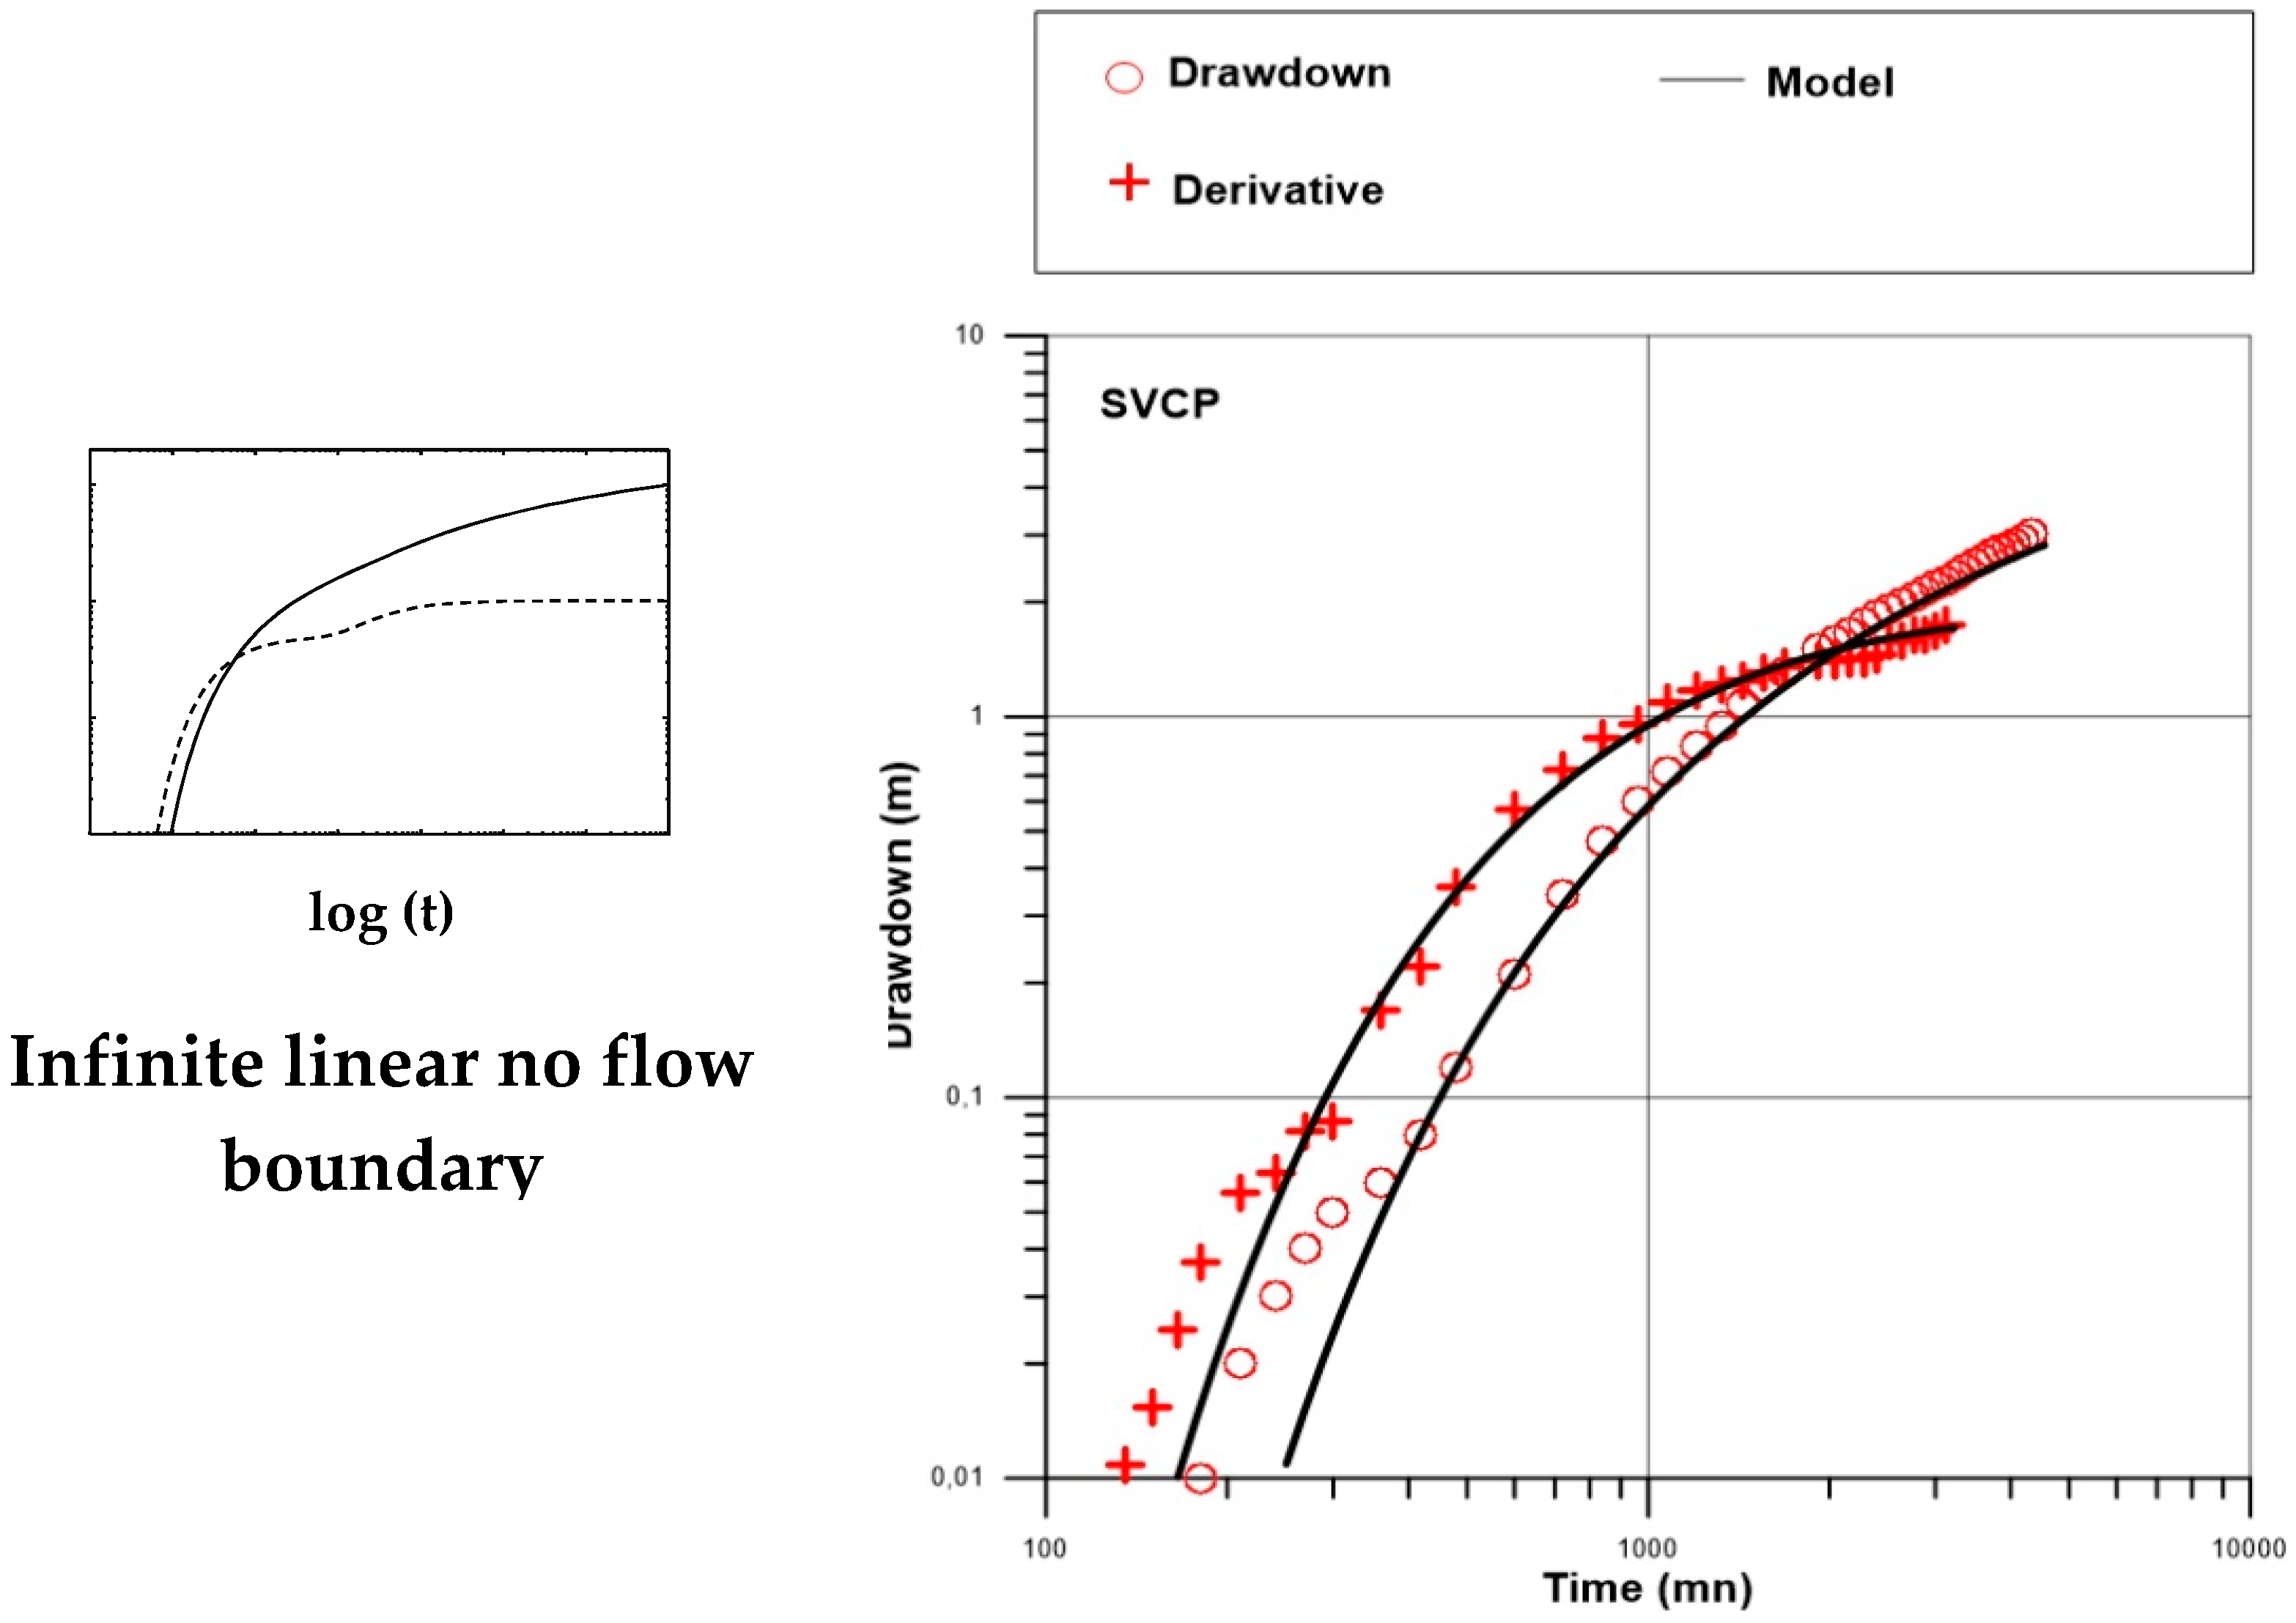
The pumping site SVCF/SVCP is located on Profile 1 in the central valley. At this location, the weathering profile is dominated by a considerable thickness of clayey saprolite up to 30 m. Above this, we note a deepening of the fissured layer and the unweathered rock. The thickness of the fissured layer based on drilling data is about 28 m. The pumping well is located approximately 250 m from the resistant structure whose behavior is similar to that of a no flow limit observed during the interpretation of pumping S10/S11. The interpretation of this test reveals that the derivative curve is similar to the Theis model (Figure 15). The Theis analytical solution was therefore used for a better fit of the experimental data. The corresponding transmissivity and storativity are T = 4.7 × 10⁻⁵ m2/s and S= 4.4 × 10⁻². The corresponding hydraulic conductivity is 1.6 × 10⁻⁶ m/s. Subsequently, we tried to understand the influence of the resistant structure on the interpretation of this pumping by creating a no flow limit at variable positions ranging from 200 to 250 m from the pumping well. We find that the introduction of such a limit has no effect on the initial Theis model (Figure 16). Consequently, the resistant structure would not be in the capture zone of the pumping.
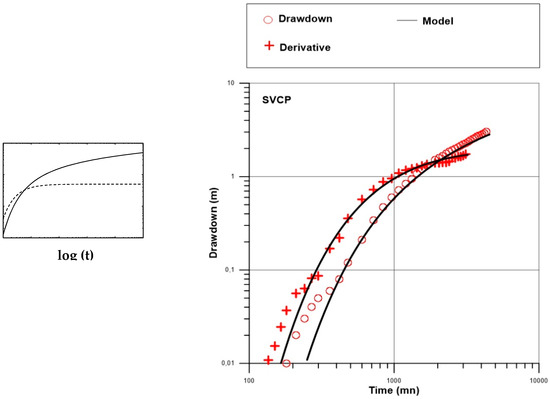
Figure 15.
Interpretation of pumping test SVCF/SVCP: diagnostic plot (left) and data superimposed with a fitted Theis model (right).
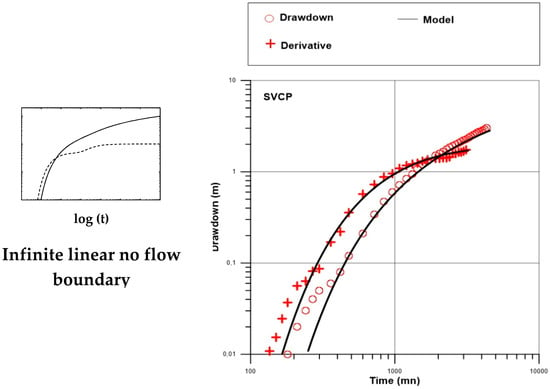
Figure 16.
Interpretation of pumping test SVCF/SVCP: diagnostic plot (left) and data superimposed with a fitted Theis model with an infinite linear boundary located at 250 m from the pumping (right).
4.5. Pumping Test S15/S16
The pumping test conducted at S15/S16, in the center of profile 2, took place in a flooding zone where the infiltration is slow due to a very clayey layer at the surface. Moreover, the lithology described from the geological model reveals the presence of silt and clay at the top of the weathering profile up to 30 m deep. The thickness of the fissured reaches 35 m. At the early time of pumping, the drawdown and its derivative are very close and have a unit slope indicating a wellbore storage effect, and then we observe a transitional regime where the derivative is in the shape of a dome. At later time, we observe an infinite acting radial flow (Figure 17). The model that best fits the experimental data is that of Dougherty and Babu [22]. The corresponding transmissivity and storativity are T = 2.4 × 10⁻⁴ m2/s and S = 7 × 10⁻⁵. The computed hydraulic conductivity of the fissured layer is 6.6 × 10⁻⁶ m/s. The adopted solution and the obtained storativity are those of a confined aquifer. This observation is in agreement with the clay tendency of the saprolite thickness on the weathering at pumping site. Since clay saprolite is present from the surface, it is undoubtedly an impervious layer that confines the pumped aquifer.
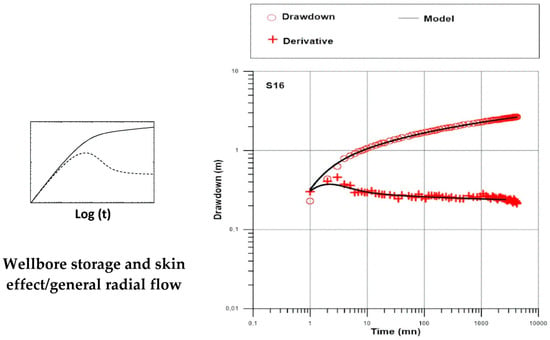
Figure 17.
Interpretation of pumping test S15/S16: diagnostic plot (left) and data superimposed with a fitted Dougherty-Babu model (right).
5. Discussion
The transmissivity values of the weathered fissured layer vary between 1.7 × 10⁻⁴ and 4.7 × 10⁻⁵ m2/s. The pumping sites S1/S2, S10/S11 and S15/S16 show the highest transmissivity values (order of 10−4 m2/s). The lowest value (order of 10−5 m2/s) is recorded at the SVCF/SVCP pumping site. The corresponding hydraulic conductivity values vary between 2 × 10⁻⁵ and 6.6 × 10⁻⁶ m/s. The pumping sites S1/S2 and S10/S11 show the highest hydraulic conductivity values (order of 10−5 m/s) whereas the pumping sites SVCF/SVCP and S15/S16 show the lowest values (order of 10−6 m/s). Simultaneous analysis of the hydraulic properties of the weathered fissured layer and the geometry and structure of the weathering profile reveals no tendency. In other words, the geometry and structure of the weathering profile cannot explain quantitatively the hydraulic properties but rather helps to validate the pumping interpretation. Storativity values range from 0.06 to 7 × 10⁻⁵. The pumping site S1/S2, S10/S11 and SVCF/SVCP show the highest storativity values (order of 10−2). The lowest value is recorded at site S15/S16 (order of 10−5), which shows that the aquifer at this location is confined. This observation is consistent with the very clayey nature of the upper layer of the weathering profile. The upper layer behaves as an impervious layer making the site floodable. The aquifers at pumping sites S1/S2, S10/S11 and SVCF/SVCP sites behave as unconfined or semi-confined. This behavior can be explained at the pumping site S1/S2 by the presence of a sandy-clayey saprolite layer at the top of the weathering profile acting as semi-impervious layer. At the pumping sites S10/S11 and SVCF/SVCP sites, the presence on both sides of the alloterite layer a significant thickness of isterterite would probably be responsible for the semi-permeable behavior of the overlain saprolite. On the other hand, in terms of pumping substainability, the pumping site S1/S2 shows good characteristics due to the large thickness and the sandy-clayey nature of the overlain saprolite. The pumping sites S10/S11 and S15/S16 show unfavorable conditions of substainability due to the presence of a no flow boundary close to the pumping site S10/S11 and the very clayey nature of the saprolite, which cannot substain the pumping at the site S15/S16.
6. Conclusions
Taking into account the geometry and the structure of the weathering profile in the interpretation of the pumping tests conducted in the Sanon catchment allow choosing the appropriate solution for each pumping test, the following statements can be retained:
- -
- This approach is a flexible complement that should help the hydrogeologist to decide between different possible alternatives during the interpretation process. In profile 1, the fact that the fissured layer is weathered, and densely fissured and the overlying saprolite layer has a sandy tendency, allow choosing double porosity flow regime for interpreting pumping test conducted in S1/S2. Finally, the presence of a local anomaly (resistant structure) in the weathering profile made it possible to introduce no flow limit into the analytical solution chosen at S10/S11 and to specify the relative position of this limit from the pumping site.
- -
- In profile 2, the interpretation of the only pumping carried out at the center revealed the influence of the nature of the land cover and of the clayey weathering.
The hydrodynamic parameters values estimated in the Sanon catchment vary between 5 × 10⁻⁴ and 4 × 10⁻⁵ m2/s for the transmissivity, between 6 × 10⁻² and 7 × 10⁻⁵ for the storativity and between 2.43 × 10⁻⁵ and 1.68 × 10⁻⁶ m/s for the hydraulic conductivity. Finally, the present study implemented in the Sanon demonstrates that the development of 2D conceptual geological models allow apprehending the incidence of such structure and geometry on the aquifer hydrodynamic properties. In other words, the 2D geophysical data are enough to locate the best permeable areas, or the areas where the structure of the aquifer without impervious boundaries and with leakage favor a good long-term behavior of the well. The land covers, the geometry of the saprolite layer, the presence of no flow limits, etc. are all factors that explain the variation of these properties, which appear to be much less unpredictable.
Acknowledgments
This research is carried out in the framework of the GRIBA project (Groundwater Resources In Basement rocks of Africa), funded by the African Union, the European Union, and the Institut de Recherche pour le Développement (IRD) (grant AURG/098/2012). We personally thank Dr. Jean-Michel Vouillamoz the project coordinator for supporting us during the project.
Author Contributions
Mahamadou Koita wrote the paper and supervised the data analysis. Hamma Fabien Yonli, Donissongou Dimitri Soro and Emmanuel Dara collected and analyzed all the data. Jean-Michel Vouillamoz is the project coordinator.
Conflicts of Interest
The authors declare no conflict of interest.
Appendix A
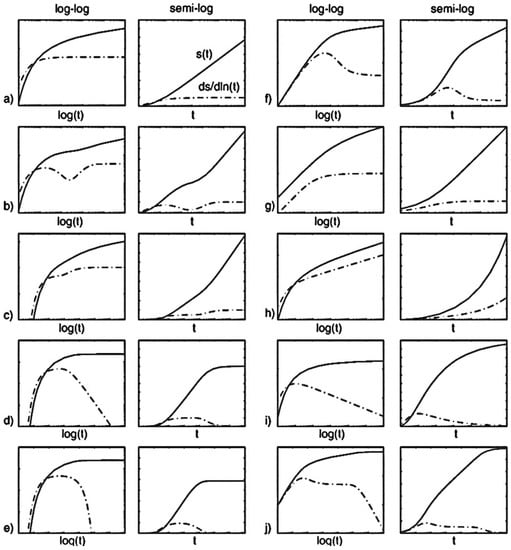
Figure A1.
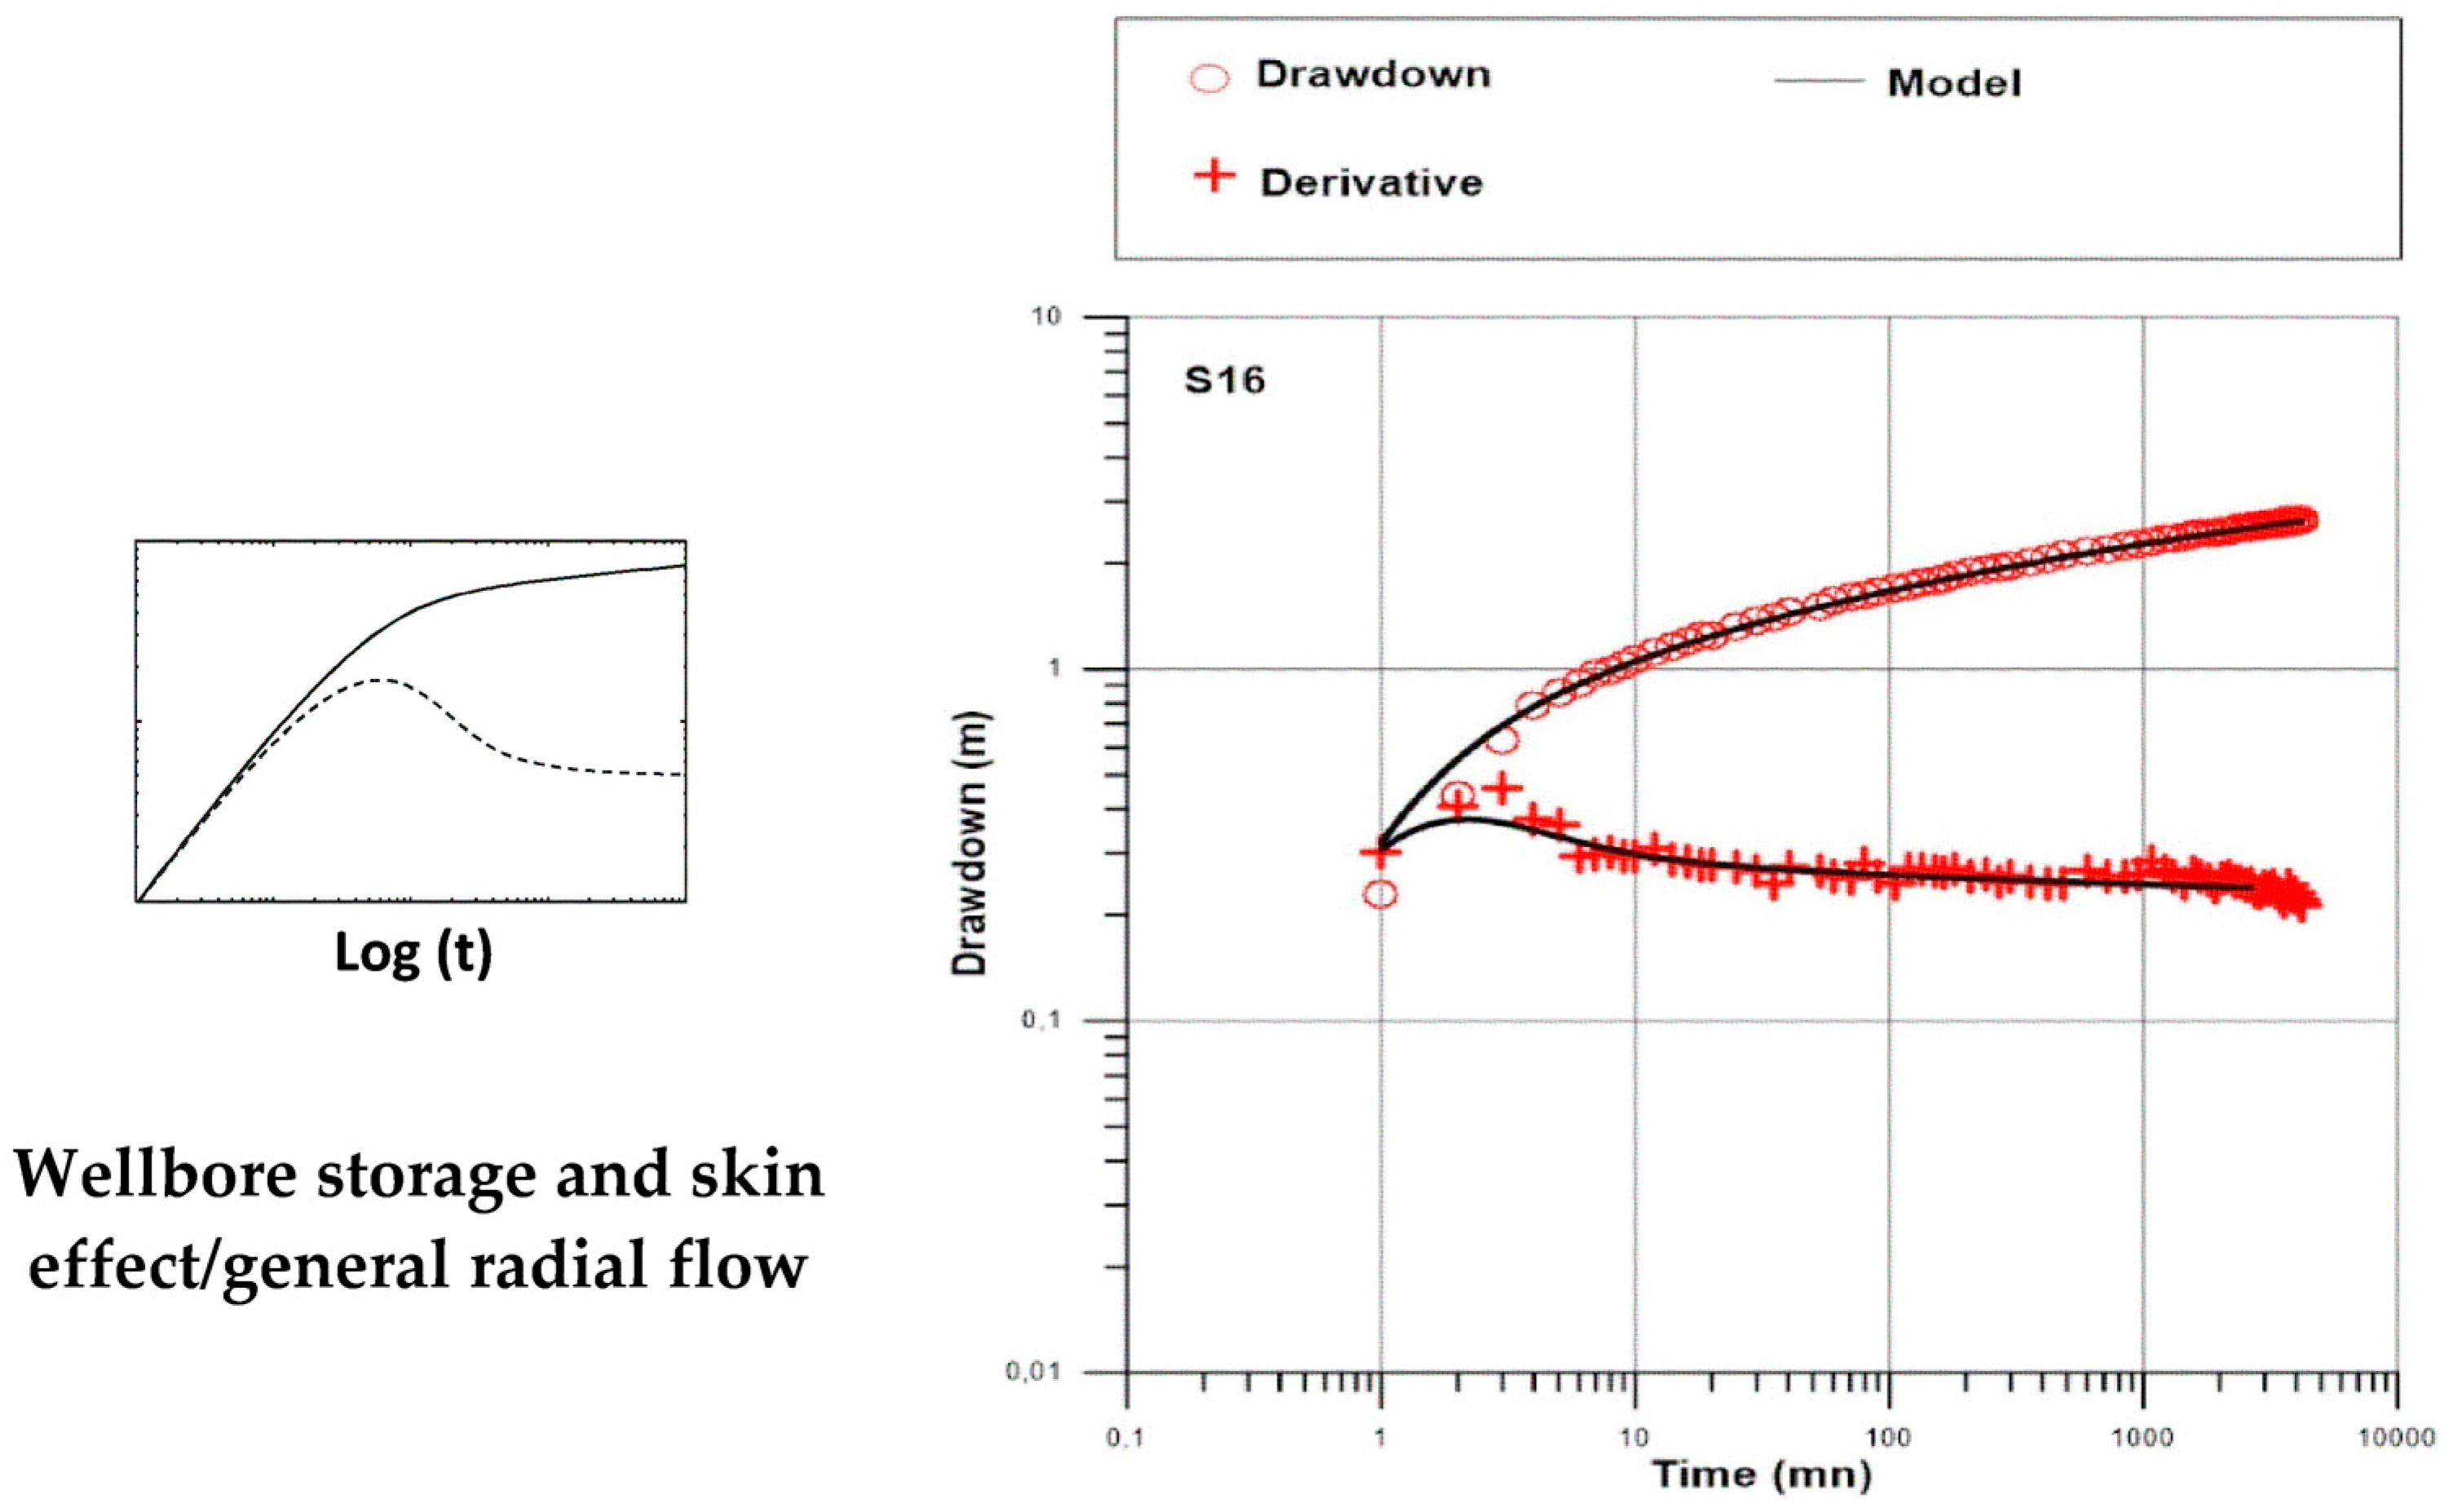
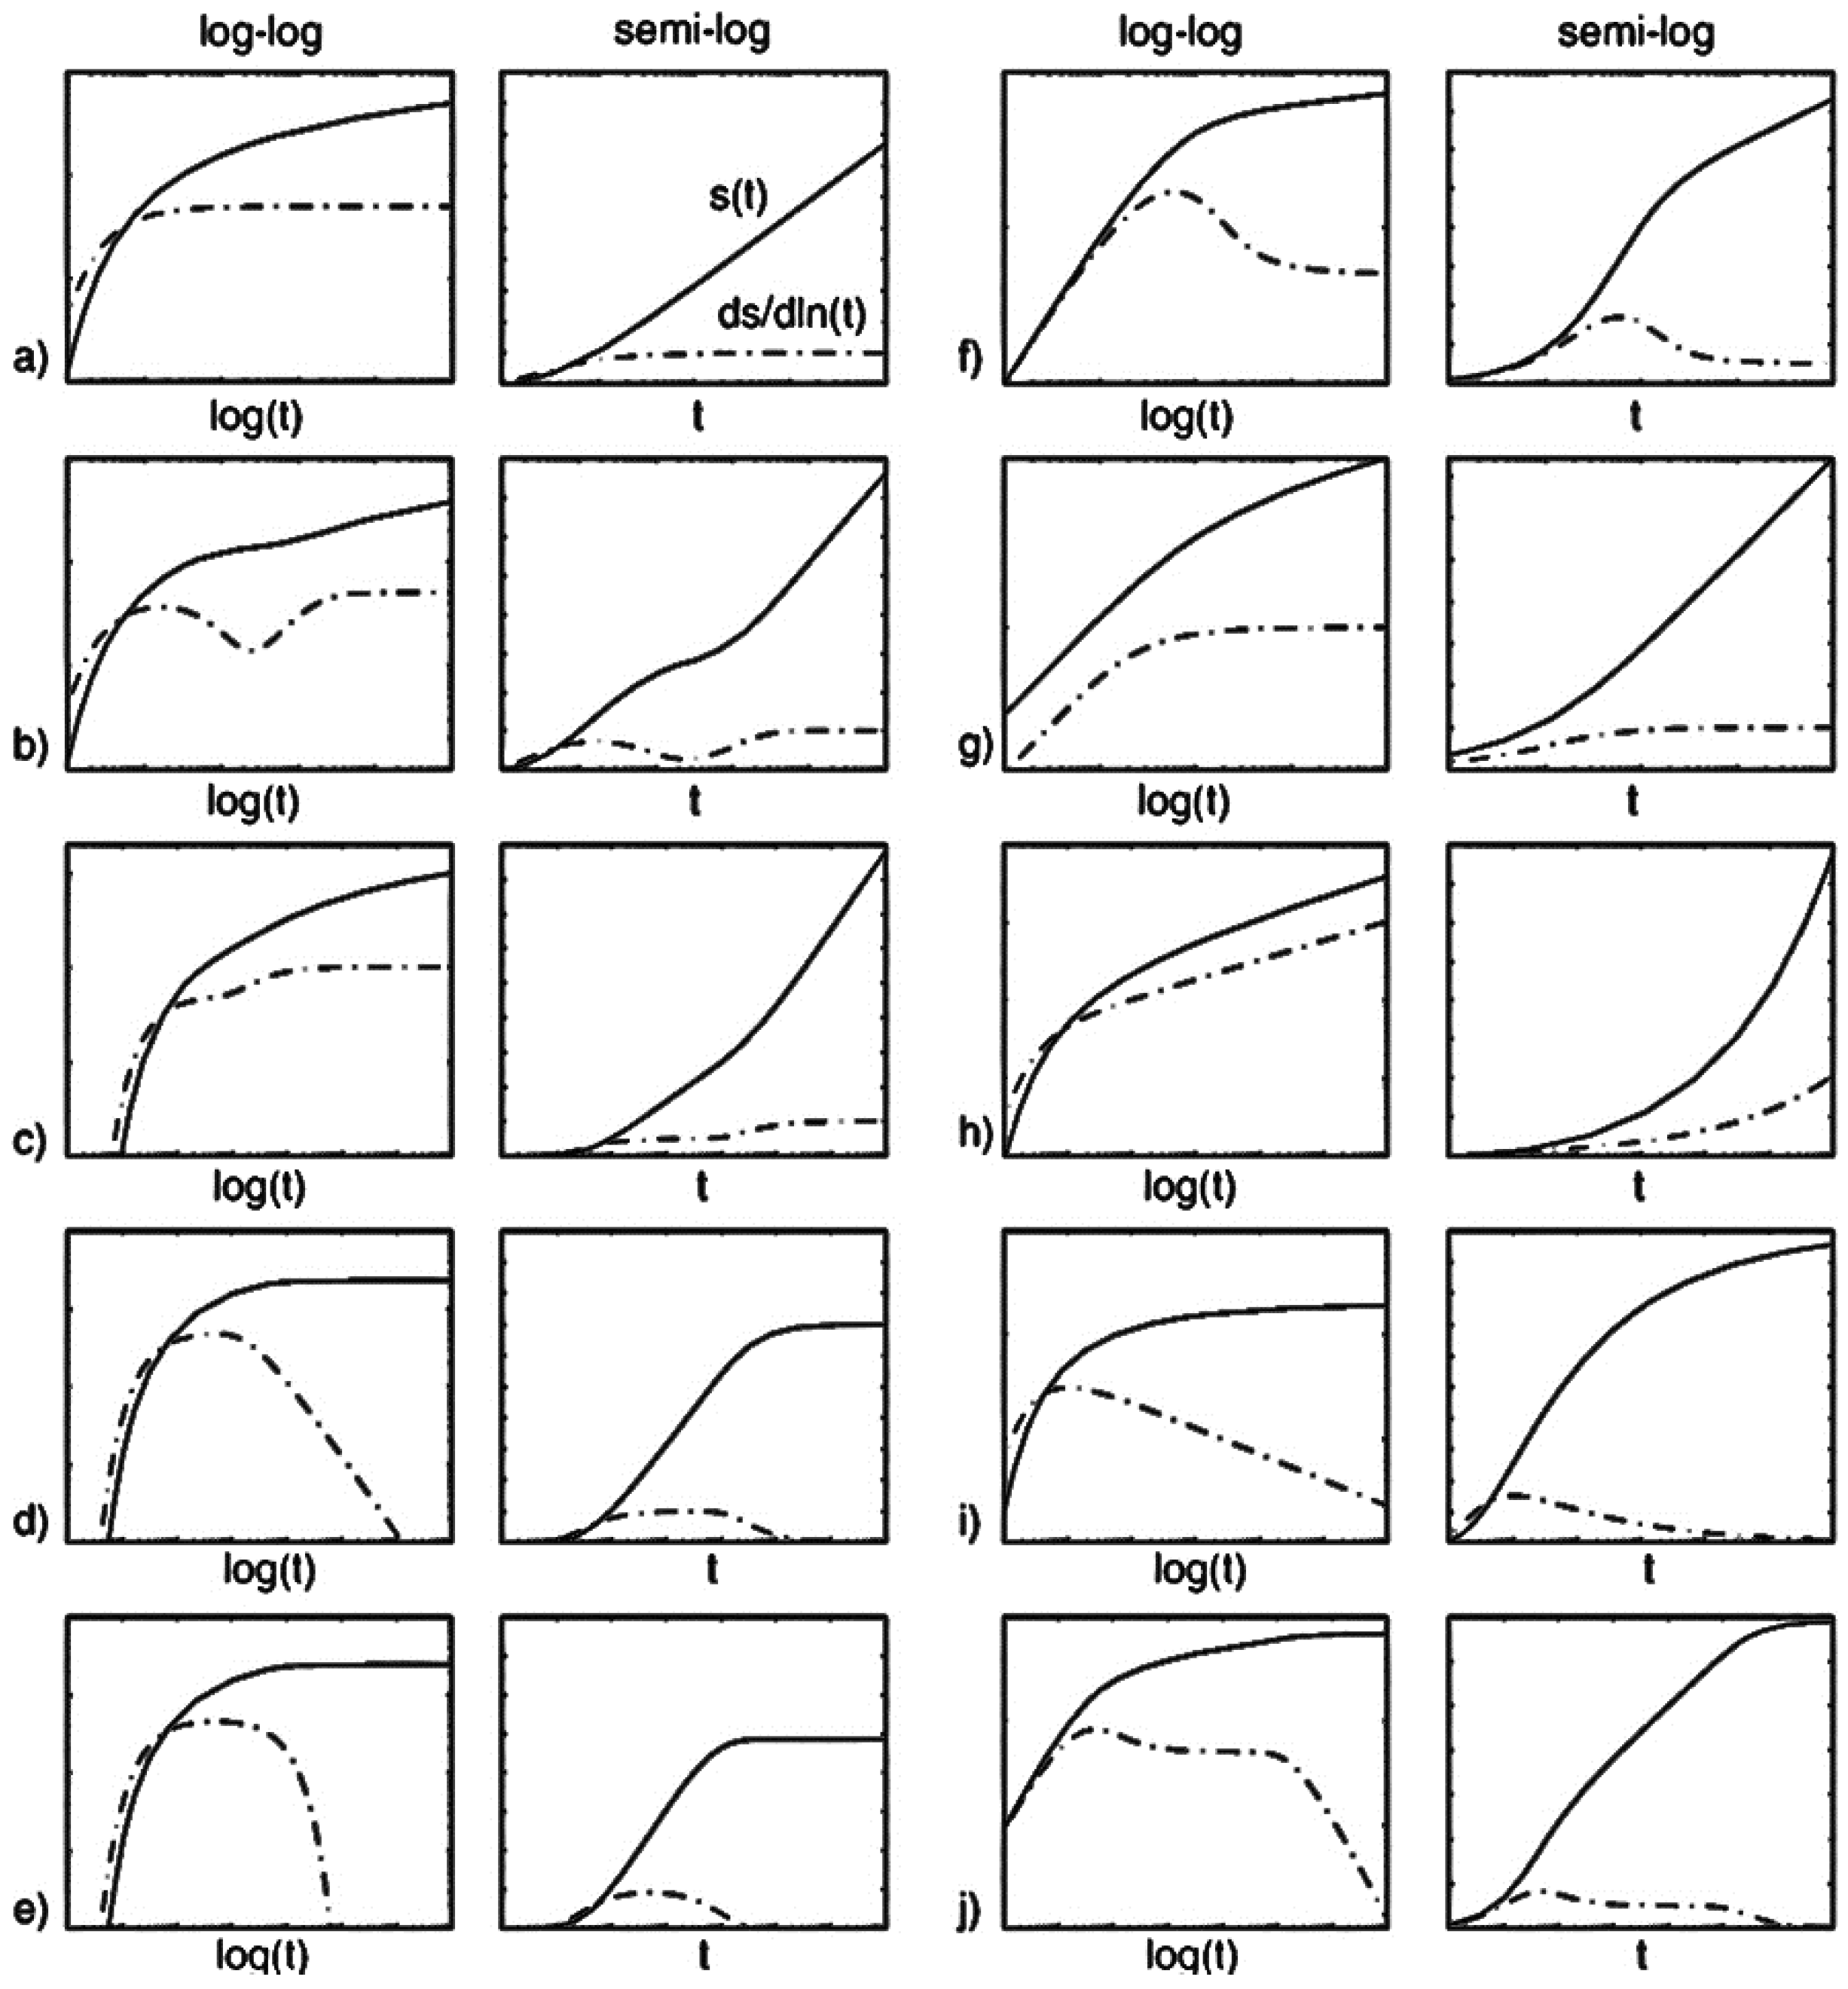
(a) Theis model: infinite two-dimensional confined aquifer; (b) double porosity or unconfined aquifer; (c) infinite linear no-flow boundary; (d) infinite linear constant head boundary; (e) leaky aquifer; (f) well-bore storage and skin effect; (g) infinite conductivity vertical fracture; (h) general radial flow—non-integer flow dimension smaller than 2; (i) general radial flow—noninteger flow dimension larger than 2; (j) combine effect of well bore storage and infinite linear constant head boundary.
References
- Lachassagne, P. Overview of the Hydrogeology of Hard Rock Aquifers: Applications for Their Survey, Management, Modelling and Protection. In Groundwater Dynamics in Hard Rock Aquifers: Sustainable Management and Optimal Monitoring Network Design, 1st ed.; Ahmed, S., Jayakumar, R., Salih, A., Eds.; Capital Pub Co.: New Delhi, India, 2008; pp. 40–63. [Google Scholar]
- Leray, S. Caractérisation des Aquifères de Socle Cristallin et de leur Ressource en eau—Apport des Données d’ «âge» de L’eau. Ph.D. Thesis, Université de Rennes 1, Rennes, France, 2012. [Google Scholar]
- Calow, R.C.; Macdonald, A.M.; Nicol, A.L.; Robins, N.S. Ground water security and drought in Africa: Linking availability, access, and demand. Ground Water 2010, 48, 246–256. [Google Scholar] [CrossRef] [PubMed]
- Mukherji, A. Spatio-temporal analysis of markets for groundwater irrigation services in India: 1976–1977 to 1997–1998. Hydrogeol. J. 2008, 16, 1077–1087. [Google Scholar] [CrossRef]
- Wyns, R.; Baltassat, J.; Lachassagne, P.; Legchenko, A.; Vairon, J.; Mathieu, F. Application of proton magnetic resonance soundings to groundwater reserve mapping in weathered basement rocks (Brittany, France). Bull. Soc. Géol. Fr. 2004, 175, 21–34. [Google Scholar] [CrossRef]
- Dewandel, B.; Lachassagne, P.; Wyns, R.; Maréchal, J.C.; Krishnamurthy, N.S. A generalized 3-D geological and hydrogeological conceptual model of granite aquifers controlled by single or multiphase weathering. J. Hydrol. 2006, 330, 260–284. [Google Scholar] [CrossRef]
- Koïta, M.; Jourde, H.; Rossier, Y. Relative importance of weathering profiles and major fracture zones to fit the water balance of a hydrogeological catchment in hard rocks. Int. J. Environ. Sci. 2013, 4, 296–314. [Google Scholar]
- Soro, D.D.; Koïta, M.; Biaou, C.A.; Outoumbe, E.; Vouillamoz, J.M.; Yacouba, H.; Guérin, R. Geophysical demonstration of absence of correlation between lineaments and hydrogeologically useful fractures: Case study of Sanon hard rock aquifer (central-northern Burkina Faso). J. Afr. Earth Sci. 2017, 19, 842–852. [Google Scholar] [CrossRef]
- Lachassagne, P.; Wyns, R.; Dewandel, B. The fracture permeability of hard rock aquifers is due neither to tectonics, nor to unloading, but to weathering processes. Terra Nova 2011, 23, 145–161. [Google Scholar] [CrossRef]
- Lachassagne, P.; Dewandel, B.; Wyns, R. Le Modèle Conceptuel Hydrogéologique des Aquifères de Socle Altéré et ses Applications Pratiques. In Colloque Aquifères de Socle: Le Point sur les Concepts et les Applications Opérationnelles; Comité français d’Hydrogéologie: La Roche-sur-Yon, France, 2015. [Google Scholar]
- Schlumberger. Well Test Interpretation, 1st ed.; Schlumberger: Sugar land, TX, USA, 2002; pp. 25–42. [Google Scholar]
- Renard, P.; Glenz, D.; Mejias, M. Understanding diagnostic plots for well-test interpretation. Hydrogeol. J. 2009, 17, 589–600. [Google Scholar] [CrossRef]
- Compaore, G. Évaluation de la Fonction Capacitive des Altérites, Site Expérimental de Sanon: Socle Granito-Gneissique Sous Climat de Type Soudano-Sahélien. Ph.D. Thesis, Université d’Avignon et des pays de Vaucluse, Avignon, France, 1997. [Google Scholar]
- Kruseman, G.P.; de Ridder, N.A. Analysis and Evaluation of Pumping Test Data, 2nd ed.; ILRI: Wageningen, The Netherlands, 2000; pp. 13–25. [Google Scholar]
- Theis, C.V. The relation between the lowering of the piezometric surface and the rate and duration of discharge of a well using groundwater storage. Am. Geophys. Union Trans. 1935, 16, 519–524. [Google Scholar] [CrossRef]
- Cooper, H.H.; Jacob, C.E. A generalized graphical method for evaluating formation constants and summarizing well field history. Am. Geophys. Union Trans. 1946, 27, 526–534. [Google Scholar] [CrossRef]
- Ehlig-Economides, C.A.; Hegeman, P.; Vik, S. Guidelines Simplify Well Test Interpretation. Oil Gas J. 1994, 92, 33–40. [Google Scholar]
- Bourdet, D.; Ayoub, J.A.; Pirard, Y.M. Use of pressure derivative in well-test interpretation. SPE Form. Eval. 1989, 40, 293–302. [Google Scholar] [CrossRef]
- Moench, A.F. Flow to a well of finite diameter in a homogeneous, anisotropic water-table aquifer. Water Resour. Res. 1997, 33, 1397–1407. [Google Scholar] [CrossRef]
- Barker, J.A. A generalized radial flow model for hydraulic tests in fractured rock. Water Resour. Res. 1988, 24, 1796–1804. [Google Scholar] [CrossRef]
- Hoareau, J. Utilisation D’une Approche Couplée Hydrogéophysique Pour L’étude des Aquifères. Applications Aux Contextes de Socle et Côtier Sableux. Ph.D. Thesis, Université Joseph-Fourrier-Grenoble 1, Grenoble, France, 2009. [Google Scholar]
- Dougherty, D.E.; Babu, D.K. Flow to a partially penetrating well in a double-porosity reservoir. Water Resour. Res. 1984, 20, 1116–1122. [Google Scholar] [CrossRef]
© 2017 by the authors. Licensee MDPI, Basel, Switzerland. This article is an open access article distributed under the terms and conditions of the Creative Commons Attribution (CC BY) license (http://creativecommons.org/licenses/by/4.0/).

