Article

Field Survey of 2018 Typhoon Jebi in Japan: Lessons for Disaster Risk Management

1
Department of Civil and Environmental Engineering, Waseda University, 3-4-1 Okubo, Shinjuku-ku, Tokyo 169-8555, Japan
2
Department of Architecture and Civil Engineering, Graduate School of Engineering, Toyohashi University of Technology, 1-1 Hibarigaoka, Tempaku, Toyohashi, Aichi 441-8580, Japan
*
Author to whom correspondence should be addressed.
Geosciences 2018, 8(11), 412; https://doi.org/10.3390/geosciences8110412
Submission received: 10 October 2018 / Revised: 6 November 2018 / Accepted: 7 November 2018 / Published: 9 November 2018
(This article belongs to the Special Issue River, Urban, and Coastal Flood Risk)

Abstract

:
Typhoon Jebi struck Japan on the 4 September 2018, damaging and inundating many coastal areas along Osaka Bay due to the high winds, a storm surge, and wind driven waves. In order to understand the various damage mechanisms, the authors conducted a field survey two days after the typhoon made landfall, measuring inundation heights and depths at several locations in Hyogo Prefecture. The survey results showed that 0.18–1.27 m inundation depths were caused by Typhoon Jebi. As parts of the survey, local residents were interviewed about the flooding, and a questionnaire survey regarding awareness of typhoons and storm surges, and their response to the typhoon was distributed. The authors also mapped the location of some of the containers that were displaced by the storm surge, aiming to provide information to validate future simulation models of container displacement. Finally, some interesting characteristics of the storm surge are summarized, such as possible overtopping at what had initially been thought to be a low risk area (Suzukaze town), and lessons learnt in terms of disaster risk management are discussed.

1. Introduction

Typhoon Jebi, which formed on the 28 August 2018, struck Japan on the 4 September 2018, damaging and inundating many areas of the coastal cities of Kobe and Osaka (see Figure 1). The weather system achieved a minimum central pressure of 915 hPa and a maximum one-minute sustained wind speed of 55 m/s (198 km/h; 31-August 09:00 JST (UTC+09:00)–02-September 00:00 JST) [1], and struck Japan as a Category 3 typhoon on the Saffir–Simpson scale. At the time of landfall it had wind speeds of over 44 m/s (158 km/h; ten-minute averaged wind speed), the strongest to hit mainland Japan in 25 years [1].
The route of the Typhoon Jebi was similar to that of the three typhoons which produced relatively high inundation heights in the past along Osaka Bay (Figure 1) [2,3]. As a result, Typhoon Jebi generated a storm surge in excess of Tokyo Peil (T.P. datum corresponds to mean sea level in Tokyo Bay) +3.29 m and T.P. +2.33 m at Osaka and Kobe’s tidal stations, respectively. Table 1 shows a comparison of the maximum water levels recorded during this and past events. As shown, the past’s maximum water levels were exceeded at many tidal stations, though it should be noted that the maximum tide recorded during the event was a 3 min averaged-value, while the previous ones represented values that were averaged over approximately 3 h. As the design storm surge level for coastal defenses in Osaka and Kobe is T.P. +3.90 m and T.P. +2.80 m, respectively [4], most of the observed flooding occurred outside of the coastal defenses (e.g., in several artificial islands in Hyogo Prefecture and Osaka Prefectures). In fact, during the event, TV news channels and the general public (using Social Network Services (SNS) such as twitter, facebook, or instagram), reported that several coastal locations along the cities of Osaka and Kobe, including artificial islands and Kansai international airport, were being flooded.
As the typhoon was predicted to cause severe damage, Japan Meteorological Agency (JMA) issued a storm surge warning to many coastal areas (approximately 6 h before the typhoon made landfall), including Hyogo, Osaka, and Wakayama Prefectures [1]. As a result, Kobe City and Ashiya City (in Hyogo Prefecture) issued a storm surge warning together with a windstorm and wave warning on the 4th of September at 06:23 JST, and then a heavy rain warning at 09:23 JST. A flood warning was also issued at 13:48 JST in Kobe City and at 15:03 JST in Ashiya City. All of the warnings were downgraded to an “advisory” at 17:52 JST and were finally cancelled at 04:10 JST on the 5 September 2018. The typhoon went on to cause 13 deaths and injure 741 people as of 14 September 2018 [5], though most of these were due to high winds. Essentially, strong winds tore down some weak wooden constructions, and more than 22,000 houses were reported to have been damaged to some extent during the event (either due to flooding or wind damage). In Kyoto Prefecture (where there are many historical buildings), several shrines were damaged due to high winds (e.g., Hirano shrine). According to a statement released by Hyogo Prefecture [6], 48 houses experienced flooding above the floor and 318 below the floor level, most of which were located in Ashiya City. Famously, the bridge linking Kansai international airport (situated in a reclaimed land offshore) to the mainland was damaged by a ship that was displaced by the strong wind and currents, resulting in approximately 3000 people needing to stay one night at this isolated island. Many of the ports in Osaka Bay also suffered minor economic damage, as some containers floated and drifted due to the storm surge. Kobe City reported that a total of 42 containers drifted away from their ports, and it took ten days to collect them all [7].
One of the defining moments in Japanese storm surge disaster management strategy was the 1959 Isewan Typhoon (Vera), which generated a 3.5 m storm surge in Ise Bay [8]. The storm easily overcame the poorly built dikes that surrounded the bay, leading to widespread inundation and the destruction of many buildings and infrastructure. Following this typhoon, the Japanese Government determined that coastal defenses around the country should be designed to resist any such event [8]. Thus, at present, the design tidal level for storm surge defenses is determined by one of the two following criteria [8]:
  • The sum of the mean spring high tide level and the maximum storm surge recorded at a tide station or simulated assuming this standard typhoon (simplified Isewan Typhoon) (for the cases of major bay areas with a large population, such as Tokyo, Ise and Osaka Bays)
  • The highest tidal level recorded at a tide station (for the case of the central region of the Seto Inland Sea).
Nevertheless, design tidal levels are still established in a deterministic way (as opposed to calculating the return probability of certain events) and there are still a number of problems to ascertain the return period of storm surges, including a lack of historical data [8].
As explained earlier, most of the damage due to Typhoon Jebi was observed on the seaward side of the coastal defenses in Osaka Bay. However, some residential areas located inside of the coastal defenses were also inundated during this event. Given the design criteria outlined above, it would appear surprising that a typhoon such as Jebi, with a return period of approximately 1 in 25 years (in terms of the wind speed at the time of the landfall), could go on to flood residential areas inside Osaka Bay. In the present work, the authors thus set out to survey the inundation heights in some of these residential areas and attempt to find out what lessons can be learnt in terms of disaster risk management. The originality of the paper lies mainly in this last point (and therefore the authors also attempted to find out more about residents’ perception of danger and evacuation behavior), rather than the survey of the storm height (in this sense, the authors’ own measurements were sent to the Joint Japan Coastal Engineering Committee 2018 Survey Group [9], which provides a full description of the inundation depths for Typhoon Jebi). Aside from this, the authors also mapped the location of some of the containers that were displaced by the storm surge and would like to make this information publicly available.

2. Methodology

A storm surge field survey was conducted two days after the typhoon made landfall (4 September 2018), concentrating on areas that were suspected of having suffered from a storm surge in Hyogo Prefecture, Japan. Specifically, the authors visited Higashi-Kawasaki town, Mikageishi town, and Fukaehama town in Kobe City, and Suzukaze town in Ashiya City (surrounded by white squares in Figure 2). The main purpose of the survey was to clarify whether any of the areas had been inundated by the storm surge, and if so, determine the height of the flood. Also, the authors attempted to understand the situation of the affected areas, including the extent of the damage to coastal structures and buildings, and the behavior of the population before and after the event.

2.1. Inundation Height Survey

The precise location of each survey point was first recorded by using GPS instruments (eTrex 20XJ, Garmin Ltd., Olathe, KS, USA), following established surveying techniques [10]. Then, the heights of the storm surge traces were surveyed by using a laser ranging instrument (IMPULSE 200LR (minimum reading: 0.01 m), Laser Technology Inc., Centennial, CO, USA), a prism and staffs. The authors also used a salinity meter (EN-901, DRETEC Co., Ltd., Saitama, Japan) to check whether the water found in pools was sea water or not. Finding these points was more difficult than during tsunami events, as precipitation during the typhoon rapidly washed out water marks and diluted sea water pools. Thus, eyes witnesses, when available, were interviewed to corroborate that the marks found were indeed correct. Whenever possible, the storm surge inundation height at each location was established by using the sea water level as a reference point. However, at some of the survey points it was difficult to reach the sea, such as in industrial areas where the water edge is occupied by private companies. In such cases, the authors calculated the inundation height by simply adding the height of the terrain, as obtained from 5 m resolution digital elevation models (DEM; The Geospatial Information Authority of Japan [11]), following the JSCE Joint survey team [9]. However, it should be noted that the accuracy of the DEM data is around ±30 cm, and thus some level of inaccuracy is expected in such measurements. The measured inundation heights were corrected to the tidal height at the time of the storm surge’s arrival. All the data used in this paper correspond to this corrected dataset.

2.2. Location of the Displaced Containers

The location of displaced containers along the waterfront of Suzukaze town of Ashiya city was recorded using a handheld GPS device. Photographic evidence of the position of each container was also taken.

2.3. Questionnaire Survey

A structured questionnaire survey was administered to individuals in the residential areas that were surveyed (i.e., Higashi-Kawasaki town and Suzukaze town; see Figure 2). Industrial areas were excluded from this questionnaire survey, as it was difficult to find respondents to answer the questionnaire, and it is unlikely that anybody would have actually been present at the time of the storm surge. Each questionnaire typically took about 5–10 min to complete, containing 18 questions about the perception of danger regarding the storm surge, evacuation, source of information (e.g., TV, radio), preparedness before the disaster, experience with previous disasters, and other personal information (e.g., age, gender).
The questionnaire survey was originally drafted in English, following that conducted in the Philippines in 2013 after typhoon Haiyan [12], and then translated into Japanese. Three Japanese native speakers served as enumerators. There was a total of 17 valid responses out of 21 administered questionnaires (valid rate: 81%), as some of them included multiple or incomplete answers. Given the limited number of people in the streets of the residential areas surveyed, the speed in which the survey was carried out (2 days after the event) and limitations of time, the authors consider that there is a scientific value to these results, despite the comparatively small sample size. Nevertheless, the limited number of respondents does not make it possible to conduct any detailed statistical analysis, and are only indicative as to how and why the larger population of the area may have acted. The main group of respondents were characterized by being relatively mature (over 40 years old), and as the survey was conducted during the daytime of a weekday, it showed also a large proportion of housewives (Figure 3).

3. Results

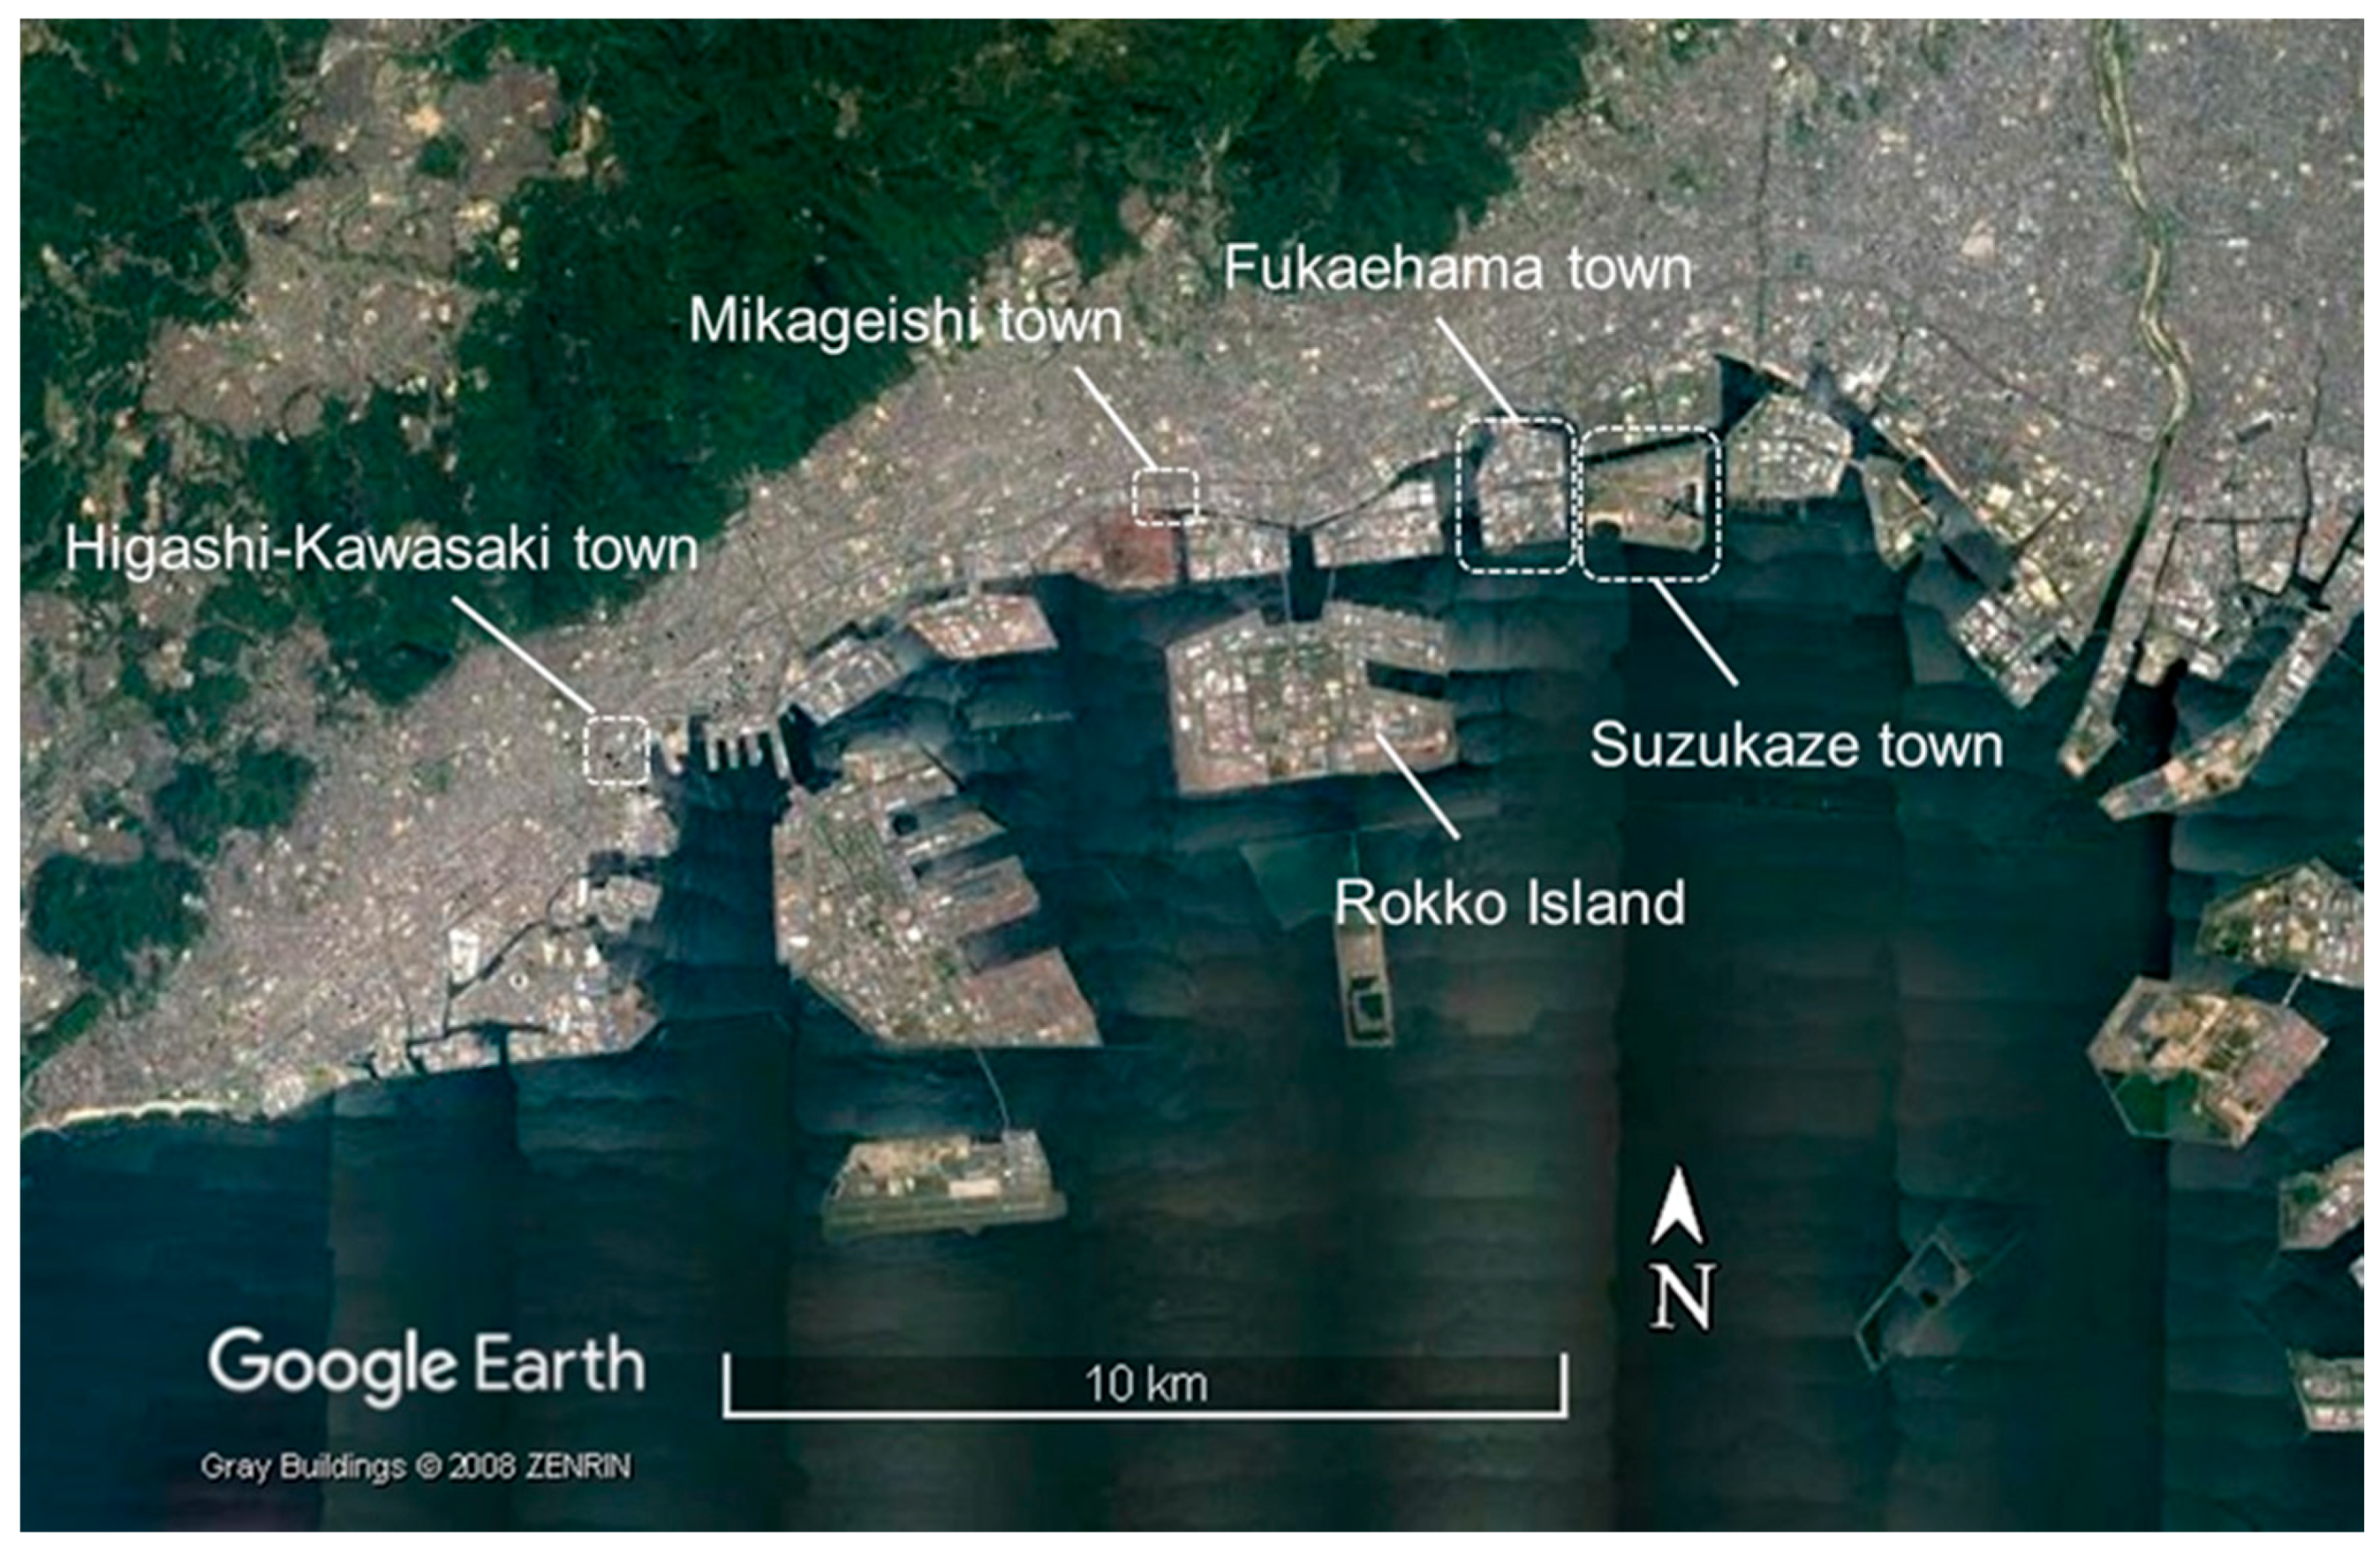
3.1. Inundation Heights

A summary of all the locations surveyed and the corresponding inundation height can be found in Table 2 and Figure 4. As will be discussed later, inundations at Points H2, H3, and M1 are likely to have been caused by water arriving from inland (such as through manholes, overflowing of small rivers or due to local topographical features including rain water). In contrast, inundation at Fukaehama and Suzukaze towns was likely caused by a storm surge (and thus by sea water). The maximum inundation height measured by the authors was +4.34 m at Point S3 (Suzukaze town).

3.1.1. Higashi-Kawasaki Town (Minato Elementary School)

Higashi-Kawasaki is in the Chuo ward of Kobe City, which is known as the commercial and entertainment district of the city and is located approximately 100 m away from the sea. The authors conducted their survey at the crossroad in front of Minato elementary school. The Kobe City flood gate, 26.7 m in length and 1.3 m in height (from the local ground level), is situated at this intersection to defend the residential areas on its west side. According to the report issued by Kobe City [13], all the gates in Kobe City were ordered to be closed at 08:30 JST on 4 September 2018, and a local witness indicated that this flood gate was indeed closed before the typhoon made landfall.
The inundation depth at the outside of the gate (Point H1) was measured to be 0.70 m. The authors measured this height based on a picture which was taken during the flooding and uploaded to the internet [14]. Two watermark traces were found inside the area that was supposedly protected by the gate (Points H2 and H3), with measured inundation depths of 0.38 m and 0.68 m, respectively (Figure 5a,b). As the local ground level at H1 (unprotected side) is 0.10 m lower than that at the gate, water surface level at H1 is 0.70 m lower than the top of the gate. This suggests that the gate was effective in protecting the residential area from the storm surge during the peak of the typhoon, and that a different water source caused the flooding in the protected side. The locals reported that water was seen coming from manholes and flooded the area behind the gate. However, the inundation depth difference between points H2 and H3 was measured to be 30 cm, over a distance of roughly 50 m (Figure 4b). These differences could be due to specific characteristics in local topography, where the land elevation behind the gate is somewhat lower than its surroundings (i.e., land elevation at H2 is higher than that at H3). This local feature, including pooling of rain water and eyewitness accounts on water intrusion through manholes, could potentially explain the inundation on the protected side of the gate. Nevertheless, no significant damage to the surrounding structures was observed during the survey, though some residential houses suffered flooding to the ground floor (and had to dry or dispose of furniture and other belongings located there).

3.1.2. Mikageishi Town

Mikageishi town at Higashinada ward, located at the easternmost side of Kobe City, is mostly composed of residential zones. The coastal defenses in the area is made up of a levee with a flood gate situated at the entrance of the port storage zone (Figure 6a). The gate was built in 1969 and has a length of 10 m and height of 1.4 m, and was closed at the time when the typhoon made landfall. No significant damage could be observed during the field survey, even in the port storage area situated outside of the gate. Nevertheless, one watermark (0.20 m from the ground) was found on the exterior wall of a residential structure (Figure 6b), approximately 200 m away from the flood gate. The authors interviewed a local resident regarding the flooding in this residential area, who reported that the water came from a nearby overflowing river (approximately 30 m away) and receded relatively quickly. Water in a pool near the water mark was found to have only 0.2% salinity. Considering these facts, the authors concluded that there was a high probability that the area suffered from fluvial flooding rather than a direct storm surge attack.

3.1.3. Fukaehama Town

Fukaehama town is also located at Higashinada ward, east of Mikageishi town, with the reclaimed land next to the coast being mainly dedicated to industrial use. The area is protected by an approximately T.P. +5.4 m high dike [15] (Figure 7a).
Three measurements were taken in this area: (1) the fence of an oil factory plant (F1); (2) the gate of a high school (F2); and (3) a model house in front of a department store (F3). The presence of debris at the fence of the oil factory plant, which were measured to be at a height of 1.27 m above the road, showed that the direction of water was towards inland (i.e., south to north; Figure 7b). Other debris, such as uprooted trees and road signs that drifted with the water flow, were observed around the area during the survey (Figure 7c,d), though they could also have been scattered due to the high wind. Significant inundation heights were also measured at a high school (Figure 7e) and a model house (Figure 7f), as shown in Table 2. Although it is still not clear whether the dike was overtopped by the storm surge or wind-driven waves, the observations indicate that the current level of coastal defenses could not completely protect this district from inundation.

3.1.4. Suzukaze Town

The survey team also went to Ashiya City, located east of Kobe City. The residential area at Suzukaze town, which stands on a reclaimed island constructed in 1997, suffered significant coastal flooding during the passage of the typhoon.
Although the area is protected by a high embankment with a crest level situated at approximately T.P. +5.6 m [15], relatively significant inundation took place. Shipping containers also drifted to the water front of this area, though none of them were found on the landward side of the embankment (i.e., residential area). A newspaper article [16] reported that a local resident had heard the sound of containers as they collided with the embankment. The pedestrian steel railings at the water edge of the embankment was bent towards the land side, probably due to the collision with the drifting containers (Figure 8a).
The five survey points (S1–5) are shown in Figure 8b–f. The maximum measured inundation depth was 0.64 m around the ground close to the sea (at Point S1), ranged from 0.33 m to 0.42 m at other points (S2 to S4) in the middle section of this community, and dropped to 0.18 m at the last survey point (S5). After correcting for tide levels, this represented levels of T.P. +3.78 m to +4.84 m. The pedestrian road near the top of embankment was severely eroded (See Figure 8g), and much sand was transported into the residential area (in fact, the authors observed that the transported sand was being cleaned while they conducted the survey). The locals whom the authors interviewed reported that a power outage took place after the water invaded the residential area.
Overall, the results indicate that the embankment height was not sufficiently high to protect the area against the flooding brought about by Typhoon Jebi. It is interesting to note that the sea water overtopped the road embankment (which had an elevation of T.P. +5.6 m), despite the fact that the maximum water level recorded at Osaka and Kobe tidal station were T.P. +3.29 m and +2.33 m, respectively. Based on field observations and the reports of local witnesses, this overtopping could have been caused by a combination of a storm surge and associated high waves. Local witnesses reported very strong winds in Suzukaze town before the seawater overtopped the embankment. Thus, the storm surge height around this point should have been relatively high. However, as the measured inundation depths are not so large, the authors think that the storm surge height (tidal level) might not have exceeded the height of the embankment. Therefore, seawater intrusion to the landside area could have occurred due to a combination of an already high tidal level and wind waves, resulting in waves running up the slope of embankment and therefore overtopping it. However, in order to clarify this mechanism, it will be necessary to conduct a detailed numerical simulation of the storm surge, and to also consider the effect of wind waves.

3.2. Location of Containers

Table 3 and Figure 9 and Figure 10 provide the location of the containers found at the waterfront of Suzukaze town, Ashiya City, with the type and size of each container (following the ISO standards, when available). As No. 11 and 13 are containers used for domestic transportation, ISO types are not assigned to them, but the size could be obtained by referring to the Japanese standards. Six containers had been washed away in front of the embankment, and 8 on the beach. According to a report issued by Ashiya City [17], a total of 18 containers drifted to Ashiya City, and all of them were removed on the 8th of September, two days after the survey. All of the containers that arrived at the front of the embankment were large (40 feet high, ~12.2 m), while those found on the beach were of a smaller type (20 feet, ~6.1 m), though the reason for this segregation is not known by the authors. The doors of containers No. 7 and No. 13 were open, and were confirmed by the authors to be empty. The authors asked Ashiya City where they thought the containers came from. However, as of September 14th, this was still not clear, though it is highly likely that they originated from the southeast container berth at Rokko Island, in Kobe City (See Figure 2).

3.3. Questionnaire Surveys

3.3.1. Perception of Danger and Experience with Previous Disasters

The first question of the survey asked respondents if they thought that the storm surge constituted a real danger for them. Figure 11 and subsequent figures show the disaggregated values for Higashi-Kawasaki town (n = 5) and Suzukaze town (n = 12). For the case of Higashi-Kawasaki town, 3 out of 5 respondents indicated that the storm surge constituted a real danger for them. People who thought that the storm surge was a real danger for them also answered that they had experienced damage during a previous storm surge (Figure 12) and that their place had been flooded during that event. In contrast, almost 60% of people in Suzukaze town thought that the storm surge did not represent a real danger for them. This relatively low awareness could be explained by the fact that 90% have never experienced flooding before (Figure 12). In addition, a storm surge hazard map provided by Hyogo Prefecture did not show that this area could be flooded [18]. Thus, it might have been difficult for people in this area to understand that they were in real danger.

3.3.2. Preparedness before the Disaster and Source of Information about the Disaster

Regarding sources of information on the disaster, a relatively high percentage of people relied on TV or radio (Figure 13), which is similar to the tendencies observed in storm surges in other countries (e.g., Philippines for the case of Typhoon Haiyan [12]). This confirms that mass media is the most effective way to disseminate information [19]. However, as shown in Figure 14, 35% of respondents answered that this information was not very useful, which is opposite to what coastal residents reported in areas affected by Typhoon Haiyan in the Philippines [12]. This is probably due to the fact that no one had predicted that Suzukaze town could be flooded. Thirty-five percent of the respondents in Suzukaze town answered that they received information from the area’s loud speaker system. Ashiya City issued an evacuation order to local residents of Suzukaze town at 14:50 JST [20]. However, according to the locals, by the time this alert was issued, the area had already started to be flooded, and there was a power outage soon after the flooding started, meaning that they could not get any further information from TV. In addition, residents reported that they could not hear the evacuation order due to the strong sound of rain and wind. As a result, 58% of respondents in Suzukaze town answered that they did not get any information from local authorities.

3.3.3. Evacuation

Regarding evacuation preparedness prior to the event, 82% answered that they have never joined an evacuation drill. Even a respondent who answered that they had joined an evacuation drill indicated that this was not to prepare them against a storm surge or tsunami, but just for checking the location of the disaster prevention warehouse. Ninety-four percent answered that they did not evacuate during the event (Figure 15). Regarding this question, it should be noted that respondents were being asked if they evacuated to somewhere that was outside of the inundation area, and thus vertical evacuation was categorized as ”no evacuation”. There are a variety of reasons cited for not evacuating (Figure 16). For example, 15% of those who did not evacuate answered that they did not know how to evacuate, or that the ground elevation of their area should be high enough (13%). 45% of the respondents in Higashi-Kawasaki town underestimated the size of the storm surge. Other reasons given were related to difficulty in getting to the evacuation area, or not receiving an evacuation order. Approximately half the respondents answered that they would evacuate if they faced a similar situation in the future, while others answered that they would not, or did not give a clear answer.

4. Lessons for Japanese Disaster Risk Management

The field surveys allowed some important lessons to be learnt from the event, which should inform future disaster risk management in Japan. Although information about the overall damage and inundation heights along Osaka Bay are provided by Mori et al. [9], it is still important to compare the inundation that took place in the various areas with those predicted by local authorities through hazard maps. A Committee for Measures against Storm Surge in Osaka Bay [21] simulated three scenarios for storm surge (Scenarios 1, 2 and 3), and provided the expected inundation maps for each of these scenarios. In Scenario 1, they assumed that a typhoon with a central pressure of 930 hPa at the time of the landfall (which would be as strong as the Isewan Typhoon (1959), and stronger than Typhoon Jebi by 20 hPa), would move along the same route as the Muroto Typhoon (1934) (See Figure 1). In this scenario, they also assumed that their coastal defenses (e.g., water gate, seawall) would be damaged due to the collision force by drifted ships and not work properly during such an event (e.g., water gate cannot be closed). In Scenarios 2 and 3, they assumed a stronger typhoon, having a central pressure of 910 hPa at the time of landfall, and shifted the course of the typhoon west by 40 km from that in Scenario 1. The coastal defenses were assumed to work properly in Scenario 2 (no damage due to a collision by drifted ships), whereas they were assumed not to in Scenario 3. Higashi-Kawasaki town, Mikageishi town and Fukaehama town were predicted to be flooded by all scenarios. However, the maps do not indicate that Suzukaze town was at risk of being flooded in Scenario 1, even though the typhoon modelled was stronger than Typhoon Jebi in terms of central pressure at the time of the landfall. A storm surge and a tsunami hazard map for Suzukaze town are also provided by Hyogo Prefecture [18]. The storm surge hazard map was based on a simulation of typhoon Nancy (1961), shifting the course of the historical typhoon to the west by 10°. It should be noted that the map clearly states that it does not include the possibility of river flooding and wave overtopping. The tsunami hazard map was based on a tsunami simulation of the Nankai trough earthquake [22]. Neither the storm surge nor the tsunami hazard maps indicated there was a risk of flooding for Suzukaze town (for the other three areas analyzed in the present study, this risk was predicted to some extent). Thus, it was clearly more difficult for residents at Suzukaze town to realize that they were actually at risk of being flooded. Indeed, the questionnaire survey revealed that most of the residents at Suzukaze town did not think that a storm surge could overcome the defenses in their area, and did not evacuate to higher ground. In that regard, it would be rational to reconsider re-evaluating risk potentials in not only Suzukaze town, but perhaps also in other areas that have been previously considered to have minimum risks. The possible wave overtopping at Suzukaze has introduced a degree of uncertainty in currently available storm surge hazard maps around Osaka Bay. Reassessing the vulnerability and risk management at the local and regional scale would undoubtedly help in addressing the concerns and uncertainty left by Typhoon Jebi.
Generally, a storm surge hazard map is created by simulating several typhoon scenarios [23]. In such simulations, the pressure distribution of the typhoon and its moving speed are typically modelled in a relatively simplistic way (e.g., using Myers equation [24] to reproduce the pressure distribution). However, the actual storm surge height at a given location is sensitive to local geographic and bathymetric conditions, and the exact wind conditions at an area during the passage of a typhoon. Thus, the actual storm surge height at a given point of interest could be higher than that simulated one. In addition, when elaborating a storm surge hazard map, the effects of overtopping waves are seldom included. As shown by previous storm surge events [25,26,27], the extent of the damage to human being depends on the level of people’s awareness and preparedness. Considering this, it is important to make coastal residents aware that inundation could occur even if they are outside of the predicted storm surge inundation area. Especially, a newer community created on reclaimed land along the coast, such as Suzukaze town, has less experience with coastal hazards, as there is no collective memory of previous disaster events (see Esteban et al. [28]). Thus, it is imperative for disaster risk managers and local authorities to make them aware of risks related to natural hazards, and evacuate to areas of higher elevation whenever a strong typhoon approaches.
Another important lesson from this event is the necessity of considering the effects of drifting objects. During the event, many containers were displaced from ports, with the authors recording the location of 14 at the waterfront of Suzukaze town. This problem has actually been observed in other past events [29,30,31,32]. For example, during the 2011 Tohoku Earthquake and Tsunami, many containers were moved by the strong tsunami flows [30]. Such problems were also recorded for the case of Hurricane Katrina’s storm surge in 2005 [32]. For the case of Suzukaze town, the maximum inundation depth was found to be 64 cm, which was not high enough to destroy the houses in the area [33]. However, if containers had managed to overcome the embankment in front of the area, the forces exerted on the houses could have damaged many of them.
Many researchers have conducted hydraulic physical model tests and confirmed that the magnitude of a tsunami force would be significantly increased due to the presence of debris (in this sense, a weak tsunami force and a storm surge can be somewhat similar [34,35,36]). In addition, it takes considerable effort to collect all the drifted containers (in fact, Kobe city spent 10 day to collect all of them). Thus, it is necessary to give some further consideration on how to predict the location of drifted containers during a severe coastal flooding event. Some numerical simulation models to predict the movement of debris under tsunami flows have been proposed [37,38,39]. Although most of these types of models were validated by comparison with hydraulic physical model tests, a prolonged period of water surface elevation such as tsunami or a storm surge are difficult to accurately reproduce at the experimental scale. The movement of large vessels under strong tsunami flows were recorded during the 2011 Tohoku Earthquake and Tsunami, using Automatic Identification System (AIS) [40]. Naito et al. [30] investigated the positions of drifted containers by using satellite images taken at several areas affected by the 2011 event. However, to the authors’ knowledge, detailed information about the location of the actual containers displaced has never been provided. In that sense, the information provided in the present work should be useful to validate future simulation models of container displacement.

5. Conclusions

In the present work, the authors surveyed the coastal flooding that took place as a result of Typhoon Jebi in Japan in 2018. It became clear that some coastal residential areas had been flooded due to a storm surge, despite the dyke protecting them being substantially higher than the predicted and measured storm surge levels at nearby tidal stations. For example, inundation depths ranging from 0.18 m to 0.64 m were measured at Suzukaze town. This indicates that some interesting geographical, bathymetric of wind factors played a part in increasing the height of the water levels at Suzukaze town, which was considered to be a minimum risk area. This storm was described as the worst in 25 years, and it would thus appear surprising that flooding would take place as a result of it. The current hypothesis regarding the reasons for the sea water flooding at Suzukaze town is that it was caused by wave overtopping. Such failures of the coastal defenses, albeit localized, highlight the need for further research into the detailed behavior of storm surges along the complex Japanese coastline and the need to reassess what are currently considered minimum risk areas, in order to reduce a degree of uncertainty left after the passage of Typhoon Jebi.
The authors also interviewed the residents of the areas flooded, and carried out a questionnaire survey of local residents, though the number of respondents was limited to 17. Through this it became clear that residents of newly reclaimed areas had a poor level of awareness about the potential dangers of a storm surge (e.g., none of the 12 respondents in Suzukaze town evacuated during the event), partially because they had not experienced any such events during their lifetimes. The failure of local authorities to issue evacuation orders well in advance of the event, and the lack of evacuation to higher grounds (local residents mostly chose to evacuate vertically, though their houses were comparatively weak constructions, only 2 or 3 floors high) are potentially hazardous types of behavior. Thus, it would appear imperative that local authorities should emphasize the need for proper evacuation (either to higher grounds or strong tall concrete buildings) when strong typhoons approach.
The present research highlights how, although relatively well prepared, there is still much that Japanese local authorities need to learn with regards to coastal risk management. Given that the strength of typhoons could increase in the future as a consequence of climate change, it is necessary that measures are put in place to increase the resilience of coastal communities.

Author Contributions

All authors joined the field survey. T.S., M.E., R.N., M.M., T.O.K. and J.J.V. conducted a survey to investigate inundation heights in the study areas. T.T. and Y.N. recorded the location of displaced containers in Suzukaze town. T.T., H.I. and F.N. carried out a questionnaire survey of local residents. T.T., M.M. and M.E. contributed to the writing of the manuscript, analysis, and visualization. R.N., T.O.K., H.I., J.J.V., Y.N. and F.N. contributed to the editing of manuscript and analysis. T.S. supervised the team and reviewed the manuscript.

Funding

This research was partly funded by Penta-Ocean Construction Co., Ltd. and by New CC Construction Consultants Co., Ltd.

Acknowledgments

The present work was performed as a part of activities of Research Institute of Sustainable Future Society, Waseda Research Institute for Science and Engineering, Waseda University.

Conflicts of Interest

The authors declare no conflict of interest.

References

  1. Japan Meteorological Agency. Wind Storm and Storm Surges by Typhoon No. 21. 2018. Available online: https://www.data.jma.go.jp/obd/stats/data/bosai/report/2018/20180911/20180911.html (accessed on 14 September 2018). (In Japanese)
  2. Japan Meteorological Agency (JMA). RSMC Best Track Data (Text). 2018. Available online: http://www.jma.go.jp/jma/jma-eng/jma-center/rsmc-hp-pub-eg/besttrack.html (accessed on 13 September 2018).
  3. Knapp, K.R.; Kruk, M.C.; Levinson, D.H.; Diamond, H.J.; Neumann, C.J.; Knapp, K.R.; Kruk, M.C.; Levinson, D.H.; Diamond, H.J.; Neumann, C.J. The International Best Track Archive for Climate Stewardship (IBTrACS). Bull. Am. Meteorol. Soc. 2010, 91, 363–376. [Google Scholar] [CrossRef] [Green Version]
  4. Osaka & Hyogo Prefectural Government. Coastal Protection Basic Plan of Osaka Bay Coast. 2018. Available online: https://web.pref.hyogo.lg.jp/ks17/documents/honpenh30.pdf (accessed on 26 September 2018). (In Japanese).
  5. Fire and Disaster Management Agency. Damages by Typhoon No. 21 in 2018 and the Response of Fire and Disaster Management Agency (7th Report). 2018. Available online: http://www.fdma.go.jp/bn/5088fc7540585e7232370c8db10e55e8b1c909ae.pdf (accessed on 14 September 2018). (In Japanese)
  6. Hyogo Prefectural Government. Damages by Typhoon No. 21 (7th Report). 2018. Available online: https://web.pref.hyogo.lg.jp/kk03/documents/180919_7.pdf (accessed on 26 September 2018). (In Japanese)
  7. Kobe City. Completion of Collecting Containers Drifted from Kobe Port. 2018. Available online: http://www.city.kobe.lg.jp/information/press/2018/09/20180914173202.html (accessed on 23 October 2018). (In Japanese).
  8. Kawai, H.; Hashimoto, N.; Matsuura, K. Improvement of Stochastic Typhoon Model for the Purpose of Simulating Typhoons and Storm Surges under Global Warming. In Proceedings of the 30th International Conference on Coastal Engineering (ICCE 2006), San Diego, CA, USA, 3–8 September 2006; Volume 2, pp. 1838–1850. [Google Scholar]
  9. Mori, N.; Yasuda, M.; Joint Japan Coastal Engineering Committee 2018 Survey Group. Typhoon Jebi Post-Event and Coastal Damage Survey in Kinki Area, Japan. Available online: http://www.coastal.jp/ja/index.php?2018%E5%B9%B4%E5%8F%B0%E9%A2%A818%E5%8F%B7Jebi%E3%81%AB%E3%82%88%E3%82%8B%E6%B2%BF%E5%B2%B8%E7%81%BD%E5%AE%B3 (accessed on 3 November 2018). (In Japanese).
  10. Esteban, M.; Takagi, H.; Mikami, T.; Bahbouh, L.; Becker, A.; Nurse, L.; Shibayama, T.; Nagdee, M. How to Carry Out Bathymetric and Elevation Surveys on a Tight Budget: Basic Surveying Techniques for Sustainability Scientists. Int. J. Sustain. Futur. Hum. Secur. J-SustaiN 2017, 5, 86–91. [Google Scholar] [CrossRef]
  11. Geospatial Information Authority of Japan. Download Service of Basic Map Information. 2016. Available online: https://fgd.gsi.go.jp/download/menu.php (accessed on 16 September 2018). (In Japanese)
  12. Esteban, M.; Valenzuela, V.P.; Matsumaru, R.; Mikami, T.; Shibayama, T.; Takagi, H.; Thao, N.D.; Leon, M.D. Storm Surge Awareness in the Philippines Prior to Typhoon Haiyan: A Comparative Analysis with Tsunami Awareness in Recent Times. Coast. Eng. J 2016, 58, 1640009-1–1640009-28. [Google Scholar] [CrossRef]
  13. Kobe City. Response to Typhoon No. 21 (1st Report). 2018. Available online: http://www.city.kobe.lg.jp/safety/emergency/natural_disaster/img/20180904_press01.pdf (accessed on 1 October 2018). (In Japanese).
  14. Naya, K. Typhoon No. 21 Made Landfall Again: Large-Scale Flooding in the City Area. Kobe Shinbun Next. 2018. Available online: https://www.kobe-np.co.jp/news/sougou/201809/0011607457.shtml (accessed on 3 November 2018). (In Japanese).
  15. Central Public Disaster Prevention Council of Japan. Data Used for Modeling the Huge Nankai Trough Earthquake. 2016. Available online: http://www.bousai.go.jp/jishin/nankai/model/data_teikyou.html (accessed on 14 September 2018).
  16. Nishimi, S.; It Was Like a Tsunami. A Storm Surge Coming to Ashiya. Asahi Shinbun Digital. 2018. Available online: https://www.asahi.com/articles/ASL954357L95PIHB013.html (accessed on 1 October 2018). (In Japanese).
  17. Ashiya City. Response to Typhoon No. 21 (18th Report). 2018. Available online: http://www.city.ashiya.lg.jp/bousai/taifu21/documents/press0913.pdf (accessed on 14 September 2018). (In Japanese).
  18. Hyogo Prefectural Government. 3D Hazard Map for Hyogo Prefecture. 2018. Available online: http://www.hazardmap.pref.hyogo.jp/ (accessed on 26 September 2018). (In Japanese)
  19. Lindell, M.K.; Lu, J.C.; Prater, C.S. Household Decision Making and Evacuation in Response to Hurricane Lili. Nat. Hazards Rev. 2005, 6, 171–179. [Google Scholar] [CrossRef]
  20. Ashiya City. Response to Typhoon No. 21 (1st Report). 2018. Available online: http://www.city.ashiya.lg.jp/bousai/taifu21/documents/taiou.pdf (accessed on 1 October 2018). (In Japanese).
  21. Committee for Measures against Storm Surge in Osaka Bay. A Guideline for Management Action Plan on Storm Surge Crisis in Osaka Bay. 2010. Available online: https://www.kkr.mlit.go.jp/bousai/link/takashio/qgl8vl000000decx-att/takashio-guideline.pdf (accessed on 1 October 2018). (In Japanese)
  22. Central Public Disaster Prevention Council of Japan. Working Group Report on Mega-Thrust Earthquake Models for the Nankai Trough, Japan. 2012. Available online: http://www.bousai.go.jp/jishin/nankai/nankaitrough_info.html (accessed on 1 October 2018).
  23. Ministry of Agriculture, Forestry and Fisheries (MAFF); Ministry of Land, Infrastructure and Transport (MLIT). Guide to Making the Potential Storm Surge Inundation Map (Version 1.00). 2015. Available online: http://www.mlit.go.jp/river/shinngikai_blog/saidai_takashio/pdf/takashio_tebiki_151102.pdf (accessed on 1 October 2018). (In Japanese)
  24. Myers, V.A.; Malkin, W. Some Properties of Hurricane Wind Fields as Deduced from Trajectories; National Hurricane Research Project Report No.49; U.S. Department of Commerce: Washington, DC, USA, 1961.
  25. Esteban, M.; Valenzuela, V.P.; Yun, N.Y.; Mikami, T.; Shibayama, T.; Matsumaru, R.; Takagi, H.; Thao, N.D.; Leon, M.D.; Oyama, T.; et al. Typhoon Haiyan 2013 Evacuation Preparations and Awareness. Int. J. Sustain. Future Hum. Secur. 2015, 3, 37–45. [Google Scholar] [CrossRef]
  26. Tasnim, K.M.; Shibayama, T.; Esteban, M.; Takagi, H.; Ohira, K.; Nakamura, R. Field observation and numerical simulation of past and future storm surges in the Bay of Bengal: case study of cyclone Nargis. Nat. Hazards 2014, 75, 1619–1647. [Google Scholar] [CrossRef]
  27. Takagi, H.; Esteban, M.; Shibayama, T.; Mikami, T.; Matsumaru, R.; De Leon, M.; Thao, N.D.; Oyama, T.; Nakamura, R. Track analysis, simulation, and field survey of the 2013 Typhoon Haiyan storm surge. J. Flood Risk Manag. 2014, 10, 42–52. [Google Scholar] [CrossRef]
  28. Esteban, M.; Tsimopoulou, V.; Mikami, T.; Yun, N.Y.; Suppasri, A.; Shibayama, T. Recent tsunamis events and preparedness: Development of tsunami awareness in Indonesia, Chile and Japan. Int. J. Disaster Risk Reduct. 2013, 5, 84–97. [Google Scholar] [CrossRef]
  29. Takahashi, S.; Sugano, T.; Tomita, T.; Arikawa, T.; Tatsumi, D.; Nakamura, T. Joint Survey for 2010 Chilean Earthquake and Tsunami Disaster in Ports and Coasts. Port Airpt. Res. Inst. 2010, 1224, 1–48. [Google Scholar]
  30. Naito, C.; Cercone, C.; Riggs, H.R.; Cox, D. Procedure for Site Assessment of the Potential for Tsunami Debris Impact. J. Waterw. Port Coast. Ocean Eng. 2014, 140, 223–232. [Google Scholar] [CrossRef]
  31. Naito, C.; Cox, D.; Yu, Q.S.K.; Brooker, H. Fuel Storage Container Performance during the 2011 Tohoku, Japan, Tsunami. J. Perform. Constr. Facil. 2013, 27, 373–380. [Google Scholar] [CrossRef]
  32. Robertson, I.N.; Riggs, H.R.; Yim, S.C.; Young, Y.L. Lessons from Hurricane Katrina Storm Surge on Bridges and Buildings. J. Waterw. Port Coast. Ocean Eng. 2007, 133, 463–483. [Google Scholar] [CrossRef]
  33. Suppasri, A.; Mas, E.; Koshimura, S.; Imai, K.; Harada, K.; Imamura, F. Developing Tsunami Fragility Curves from the Surveyed Data of the 2011 Great East Japan Tsunami in Sendai and Ishinomaki Plains. Coast. Eng. J. 2012, 54, 1250008-1–1250008-16. [Google Scholar] [CrossRef]
  34. Stolle, J.; Takabatake, T.; Nistor, I.; Mikami, T.; Nishizaki, S.; Hamano, G.; Ishii, H.; Shibayama, T.; Goseberg, N.; Petriu, E. Experimental investigation of debris damming loads under transient supercritical flow conditions. Coast. Eng. 2018, 139, 16–31. [Google Scholar] [CrossRef]
  35. Shafiei, S.; Melville, B.W.; Shamseldin, A.Y.; Beskhyroun, S.; Adams, K.N. Measurements of tsunami-borne debris impact on structures using an embedded accelerometer. J. Hydraul. Res. 2016, 54, 435–449. [Google Scholar] [CrossRef]
  36. Ikeno, M.; Takabatake, D.; Kihara, N.; Kaida, H.; Miyagawa, Y.; Shibayama, A. Improvement of Collision Force Formula for Woody Debris by Airborne and Hydraulic Experiments. Coast. Eng. J. 2016, 58, 1640022-1–1640022-23. [Google Scholar] [CrossRef]
  37. Gotho, H.; Ikari, H.; Shibata, T.; Ogura, K.; Tonomo, K.; Shikata, T. Numerical Simulation on Drifting and Submerging Containers driven by Tsunami. Jpn. Soc. Civ. Eng. Ser. B2 Coast. Eng. 2010, 66, 806–810. [Google Scholar] [CrossRef] [Green Version]
  38. Fujii, N.; Otani, M.; Ikeya, T.; Asakura, R.; Takeda, T.; Yanagisawa, K. Numerical Analysis of Tsunami Debris in Port. Proc. Coast. Eng. Jpn. Soc. Civ. Eng. 2005, 52, 296–300. [Google Scholar] [CrossRef]
  39. Tomita, T.; Chida, T. Development of Numerical Simulation Method and Fire Incidence Induced by Tsunamis. Jpn. Soc. Civ. Eng. Ser. B2 Coast. Eng. 2016, 72, 421–426. [Google Scholar] [CrossRef]
  40. Matsuda, N.; Tomita, T.; Yeom, G.S.; Takagawa, T. Numerical Simulation on Tsunami-Transported Large Vessel with AIS Data. Jpn. Soc. Civ. Eng. Ser. B2 Coast. Eng. 2012, 68, 256–260. [Google Scholar] [CrossRef]
Figure 1. Most notable storm tracks to affect Osaka Bay area. Best track data for Jebi and Nancy are from Japan Meteorological Agency (JMA) [1,2], while Jane and Muroto’s are from NOAA’s IBTrACs database [3]. Note that there is no pressure information for Muroto’s track data.
Geosciences 08 00412 g001
Figure 2. Map of survey locations. White boxes indicate areas visited. Rokko Island indicates the suspected initial location of the drifted containers.
Geosciences 08 00412 g002
Figure 3. Distribution of respondents; (a) Gender distribution of respondents (n = 17); (b) Age distribution of respondents (n = 17); (c) Occupation of respondents (n = 17).
Geosciences 08 00412 g003
Figure 4. Survey locations; (a) Survey locations and measured inundation height (orange) and inundation depth (blue) along Osaka Bay, showing also the path of Typhoon Jebi (red line); (b) details of inundation height and inundation depth at Higashi-Kawasaki town; and (c) Suzukaze town. The measurement heights are exaggerated 2000:1 in (a) and 50:1 in (b,c).
Geosciences 08 00412 g004
Figure 5. Photographs taken by the authors at Higashi-Kawasaki town. (a) Survey Point H2 (watermark on a window); (b) Survey Point H3 (watermark is indicated by a yellow allow).
Geosciences 08 00412 g005
Figure 6. Photographs taken by the authors at Mikageishi town. (a) Coastal levee and gate at the entrance of the port storage zone; (b) Survey Point M1 (watermark is indicated by a yellow allow).
Geosciences 08 00412 g006
Figure 7. Photographs taken by the authors at Fukaehama town. (a) Coastal dike at Fukaehama town, (b) Survey Point F1 indicates that the direction of debris was towards the inland, (cd) Presence of debris at Fukaehama town, (e) Survey Point F2 (watermark at school gate), (f) Survey Point F3 (watermark at a model house).
Geosciences 08 00412 g007
Figure 8. Photographs taken by the authors at Suzukaze town. (a) Damaged steel barrier and drifted shipment container at the embankment; (bf) Survey Points S1–S5, respectively (watermark is highlighted with a yellow dashed line); (g) Eroded pedestrian road near the coastal embankment.
Geosciences 08 00412 g008
Figure 9. Bird’s eye view of the reclaimed land of Ashiya City and the location of the containers, whose coordinate are shown in Table 3.
Geosciences 08 00412 g009
Figure 10. Photographs of the displaced containers. The numbers correspond to the identification numbers of each container shown in Table 3.
Geosciences 08 00412 g010
Figure 11. Distribution of the opinion of respondents regarding whether they thought a storm surge was a real danger for them (n = 5 for Higashi-Kawasaki town, n = 12 for Suzukaze town).
Geosciences 08 00412 g011
Figure 12. Proportion of respondents who have experienced some sort of damage from a previous storm surge (n = 5 for Higashi-Kawasaki town, n = 12 for Suzukaze town).
Geosciences 08 00412 g012
Figure 13. Source of information on storm surge and typhoon (n = 5 for Higashi-Kawasaki town, n = 12 for Suzukaze town, multiple-choice allowed).
Geosciences 08 00412 g013
Figure 14. Distribution of respondent regarding whether the information they obtained on the storm surge was useful (n = 5 for Higashi-Kawasaki town, n = 12 for Suzukaze town).
Geosciences 08 00412 g014
Figure 15. Proportion of respondents who evacuated during the event (n = 5 for Higashi-Kawasaki town, n = 12 for Suzukaze town).
Geosciences 08 00412 g015
Figure 16. Reasons cited by respondents for not evacuating (note that multiple answers were allowed in this question, n = 4 for Higashi-Kawasaki town, n = 12 for Suzukaze town).
Geosciences 08 00412 g016
Table 1. Comparison of the maximum tidal levels recorded during Typhoon Jebi and past events 1. The previous maximum water level was obtained from JMA [1].
Tidal StationsMaximum Water Level during Typhoon Jebi (T.P. 2)Time of Maximum Water Level during Typhoon Jebi (JST, 4 September 2018)Previous Maximum Water Level (T.P. 2)Typhoons which Generated Previous Maximum Water Level (Year)
Osaka3.29 m14:182.93 mNancy (1961)
Kobe2.33 m14:092.30 mNancy (1961)
Gobo3.16 m12:481.63 mHalong (2014)
Shirahama 31.64 m13:021.52 mTalas (2011)
Kushimoto 31.73 m13:201.61 mPhanfone (2014)
Awayuki2.03 m12:081.67 mHalong (2014)
1 Maximum water levels recorded during Typhoon Jebi were 3 min averaged-values, while the previous ones represented values that were averaged over approximately 3 h. 2 Tokyo Peil (T.P.) datum corresponds to mean sea level in Tokyo Bay. 3 Maximum water levels at Shirahama and Kushimoto were updated again during the passage of Typhoon Trami (2018), which passed through Japan on 30 September 2018.
Table 2. Survey measurement results. Inundation height is defined as the height above the local tide level during the event, while inundation depth is defined as height from the local ground level. The reliability of the measurements is classified into A, B, C, and D. A: clear mark and small possible survey error; B: unclear mark and small possible survey error; C: unclear mark and large possible survey error; and D: unclear mark, low confidence, and large possible survey error.
No.LocationLongitudeLatitudeInundation Height (m)
(Height above T.P. (m))
Inundation Depth (m)ReliabilityTarget
H1Higashi-Kawasaki town135°10′52.5″34°40′34.3″1.71 1
(T.P. +2.21)
0.70Bflood from image
H2Higashi-Kawasaki town135°10′52.3″34°40′34.2″1.39 1
(T.P. +1.89)
0.38Bwater mark
H3Higashi-Kawasaki town135°10′52.4″34°40′32.6″2.29 1
(T.P. +2.79)
0.68Bwater mark
M1Mikageishi town135°15′10.1″34°42′34.9″1.93 1
(T.P. +2.43)
0.20Bwater mark
F1Fukaehama town135°18′4.7″34°42′21.8″2.10 1
(T.P. +2.60)
1.27BDebris
F2Fukaehama town135°17′59.9″34°42′34.6″2.92 1
(T.P. +3.42)
0.79Bwater mark
F3Fukaehama town135°17′53.5″34°42′45.9″1.80 1
(T.P. +2.30)
0.95Bwater mark
S1Suzukaze town135°18′54.5″34°42′22.0″4.31
(T.P. +4.81)
0.64Awater mark
S2Suzukaze town135°18′54.3″34°42′23.7″4.25
(T.P. +4.75)
0.35ADebris
S3Suzukaze town135°18′55.6″34°42′25.3″4.34
(T.P. +4.84)
0.42Awater mark
S4Suzukaze town135°18′55.4″34°42′27.9″4.03
(T.P. +4.53)
0.33Awater mark
S5Suzukaze town135°18′55.1″34°42′28.7″3.28
(T.P. +3.78)
0.18Awater mark
1 The inundation heights at locations H1–3, M1, and F1–3 are calculated using the DEM data provided by the Geospatial Information Authority of Japan, Ministry of Land, Infrastructure, Transport and Tourism. However, it should be noted that the altitude accuracy of the DEM data is ±30 cm.
Table 3. Location of the drifted containers.
No.LongitudeLatitudeTypeSize (Length/Width/Height) (mm)
134°42′18.68″135°19′6.96″45R112,192/2438/2896
234°42′19.15″135°19′1.2″45U112,192/2438/2896
334°42′19.48″135°18′56.52″45G112,192/2438/2896
434°42′19.58″135°18′56.52″45G112,192/2438/2896
534°42′19.8″135°18′53.64″45G112,192/2438/2896
634°42′20.45″135°18′47.16″45G112,192/2438/2896
734°42′22.39″135°18′42.84″45GI12,192/2438/2896
834°42′22.9″135°18′42.48″45R112,192/2438/2896
934°42′30.1″135°18′40.32″22G16058/2438/2591
1034°42′29.27″135°18′33.48″-3.66 m/2.42 m/2.59 m 1
1134°42′29.26″135°18′31.40″-6058/2438/2591
1234°42′29.12″135°18′31.32″22G16058/2438/2591
1334°42′29.38″135°18′31.06″-6058/2438/2591
1434°42′29.27″135°18′30.96″22G16058/2438/2591
1 As information regarding the size of this container could not be obtained (the surface on which the type would have been written was in contact with ground), the authors measured the size by themselves.

