Article

Late Orogenic Heating of (Ultra)High Pressure Rocks: Slab Rollback vs. Slab Breakoff

1
Institute of Earth Sciences, University of Graz; Universitätsplatz 2, 8010 Graz, Austria
2
Institute of Petrology and Structural Geology, Charles University; Albertov 6, 12843 Prague 2, Czech Republic
3
Institute of Geophysics, ETH-Zurich, Sonneggstrasse 5, 8092 Zurich, Switzerland
4
Geology Department, Moscow State University, 119199 Moscow, Russia
*
Author to whom correspondence should be addressed.
Geosciences 2019, 9(12), 499; https://doi.org/10.3390/geosciences9120499
Submission received: 23 August 2019 / Revised: 13 November 2019 / Accepted: 22 November 2019 / Published: 27 November 2019
(This article belongs to the Special Issue Active Deformation and Rheology of the Continental Lithosphere)

Abstract

:
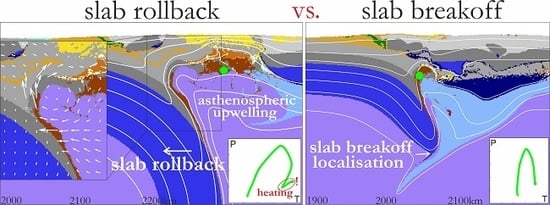
Some (ultra)high-pressure metamorphic rocks that formed during continental collision preserve relict minerals, indicating a two-stage evolution: first, subduction to mantle depths and exhumation to the lower-crustal level (with simultaneous cooling), followed by intensive heating that can be characterized by a β-shaped pressure–temperature–time (P–T–t) path. Based on a two-dimensional (2D) coupled petrological–thermomechanical tectono-magmatic numerical model, we propose a possible sequence of tectonic stages that could lead to these overprinting metamorphic events along an orogenic β-shaped P–T–t path: the subduction and exhumation of continental crust, followed by slab retreat that leads to extension and subsequent asthenospheric upwelling. During the last stage, the exhumed crustal material at the crust–mantle boundary undergoes heating from the underlying hot asthenospheric mantle. This slab rollback scenario is further compared numerically with the classical continental collision scenario associated with slab breakoff, which is often used to explain the late heating impulse in the collisional orogens. The mantle upwelling occurring in the experiments with slab breakoff, which is responsible for the heating of the exhumed crustal material, is not related to the slab breakoff but can be caused either by slab bending before slab breakoff or by post-breakoff exhumation of the subducted crust. Our numerical modeling predictions align well with a variety of orogenic P–T–t paths that have been reported from many Phanerozoic collisional orogens, such as the Variscan Bohemian Massif, the Triassic Dabie Shan, the Cenozoic Northwest Himalaya, and some metamorphic complexes in the Alps.

Graphical Abstract

1. Introduction

Although modern and ancient continental collision zones have been thoroughly studied both geologically and numerically, even for modern examples, we often cannot explain all geological data by theoretically predicted tectono-magmatic models [1]. Besides geological structures, the main parameters that can be used to correlate natural data with numerical models are the pressure and temperature of metamorphism. A possible complication recorded in collisional orogens is a two-stage metamorphic evolution of (ultra)high pressure ((U)HP) metamorphic rocks that were first exhumed from mantle depths to the middle–lower crust by slight cooling and later underwent heating before they arrived at the surface. Rocks subjected to these two events are usually recorded by a β-shape path [2,3,4]. Such a β-shaped path is characterized by a first stage of decompression and slight cooling followed by near-isobaric heating. If the temperature of the second event was high and lasted for a long time period, the minerals and their textures from the previous stages might have been obliterated, and only the evidence of the last stage of metamorphism was preserved. In this case, different apparent pressure–temperature (P–T) loops might be constrained, which are usually related to different thermal gradients and tectonic settings. The modern style of continental collision is characterized by metamorphic rocks with low and intermediate thermal gradients (dT/dP) in the suture and the orogen core, whereas metamorphic rocks with high dT/dP thermal gradients may be located in the orogenic hinterland [5]. Overprinting metamorphic events with distinct thermal gradients and P–T–time (t) paths have been reported from many Phanerozoic collisional orogens, such as the Variscan Bohemian Massif, the Triassic Dabie Shan, the Cenozoic Northwest Himalaya, and some metamorphic complexes in the Alps [2,3,4,6,7]. Many of these orogens show moderate heating (reaching 600–700 °C), whereas the highest temperature increase was recorded in the granulite belts. Below, we present some natural examples, where two-stage metamorphic evolution with β-shape P–T–t paths during continental collision was recorded, and discuss different tectonic models to explain those complex loops.

1.1. Natural Examples with β-Shape P–T–t Paths

The evidence of both UHP and ultrahigh temperature ((U)HT) metamorphism has been reported for the Moldanubian and Saxothuringian zones of the Variscan Bohemian Massif (Figure 1a). In the Saxothuringian zone, the determined metamorphic peaks are connected with a simple P–T–t loop [8]; for the Moldanubian zone, some β-shape P–T–t paths have been proposed (Figure 1a) [9,10]. Some eclogites and mantle peridotites within the granulites in the Moldanubian zone showed an ultrahigh pressure metamorphic event reaching 36 kbar and 45 kbar at 960 °C and 950 °C, respectively [11]. Besides the UHP conditions observed in mafic and ultramafic rocks, the relics of an (U)HP stage were also found in the host felsic granulites, which were assumed to have experienced UHP metamorphism 380–365 Myrs ago during subduction (Figure 1a) [3,10,12,13,14,15,16,17,18,19]. After exhumation to shallower depths, the rocks underwent a short-lived granulite facies overprint (up to 900–1000 °C at 22 kbar) [20,21]. Some HP granulites indicate extreme conditions of 850–1050 °C at 16–18 kbar [21,22,23,24]. In the southwestern part of the Moldanubian zone (the Bavarian Unit), some migmatized paragneiss also record β-shape P–T–t paths but with lower pressure conditions, the first indicating 8.5–11 kbar at 720–780 °C (ca. 340 Myrs ago) followed by cooling during exhumation, and the second heating up to 830–900 °C at 5.5–6.5 kbar (ca. 312 Myrs ago) [25]. Although the age of metamorphic recrystallization at granulite facies conditions at 340 Myrs ago is widely accepted [26,27,28], the heat source for this event remains debatable. The preserved mineral assemblages from the (ultra)high pressure stages suggest a short-lived high temperature event that did not lead to full recrystallization and re-equilibration of UHP minerals. Possible explanations for such intensive heating in the Bohemian Massif have been proposed to be either slab breakoff or mantle delamination with following asthenospheric mantle upwelling [29,30,31].
Another example of intensive thermal (Barrovian type) overprint but at lower temperatures has been reported for the blueschist facies metamorphic rocks from the southern Sivrihisar Massif in Turkey [4]. The massif is a part of the Tavşanlı zone, which consists of a belt of blueschist facies metasedimentary and metavolcanic rocks that were metamorphosed during the Africa–Europe collision. Juxtaposition of the Barrovian and blueschist facies metamorphic rocks without any discontinuity and their formation from similar protoliths indicate that these rocks experienced first high-pressure (HP) metamorphism and afterward partially underwent Barrovian-type overprinting (Figure 1b, SM path) [4]. Temperature increase in these Barrovian-type rocks was observed outward from the high-pressure body. The authors did not focus on the source for the later heating but excluded any connection with magmatism that occurred in this area only 7 Myrs later [4].
Similar β-shape P–T–t paths have been suggested for some areas in the Alps. The Penninic units of the Tauern Window in the Eastern Alps underwent high-pressure metamorphism during a subduction event and were exhumed to the crustal level during continent–continent collision. Holland [32] recognized two stages of metamorphic recrystallization, which were later confirmed and dated by Zimmermann et al. [33], Dachs and Proyer [34], and Ratschbacher et al. [35], and compiled by Kurz et al. [2] (Figure 1b, TW path). A subduction stage with eclogite facies conditions (up to 25 kbar at 650 °C; >45 Myrs ago) and subsequent exhumation to mid-crustal level was followed by isobaric heating from 400 to 525 °C at 7–8 kbar (ca. 30 Myrs ago). The preservation of eclogite facies mineral assemblages could be explained by high exhumation rates and heterogeneous fluid infiltration during subsequent metamorphism, e.g., [2]. The peak pressure is considered to date a slab breakoff [35], whereas following exhumation from mantle to crustal levels has been attributed either to extensional thinning or corner flow [36]. The last stage of heating is explained by conductive heating during the relaxation stage after slab breakoff.
A similar P–T–t path shape but at lower pressure for the first metamorphic stage was proposed for the Lepontine Dome in the Central Alps (Figure 1b, LD path). Subduction-related metamorphism under blueschist facies conditions occurred 40–30 Myrs ago and was followed by a decompression stage that lasted until 30–25 Myrs ago. Shortly after (20 Myrs ago), the rocks underwent Barrovian-type thermal overprint, reaching temperatures of around 550 °C at 7 kbar [37]. The authors argued that the increase in temperature occurred under static conditions and could be explained by the radiogenic heat production of additionally accreted continental blocks. However, this idea is not consistent with other modeling [38], which showed that additional tectonically accreted radiogenic material alone cannot reproduce such a rapid temperature increase as recorded by the Lepontine gneisses. Instead, a hot asthenosphere upwelling due to a shallow slab detachment is a more probable source for the re-heating. The same mechanism was proposed for the Internal Penninic Nappes in the Western Alps, which also show some post-collision re-heating [39,40,41]. The rocks south from the Lepontine Dome, in the Southern Steep Belt, also show evidence of β-shape P–T–t paths but at higher metamorphic grades reaching pressures over 20 kbar by the first stage and temperatures over 700 °C at shallow depths by the second stage of late heating [42,43].
Rocks from the Shuanghe locality in the eastern Dabie UHP belt, an orogenic belt between the Yangtze Craton and the Sino-Korean Craton in China (Figure 1c, DM path) [6,44], and from the Kaghan Valley in the Himalaya (Figure 1c, KV path) [7,45] recorded ultrahigh pressure (UHP) metamorphism followed by heating showing less obvious β-shapes. In the Dabie belt, the rocks already experienced heating during exhumation. The reheating of the eclogites by 100 degrees during exhumation at 12–17 kbar lead to partial melting. The rocks from Kaghan Valley cooled slightly during exhumation and afterwards underwent heating at 10–12 kbar. The eclogites are characterized by fast exhumation rates, and the reheating is explained by slowing of exhumation [7].
A study of garnet growth in coesite eclogite from the southeastern Papua New Guinea UHP terrane assumed these rocks to be another example with β-shape P–T–t paths [46]. The authors proposed a two-stage metamorphic evolution: a UHP stage (above 27 kbar and 650 °C (previously reported by Baldwin et al. [47]), followed by decompression and cooling and subsequent short-lived heating stage reaching 740–770 °C at 12–15 kbar. A potential heat source in that region is thought to be an asthenospheric inflow ahead of the spreading ridge, after Abers et al. [48].
Thus, the theoretically predicted ideas for the heating stage in the listed examples are shallow slab breakoff or radiogenic heat production of additionally accreted continental blocks (the Alps and the Bohemian Massif), mantle delamination (the Bohemian Massif), the slowing of exhumation (the Kaghan Valley in the Himalaya), and asthenospheric upwelling ahead of ridge formation (Papua New Guinea). To test these ideas, we require models incorporating geochemical, geological, petrological, and geophysical data.

1.2. Models of Potential Heat Sources

Although a number of petrological and geochronological studies have been undertaken to understand the metamorphic evolution of (U)HP rocks, reconstructing their full P–T–t paths and explaining their relation to a relevant geodynamic process remain challenges. Numerical modeling allows accurately following and extracting P–T conditions of a hypothetical rock layer during subduction and continental collision. Understanding the exhumation mechanisms of UHP metamorphic rocks during continental collision has been advanced by geodynamic numerical and analogue modeling, showing distinct exhumation mechanisms including channel flow, vertical, and diapiric exhumation [49,50,51,52,53,54,55,56,57]. Nevertheless, only a few of these attempts focused on the details of the rock’s exhumation path. The information from modeled P-T-t paths could help us to more thoroughly correlate a tectonic model with the available metamorphic record within the rock. Consequently, in this study, we focused on heating during the exhumation stage. Below, we discuss a series of available numerical studies that directly or indirectly analyzed late orogenic heating; in most cases, this was a medium pressure (Barrovian type) metamorphic overprint. We think that it could correspond to at least some of the heating pulses along the P–T–t paths discussed above.
Potential heating mechanisms can be classified into internal heat sources, including (1) radiogenic heating [58,59] and (2) shear heating [60], advective heating by (3) the emplacement of magmatic rocks [61,62] or (4) the exhumation of buried crustal material [59,63,64,65,66,67,68], (5) conductive heating by asthenosphere upwelling including different mechanisms: (5a) extensional thinning, (5b) mantle/crustal delamination, and (5c) slab breakoff [38,69,70].
The first thermo-mechanical modeling by Jamieson et al. [59] described the effect of the radiogenic heat production of accreted crustal material during continental collision, resulting in regional Barrovian-type metamorphism. They showed that accreted or thickened heat-producing crustal material is an important source of heat in continental collisional orogens. Accreted crustal material within the mantle wedge formed prior to the collision stage is an important radiogenic source to heat the lower crust to over 700 °C. However, the effect on the middle–upper crust is minimal. Thus, heat from the accreted material competes with cooling during subduction. With the removed cooling effect by the end of the convergence at a certain stage or an increase in erosion rates, the temperature of the accreted material could reach 900 °C due to radiogenic heating, leading to partial melting ([59] Figure 11). Consequently, the produced and upward-moving melts provided an additional heat input for the upper crust. The optimal time scale for this kind of crustal heating has been determined to be 20–30 Myrs from the beginning of the collision. None of the heated rocks showed cooling during initial decompression before temperature increase. Engi et al. [67] showed, with an example from the Central Alps, that there is no need of accreted crustal material to produce a late Barrovian-type metamorphic overprint. Based on the results of numerical modeling, they argued that the accretion of the upper-crustal fragments rich in radioactive elements at the mantle depths and their subsequent fast extrusion along the same path could generate sufficient heat for Barrovian-type metamorphism.
The effects of accreted radiogenic material and a shallow slab breakoff on the overlying lithosphere were numerically tested by Brouwer et al. [38]. The authors argued that both processes could potentially provide heat to cause re-heating during exhumation. However, heating due to accreted radiogenic material needs a termination of the subduction process and tens of millions of years, whereas a slab breakoff causes a fast temperature increase in a few million years. Mantle upwelling caused by slab breakoff is one of the most common modern explanations among geologists for late orogenic heating and magmatism. One of the first quantitative tests of slab breakoff was completed by Davies and von Blanckenburg [69]. They argued that a shallow slab breakoff could be responsible for the local penetration of hot asthenosphere underneath the lithospheric mantle of the overriding plate causing its melting. Later, many dynamic and analogue models were used to test the effect of slab breakoff [70,71,72,73,74,75,76]. The first-order parameters controlling the depth of the slab breakoff are the plate convergence rate and the age of the oceanic plate. Varying these parameters, Duretz et al. [70] defined shallow, intermediate, and deep breakoffs (40, 200, and >250 km, respectively). The consequences of slab breakoff in terms of magmatism and heat sources have been poorly numerically studied. An exception is the work of Freeburn et al. [74], where the authors used coupled petrological–thermomechanical numerical models to investigate post-collisional magmatism as a consequence of slab breakoff. They showed that more breakoff-related melting occurs with early, fast, and shallow breakoff, mostly in the subducted crust, whereas melting of the lithospheric mantle is difficult to achieve even with shallow slab breakoff. The main reason for that is the depth of slab breakoff, which is in most cases located below the base of overriding lithosphere [70,77] and is thus too deep to generate decompressional melting of dry upwelling asthenosphere [74]. Thus, the melting of the lithospheric mantle during collision may not necessarily be related with a slab breakoff [74]. Further ideas for the possible overestimation of slab breakoff consequences are summarized in the work of Niu [78]. The author also argued that hot asthenosphere is unlikely to come from beneath the slab into the mantle wedge, as suggested by many geologists starting from Davies and von Blanckenburg [69].
Besides mantle upwelling, a relatively fast but local elevation of temperatures can also be explained by viscous heating along shear zones [60]. Based on numerical modeling, the authors showed that heat diffusion lasts several million years, which results in positive temperature anomalies along these deformation zones. The effect becomes more intensive with a strong lower crust and rapid convergence rates. A simple thermal model introduced by Mako and Caddick [79] also suggests that shear heating should significantly contribute to the thermal budget in orogens by tens of degrees for the most plausible deformation scenarios and up to 200 degrees in extreme cases. Nevertheless, the scale of such heating remains small and does not contribute much to regional metamorphism.
All described heat sources are important mechanisms for late heating during continental collision and most probably often supplement each other. The focus of this study was to investigate the mechanisms that are likely to be responsible for the rapid (short-lived) heating of rocks exhumed from (U)HP depths. For this purpose, we used a 2D coupled petrological–thermomechanical numerical model of continent–continent collision. Although the numerical model includes radiogenic heat production and shear heating, we focused on advective and conductive heating from the mantle, which tend to be more dominant for a fast heating stage in the orogenic examples discussed above.

2. Numerical Modeling Design

2.1. Numerical Nodel

The 2D petrological–thermomechanical numerical model used for this study is based on the I2VIS code of Gerya and Yuen [80], which combines a conservative finite difference method with a non-diffusive marker-in-cell technique. The experiments were conducted in a 2D section through the lithosphere and underlying mantle. The model includes redistribution of the material in response to contrasts in densities and viscosities, spontaneous slab bending, the dehydration of subducted crust, aqueous fluid transport, eclogitization, partial melting, and melt extraction.

2.2. Initial and Boundary Conditions

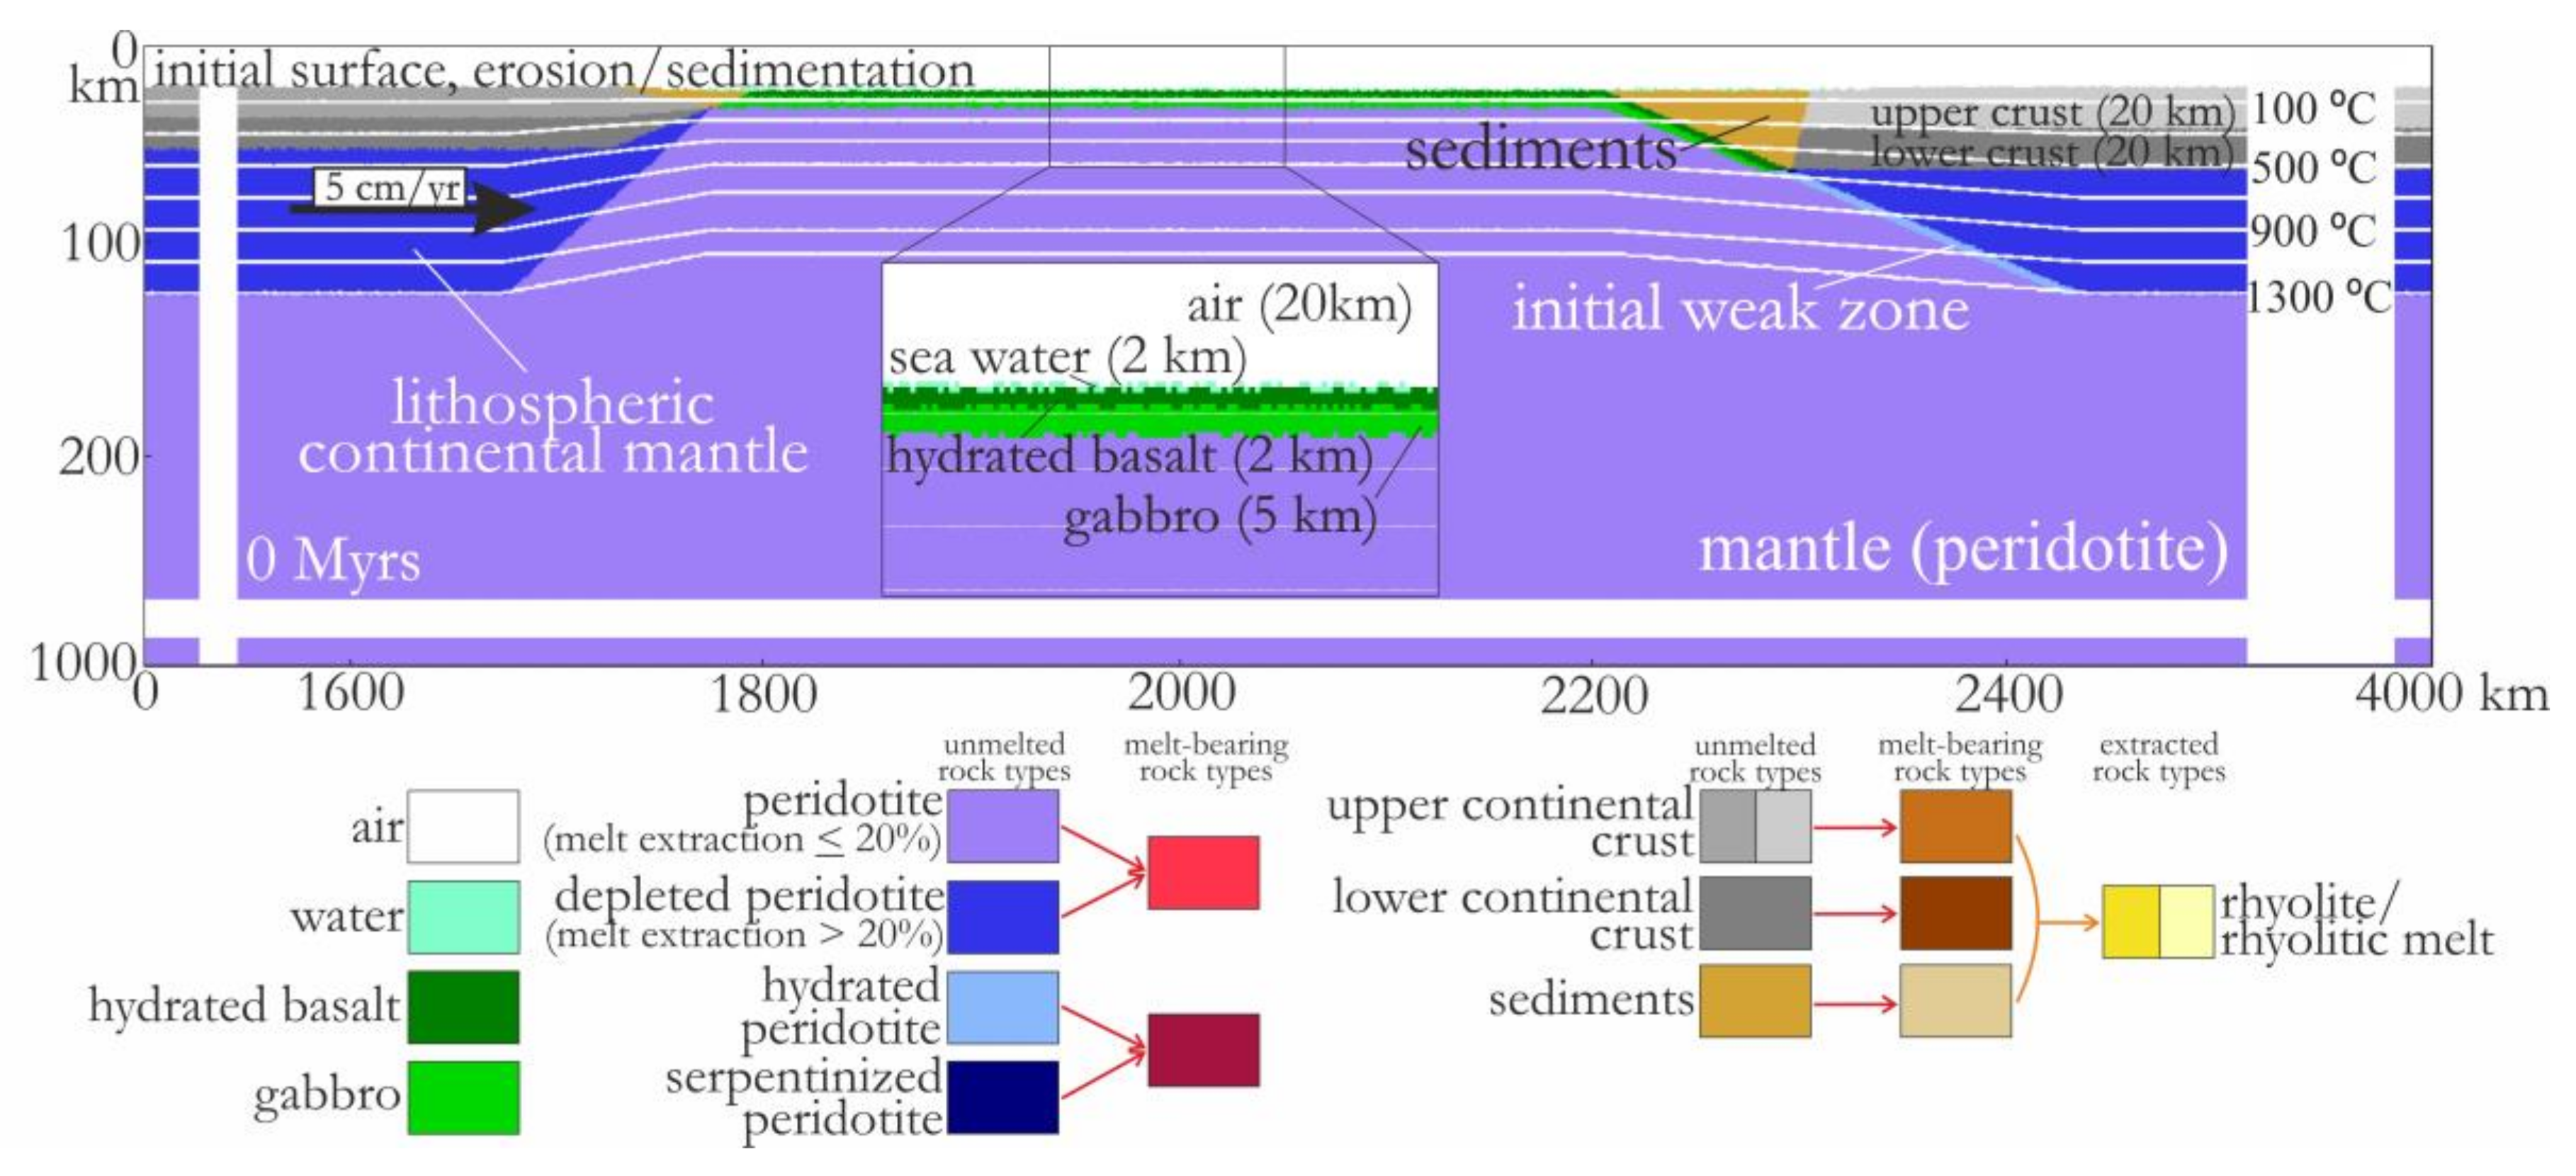
The experiments simulated the processes of oceanic plate subduction followed by continental collision in a 4000 × 1000 km lithosphere/asthenosphere section (Figure 2). The resolution is changing from 1 × 1 km in the central part of the domain, where the continental collision occurs, to 5 × 10 km at the boundaries. Different colors in the legend indicate rock types that later appear in other figures. In all experiments, an oceanic plate was located initially between two continental plates. On its left, it was attached abruptly to the continental lithosphere with sedimentary rocks (sand color) overlying a narrow passive margin, whereas on the right, a prism of sedimentary rocks was set against the continent above a weak zone of hydrated mantle (light blue) along the left edge of the right-hand continental plate. The oceanic crust is represented by 2 km of hydrothermally altered basalts (hydrated basalts, green) underlain by 5 km of gabbro (light green). The upper continental crust (light and middle grey) is felsic with a weak rheology of wet quartzite (Table A1 in Appendix A) and a thickness of 15/20 km, whereas the lower continental crust (dark grey) has a slightly higher density, a stronger rheology of plagioclase An75 (Table A1 in Appendix A), and a thickness of 10/20 km. The length of the oceanic plate, lithosphere thickness, and some other parameters vary in the experiments, as shown in Table 1.
All mechanical boundary conditions were free slip. The left-hand continental plate was initially pushed to the right with a constant velocity imposed in a small domain at the left edge of the model. The value of the velocity and the duration of pushing were distinct for each experiment (Table 1). The top surface of the lithosphere was treated as an internal free surface by using a 20-km thick top sticky air layer with low viscosity (1018 Pa·s) and density (1 kg/m3). The initial temperature field for the oceanic lithosphere was derived from the oceanic geotherm computed for the given cooling age (Table 1) and the temperature of the asthenospheric upper mantle [81]. The initial thermal structure of the continental lithospheres was a simplified linear profile defined by 0 °C at the surface, 1300 °C at the bottom of the lithosphere (70–140 km), and a 0.5 °C km–1 temperature gradient for the underlying mantle. Details of the procedures used in the model were already described in previous works [55,80,82,83,84,85]. Here, we present a short summary.

2.3. Density Procedure, Hydration, Melting, and Melt Extraction

The densities of mafic lithologies (hydrated basalts and gabbro) were adjusted to consider the increase in density due to eclogitization at depth and the increase in density of the residues due to melt extraction; in the mantle, the density adjusted due to the transition of olivine to spinel structure and Mg-perovskite in the mantle transition zone (410–660 km depth; the procedure has been previously described in [86]). The density of the continental lithospheric mantle (depleted mantle) is 20 kg/m3 lower compared to asthenospheric density (Table A1 in Appendix A) due to melt depletion [87,88].
A simplified linear dehydration procedure from Gerya et al. [89] was used in the model. The generated fluid markers were moving upward until they reached a lithology that assimilates water. The hydrated mantle is subdivided into two parts: an upper, serpentinized, and a lower, hydrated, but not serpentinized zone. The procedure for this transition was based on the work of Schmidt and Poli [90]. In the experiments, we used a pore fluid pressure factor of 0.1, providing a moderate weakening of rocks subjected to free fluid propagation.
For the melting of the crust, we used a linear function of P–T [91], whereas mantle melting was computed according to the parameterized batch-melting model of Katz et al. [92]. Once the amount of melt for a given marker was more than zero, the lithology changed to the melt-bearing analogue. For these lithologies, we use the term “melt-bearing” to mean a mixture of solids and liquid, whereas for the silicate liquid extracted from melt-bearing rocks, we use “melt”. The melt-bearing mantle from hydrated peridotite has similar properties to the melt-bearing mantle from dry peridotites, but with wet olivine rheology (Table A1 in Appendix A). The melt extraction occurs if the amount of melt is more than 4 vol %. During an extraction episode, we leave 2 vol % melt in the material. Thus, the amount of melt in a melt-bearing material does not exceed 4 vol %. The melt extracted from the melt-bearing lithology was transported instantaneously to the surface as volcanics (20%) and to a site of plutonic emplacement in the crust (80%; at sites of highest possible intrusion emplacement rate [93]). After a melt extraction episode, the yield strength of the lithologies above was decreased according to the melt weakening factor λmelt, which was prescribed as 0.1 and controls the moderate weakening of the lithologies subjected to melt percolation [84,93]. The melts extracted by the melting of continental crust and sediments are here called “rhyolitic”.

3. Experimental Results

We present a special type of continental collision numerical experiments (experiments R1 and R2), which includes subduction of continental crust, followed by simultaneous slab rollback, vertical extrusion of the crust, asthenospheric upwelling, and heating of the subducted and exhumed crustal material. The P–T–t paths of crustal material in these experiments were compared with those produced in a distinct series of continental collision experiments ending with slab breakoff (experiments B1, B2, B3, B1D, and B1E). The first-order variable parameters for the experiments are presented in Table 1.

3.1. Slab Rollback Experiments (R1 and R2)

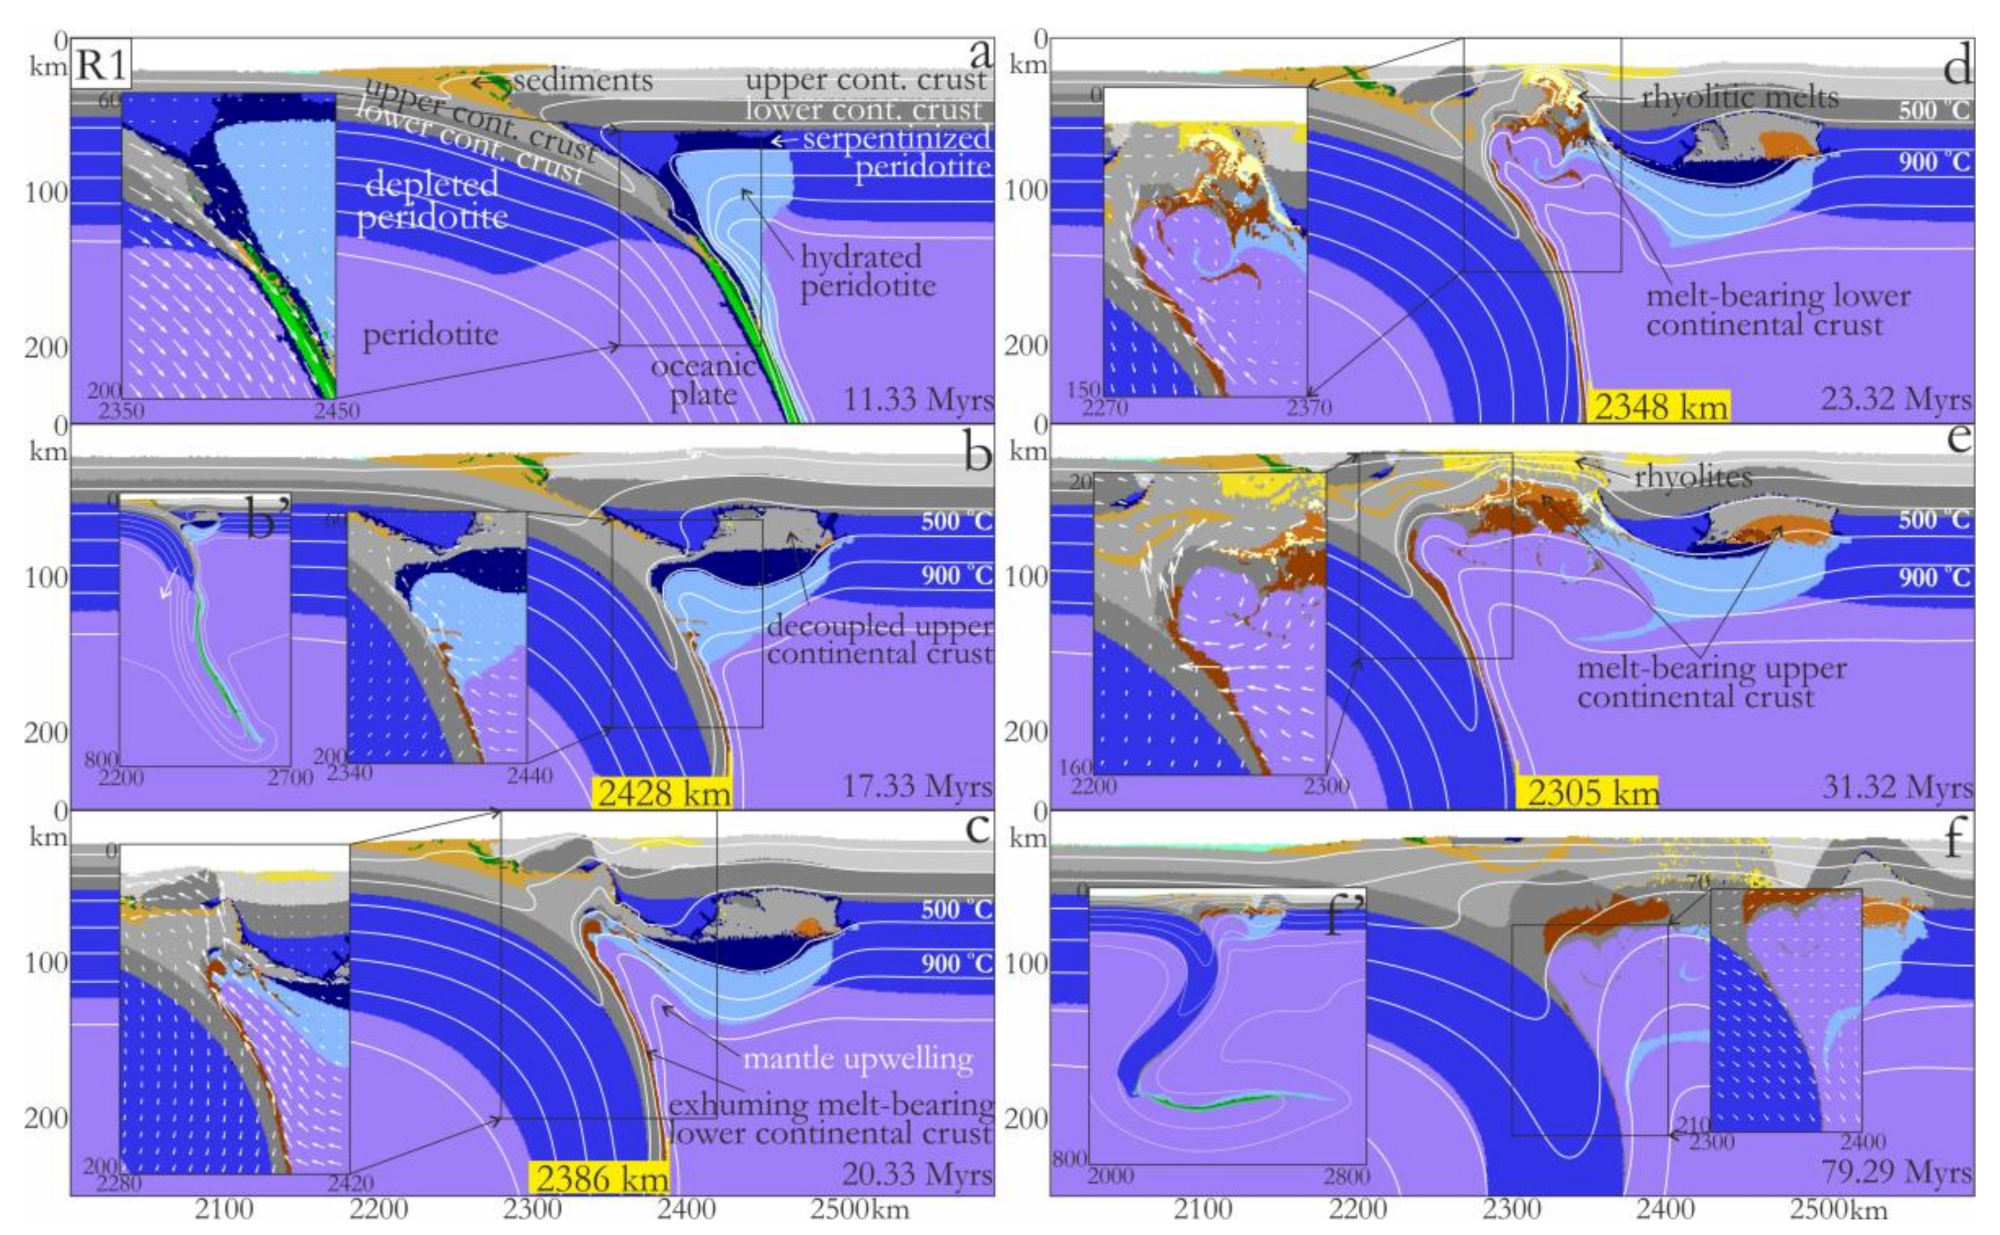
The evolution of experiment R1 is represented in Figure 3, where the continental collision (Figure 3a,b) results in the exhumation of (U)HP metamorphic rocks (Figure 3c–e), accompanied by the continental slab retreat (slab rollback; Figure 3b–e) causing asthenospheric upwelling and partial heating of the exhumed crustal material (Figure 3d,e). In this experiment, we used a relatively short 40 Myrs old oceanic plate, 100-km thick continental lithospheres, and prescribed a long-term pushing of the left-hand continental plate with a constant velocity of 5 cm/yr (Table 1). Due to the prescribed push, the oceanic plate subducted, and the ocean basin closed. Dehydration of the subducted oceanic crust led to hydration/serpentinization of the overlying mantle (light and dark blue colors; Figure 3a). The oceanic–continental subduction was followed by collision, which started at 10 Myrs after the beginning of the experiment, with a continental plate subduction (see white arrows of material movement in Figure 3a). After the continental crust reached a depth of 130 km, the upper crust decoupled, exhumed through the serpentinized mantle, and became stuck at the crust–mantle boundary (Moho) of the overriding plate (Figure 3b). After decoupling of the upper crust, the buoyancy of the continental slab dropped, allowing the oceanic slab pull to prevail, causing further subduction of the lower continental crust (Figure 3b,b’). Later, the oceanic slab started to stagnate in the mantle transition zone; then, it became bent anticlockwise, and flattened at the bottom of the mantle transition zone (Figure 3b’ and Figure S1b,c in Supplementary Materials). It pulled the continental plate behind (down-left), which caused continental slab bending followed by continental slab rollback (Figure 3b–e). The free place was immediately occupied by the hot asthenospheric mantle (white arrows in Figure 3b,c), which penetrated into the wedge, causing heating and partial melting of the subducted lower crustal material from the side (Figure 3b). The melt-bearing lower crustal material that appeared at the contact with the hot mantle started to exhume along this contact, simultaneously with the ongoing mantle upwelling (Figure 3c). As far as the lower crust with the following mantle upwelling reached the overlying subducted upper crust, the upper crust exhumed vertically to the surface (Figure 3c,d). The ongoing slab rollback resulted in spreading of the mantle upwelling to the left and further exhumation of the subducted lower crustal material (Figure 3d,e). Some rocks after the exhumation to the lower crustal depths were transferred through an area with elevated geotherms and intensively heated at this level (conductive heating from the hot asthenospheric mantle). The mantle upwelling brought the geotherm of 900 °C to a depth of approximately 50–60 km (Figure 3e), which stayed approximately at this level until the end of the experiment. The elevated geotherms at the bottom of the crust caused partial melting of the crustal material and the extraction of granitic melts (rhyolites, yellow colors; Figure 3d,e). Around 32 Myrs after the beginning of the experiment, the force balance changed because the whole oceanic slab stagnated in the mantle transition zone (Figure 3f’ and Figure S1c in Supplementary Materials), did not produce enough pull, and the left-hand continental plate started to advance again as long as the push was active (Figure 3f). The compressional force in the orogen led to crustal thickening and exhumation of the upper crustal block, which decoupled at the beginning of collision, diapirically through the overlying crust.
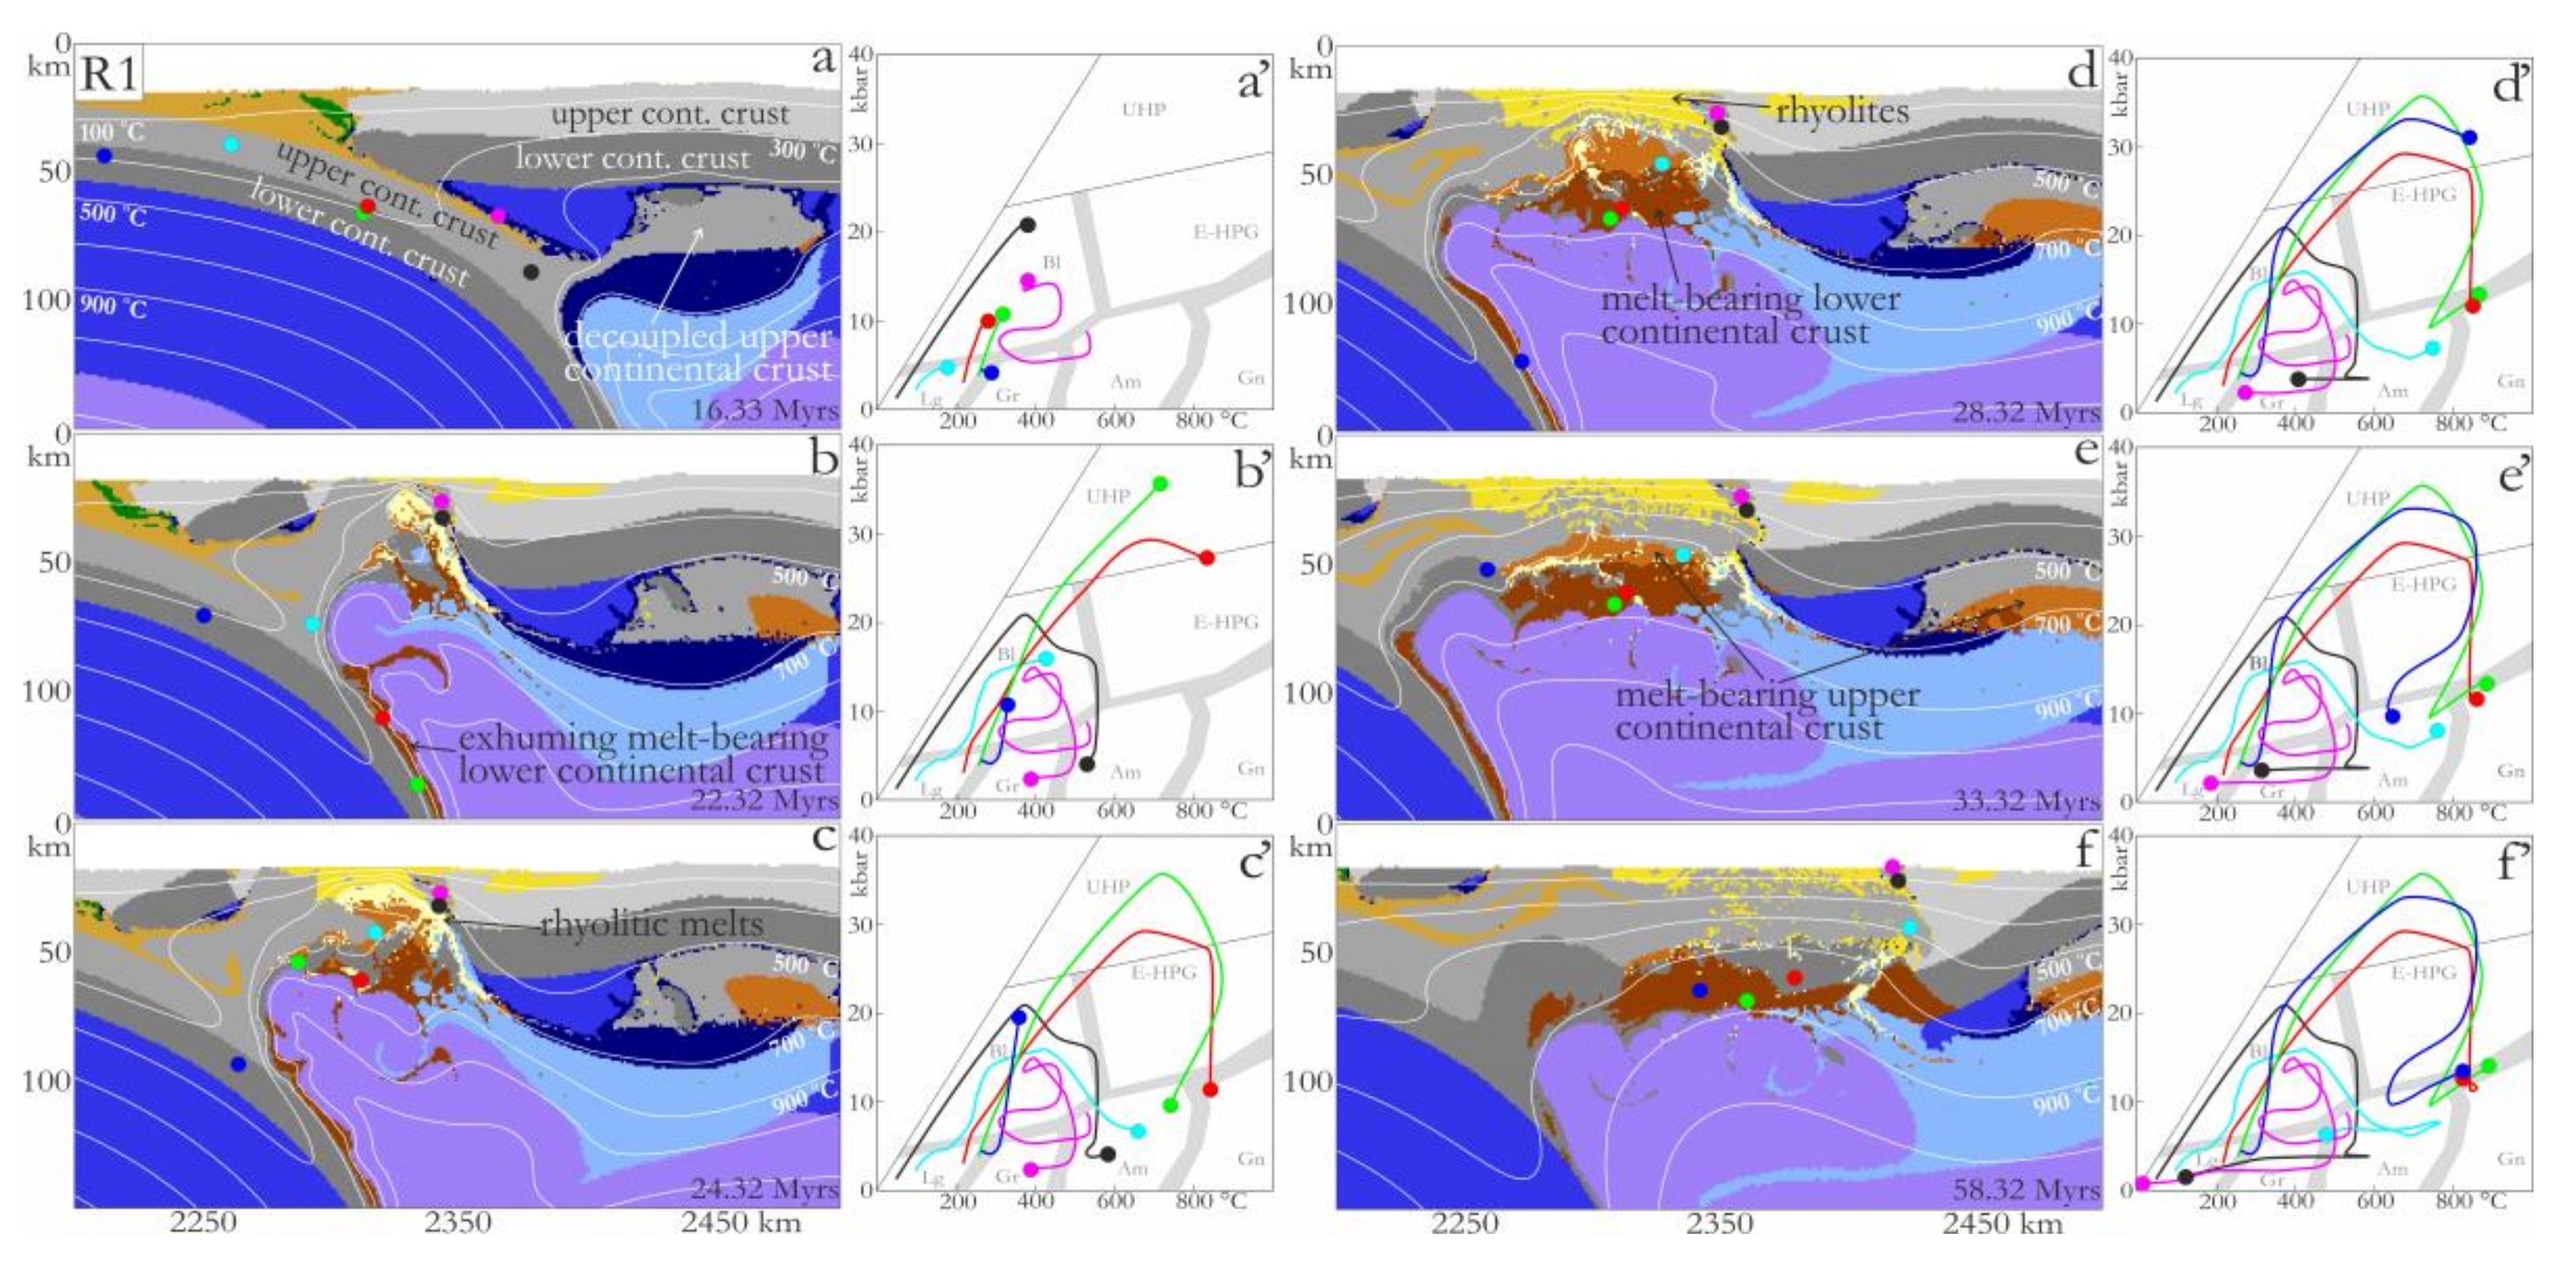
The metamorphic P–T conditions for the subducted continental crust in the experiments through time were traced using markers (Lagrangian particles; shown as circles on the snapshots with respective P–T–t paths in the right columns of the figures, e.g., Figure 4). The five markers represented in Figure 4 were initially placed inside the left-hand continental plate margin, with two markers (light blue, black) in the upper continental crust and three markers (dark blue, red and green) in the lower continental crust. One marker (pink) was initially located in the lower crustal margin of the right-hand continental plate and was also involved in subduction.
The pink marker first experienced slight cooling due to the lower geotherms along the subduction channel. Afterward, it was dragged down by the incoming left-hand continental margin and brought to a depth of 45–50 km (Figure 4a,a’), where it was picked up by the exhuming continental crust from below and brought to the upper-crustal level (Figure 4b,b’). Both upper crustal markers from the left-hand continent were buried during continental subduction to model depths of 45–60 km and then exhumed to the upper–middle crust (light blue and black markers in Figure 4a–c,a’–c’). The following evolution was different for these markers. The black marker was slightly heated at 4 kbar by intrusive magmatic rocks (light yellow color in Figure 4c,c’), afterward cooling down at the same depth and finally continuing gradual exhumation toward the surface. These magmatic rocks were also responsible for the slight heating during exhumation of the pink marker. The light blue marker at a depth of 20 km (6–7 kbar) passed through an area of elevated geotherms due to conductive heating of the asthenospheric mantle and was intensively heated, reaching a temperature of 760 °C (Figure 4d,d’,e,e’), which corresponds to upper-amphibolite facies. Afterward, it underwent almost isobaric cooling (Figure 4f,f’).
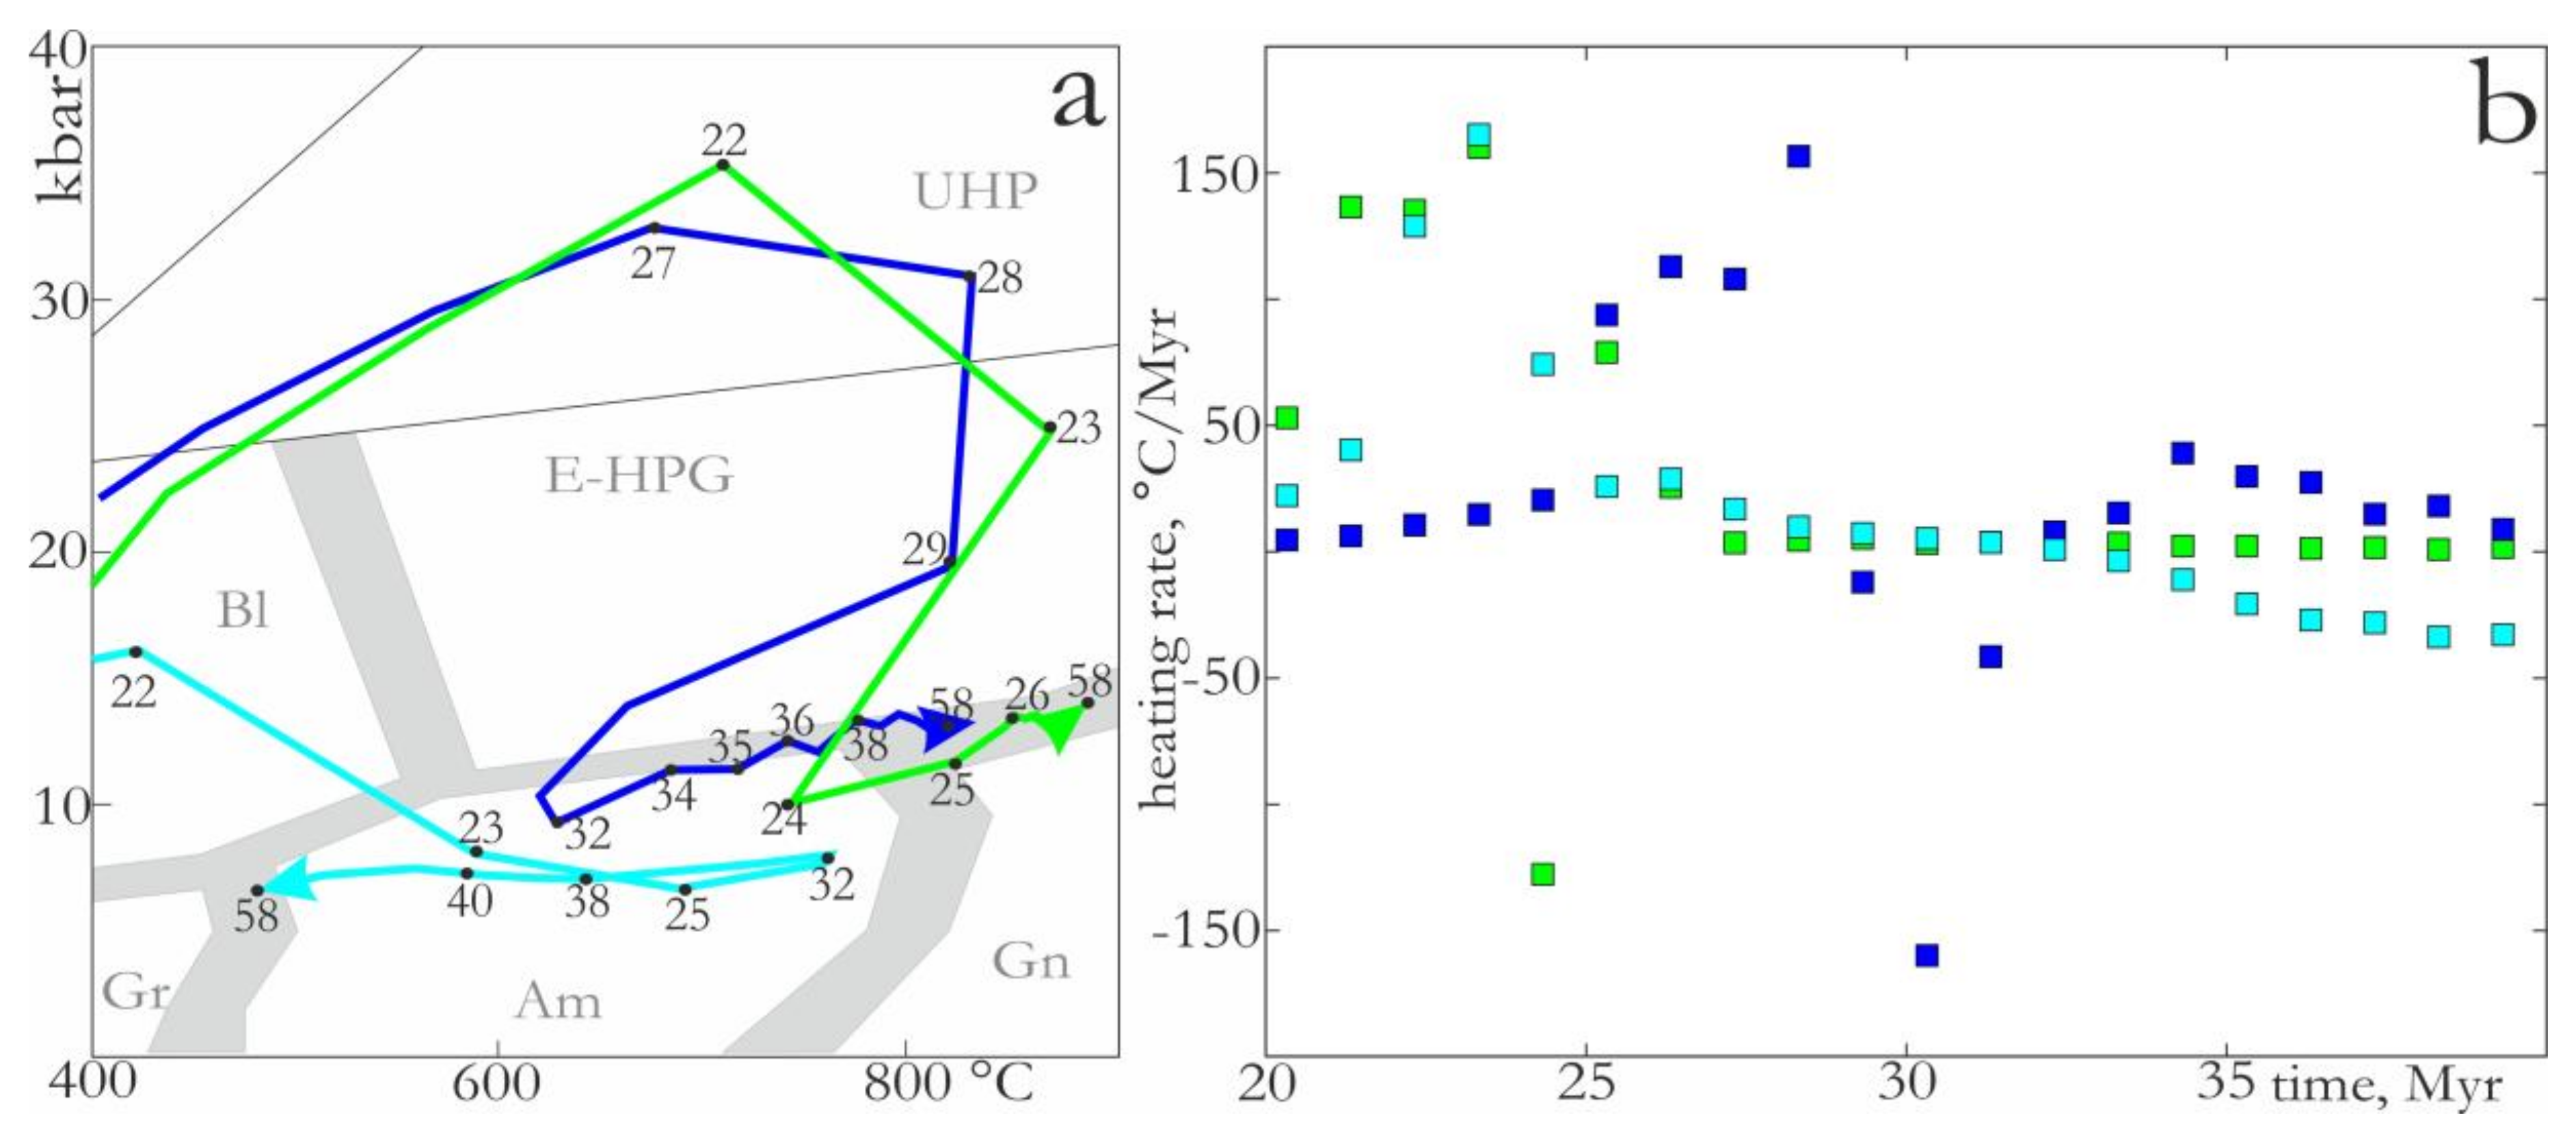
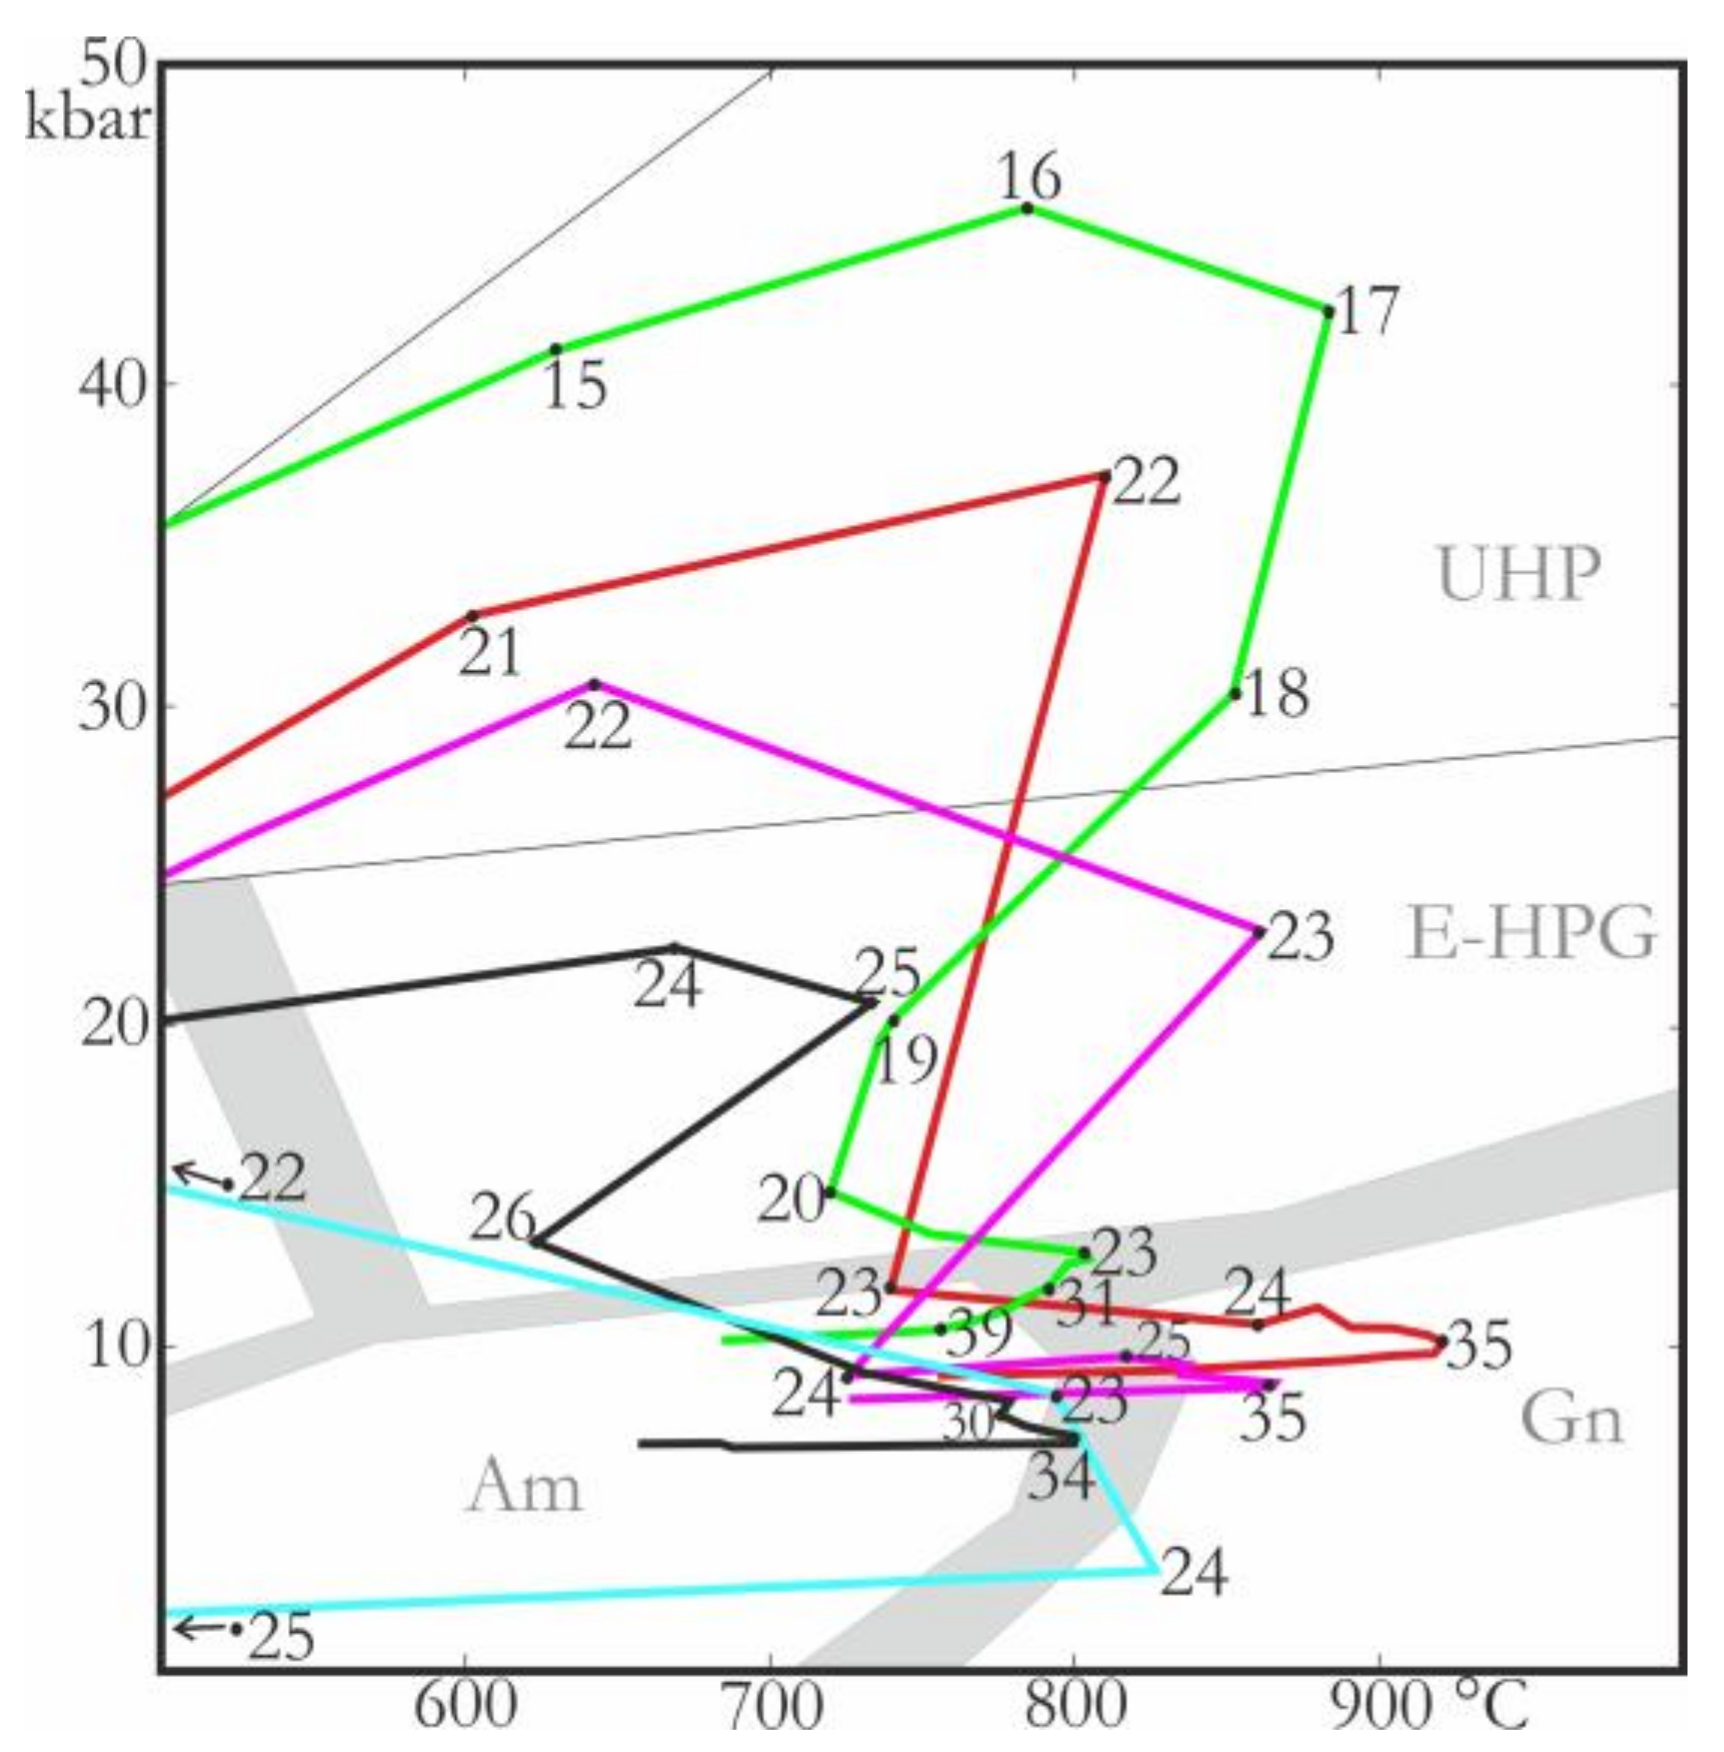
The lower continental crust due to its stronger rheology and slightly higher density compared to the upper crust (Table A1 in Appendix A) was buried deeper (Figure 4b–d,b’–d’), reaching ultrahigh pressure metamorphism. Due to this crustal reside at greater depth, it was heated by the juxtaposed hot asthenospheric mantle, achieving maximum temperatures of 800–850 °C at approximately 25–30 kbar (red, green, and blue markers, Figure 4c’,d’). The exhumation paths of the markers show either isothermal decompression (red marker, Figure 4c’) or decompression with simultaneous cooling (green and blue markers, Figure 4e’). In the latter case, the markers reached P–T values of 600–750 °C at 10 kbar (Figure 4c’,e’) and afterward passed through an area of elevated geotherms, resulting in a temperature increase to 820–880 °C (Figure 4f’) and a slight pressure increase. The detailed parts of the P–T–t paths of three markers that underwent the late heating stage are shown in Figure 5a, where the numbers represent millions of years from the beginning of the experiment at certain points along the P–T–t paths. The exhumation stage usually takes 2–5 Myrs and is characterized by the highest cooling rates (two points in Figure 5b with the highest negative values of “heating rate”). The rates for the later heating stage are rather low and decrease with time (Figure 5b); whereas the heating by 100 degrees at the beginning of the stage varies from 2 to 4 Myrs, the heating by another 100 degrees takes a minimum of 7 Myrs. Thus, both the upper and lower crust can be conductively heated by the asthenospheric mantle by up to 100–200 degrees after subduction and exhumation to the lower–middle crustal depths. The rocks remained approximately at this level until the end of the experiment.
The exhumation of the (ultra)high pressure rocks in the experiment occurred simultaneously with the asthenospheric mantle upwelling during the ongoing slab rollback. The free space created by the slab rollback facilitated the exhumation of the rocks that appeared on the top of the mantle upwelling. Thus, the P–T–t loops in the experiment were rather wide, reflecting the contact zone of the exhuming rocks with the hot mantle. The highest exhumation rates for the upper-crustal markers were around 2–3 cm/yr (light blue, black markers) and 4–5 cm/yr for the deeply subducted markers of the lower crust (red, green, and blue markers).
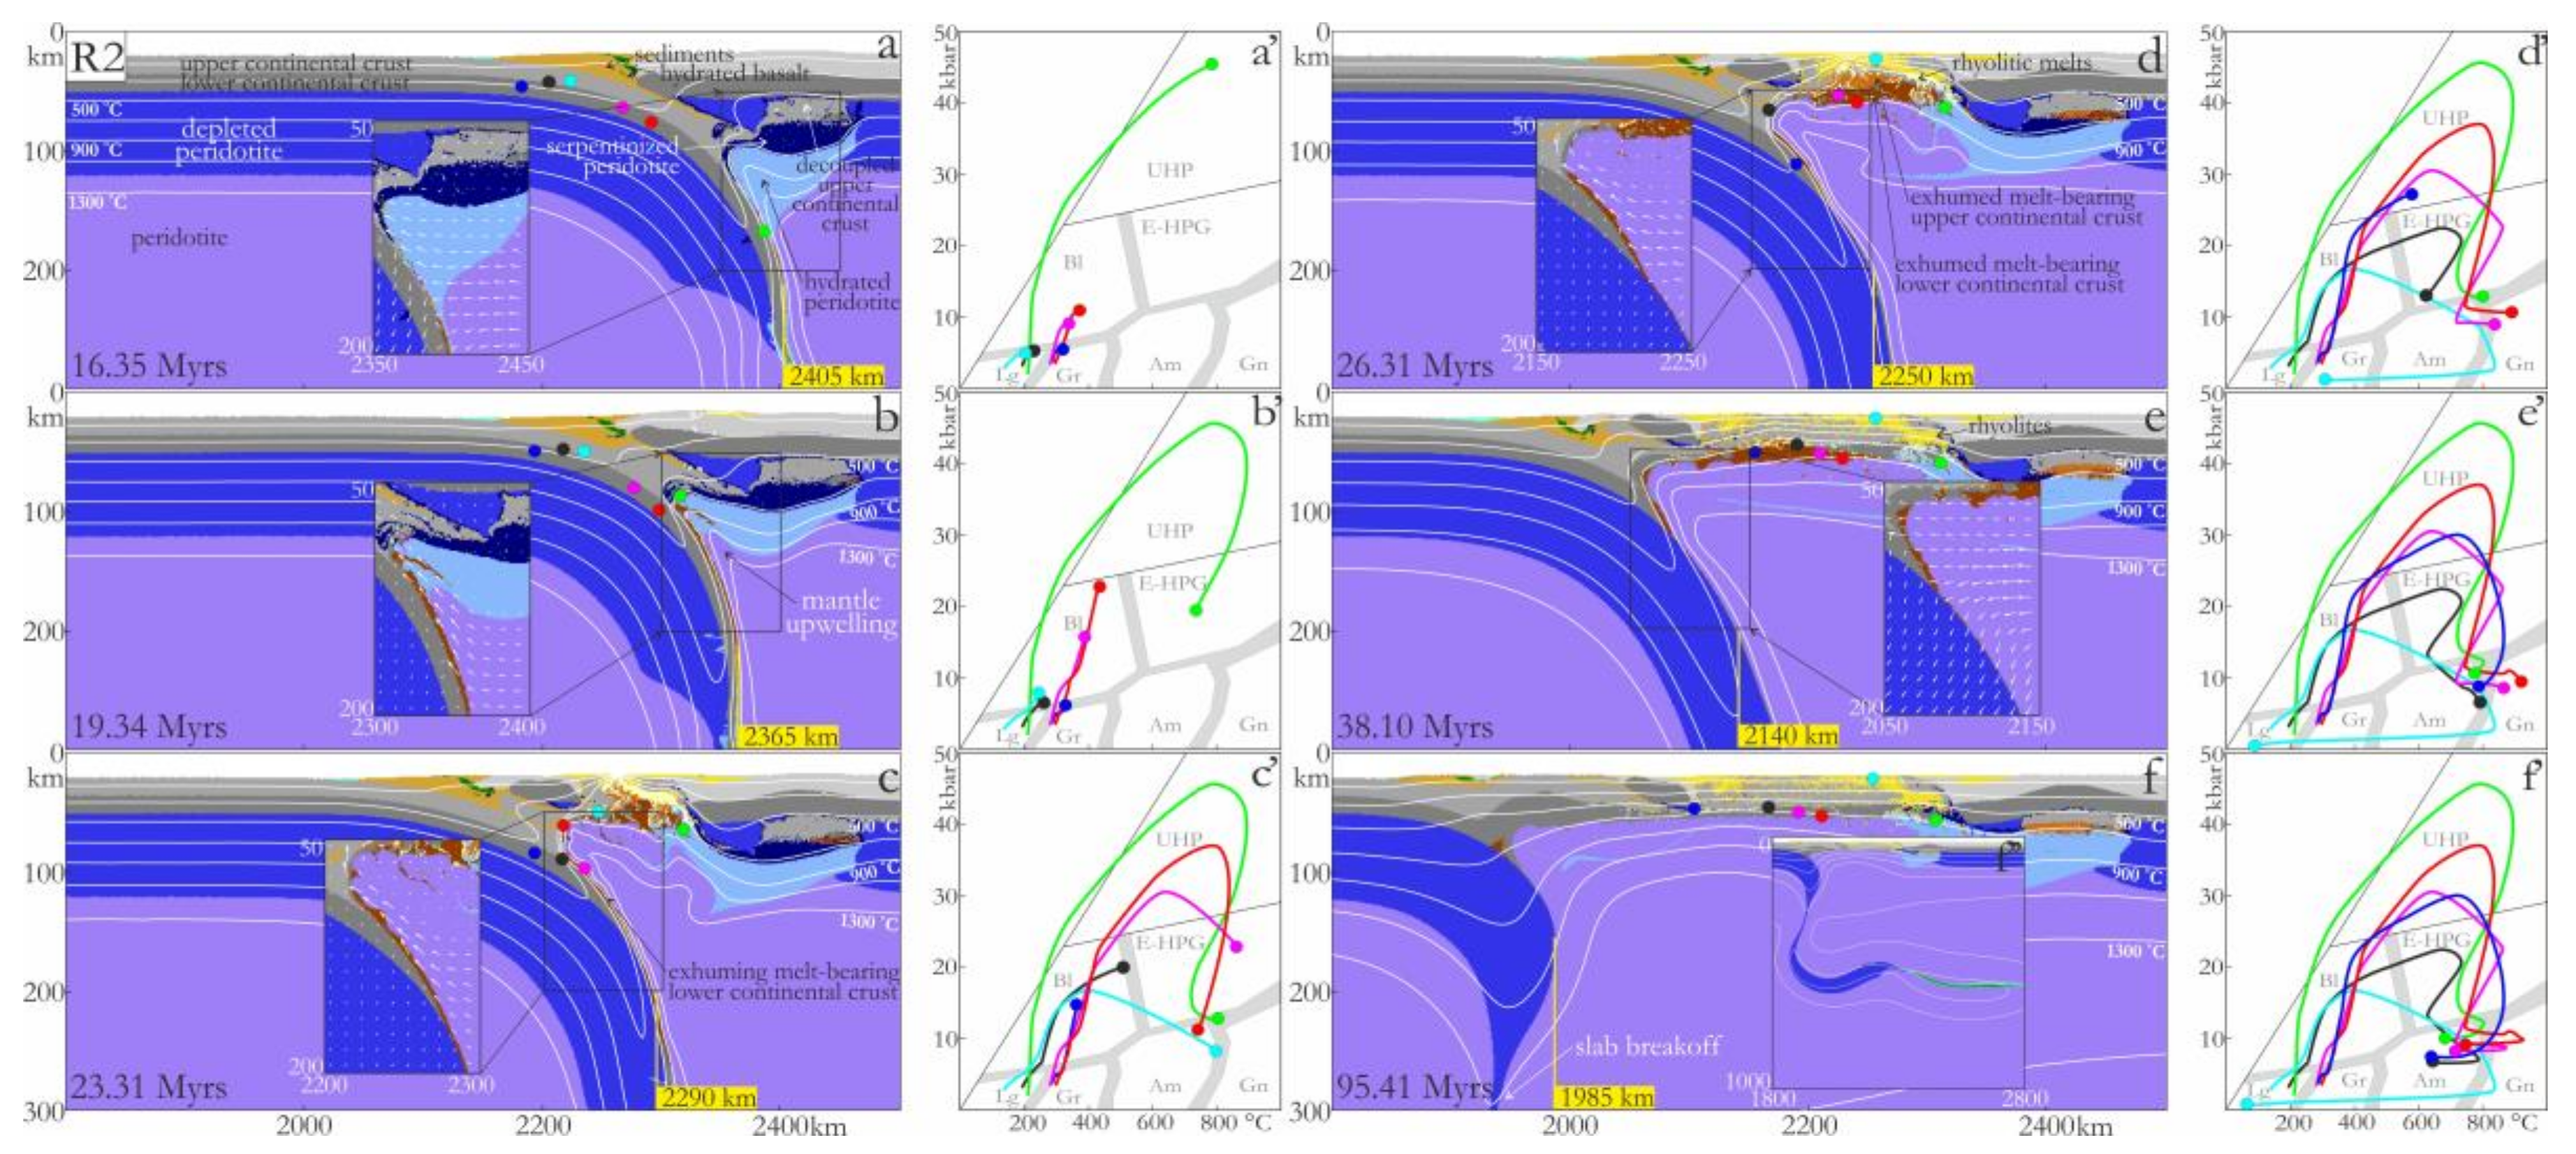
A prolonged continental slab retreat and asthenospheric mantle upwelling causing exhumation of crustal material and its heating occurred in experiment R2 (Figure 6). In this experiment, we prescribed an initial pushing of the left-hand continental plate with a constant velocity of 5 cm/yr (Table 1). The push was maintained for the first 10 Myrs of the model evolution until the left-hand continent reached the right-hand continent, after which the push was removed, and subduction was driven spontaneously by slab pull. The absence of pushing during the continental collision led to a more vigorous continental slab rollback, ending in this experiment with a slab breakoff (Figure 6f).
The evolution of the crustal material is recorded by six markers initially located in the left-hand continental crust: two in the upper crust (light blue, and black) and four in the lower crust (red, green, pink, and blue). While the upper crust decoupled from the plate and became stuck at the crust–mantle boundary of the overriding plate (Moho), as in experiment R1, the lower continental crust subducted much deeper (Figure 6a). The ongoing slab rollback resulted in asthenospheric mantle upwelling and exhumation of the crustal material (Figure 6b,c). The green marker initially located close to the continental margin reached a depth of 150 km and exhumed backward along the contact with the mantle upwelling (Figure 6a,a’,b,b’). The later arrived markers from the lower crust reached slightly shallower depths of 90–120 km (Figure 6e’). All markers were exhumed to the bottom of the overlying plate (the Moho). Depending on an exhumation path, some markers showed slight cooling during exhumation (green, red, and pink markers; Figure 6c,c’,d,d’); the others, similar to the blue marker in Figure 6e’, exhumed directly along the contact with the hot mantle and showed almost isothermal decompression. Most of the markers experience rapid 100–200 degrees of heating during 1–8 Myrs (Figure 7). The black marker from the upper continental crust showed a similar P–T–t path of a β-shape with the late heating of almost 200 degrees within 8 Myrs (Figure 6 and Figure 7). A distinct exhumation path has the light blue marker from the upper crust. After the exhumation to the Moho, it was incorporated into the rhyolitic melts, extracted from the melt-bearing continental crust below, and brought to the near surface area (Figure 6c,c’,d,d’). The extreme heating of this marker by 400 degrees within 1 Myrs (Figure 6d’ and Figure 7) is connected with its juxtaposition to the melts.
Around 50 Myrs after the beginning of the experiment, the whole oceanic plate reached the 660 km discontinuity (Figure 6f’ and Figure S1f in Supplementary Materials), and the pull vanished. The slab rollback slowed down and finally, a slab breakoff occurred within the continental plate at a depth of approximately 250–300 km. The continental slab rolled backward 400 km in total, leaving behind a 40-km thick and 300-km long piece of continental crust mostly composed of the previously subducted and exhumed crustal material and granitic intrusives (rhyolites; Figure 6f). Most of the markers that underwent the late heating event stayed at the Moho depth until the end of the experiment, but some were incorporated into the extruding magmatic complexes and brought to the upper crustal depths (e.g., light blue marker; Figure 6f).
Due to the asthenospheric mantle upwelling in the experiment and associated significant temperature increase, the markers describe wide P–T–t loops (Figure 6f’). The late heating stage at the Moho is similar in both experiments (up to 200 degrees), and the crustal material reached 800–900 °C at 5–10 kbar after the exhumation. The maximum exhumation rates for the rocks exhumed along the crust–mantle boundary (pink, blue, black markers) reach 2–4 cm/yr, with a maximum of 8 cm/yr for the red marker.
The main reason why the slab rollback prevailed in these experiments is the stagnation of the oceanic slab in the mantle transition zone (MTZ), which pulled the attached continental slab. We do not imply any viscosity jump between the upper and the lower mantle; the density structure of the slab plays the main role here. The increase in density due to the phase transitions of olivine to spinel structure and Mg-perovskite is prescribed in the model at 410 and 660 km, respectively. However, the second transition has a negative Clapeyron slope (∆P/∆T; [95]), which causes the slab stagnation. The slab–MTZ interaction is also sensitive to parameters such as the pushing velocity, age and thickness of plates, etc., which was numerically evaluated by Li et al. [86]. Thus, an old/cold slab and shallow dip angle produce favorable conditions for slab stagnation. That was the case in experiments R1 and R2, where the slab entered the MTZ soon after the beginning of subduction with a relatively shallow dip angle (Figure S1a,b,d,e in Supplementary Materials). If we apply a smaller pushing velocity (additional experiment R1A, similar to R1, Table 1), the slab heats and enters the MTZ 10 Myrs later with a larger dip angle (Figure S1h in Supplementary Materials). This results in the penetration of the slab through the MTZ, whereas the prolonged pushing causes clockwise bending of the slab and trench advance, and the return of the oceanic plate after the MTZ is an artifact in the experiment due to a free-slip lower boundary condition (Figure S1i in Supplementary Materials).
To test an effect of the ambient mantle temperature on the evolution of these experiments, we performed two additional experiments similar to R1 and R2 but with slightly higher mantle temperature: 1350 °C instead of 1300 °C (Table 1). In both cases, the temperature increase led to the change in the tectonic style from slab rollback in R1 and R2 to slab breakoff without later heating stage (Figure S2 in Supplementary Materials).

3.2. Slab Breakoff Experiments (B1, B2, and B3)

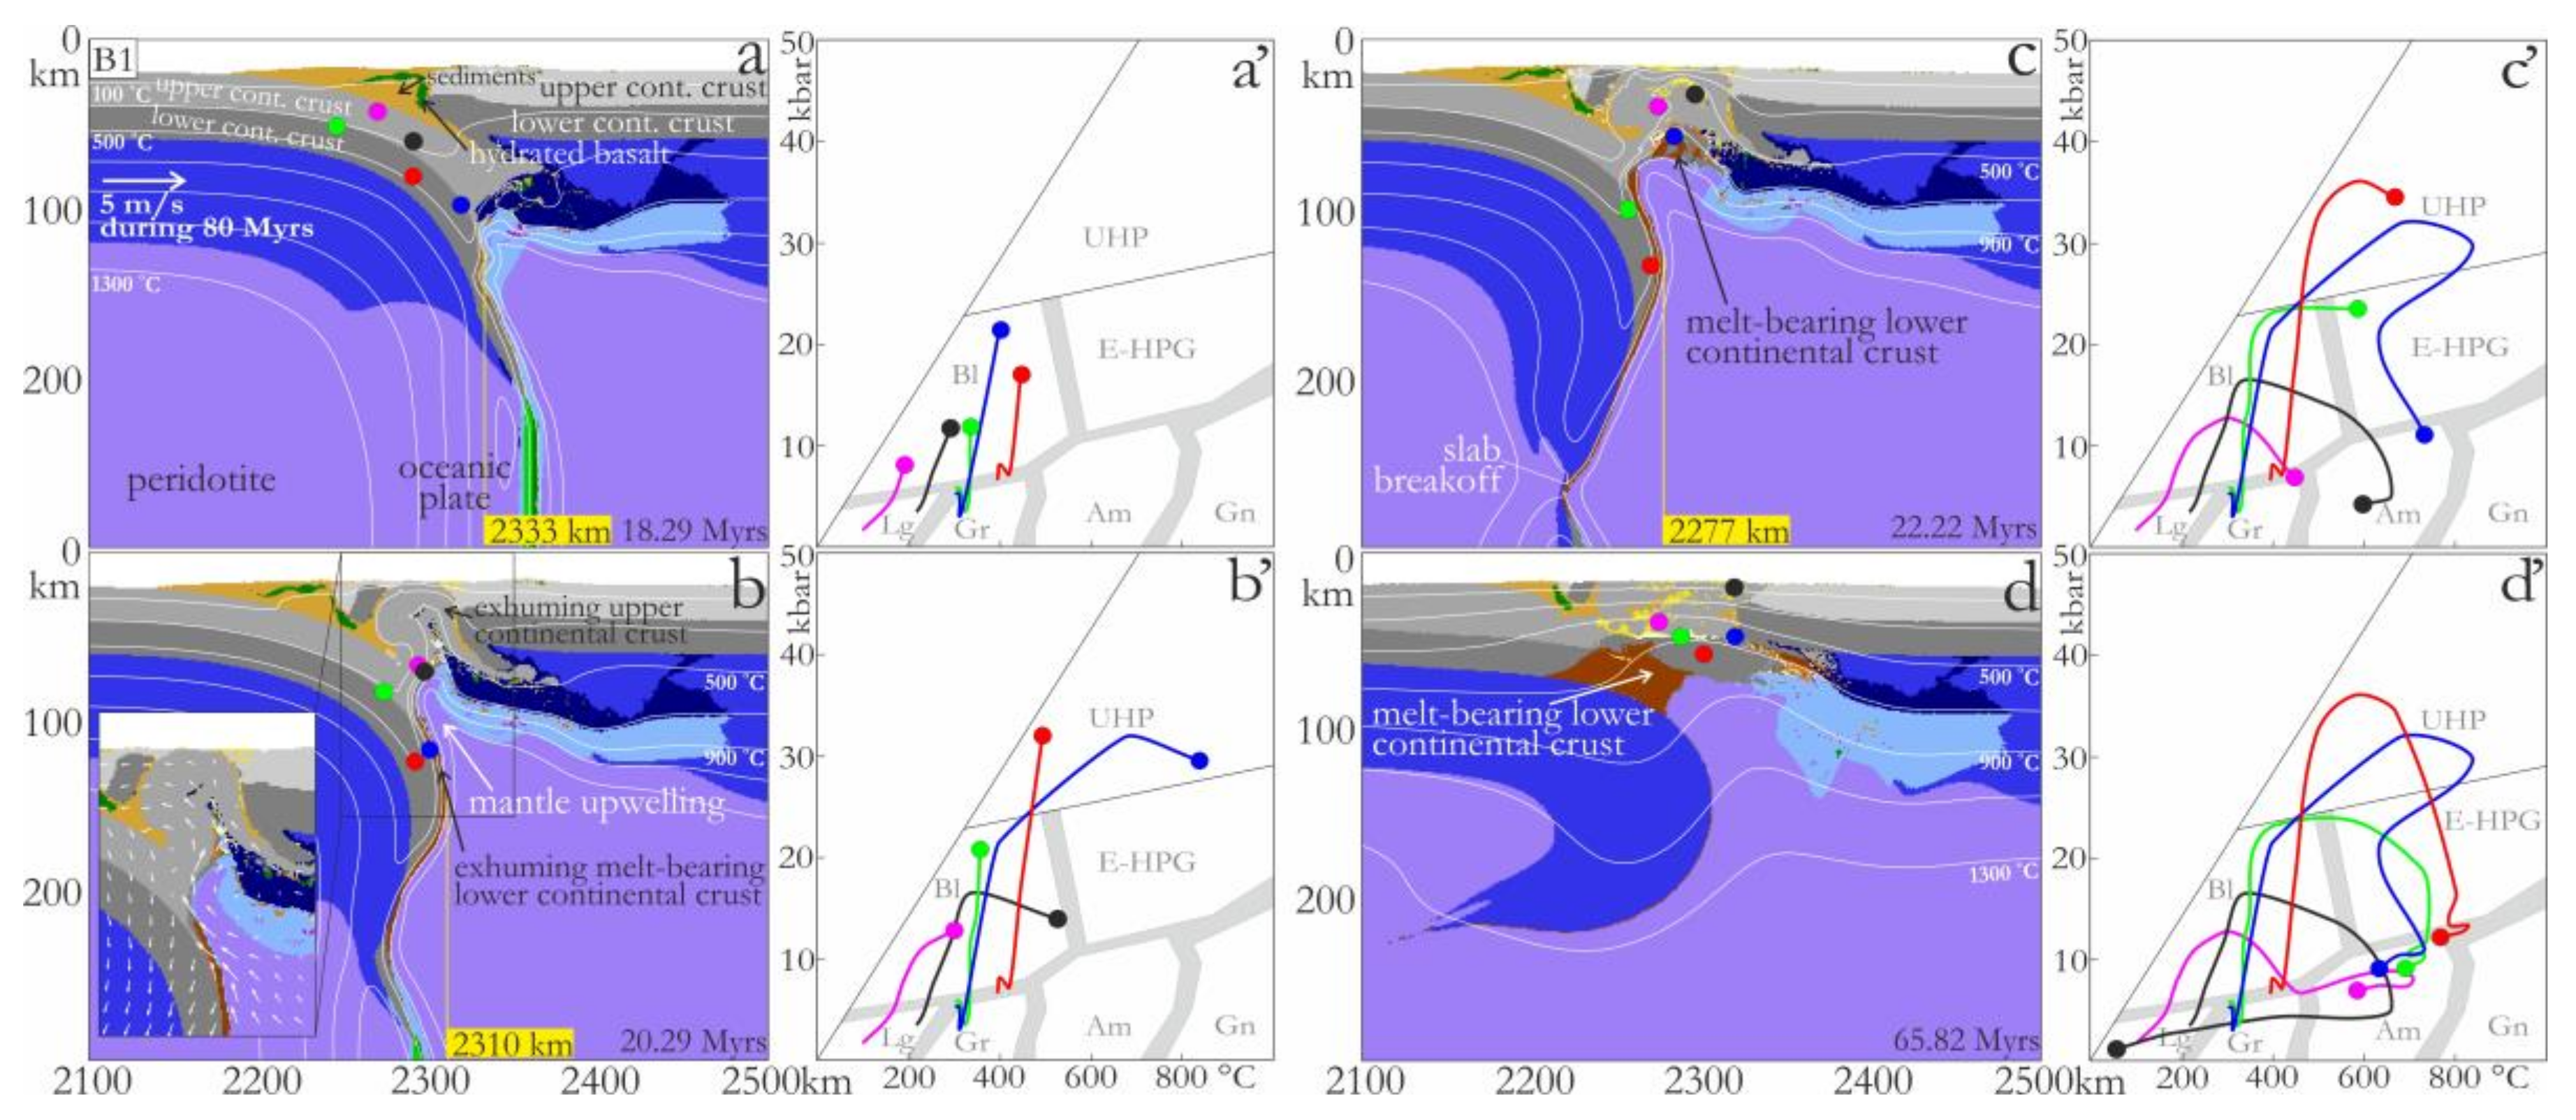
For a comparison of heating effects by slab rollback and slab breakoff, we present three experiments with slab breakoff occurring at different depths (Figure 8, Figure 9 and Figure 10): deep (B1), intermediate (B2), and shallow (B3) slab breakoff. The terms deep, intermediate, and shallow for the depth of slab breakoff do not correspond to previously defined possible types [70], but are used to distinguish them from each other. Slab breakoff can also occur at a shallower depth than presented in our experiments; however, very shallow slab breakoff does not account for initially deep subducted crustal material, which is important for a β-shape P–T–t path. The experiments were performed using the same model but had distinct initial setups (Table 1). In the experiment with a deep slab breakoff (B1), the continental collision started with a continental plate subduction, bringing the upper continental crust to a depth of 70–80 km and the lower crust to a depth of 100 km. After that, the slab started to bend, causing a mantle upwelling with a following exhumation of the subducted crustal material, as in experiments R1 and R2 (Figure 8a,b). This stage continued only for a couple million years until a slab breakoff occurred at a depth of 240 km (Figure 8c). Afterward, the slab bending stopped, the rest of the subducted lower crust continued to exhume to the Moho, and the asthenospheric mantle in the mantle wedge cooled down (Figure 8c,d). Thus, the small mantle upwelling in this case was initiated by the bending of the slab; it was not related to the slab breakoff, which occurred later. The exhumation mechanisms for the crustal material are the same as in the experiments with slab rollback. The markers from the upper crust exhumed to the middle-crustal depths undergoing either simultaneous heating by incorporation into magmatic rocks (black marker, Figure 8b,b’,c,c’) or later heating due to material redistribution during the thermal relaxation stage (pink marker, Figure 8 b–d,b’–d’). The markers from the lower crust exhumed to the Moho, where some of them underwent a slight later heating up to 100 degrees (blue, red, and green markers, Figure 8c,c’). The P–T–t loops of the markers are wide with occasionally β-shaped P–T–t paths (e.g., blue marker, Figure 8d’).
Additional tests with experiment B1 were conducted to check for the possible influence of the prolongation of the imposed velocity and the density of the lithospheric continental mantle on the evolution of the experiment (experiments B1A, B1B, and B1C, Table 1). A shortly imposed velocity to the left-hand continental plate (experiment B1A) caused a slightly shallower slab breakoff (around 180 km depth) and less partial melting of the subducted continental crust than in experiment B1 (Figure S3a–f in Supplementary Materials), whereas the style of the collision and crustal exhumation was the same. In the previously described experiments, the density contrast between the lithospheric continental mantle (depleted peridotite) and the asthenospheric mantle (peridotite) was 20 kg/m3. To test the effect of a more buoyant lithospheric mantle, we repeated these experiments with a higher density contrast (40 kg/m3, experiments B1B and B1C). Besides the slightly lower bending of the continental slabs, no significant changes in the evolution were observed (Figure S3g–l in Supplementary Materials).
In experiment B2, we examined an intermediate depth slab breakoff occurring at a depth of 150 km. In this case, the slab breakoff occurred earlier than in experiment B1, precluding an intensive mantle upwelling (Figure 9a,b). Whereas the slightly increased geotherms in the mantle close to the subducted lower crust might have been responsible for some heating during the decompression (e.g., green and blue markers, Figure 9c,c’), they can not cause any later heating of the crustal material at the Moho. For that reason, most of the P–T–t loops are tighter than in the previous experiments, and the markers do not record any β-shape P–T–t paths. The red marker located at the bottom of the subducted lower continental crust heated by 150 degrees at the later thermal relaxation stage due to rising geotherms (Figure 9d,d’).
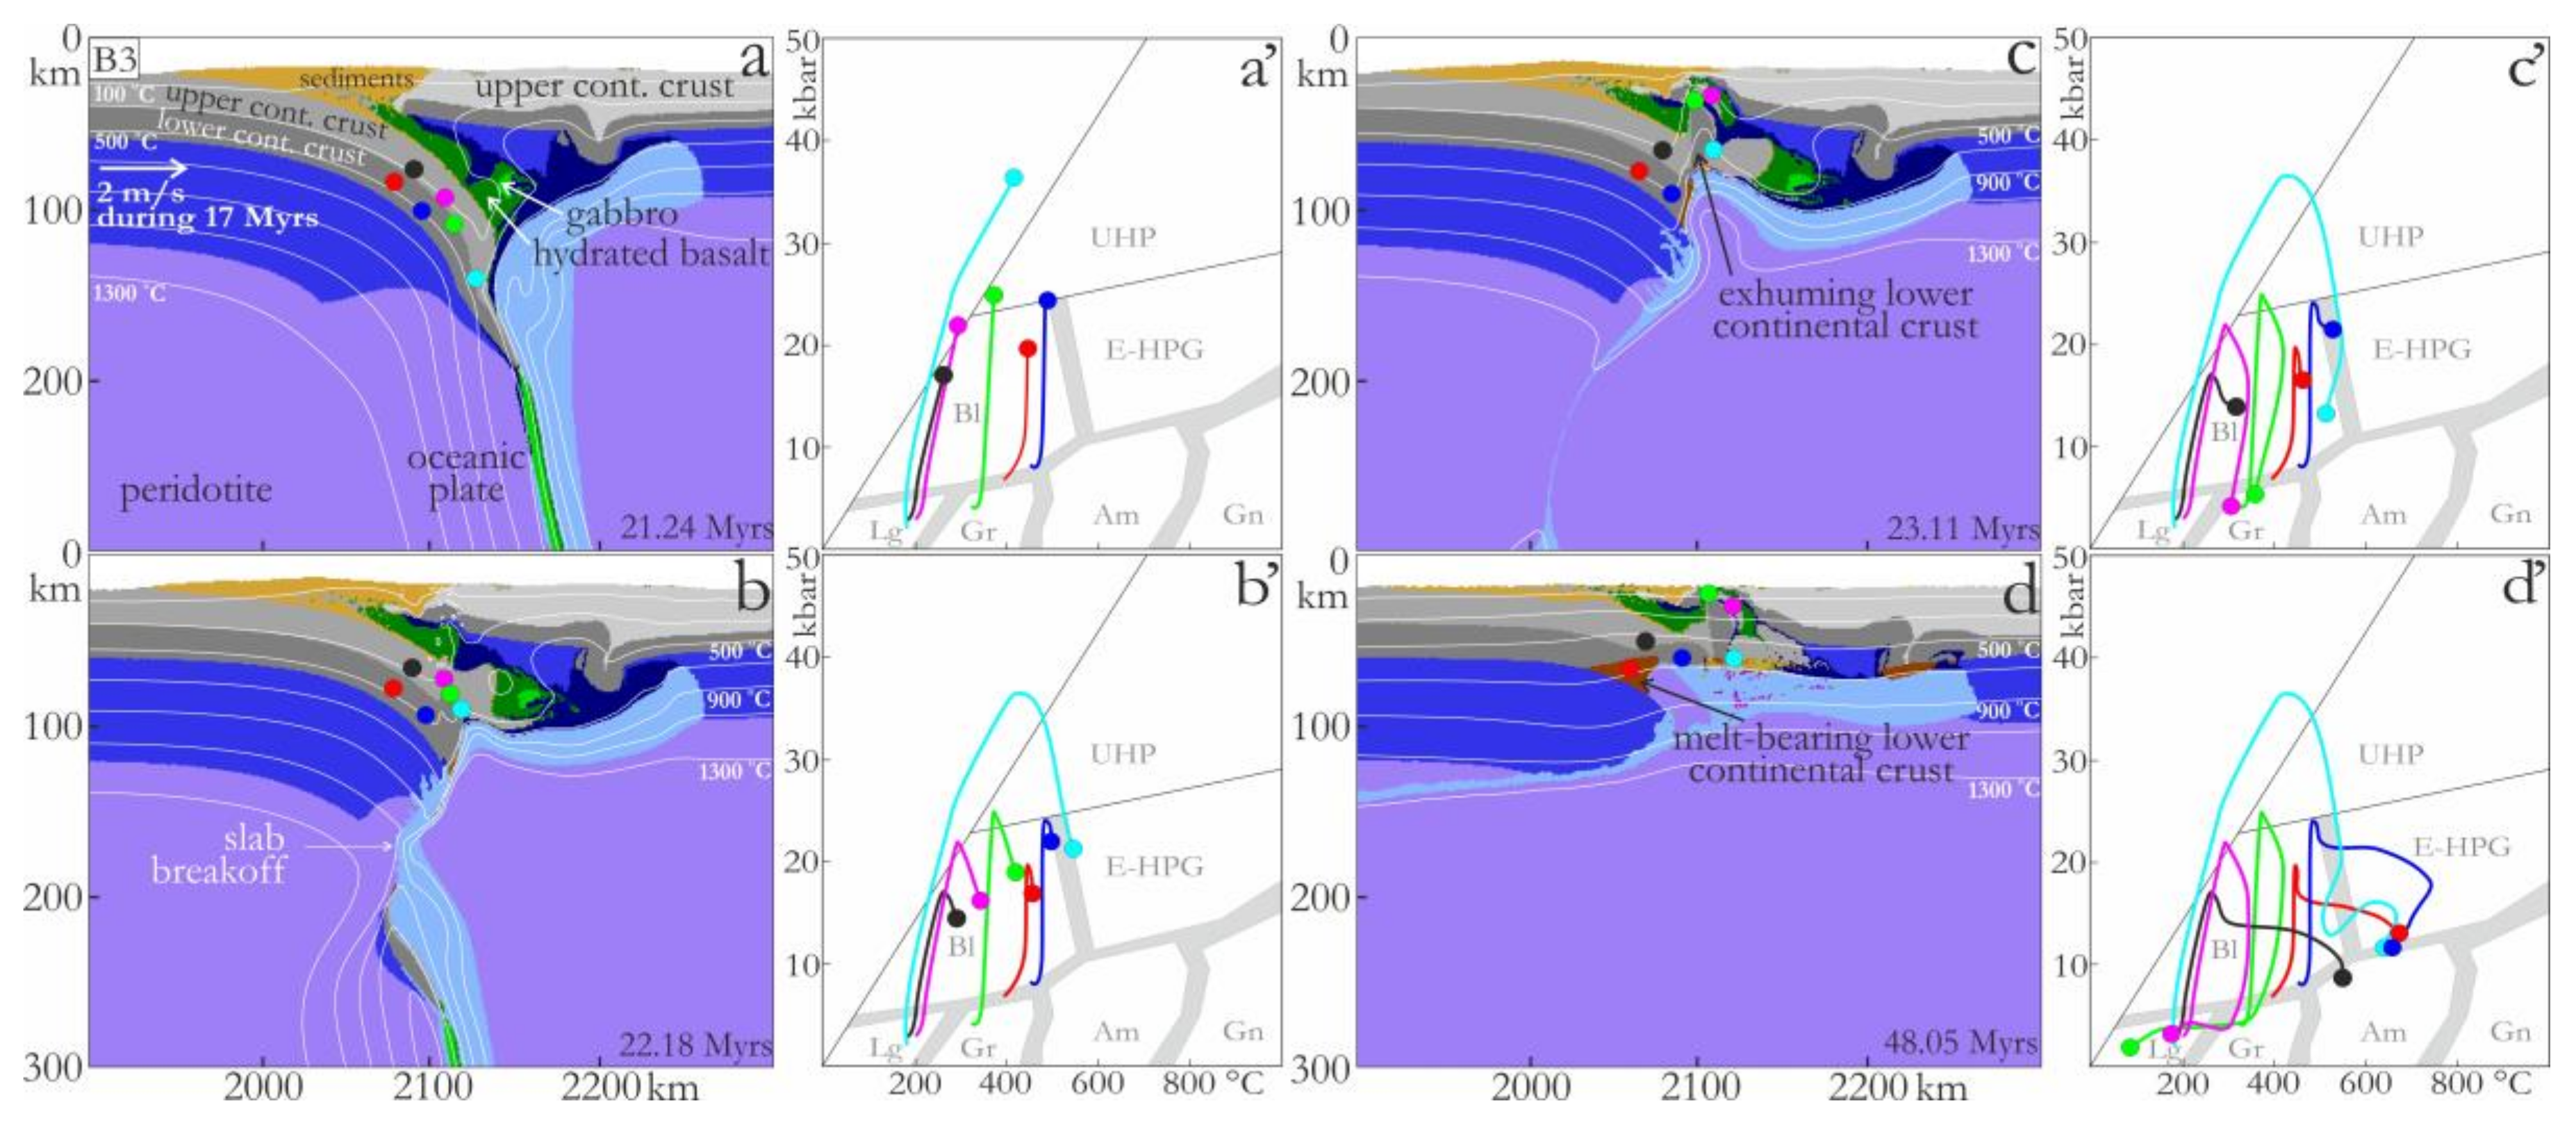
Experiment B3 simulated a scenario with a shallower slab breakoff. The continental crust was subducted to a depth of 160 km when a slab breakoff occurred within the continental margin at about 130 km depth (Figure 10a,b). At this stage, the subducted crust decoupled from the underlying lithospheric mantle and exhumed vertically toward the surface (Figure 10b,c). The hot mantle appeared after the slab breakoff below the subducted crust, and the crustal exhumation resulted in a small mantle upwelling following the exhuming crust (Figure 10b,c). This caused heating of the crustal markers located above (e.g., light blue marker) and on the side (e.g., blue and black markers) of the mantle upwelling (Figure 10c,c’,d,d’). The markers exhumed further above the mantle upwelling were not heated and are characterized by very tight loops (e.g., green and pink markers, Figure 10c,c’). The red marker was heated later during the relaxation stage (Figure 10d,d’). Since the subducted crustal material did not have enough time to be heated during the subduction stage, their later juxtaposition with the hot mantle resulted in intensive heating up to 300 degrees (black, blue, and light blue markers, Figure 10d’). A β-shape-like P–T–t path might have been preserved by the markers exhumed to the Moho before the mantle upwelling (e.g., light blue marker, Figure 10c,d’), similar to the slab rollback experiments. In this case, the mantle upwelling providing the heating of some crustal markers was not related to the slab breakoff, but rather to the decoupling and exhumation of the subducted crustal material.
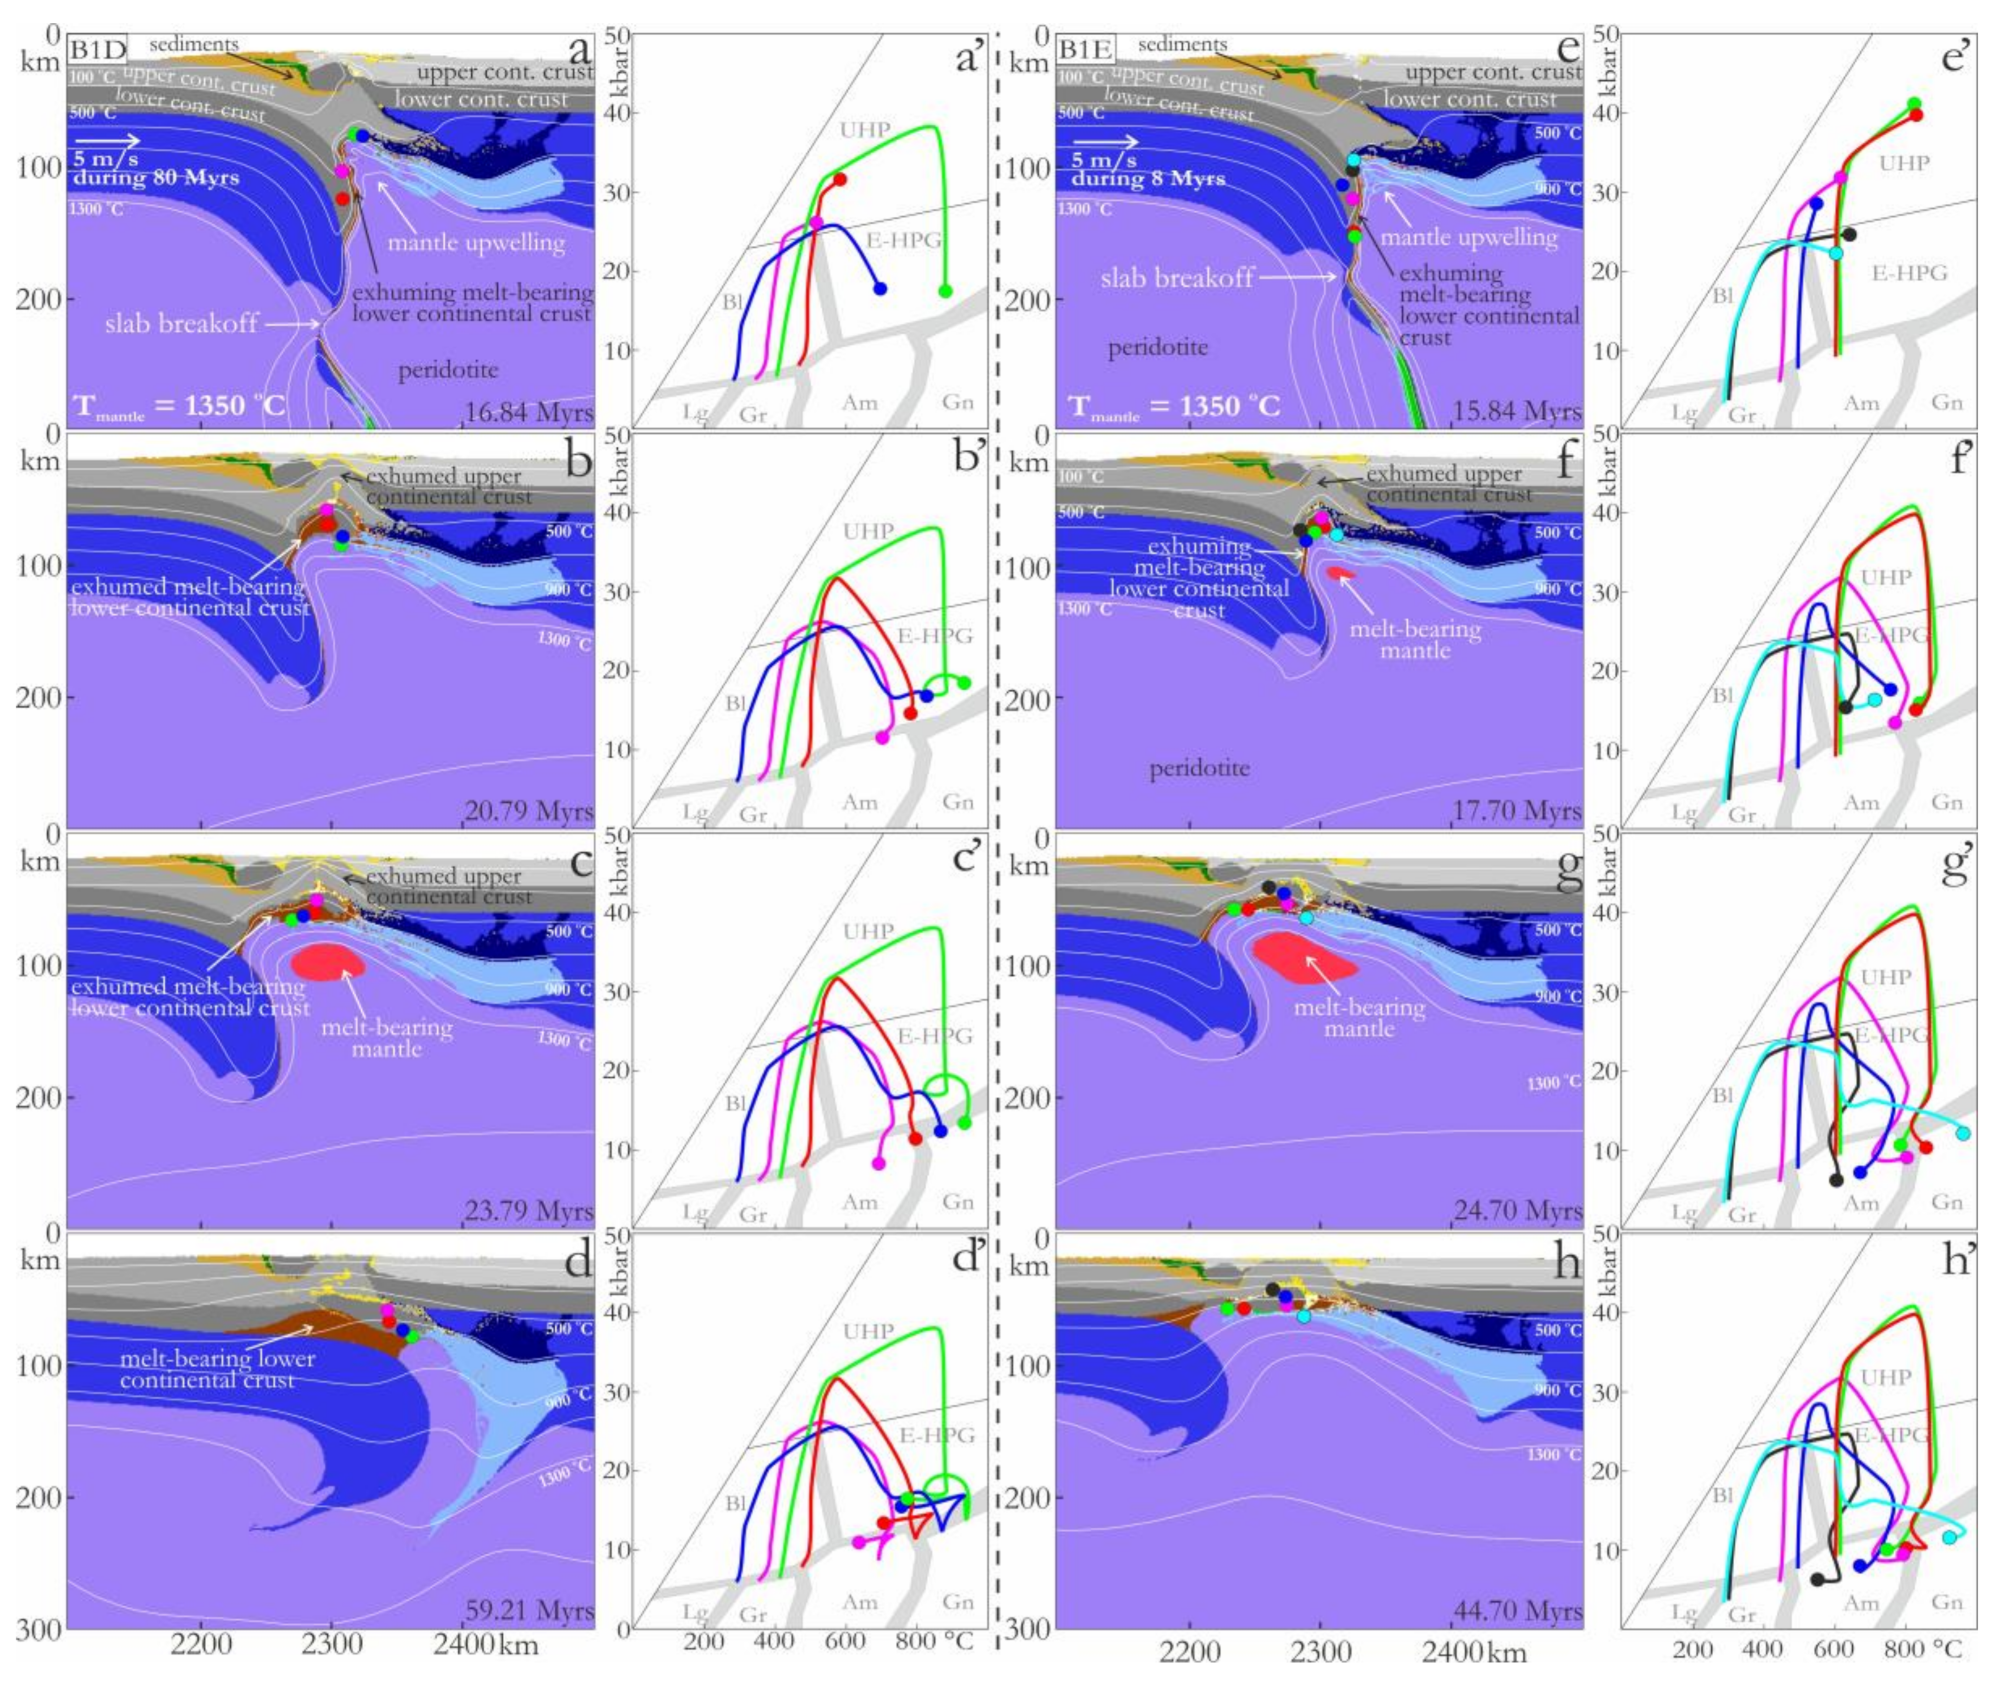
Thus, none of these scenarios led to any breakoff-related asthenospheric mantle upwelling, which could cause later heating of the exhumed metamorphic rocks. To check the influence of the ambient mantle temperature, we performed two additional experiments with a slightly higher mantle temperature (1350 °C instead of 1300 °C): experiment B1D, similar to experiment B1, and experiment B1E, similar to experiment B1D, but with a shortly applied pushing (Figure 11). A slab breakoff in these experiments occurred earlier and at shallower depths (170–200 km) than in experiment B1 (Figure 11a,e). After slab breakoff in experiment B1D, which occurred at 16.84 Myrs after the beginning of the experiment (Figure 11a), the collisional zone experienced a relaxation stage during 4 Myrs with gentle cooling (Figure 11b). Due to the redistribution of the exhumed crustal material at the Moho, some markers were characterized by a slight heating up to 100 degrees at 15–20 kbar (e.g., blue and green markers, Figure 11b’). After that, another pulse of mantle upwelling occurred at the same location, which was accompanied by mantle decompression melting (Figure 11c), and spread toward the subducted plate, pushing it slightly to the left, i.e., causing slab rollback (Figure 11c). The second pulse of mantle upwelling in this experiment was related to the deep mantle flows due to the stagnation of the oceanic slab at the model lower boundary, and thus should not be considered as a consequence of the slab breakoff. In contrast with experiments B1 and B1D where the exhumation of the upper crust followed by the mantle upwelling started before slab breakoff (Figure 8b and Figure 11a), in experiment B1E they occurred simultaneously (Figure 11e). The evolution of experiment B1E is similar to that of B3 (with shallow slab breakoff). In both experiments, the early occurring slab breakoff prevented spreading of the mantle upwelling along the subducted lower crust. Instead, the decoupling and exhuming crustal material created the space for the mantle upwelling below (Figure 10c and Figure 11f). In experiment B1E, that resulted in partial melting of the mantle and continental slab rollback (Figure 11f–h). The effect of the hot mantle appearing below the exhumed crust is similar to the previous experiments. The exhumed material experienced later heating at 5–15 kbar up to 100 degrees (Figure 11g,g’), and in the extreme case, when the crustal material appeared to be surrounded by the hot mantle due to the material redistribution at the Moho, the heating reached 300 degrees, e.g., the light blue marker in Figure 11g’. The exhumation rates of the crustal material reached 8 cm/yr in this experiment. Thus, whereas in R1 and R2 slab rollback led to mantle upwelling, in this experiment, the opposite was observed: a slight slab rollback was caused by the spreading of a partial melting zone of the mantle upwelling caused by the decoupling and exhumation of the subducted crust.

4. Discussion

The goal of geodynamical numerical modeling is not only to check the existing geophysical models but also to provide new ideas, which should be further evaluated by geologists. Strict conformity with the natural data with numerical experiments is not required; instead, distinct stages of metamorphism derived from natural samples should be attempted to be correlated with tectonic conditions from experiments. The described above 2D geodynamical numerical experiments were applied to continental collision, where already exhumed (ultra)high pressure rocks were subsequently heated to high temperature. Since several parameter studies for styles of continental collision and slab breakoff have been performed, e.g., [55,70,73,83,96], we focused here on the evaluation of some existing models in terms of ability for the heating of certain crustal portions following an exhumation stage. The presented experiments show the main tendencies of the development and dynamics of slab rollback and slab breakoff scenarios. Based on our results, we propose that both scenarios are favorable for producing β-shape P–T–t paths occasionally observed in the metamorphic rocks from some collisional orogens. However, the late heating in the experiments with slab breakoff was not related to the slab breakoff but could be caused either by slab bending before slab breakoff or crustal decoupling and exhumation after breakoff.
The first metamorphic stage in the experimental β-shape P–T–t paths represents subduction of continental crust. By subduction of the continental plate in the experiments, some crustal rocks reached pressures over 45 kbar (e.g., Figure 6a’). After that stage, some rocks showed almost isothermal decompression (e.g., red marker in Figure 4f’, blue marker in Figure 6e’), whereas others cooled down during the exhumation (e.g., blue and green markers in Figure 4f’, red, green, and pink markers in Figure 6f’). After exhumation, some rocks, both in the slab rollback and slab breakoff experiments, underwent intensive heating of up to 200 degrees at pressures varying from 5 to 15 kbar (green and blue markers in Figure 5a, markers in Figure 7, blue marker in Figure 8d’, black, pink, and red markers in Figure 11f’, light blue marker in Figure 10d’). The main mechanism for this later heating phase is asthenospheric upwelling, which is caused either by slab bending, crustal exhumation paired with slab breakoff or is more vigorous via long-lived slab rollback. Collision experiments with syn-collisional slab retreat were presented by Ueda et al. [97] where the process was called syn-collisional mantle delamination; later, Magni et al. [98] also presented experiments that demonstrated delamination versus breakoff models during continental collision. Focusing on the fate of continental lithosphere during collision in general, the authors did not analyze the models in terms of the metamorphism of crustal rocks.
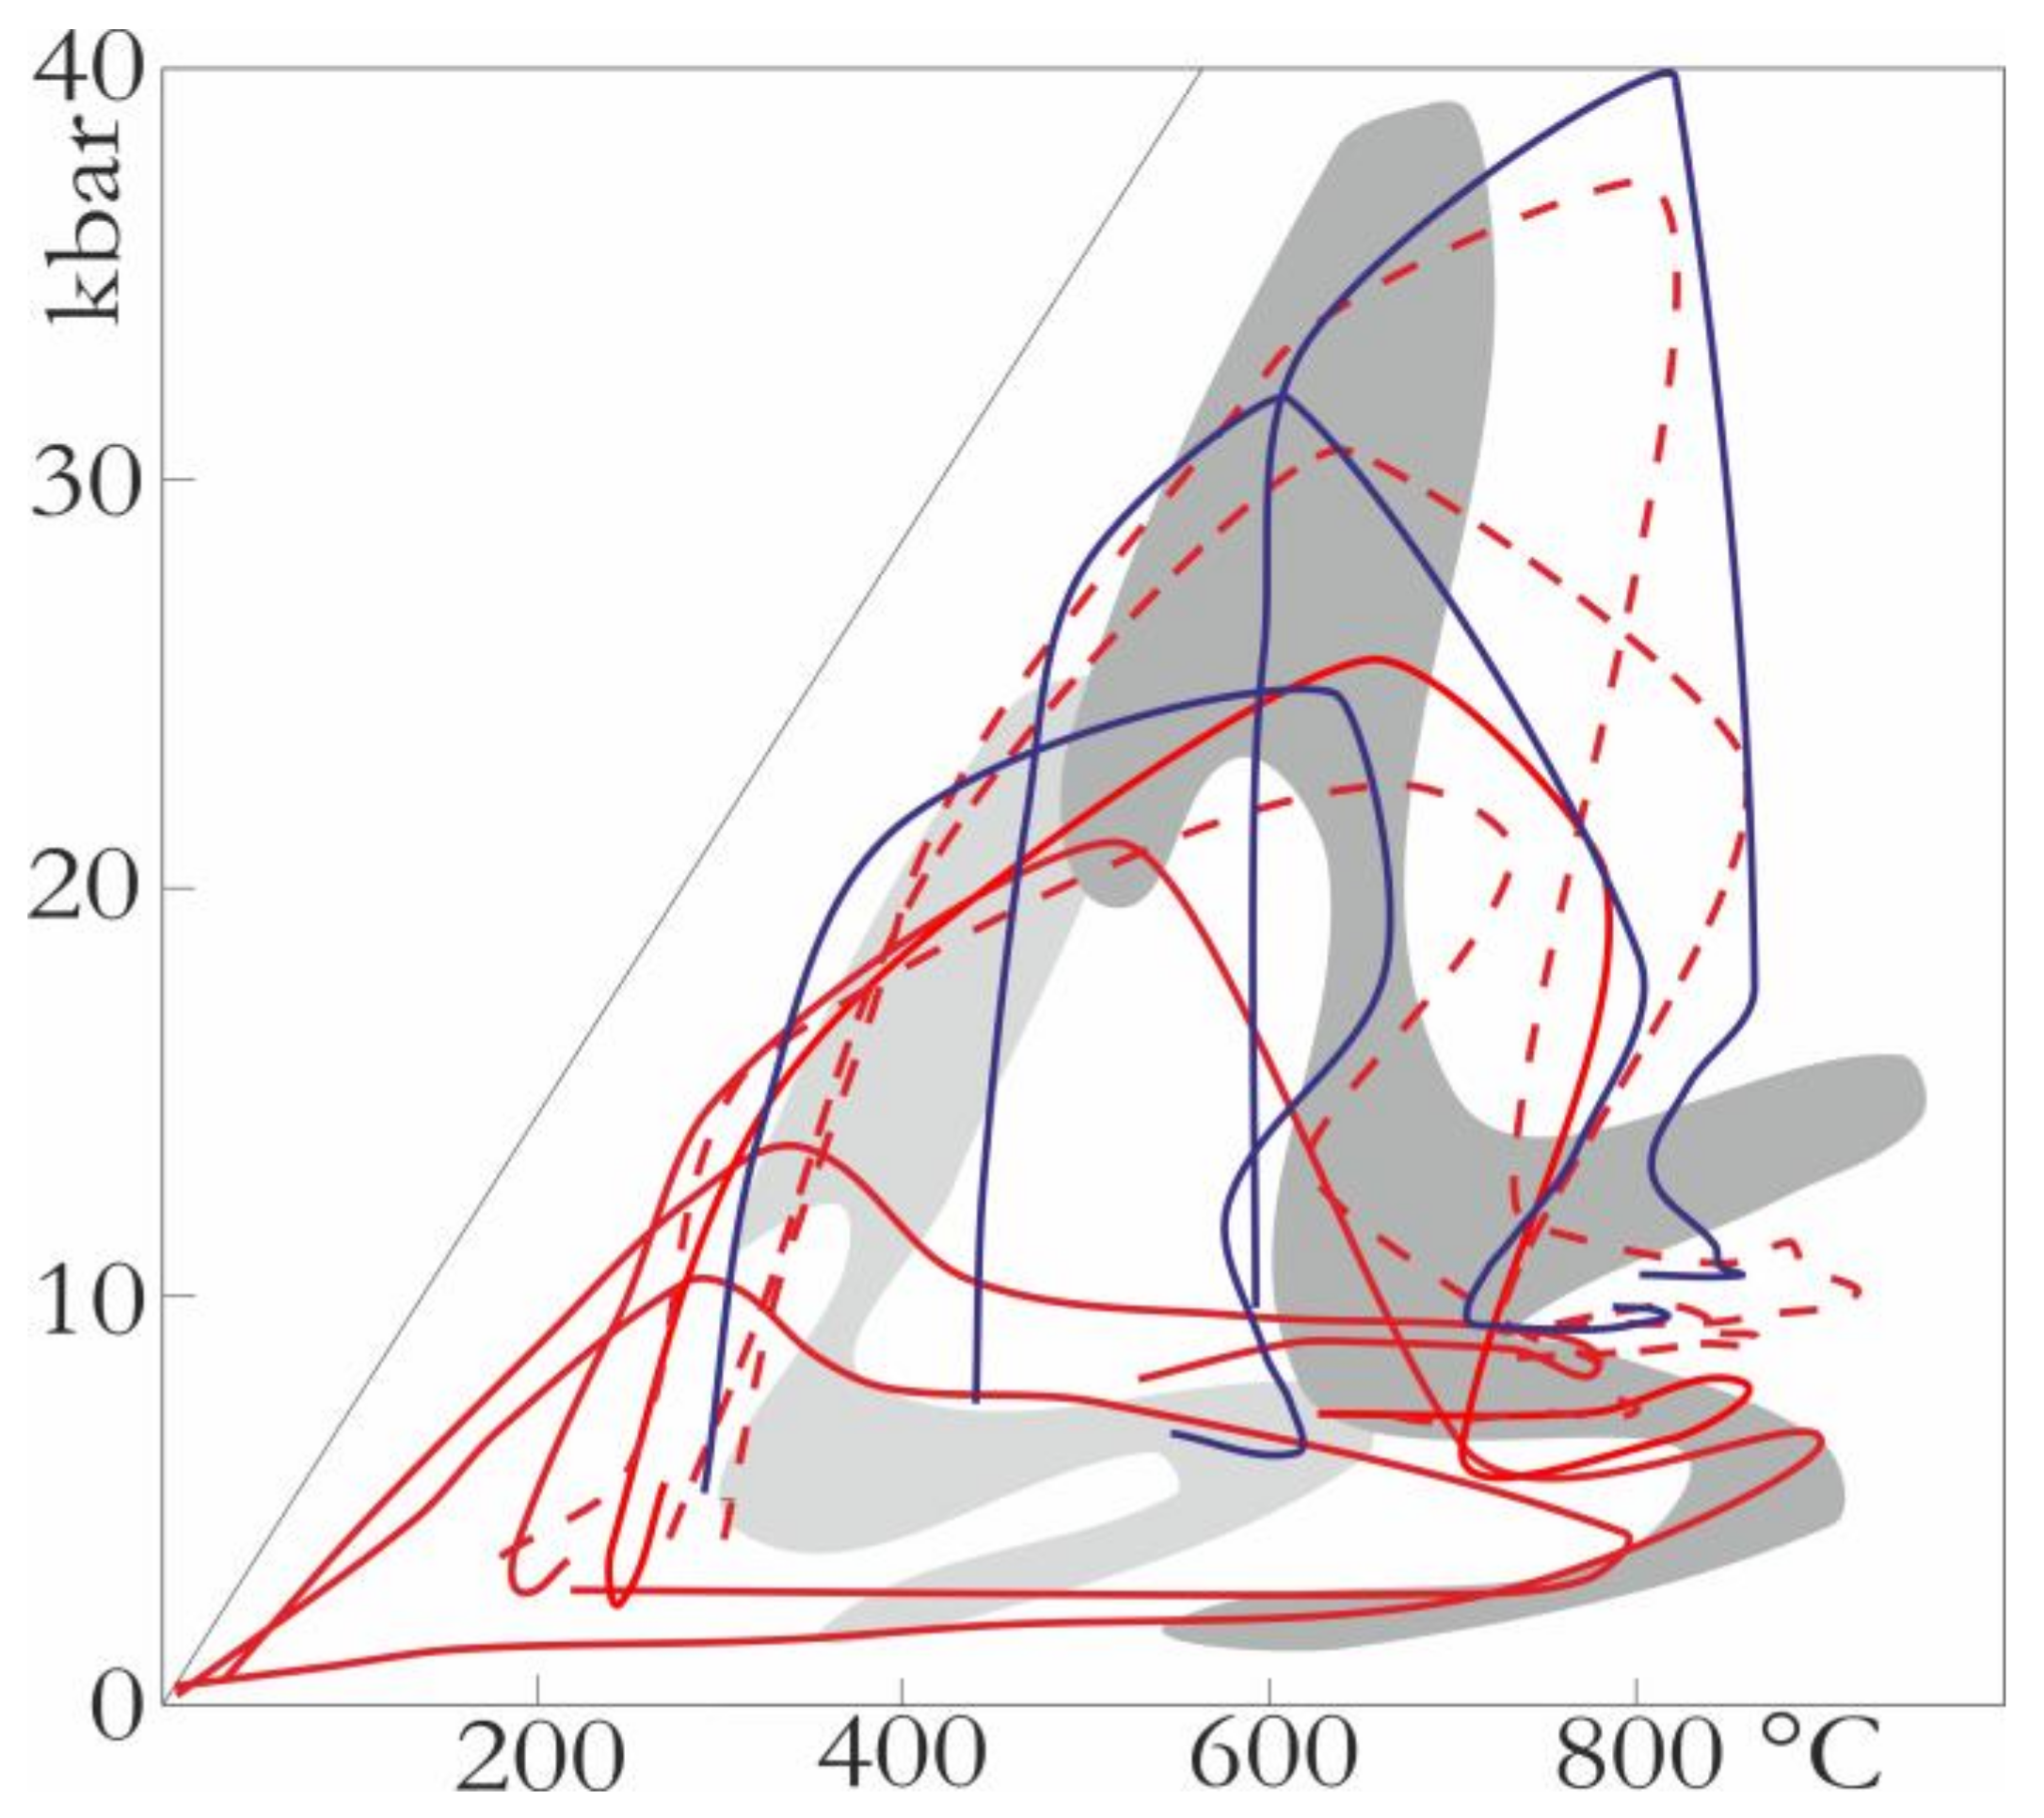
We compared the β-shape P–T–t paths from the slab rollback experiments (red lines) and experiment B1E (blue lines) with the end-member natural examples from Figure 1 (Figure 12). Although the experimental paths cover almost all the metamorphic peaks determined in natural rocks, the main difference is the shape of the paths. Whereas the P–T–t paths predicted for natural rocks have narrow loops for the first stage of metamorphism, the experimental paths are characterized by wider loops with higher thermal gradients (dT/dP). The reason for the wide loops of the markers in the experiments is the juxtaposition of the chosen markers with the hot asthenospheric mantle at the time the rocks start to exhume. Thus, the shape of a P–T–t loop depends on the specific path that a rock takes during exhumation. The accuracy of the P–T–t paths from the natural examples is relatively poor due to a lack of data and the petrological complexity of the rocks. Despite some peak metamorphic parameters, a similarity exists in the form of some experimental paths with those predicted for the rocks in the Bohemian Massif, which first show ultrahigh pressure metamorphism at 600–700 °C and then, after the exhumation to the crustal levels and simultaneous cooling, the second stage of (ultra)high temperature metamorphism at 13–15 kbar (dark grey field, the red dashed lines, and the red solid line with the largest peak pressure, Figure 12). The later heating stage is usually interpreted as the result of mantle upwelling, which is caused either by slab breakoff or mantle delamination [29,31,99]. Our experiments showed that the mantle upwelling that is responsible for the late heating of crustal rocks could be explained either by slab rollback, slab bending, or crustal rocks exhumation paired with slab breakoff.
The P–T–t path from the Kaghan Valley in the Himalaya (Figure 1c, KV-path) is rather similar to the paths from the Bohemian Massif but shows a less intensive heating stage after exhumation. The experimental P–T–t path closest to the KV-path is shown by the light green marker in slab rollback experiment R2 (Figure 7), although the temperatures are 100 degrees higher in the experiment. The metamorphic evolution of the rocks from the Shuanghe locality in the eastern Dabie UHP belt (Figure 1c, DM-path), showing isothermal decompression with later heating during ongoing exhumation, has more similarities with the red marker from slab breakoff experiment B1 (Figure 8). In this case, the marker heats due to juxtaposition to the hot asthenosphere during exhumation. A similar trend but with lower pressures show also some markers from experiment R2 (e.g., blue marker, Figure 6f’). The P–T–t paths of the Lepontine Dome in the Central Alps and the southern Sivrihisar Massif in Turkey, which are shown together by the middle-grey color field in Figure 12, have a similar shape compared with the paths from the Bohemian Massif, but the metamorphic peaks are lower both in pressure and temperature and were not covered by the evaluated experimental P–T–t paths. Although the paths from the slab rollback experiments do not perfectly match the natural fields, they almost cover both metamorphic peaks and repeat, in some cases, the β-shape.
The heat resulting from the mantle upwelling in the experiments led to partial melting of the exhuming continental crust, producing rhyolitic melts (e.g., Figure 3 and Figure 6). During prolonged slab rollback, the age of magmatic activity should decrease toward the trench following its retreating. This factor might be considered as one of the markers for slab rollback. A possible example of this could be the Moldanubian zone of the Bohemian Massif. Although disagreements exist about the initial orientation of subduction responsible for the formation of the Moldanubian zone, either from the west [100], or from the southeast to the northwest, e.g., from the Moldanubian side (beneath the Teplá–Barrandian block, [14,26,101]), if the second case is assumed, there is an intriguing rough magmatic rocks age decrease from the northwest to the southeast, which is in the opposite direction of the subduction e.g., [99,102,103,104]. The magmatism in the Moldanubian zone started with the calc-alkaline rocks, and then some mixed melts from mantle and crust, where later granitic rocks prevailed. Since we did not have a prolonged period of subduction in our experiments, we are missing possible slab and mantle wedge melting, although the hydrated mantle might have locally undergone partial melting during collision (Figure 8 and Figure 9).
The idea of slab rollback as an exhumation-supporting mechanism was previously proposed by Cloos et al. [105] and Hacker [106], which was later successfully applied to the exhumation of high-pressure metamorphic rocks in the Mediterranean [107,108]. In that case, the slab rollback occurred during ongoing oceanic subduction with small continental blocks. The created space and asthenospheric upwelling facilitated the exhumation of the deeply subducted continental slivers back to the crustal depths. The exhumed crustal slivers underwent a thermal overprint, which was explained by the authors by their position just on top of the upwelling asthenosphere. A high-temperature event was also documented for the rocks on Naxos and Paros islands. The rocks after high-pressure metamorphic overprint cooled during exhumation and afterward underwent re-heating with a temperature increase of up to 300 °C [109].
The idea of slab rollback for the Mediterranean realm was proven by Tirel et al. through a numerical experiment of oceanic subduction with two continental blocks [108]. The experiment confirmed both effects of the slab rollback: easier exhumation of (ultra)high pressure metamorphic rocks and their later heating by the hot asthenosphere. The first effect was also mentioned by Duretz et al. [70] in an experiment of deep slab breakoff, where they detected slab retreat triggering buoyant crustal flow (Figure 15 in Duretz et al. [70]), but they did not study it in detail. Both effects are clearly demonstrated in our R1 and R2 experiments, and to some extent in B1, where the slab rollback/bending occurred during ongoing continental plate subduction. Besides intensive later heating, we also report high exhumation rates up to 8 cm/yr of the crustal material from the (ultra)high pressure conditions in the experiments with slab rollback. Similar high exhumation rates have the crustal rocks in experiment B1E with a slab breakoff, which is where a later slab rollback occurred. In the other experiments with slab breakoff, exhumation rates reached a maximum of 4–5 cm/yr. Thus, the effects of slab retreat (rollback) with mantle upwelling are similar for all the experiments, regardless of what they dealt with: oceanic subduction with continental blocks, continental collision with slab breakoff, or with simultaneous slab rollback. Only the scale might be different. Indeed, the effect should be less intensive in slab breakoff experiments, where slab breakoff usually prevents prolonged slab retreat (e.g., experiment B1 and the experiment reported by Duretz et al. [70]). The intensive heating and high exhumation rates occurred in the experiments with prolonged slab rollback (e.g., experiment R2 and the experiment reported by Tirel et al. [108]). It is worth mentioning that during the prolonged slab rollback, intensive extension occurs, which thins the crust; thus, the exhumed rocks stay at the Moho, which is shallow in this case. The pressures during the heating stage are below 10 kbar (e.g., experiment R2 and the experiment reported by Tirel et al. [108]). If the crust is not stretched as much as in experiment R2, the pressures during the heating stage could be higher: over 10 kbar (Figure 4f’).
The prolongation of heating is an important parameter for the preservation of β-shape P–T–t paths in rocks. To be preserved, heating needs to be short-lived. The prolongation of tens of millions of years would most probably erase all previous signatures. The mantle upwelling in the experiments creates the conditions of intensive and rapid heating after the exhumation. In the experiments with slab rollback (R1, R2), the exhumed rocks could be heated by up to 100–200 degrees within 2–8 Myrs (Figure 5 and Figure 7). After the rocks reach the maximum temperatures, they should be isolated from the area; thus, they should be further exhumed. That could be done by a change from extension to contraction in tectonic evolution, for example. Since we did not include this in our model, most of the markers that experienced heating remain at the same depth, with some exceptions where the markers are incorporated into the uprising magmatic complexes (e.g., the pink and black markers in Figure 5 and the light blue marker in Figure 7).
Several natural examples with β-shape P–T–t paths, recording later heating stages and discussed in the introduction, occur in different orogenic complexes among other rocks with simple P–T–t paths. Such juxtaposition is usually explained by the non-uniform percolation of fluids during metamorphism and different exhumation rates [2]. Although this could also be related to the difficulty of recognizing the minerals and textures recording these stages, in our experiments, such juxtaposition is related to the accumulation and redistribution of the rocks with distinct evolution paths above the hot mantle. If the rocks appear at the contact with the rising hot mantle during the exhumation, they undergo heating already at depth, keeping the temperature constant (e.g., the red marker in Figure 4f’ and the blue marker in Figure 6f’). For the rocks that moved further from the mantle wedge crossing the geotherms and then reaching the bottom of the crust above the mantle upwelling, we observed two distinct stages in the β-shape P–T–t paths (e.g., the blue and green markers in Figure 4f’; the green, red, pink, and black markers in Figure 6f’).
In the presented experiments with slab breakoff, we did not observe any mantle upwellings directly related to slab breakoff or subsequent overriding lithospheric melting, which was considered to be a result of slab breakoff [69,110]. Although a further exploration of possible slab breakoff scenarios should be completed, based on the performed set of the experiments, we rather agree with Freeburn et al. [74] and Niu [78], who argued about the possible overestimation of the magmatic effect of slab breakoff in orogens. The numerical experiments reported by Duretz et al. [70] also showed that a slab breakoff may lead to asthenospheric mantle upwelling from the side of the subducting continental plate only if slab breakoff is shallow and occurs immediately after the continental plates collide with each other (Figure 3 in [70]). Unfortunately, in this case, no deeply subducted and exhumed continental crust is expected.

5. Conclusions

The results of our 2D petrological–thermomechanical numerical experiments demonstrated that slab rollback during ongoing continental subduction can be considered as a mechanism responsible for the effective extraction of ultrahigh pressure metamorphic rocks and their later heating. The style of the crustal extraction is vertical extrusion. After the rocks exhume to the lower-crustal depths, they may be conductively heated by up to 200 degrees by the underlying hot asthenospheric mantle. We also numerically compared the slab rollback scenario with the classical slab breakoff scenario. Although in both scenarios we identified mantle upwelling, the reason for that in the experiments with slab breakoff is either slab bending occurring before slab breakoff or post-breakoff buoyant exhumation of deeply subducted crust, but not slab breakoff. Independent of the origin, mantle upwelling had a similar effect in all the experiments and led to the heating of juxtaposed exhumed crustal material at the Moho, producing, in some cases, β-shaped P–T–t paths. Within a few million years, the exhumed crustal material could be heated by hundreds of degrees and occasionally exhumed to the surface. Most of the numerically produced P–T–t paths are wider than the β-shape paths predicted from the natural orogens but show a similar shape and cover most of the metamorphic peaks. The location of the mantle upwelling directly below the orogen weakens the orogen and allows its intensive late- and post-orogenic internal deformation.

Supplementary Materials

The following are available online at https://www.mdpi.com/2076-3263/9/12/499/s1, Figure S1: Comparison of the deep evolution of experiments R1, R2, and an additional experiment R1A (similar to the experiment R1, but with slower pushing velocity of 2 cm/yr; see Table 1 and text for details) shown with the effective viscosity snapshots. Colors represent the magnitude of effective viscosity (see the left color bar at the bottom). Snapshots b’, e’, and h’ are the density snapshots of the rectangular outlined areas from the snapshots b, e, and h, correspondingly. Colors represent the magnitude of density (see the right color bar at the bottom); Figure S2: The time-slice snapshots of the experiments to show the comparison of experiment R1 with experiments R1B and R2A. Experiments R1B and R2A are similar to experiments R1 and R2, respectively, but with the 50 degrees hotter ambient mantle temperature (see Table 1). The increase of the temperature leads in both cases to a slab breakoff scenario without a slab rollback; Figure S3. The time-slice snapshots of the experiments to show the comparison of experiment B1 with experiments B1A, B1B, and B1C. Experiment B1A is similar to experiment B1, but with a short time of pushing (8 Myrs from the beginning of the experiment). Experiments B1B and B1C are similar to experiments B1 and B1A, respectively, but with the lower density contrast between the continental lithospheric mantle and the underlying asthenospheric mantle (40 cm/m3 instead of 20 cm/m3).

Author Contributions

Conceptualization, E.S., C.H., H.F., S.W.F.; Methodology, E.S., T.G.; Software, T.G.; Writing, E.S., C.H., H.F., S.W.F., and T.G.; Visualization, E.S.; Supervision, C.H.; Project administration, E.S.; Funding acquisition, E.S.

Funding

This research was funded by Austrian Science Fund (FWF, Hertha Firnberg Program, project number T832 (E.S.)), by an SNF-grant 200021_182069 (T.G.), and by Czech Science Foundation-18-03160S (S.W.F.). Simulations were performed on the ETH-Zurich Brutus cluster.

Acknowledgments

Open Access Funding by the Austrian Science Fund (FWF).

Conflicts of Interest

The authors declare no conflict of interest.

Appendix A

Table A1. Properties of the materials used in the experiments. * for all types of rocks: Cp = 1000 J kg−1, α = 3*10−5 K−1, β = 1*10−3 MPa−1.
Material*ρ0
[kg m3](solid)
k [W (m*K)−1]Rheology/
Flow Law
Tsolidus [K]Tliquidus [K]Hr
[μW m−3]
HL
[kJ kg−1]
E
[kJ mol−1]
nAD
[Mpa-II*s−1]
V
[J (MPa·mol)−1]
Cohesion
[MPa]
sin
(φdry)
Sedimentary and felsic upper,
lower crust and rhyolite
sediments:2600
felsic crust: 2700/2800
[ 0.64 + 807 ( T + 77 ) ] × exp ( 0.00004 P M P a ) Wet quartziteat P<1
889 + 17900 ( P + 54 ) + 20200 ( P + 54 ) 2
at P>1200 Mpa
831 + 0.06 P
1262 + 0.009 P 2
Felsic crust:1
3001542.310-3.50100.15
Melt-bearing sediments,
felsic crust and rhyolite
2400
(lower crust 2600)
-//--//--//--//--//--//-01-//--//-10
Hydrated basalts3000 [ 1.18 + 474 ( T + 77 ) ] × exp ( 0.00004 P M P a ) Wet quartziteat P<1600 MPa
973 70400 ( P + 354 ) + 77800000 ( P + 354 ) 2
at P>1600 Mpa
935 + 0.0035 P + 0.0000062 P 2
1423 + 0.105 P 0.253801542.310-3.50100.1
Melt-bearing basalts2900-//--//--//--//--//--//-01-//--//-10
Gabbro 3000-//-Plagioclase
An75
-//--//-0.253802383.210-3.50100.6
Melt-bearing gabbro3000-//-Wet quartzite-//--//--//--//-01-//--//-10
Lithosphere-
asthenosphere
mantle
3280/3300 [ 0.73 + 1293 ( T = 77 ) ] × exp ( 0.00004 P M P a ) Dry olivine 1394 + 0.133 P M P a 0.0000051 P 2 M P a 2073 + 0.114 P 0.022-5323.5104.48100.6
Hydrated mantle/
serpentinized mantle
3300/
3200
-//-Wet olivineHydrated mantle:
at P<1600 Mpa:
973 + 70400 ( P + 354 ) + 77800000 ( P + 354 ) 2
at P>1600 Mpa:
935 + 0.0035 P + 0.0000062 P 2
Hydrated mantle: 2073 + 0.114 P 0.022Hydrated
mantle:300
4704103.3-//-100.1
Dry/wet melt-bearing mantle3300/2900-//-Dry/wet olivine-//--//--//--01104.4-//-10
Reference[81,111][112][113][90][90][83][81,111][113][113][113][81,113]

References

  1. Penniston-Dorland, S.C.; Kohn, M.J.; Manning, C.E. The global range of subduction zone thermal structures from exhumed blueschists and eclogites: rocks are hotter than models. Earth Planet Sci. Lett. 2015, 428, 243–254. [Google Scholar] [CrossRef]
  2. Kurz, W.; Handler, R.; Bertoldi, C. Tracing the exhumation of the Eclogite Zone (Tauern Window, Eastern Alps) by 40Ar/39Ar dating of white mica in eclogites. Swiss J. Geosci 2008, 101, 191–206. [Google Scholar] [CrossRef]
  3. Perraki, M.; Faryad, S.W. First finding of microdiamond, coesite and other UHP phases in felsic granulites in the Moldanubian Zone: Implications for deep subduction and a revised geodynamic model for Variscan Orogeny in the Bohemian Massif. Lithos 2014, 203–203, 157–166. [Google Scholar] [CrossRef]
  4. Whitney, D.L.; Teyssier, C.; Toraman, E.; Seaton, N.C.A.; Fayon, A.K. Metamorphic and tectonic evolution of a structurally continuous blueschist-to-Barrovian terrane, Sivrihisar Massif, Turkey. J. Metamorph. Geol. 2011, 29, 193–212. [Google Scholar] [CrossRef]
  5. Brown, M.; Johnson, T. Secular change in metamorphism and the onset of global plate tectonics. Amer. Miner. 2018, 103, 181–196. [Google Scholar] [CrossRef]
  6. Gao, X.Y.; Zheng, Y.F.; Chen, X.R. U–Pb ages and trace elements in metamorphic zircon and titanite from UHP eclogite in the Dabie orogen: constraints on P–T–t path. J. Metamorph. Geol. 2011, 29, 721–740. [Google Scholar] [CrossRef]
  7. Wilke, F.D.H.; O’Brien, P.; Gerdes, A.; Timmerman, M.J.; Sudo, M.; Khan, M.A. The multistage exhumation history of the Kaghan Valley UHP series, NW Himalaya, Pakistan from U-Pb and 40Ar/39Ar ages. Eur. J. Mineral. 2010, 22, 703–719. [Google Scholar] [CrossRef]
  8. Faryad, S.W. Distribution and geological position of high-/ultrahigh-pressure units within the European Variscan Belt: A review. In Ultrahigh Pressure Metamorphism: 25 Years after the Discovery of Coesite and Diamond; Dobrzhinetskaya, L., Faryad, S.W., Wallis, S., Cuthbert, S., Eds.; Elsevier: Amsterdam, The Netherlands, 2011; pp. 361–397. [Google Scholar]
  9. Faryad, S.W.; Žak, J. High-pressure granulites of the Podolsko complex, Bohemian Massif: An example of crustal rocks that were subducted to mantle depths and survived a pervasive mid-crustal high-temperature overprint. Lithos 2016, 246–247, 246–260. [Google Scholar] [CrossRef]
  10. O’Brien, P.J. The fundamental Variscan problem: high-temperature metamorphism at different depths and high-pressure metamorphism at different temperatures. In Orogenic Processes: Quantification and Modelling in the Variscan Belt; Franke, W., Haak, V., Oncken, O., Tanner, D., Eds.; The Geological Society, Special Publication: London, UK, 2000; Volume 179, pp. 369–386. [Google Scholar]
  11. Faryad, S.W. The Kutná Hora Complex (Moldanubian zone, Bohemian Massif): A composite of crustal and mantle rocks subducted to HP/UHP conditions. Lithos 2009, 109, 193–208. [Google Scholar] [CrossRef]
  12. Brueckner, H.K.; Medaris, L.G.; Bakunczubarow, N. Nd–Sm age and isotope patterns from Variscan eclogites of the eastern Bohemian Massif. Neues Jahrbuch Miner. Abhandlungen 1991, 163, 169–196. [Google Scholar]
  13. Faryad, S.W.; Fišera, M. Olivine-bearing symplectites in fractured garnet from eclogite, Moldanubian Zone (Bohemian Massif)—A short-lived, granulite facies event. J. Metamorph. Geol. 2015, 33, 597–612. [Google Scholar] [CrossRef]
  14. Faryad, S.W.; Jedlicka, R.; Collet, S. Eclogite facies rocks of the Monotonous unit, clue to Variscan suture in the Moldanubian Zone (Bohemian Massif). Lithos 2013, 179, 353–363. [Google Scholar] [CrossRef]
  15. Faryad, S.W.; Jedlicka, R.; Hauzenberger, C.; Racek, M. High-pressure crystallization vs. recrystallization origin of garnet pyroxenite-eclogite within subduction related lithologies. Mineral. Petrol. 2018, 112, 603–616. [Google Scholar] [CrossRef]
  16. Jedlicka, R.; Faryad, S.W.; Hauzenberger, C. Prograde metamorphic history of UHP granulites from the Moldanubian Zone (Bohemian Massif) revealed by major element and Y+REE zoning in Garnets. J. Petrol. 2015, 56, 2069–2088. [Google Scholar] [CrossRef]
  17. Kotková, J.; O’Brien, P.J.; Ziemann, M.A. Diamond and coesite discovered in Saxony-type granulite: Solution to the Variscan garnet peridotite enigma. Geology 2011, 39, 667–670. [Google Scholar] [CrossRef]
  18. Massonne, H.J.; O’Brien, P.J. Characterization of an early metamorphic stage through inclusions in zircon of a diamondiferous quartzofeldspathic rock from the Erzgebirge, Germany. Amer. Miner. 2003, 88, 883–889. [Google Scholar] [CrossRef]
  19. Nahodilová, R.; Štípská, P.; Powell, R.; Košler, J.; Racek, M. High-Ti muscovite as a prograde relict in high pressure granulites with metamorphic Devonian zircon ages (Běstvina granulite body, Bohemian Massif): Consequences for the relamination model of subducted crust. Gondwana Res. 2014, 2, 630–648. [Google Scholar]
  20. Faryad, S.W.; Nahodilová, R.; Dolejš, D. Incipient eclogite facies metamorphism in the Moldanubian granulites revealed by mineral inclusions in garnet. Lithos 2010, 114, 54–69. [Google Scholar] [CrossRef]
  21. Kotková, J. High-pressure granulites of the Bohemian Massif: recent advances and open questions. J. Geosci. 2007, 52, 45–71. [Google Scholar] [CrossRef]
  22. O’Brien, P.J.; Kröner, A.; Jaeckel, P.; Hegner, E.; Zelazniewicz, A.; Kryza, R. Petrological and isotopic studies on Palaeozoic high-pressure granulites, Gory Sowie Mts, Polish Sudetes. J. Petrol. 1997, 38, 433–456. [Google Scholar] [CrossRef]
  23. Schantl, P.; Hauzenberger, C.; Finger, F.; Müller, T.; Linner, M. New evidence for the prograde and retrograde PT-path of high-pressure granulites, Moldanubian Zone, Lower Austria, by Zr-in-rutile thermometry and garnet diffusion modelling. Lithos 2019, 342–343, 420–439. [Google Scholar] [CrossRef]
  24. Tajčmanová, L.; Konopásek, J.; Schulmann, K. Thermal evolution of the orogenic lower crust during exhumation within a thickened Moldanubian root of the Variscan belt of Central Europe. J. Metamorph. Geol. 2006, 24, 119–134. [Google Scholar] [CrossRef]
  25. Sorger, D.; Hauzenberger, C.A.; Linner, M.; Iglseder, C.; Finger, F. Carboniferous Polymetamorphism Recorded in Paragneiss-Migmatites from the Bavarian Unit (Moldanubian Superunit, Upper Austria): Implications for the Tectonothermal Evolution at the End of the Variscan Orogeny. J. Petrol. 2018, 59, 1–23. [Google Scholar] [CrossRef]
  26. Franke, W. The mid-European segment of the Variscides; tectonostratigraphic units, terrane boundaries and plate tectonic evolution. In Orogenic Processes: Quantification and Modelling in the Variscan Belt; Franke, W., Haak, V., Oncken, O., Tanner, D., Eds.; The Geological Society, Special Publication: London, UK, 2000; Volume 179, pp. 35–61. [Google Scholar]
  27. Kröner, A.; O’Brien, P.; Nemchin, A.; Pidgeon, R.T. Zircon ages for high pressure granulites from South Bohemia, Czech Republic, and their connection to carboniferous high temperature processes. Contrib. Mineral. Petrol. 2000, 138, 127–142. [Google Scholar] [CrossRef]
  28. Schulmann, K.; Kröner, A.; Hegner, E.; Wendt, I.; Konopasek, J.; Lexa, O.; Štípská, P. Chronological constraints on the pre-orogenic history, burial and exhumation of deep-seated rocks along the eastern margin of the Variscan orogen, Bohemian Massif, Czech Republic. Amer. J. Sci. 2005, 305, 407–448. [Google Scholar] [CrossRef]
  29. Faryad, S.W.; Kachlík, V.; Sláma, J.; Hoinkes, G. Implication of corona formation in a metatroctolite to the granulite facies overprint of HP–UHP rocks in the Moldanubian Zone (Bohemian Massif). J. Metamorph. Geol. 2015, 33, 295–310. [Google Scholar] [CrossRef]
  30. Finger, F.; Gerdes, A.; Janoušek, V.; René, M.; Riegler, G. Resolving the Variscan evolution of the Moldanubian sector of the Bohemian Massif: The significance of the Bavarian and the Moravo-Moldanubian tectonometamorphic phases. J. Geosci. 2007, 52, 9–28. [Google Scholar] [CrossRef]
  31. Henk, A.; von Blanckenburg, F.; Finger, F.; Schaltegger, U.; Zulauf, G. Syn-convergent high-temperature metamorphism and magmatism in the Variscides: a discussion of potential heat sources. In Orogenic Processes: Quantification and Modelling in the Variscan Belt; Franke, W., Haak, V., Oncken, O., Tanner, D., Eds.; The Geological Society, Special Publication: London, UK, 2000; Volume 179, pp. 387–399. [Google Scholar]
  32. Holland, T.J.B. High water activities in the generation of high-pressure kyanite eclogites of the Tauern Window, Austria. J. Geol. 1979, 87, 1–27. [Google Scholar] [CrossRef]
  33. Zimmermann, R.; Hammerschmidt, K.; Franz, G. Eocene high-pressure metamorphisms in the Penninic units of the Tauern Window (Eastern Alps). Evidence from 40Ar–39Ar dating and petrological investigations. Contrib. Mineral. Petrol. 1994, 117, 175–186. [Google Scholar] [CrossRef]
  34. Dachs, E.; Proyer, A. Relics of high-pressure metamorphism from the Grossglockner region, Hohe Tauern, Austria: paragenetic evolution and PT-paths of retrogressed eclogites. Eur. J. Mineral. 2001, 13, 67–86. [Google Scholar] [CrossRef]
  35. Ratschbacher, L.; Dingeldey, C.; Miller, C.; Hacjer, B.R.; Mcwilliams, M.O. Formation, subduction, ans exhumation of Penninic oceanic crust in the Eastern Alps: time constraints from 40Ar/39Ar geochronology. Tectonophysics 2004, 394, 155–170. [Google Scholar] [CrossRef]
  36. Kurz, W.; Neubauer, F.; Dachs, E. Eclogite meso- and microfabrics: implications for the burial and exhumation history of eclogites in the Tauern Window (Eastern Alps) from P–T–d paths. Tectonophysics 1998, 285, 183–209. [Google Scholar] [CrossRef]
  37. Wiederkehr, M.; Bousquet, R.; Schmidt, S.M.; Berger, A. From subduction to collision: thermal overprint of HP/LT meta-sediments in the north-eastern Lepontine Dome (Swiss Alps) and consequences regarding the tectono-metamorphic evolution of the Alpine orogenic wedge. Swiss J. Geosci. 2008, 101, 127–155. [Google Scholar] [CrossRef] [Green Version]
  38. Brouwer, F.M.; van de Zedde, D.M.A.; Wortel, M.J.R.; Vissers, R.L.M. Late-orogenic heating during exhumation: Alpine PTt trajectories and thermomechanical models. Earth Planet. Sci. Lett. 2004, 220, 185–199. [Google Scholar] [CrossRef]
  39. Borghi, A.; Compahnoni, R.; Sandrone, R. Composite P-T paths in the Internal Penninic Massifs of the Western Alps: Petrological constraints to their thermo-mechanical evolution. Eclogue Geol. Helv. 1996, 89, 345–367. [Google Scholar]
  40. Brouwer, F.M.; Vissers, R.L.M.; Lamb, W.M. Structure and metamorphism of the Gran Paradiso massif, western Alps, Italy. Contrib. Mineral. Petrol. 2002, 143, 450–470. [Google Scholar] [CrossRef]
  41. Rubatto, D.; Hermann, J. Exhumation as fast as subduction? Geology 2001, 29, 3–6. [Google Scholar] [CrossRef]
  42. Brouwer, F.M. Thermal Evolution of High-Pressure Metamorphic Rocks in the Alps. Ph.D. Thesis, Utrecht University, Utrecht, The Netherlands, 2000; p. 146. [Google Scholar]
  43. Tóth, T.M.; Grandjean, V.; Engli, M. Polyphase evolution and reaction sequence of compositional domains in metabasalt: a model based on local chemical equilibrium and metamorphic differentiation. Geol. J. 2000, 35, 163–183. [Google Scholar] [CrossRef]
  44. Liu, Q.; Hermann, J.; Zhang, J. Polyphase inclusions in the Shuanghe UHP eclogites formed by subsolidus transformation and incipient melting during exhumation of deeply subducted crust. Lithos 2013, 177, 91–109. [Google Scholar] [CrossRef] [Green Version]
  45. Wilke, F.D.H.; O’Brien, P.J.; Altenberger, U.; Konrad-Schmolke, M.; Khan, M.A. Multi-stage history in different eclogite types from the Pakistan Himalaya and implications for exhumation processes. Lithos 2010, 114, 70–85. [Google Scholar] [CrossRef]
  46. Faryad, S.W.; Baldwin, S.L.; Jedlicka, R.; Ježek, J. Two stage garnet growth in coesite eclogite from the southeastern Papua New Guinea (U)HP terrane. Contrib. Mineral. Petrol. 2019, 174, 73. [Google Scholar] [CrossRef]
  47. Baldwin, S.L.; Webb, L.E.; Monteleone, B.D. Late Miocene coesite-eclogite exhumed in the Woodlark Rift. Geology 2008, 36, 735–738. [Google Scholar] [CrossRef]
  48. Abers, G.A.; Eilon, Z.; Gaherty, J.B.; Jin, G.; Kim, Y.H.; Obrebski, M.; Dieck, C. Southeast Papuan crustal tectonics: Imaging extension and buoyancy of an active rift. J. Geophys. Res. Solid Earth 2016, 121, 951–971. [Google Scholar] [CrossRef] [Green Version]
  49. Beaumont, C.; Jamieson, R.A.; Butler, J.P.; Warren, C.J. Crustal structure: A key constraint on the mechanism of ultra-high-pressure rock exhumation. Earth Planet. Sci. Lett. 2009, 287, 116–129. [Google Scholar] [CrossRef]
  50. Boutelier, D.; Chemenda, A.; Jorand, C. Continental subduction and exhumation of high-pressure rocks: Insight from thermo-mechanical laboratory modelling. Earth Planet. Sci. Lett. 2004, 222, 209–216. [Google Scholar] [CrossRef]
  51. Burov, E.; Jolivet, L.; Le Pourhiet, L.; Poliakov, A. A thermomechanical model of exhumation of high pressure (HP) and ultra-high pressure (UHP) metamorphic rocks in Alpinetype collision belts. Tectonophysics 2001, 342, 113–136. [Google Scholar] [CrossRef]
  52. Chemenda, A.I.; Mattauer, M.; Malavieille, J.; Bokun, A.N. A mechanism for syn-collisional rock exhumation and associated normal faulting: results from physical modelling. Earth Planet. Sci. Lett. 1995, 132, 225–232. [Google Scholar] [CrossRef]
  53. Gerya, T.V.; Perchuk, L.L.; Burg, J.-P. Transient hot channels: perpetrating and regurgitating ultrahigh-pressure, high-temperature crust-mantle associations in collision belts. Lithos 2008, 103, 236–256. [Google Scholar] [CrossRef]
  54. Li, Z.-H.; Gerya, T.V. Polyphase formation and exhumation of high- to ultrahigh-pressure rocks in continental subduction zone: Numerical modeling and application to the Sulu ultrahigh-pressure terrane in eastern China. J. Geophys. Res. 2009, 114, B09406. [Google Scholar] [CrossRef] [Green Version]
  55. Sizova, E.; Gerya, T.; Brown, M. Exhumation mechanisms of melt-bearing ultrahigh pressure crustal rocks during collision of spontaneously moving plates. J. Metamorp. Geol. 2012, 30, 927–955. [Google Scholar] [CrossRef]
  56. Warren, C.J.; Beaumont, C.; Jamieson, R. Deep subduction and rapid exhumation: role of crustal strength and strain weakening in continental subduction and ultrahighpressure rock exhumation. Tectonics 2008, 27, TC6002. [Google Scholar] [CrossRef]
  57. Yamato, P.E.; Burov, E.; Agart, P.; Le Pourhiet, L.; Jolivet, L. HP–UHP exhumation during slow continental subduction: self-consistent thermodynamically and thermomechanically coupled model with application to the Western Alps. Earth Planet. Sci. Lett. 2008, 271, 63–74. [Google Scholar] [CrossRef]
  58. Bea, F. The sources of energy for crustal melting and the geochemistry of heat-producing elements. Lithos 2012, 153, 278–291. [Google Scholar] [CrossRef]
  59. Jamieson, R.A.; Beaumont, C.; Fullsack, P.; Lee, B. Barrovian regional metamorphism: where’s the heat? In What Drives Metamorphism and Metamorphic Reactions? Treloar, P.J., O’Brian, P.J., Eds.; The Geological Society, Special Publication: London, UK, 1998; Volume 138, pp. 23–51. [Google Scholar]
  60. Burg, J.P.; Gerya, T.V. The role of viscous heating in Barrovian metamorphism of collisional orogens: thermomechanical models and application to the Lepontine Dome in the Central Alps. J. Metamorph. Geol. 2005, 23, 75–95. [Google Scholar] [CrossRef]
  61. Engi, M.; Todd, C.S.; Schmatz, D.R. Tertiary metamorphic conditions in the eastern Lepontine Alps. Schweizerische Mineralogische Petrographische Mitteilungen 1995, 75, 347–369. [Google Scholar]
  62. Frey, M.; Ferreiro Mählmann, R. Alpine metamorphism of the Central Alps. Schweizerische Mineralogische Petrographische Mitteilungen 1999, 79, 135–154. [Google Scholar]
  63. Becker, H. Garnet peridotite and eclogite Sm-Nd mineral ages from the Lepontine dome (Swiss Alps) – New evidence for Eocene high-pressure metamorphism in the Central Alps. Geology 1993, 21, 599–602. [Google Scholar] [CrossRef]
  64. Ballèvre, M.; Lagabrielle, Y.; Merle, O. Tertiary ductile normal faulting as a consequence of lithospheric stacking in the Western Alps. Mémoires de la Société Géologique Suisse 1990, 1, 227–236. [Google Scholar]
  65. Bousquet, R.; Goffé, B.; Henry, P.; Le Pichon, X.; Chopin, C. Kinematic, thermal and petrological model of the Central Alps: Lepontine metamorphism in the upper crust and eclogitisation of the lower crust. Tectonophysics 1997, 273, 105–127. [Google Scholar] [CrossRef]
  66. Chamberlain, C.P.; Sonder, L.J. Heat-producing elements and the thermal and baric patterns of metamorphic belts. Science 1990, 250, 763–769. [Google Scholar] [CrossRef]
  67. Engi, M.; Berger, A.; Roselle, G.T. Role of the tectonic accretion channel in collisional orogeny. Geology 2001, 29, 1143–1146. [Google Scholar] [CrossRef]
  68. Platt, J.P. Dynamics of orogenic wedges and the uplift of high-pressure metamorphic rocks. Geol. Soc. Am. Bull. 1986, 97, 1037–1053. [Google Scholar] [CrossRef]
  69. Davies, J.H.; von Blanckenburg, F. Slab breakoff: A model of lithosphere detachment and its test in the magmatism and deformation of collisional orogens. Earth Planet. Sci. Lett. 1995, 129, 85–102. [Google Scholar] [CrossRef]
  70. Duretz, T.; Gerya, T.; May, D. Numerical modelling of spontaneous slab breakoff and subsequent topographic response. Tectonophysics 2011, 502, 244–256. [Google Scholar] [CrossRef]
  71. Baumann, C.; Gerya, T.V.; Connoly, A.D. Numerical Modelling of Spontaneous Slab Breakoff Dynamics during Continental Collision; The Geological Society, Special Publication: London, UK, 2010; Volume 332, pp. 99–114. [Google Scholar]
  72. Boutelier, D.; Cruden, A.R. Slab breakoff: Insights from 3D thermo-mechanical analogue modelling experiments. Tectonophysics 2017, 694, 197–213. [Google Scholar] [CrossRef]
  73. Duretz, T.; Gerya, T. Slab detachment during continental collision: Influence of crustal rheology and interaction with lithospheric delamination. Tectonophysics 2013, 602, 124–140. [Google Scholar] [CrossRef]
  74. Freeburn, R.; Bouilhol, P.; Maunder, B.; Magni, V.; van Hunen, J. Numerical models of the magmatic processes induced by slab breakoff. Earth Planet. Sci. Lett. 2017, 478, 203–213. [Google Scholar] [CrossRef] [Green Version]
  75. Gerya, T.V.; Yuen, D.A.; Maresch, W.V. Thermomechanical modelling of slab detachment. Earth Planet. Sci. Lett. 2004, 226, 101–116. [Google Scholar] [CrossRef]
  76. Li, Z.-H.; Xu, Z.; Gerya, T.; Burg, J.P. Collision of continental corner from 3-D numerical modeling. Earth Planet. Sci. Lett. 2013, 380, 98–111. [Google Scholar] [CrossRef]
  77. Van Hunen, J.; Allen, M.B. Continental collision and slab break-off: a comparison of 3-D numerical models with observations. Earth Planet. Sci. Lett. 2015, 302, 27–37. [Google Scholar] [CrossRef]
  78. Niu, Y. Slab breakoff: A causal mechanism or pure convenience? Sci. Bull. 2017, 62, 456–461. [Google Scholar] [CrossRef] [Green Version]
  79. Mako, C.A.; Caddick, M.J. Quantifying magnitudes of shear heating in metamorphic systems. Tectonophysics 2018, 744, 499–517. [Google Scholar] [CrossRef]
  80. Gerya, T.V.; Yuen, D.A. Characteristics-based marker-in-cell method with conservative finite-differences schemes for modelling geological flows with strongly variable transport properties. Phys. Earth Planet. Inter. 2003, 140, 295–318. [Google Scholar] [CrossRef]
  81. Turcotte, D.L.; Schubert, G. Geodynamics; Cambridge University Press: Cambridge, UK, 2002; p. 456. [Google Scholar]
  82. Dymkova, D.; Gerya, T.; Burg, J.-P. 2D thermomechanical modelling of continent–arc–continent collision. Gondwana Res. 2016, 32, 138–150. [Google Scholar] [CrossRef]
  83. Faccenda, M.; Gerya, T.V.; Chakraborty, S. Styles of post-subduction collisional orogeny: Influence of convergence velocity, crustal rheology and radiogenic heat production. Lithos 2008, 103, 257–287. [Google Scholar] [CrossRef]
  84. Sizova, E.; Gerya, T.; Brown, M.; Perchuk, L.L. Subduction styles in the Precambrian: Insight from numerical experiments. Lithos 2010, 116, 209–229. [Google Scholar] [CrossRef] [Green Version]
  85. Sizova, E.; Gerya, T.; Stüwe, K.; Brown, M. Generation of felsic crust in the Archean: A geodynamic modeling perspective. Precambr. Res. 2015, 271, 198–224. [Google Scholar] [CrossRef]
  86. Li, Z.-H.; Gerya, T.; Connolly, J.A.D. Variability of subducting slab morphologies in the mantle transition zone: Insight from petrological-thermomechanical modeling. Earth Sci. Rev. 2019, 196, 102874. [Google Scholar] [CrossRef]
  87. Djomani, Y.H.P.; O’Reilly, S.Y.; Griffin, W.L.; Morgan, P. The density structure of subcontinental lithosphere through time. Earth Planet. Sci. Lett. 2001, 184, 605–621. [Google Scholar] [CrossRef]
  88. Griffin, W.L.; O’Reilly, S.Y.; Reilly, S.Y.; Abe, N.; Aulbach, S.; Davies, R.M.; Pearson, N.J.; Doyle, B.J.; Kivi, K. The origin and evolution of Archean lithospheric mantle. Precambr. Res. 2003, 127, 19–41. [Google Scholar] [CrossRef]
  89. Gerya, T.V.; Stöckhert, B.; Perchuck, A.L. Exhumation of high-pressure metamorphic rocks in a subduction channel: A numerical simulation. Tectonics 2002, 21, 6-1–6-19. [Google Scholar] [CrossRef] [Green Version]
  90. Schmidt, M.; Poli, S. Experimentally based water budgets for dehydrating slabs and consequences for arc magma generation. Earth Planet. Lett. 1998, 163, 361–379. [Google Scholar] [CrossRef]
  91. Gerya, T.V.; Yuen, D.A. Rayleigh-Taylor instabilities from hydration and melting propel “cold plumes” at subduction zones. Earth Planet. Sci. Lett. 2003, 212, 47–62. [Google Scholar] [CrossRef]
  92. Katz, R.F.; Spiegelman, M.; Langmuir, C.H. A new parameterization of hydrous mantle melting. Geochem. Geophys. Geosyst. 2003, 4, 1073. [Google Scholar] [CrossRef]
  93. Vogt, K.; Gerya, T.; Castro, A. Crustal growth at active continental margins:numerical modeling. Phys. Earth Planet. Inter. 2012, 192–193, 1–20. [Google Scholar] [CrossRef]
  94. Brown, M. The contribution of metamorphic petrology to understanding lithosphere evolution and geodynamics. Geosci. Front. 2014, 5, 553–569. [Google Scholar] [CrossRef] [Green Version]
  95. Bina, C.R.; Helffrich, G. Phase transition Clapeyron slopes and transition zone seismic discontinuity topography. J.Geophys. Res. 1994, 99, 15853–15860. [Google Scholar] [CrossRef]
  96. Faccenda, M.; Minelli, G.; Gerya, T.V. Coupled and decoupled regimes of continental collision: Numerical modelling. Earth Planet. Sci. 2009, 278, 337–349. [Google Scholar] [CrossRef]
  97. Ueda, K.; Gerya, T.V.; Burg, J.-P. Delamination in collisional orogens: Thermomechanical modeling. J. Geophys. Res. 2012, 17, B08202. [Google Scholar] [CrossRef] [Green Version]
  98. Magni, V.; Faccenna, C.; van Hunen, J.; Funiciello, F. Delamination vs. break-off: The fate of continental collision. Geophys. Res. Lett. 2013, 40, 285–289. [Google Scholar] [CrossRef] [Green Version]
  99. Janoušek, V.; Holub, F.V. The causal link between HP–HT metamorphism and ultrapotassic magmatism in collisional orogens: Case study from the Moldanubian Zone of the Bohemian Massif. Proc. Geol. Assoc. 2007, 118, 75–86. [Google Scholar]
  100. Schulmann, K.; Konopásek, J.; Janoušek, V.; Lexa, O.; Lardeaux, J.-M.; Edel, J.-B.; Štίpska, P.; Ulrich, S. An Andean type Paleozoic convergence in the Bohemian Massif. C. R. Geosci. 2009, 341, 266–286. [Google Scholar] [CrossRef]
  101. Babuška, V.; Plomerová, J. Boundaries of mantle–lithosphere domains in the Bohemian Massif as extinct exhumation channels for high-pressure rocks. Gondwana Res. 2013, 23, 973–987. [Google Scholar] [CrossRef]
  102. Janoušek, V.; Gerdes, A. Timing the magmatic activity within the Central Bohemian Pluton, Czech Republic: conventional U-Pb ages for the Sázava and Tábot intrusions and their geotectonic significance. J. Czech Geolc. Soc. 2003, 48, 70–71. [Google Scholar]
  103. Gerdes, A.; Friedl, G.; Parrish, R.R.; Finger, F. High resolution geochronology of Variscan granite emplacement—The South Bohemian Batholith. J. Czech Geosci. Soc. 2002, 48, 53–54. [Google Scholar]
  104. Klomίnský, J.; Jarchovský, T.; Rajpoot, G.S. Atlas of Plutonic Rocks and Orthogneisses in the Bohemian Massif; Czech Geological Survey: Prague, Czech Republic, 2010. [Google Scholar]
  105. Cloos, M.; Sapiie, B.; Quarles van Ufford, A.; Wiland, R.J.; Warren, P.Q.; McMahon, T.P. Collisional delamination in New Guinea: The geotectonics of subducting slab breakoff. Geol. Soc. Am. Spec. Pap. 2006, 400, 1–55. [Google Scholar]
  106. Hacker, B.R. Ascent of the ultrahigh-pressure Western Gneiss Region, Norway. In Convergent Margin Terranes and Associated Regions: A Tribute to W.G. Ernst; Cloos, M., Carlson, W.D., Gilbert, M.C., Liou, J.G., Sorenson, S.S., Eds.; Geological Society of America: Boulder, CO, USA, 2007; Volume 419, pp. 171–184. [Google Scholar]
  107. Brun, J.-P.; Faccenna, C. Exhumation of high-pressure rocks driven by slab rollback. Earth Planet. Sci. Lett. 2008, 272, 1–7. [Google Scholar] [CrossRef] [Green Version]
  108. Tirel, C.; Brun, J.-P.; Burov, E.; Wortel, M.J.R.; Lebedev, S. A plate tectonics oddity: Caterpillar-walk exhumation of subducted continental crust. Geology 2013, 41, 555–558. [Google Scholar] [CrossRef]
  109. Ring, U.; Glodny, J.; Will, T.; Thomson, S. The Hellenic Subduction System: High-Pressure Metamorphism, Exhumation, Normal Faulting, and Large-Scale Extension. Ann. Rev. Earth Planet. Sci. 2010, 38, 45–76. [Google Scholar] [CrossRef]
  110. Huang, H.; Niu, Y.L.; Mo, X.X. Syn-collisional granitoids in the Qilian Block on the Northern Tibetan Plateau: a long-lasting magmatism since continental collision through slab steepening. Lithos 2016, 246–247, 99–109. [Google Scholar] [CrossRef]
  111. Bittner, D.; Schmeling, H. Numerical modeling of melting processes and induced diapirism in the lower crust. Geophys. J. Int. 1995, 123, 59–70. [Google Scholar] [CrossRef] [Green Version]
  112. Clauser, C.; Huenges, E. Thermal conductivity of rocks and minerals. In Rock Physics and Phase Relations; Ahrens, T.J., Ed.; AGU Reference Shelf: Washington, DC, USA, 1995; Volume 3, pp. 105–126. [Google Scholar]
  113. Ranalli, G. Rheology of the Earth; Chapman and Hall: London, UK, 1995; p. 413. [Google Scholar]
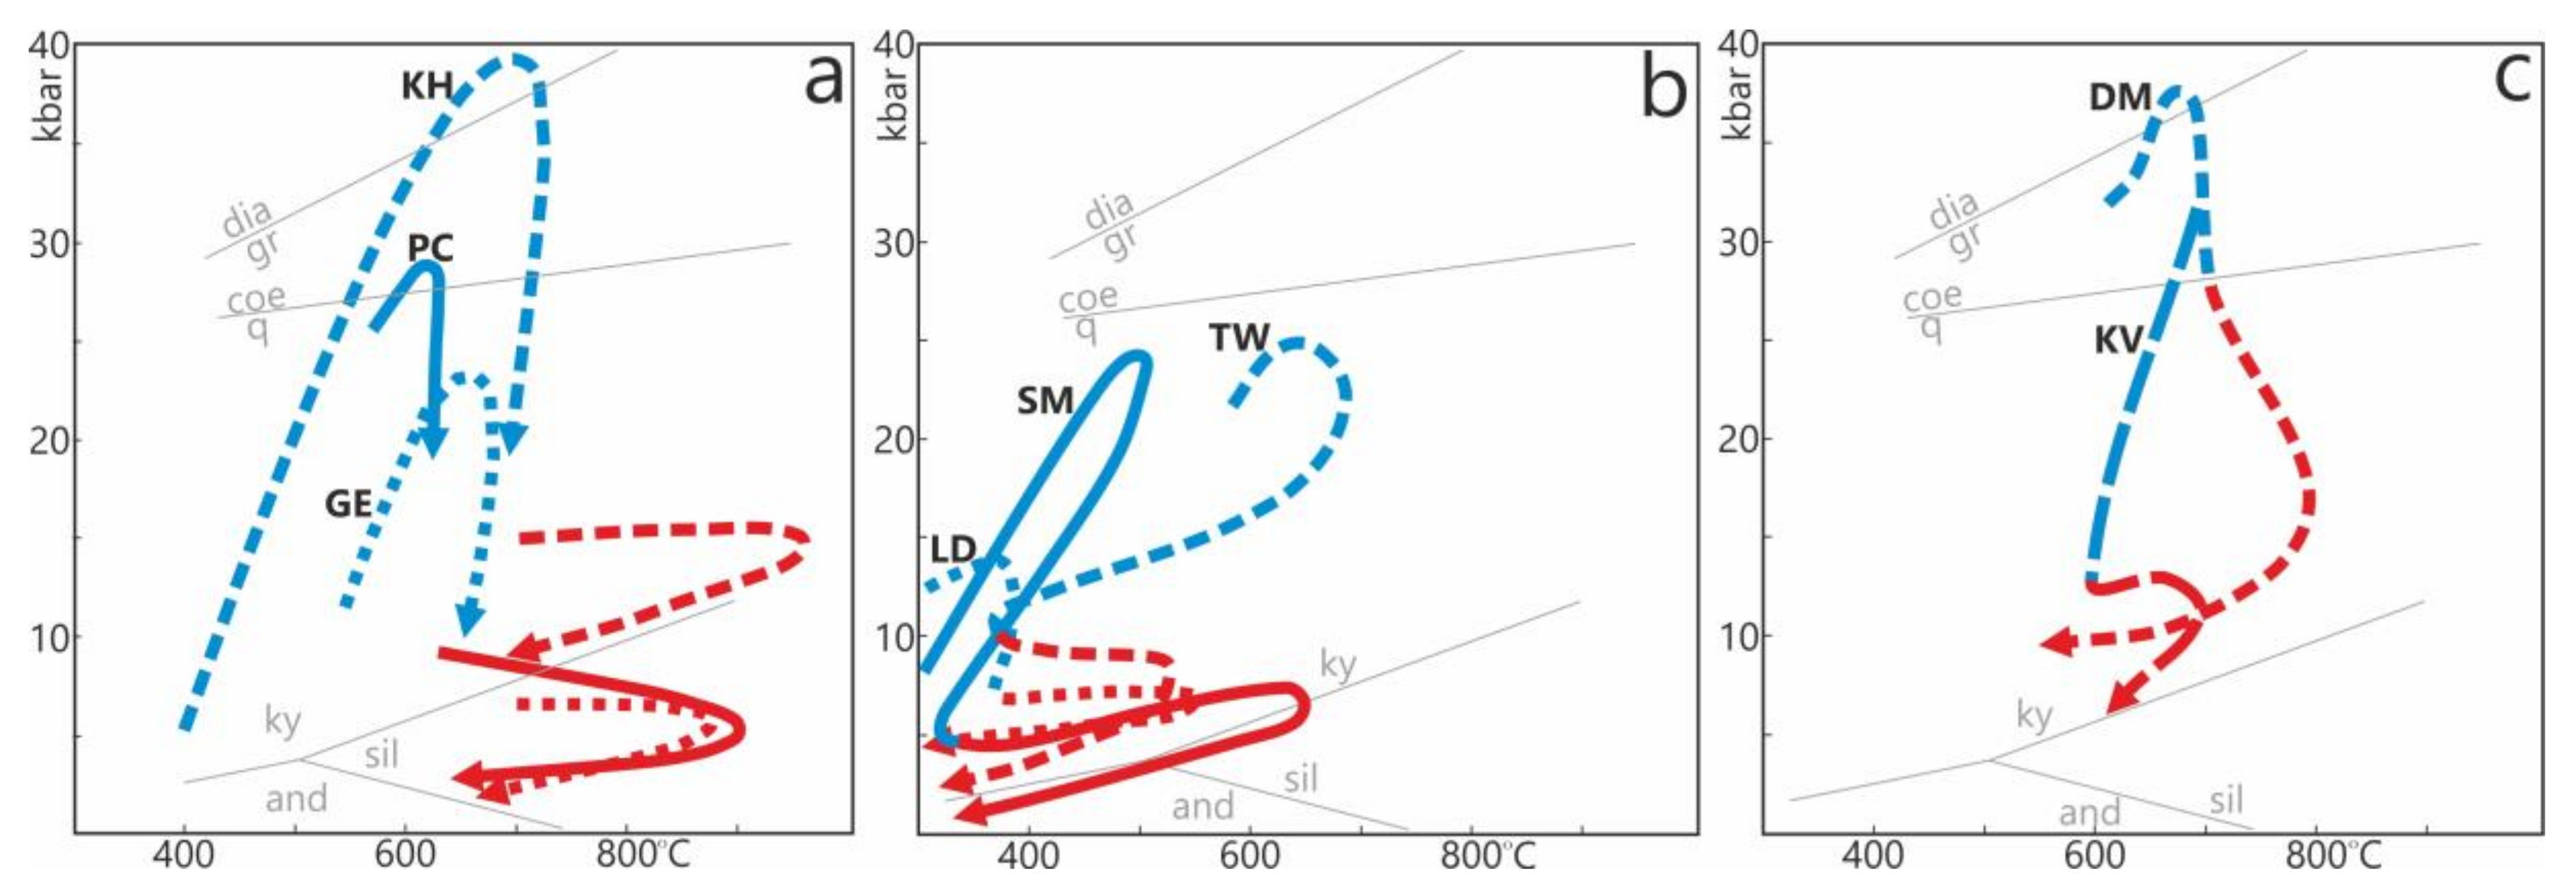
Figure 1. Natural examples of β-shape pressure–temperature–time (P–T–t) paths from: KH, Kutná Hora [3]; PC, Podolsko complex [9]; GE, Monotonous series [13] in the Bohemian Massif; TW, Tauern Window in the Eastern Alps [36]; LD, Lepontine Dome in the Central Alps [37]; SM, the southern Sivrihisar Massif in Turkey [4]; DM, the Shuanghe locality in the eastern Dabie ultrahigh pressure (UHP) belt [44]; KV, the Kaghan Valley in the Himalayas [7]. The P–T–t paths are grouped (ac) according to the discussion in the introduction, and show two metamorphic stages: the first (high-pressure) marked in blue and the second (heating) marked in red. Different styles of the lines are used for distinguish distinct P–T–t paths in one group.
Geosciences 09 00499 g001
Figure 2. Initial configuration of the numerical model (see text for details). White lines are isotherms shown for increments of 200 °C starting from 100 °C. Colors indicate materials (e.g., rock type or melt-bearing rock type) that appear in subsequent figures.
Geosciences 09 00499 g002
Figure 3. Time-slice snapshots to show the evolution of experiment R1 with a slab rollback, with 600 × 250 km sections depicted of the original 4000 × 1000 km model. White arrows in the zoomed snapshots show the calculated velocity field. For the snapshots b, f the large-scale snapshots are shown (b’,f’). The model involves (a) subduction of an oceanic plate, followed by subduction of the continental plate, (b) decoupling of the upper crust, (ce) the exhumation of (ultra)high pressure ((U)HP) metamorphic rocks, (be) accompanied by the continental slab rollback, (de) causing asthenospheric mantle upwelling. (f) By the end, the continental plate starts advancing again.
Geosciences 09 00499 g003
Figure 4. Six time-slice snapshots showing the evolution of the subducted crustal material in experiment R1 with slab rollback (left column) with the associated representative P–T–t paths (right column). (a’f’) Colored circles on the snapshots are markers that refer to the diagrams with the P–T–t paths. Metamorphic facies fields (separated by grey fields) on these and all following P–T diagrams are modified from Figure 1 in Brown [94]: Lg, low-grade metamorphism: Bl, blueschist facies; Gr, greenschist facies; Am, Amphibolite facies; Gn, granulite facies; UHP, ultrahigh pressure metamorphism; E-HPM, eclogite–high pressure granulite metamorphism. Errors associated with the P–T values retrieved from the experiment are ±5 °C and ±0.1 kbar.
Geosciences 09 00499 g004
Figure 5. (a) The detailed P–T–t paths of three markers from experiment R1 that underwent heating after extraction (colors of the markers are identical to those in Figure 4). The numbers by the points on the P–T–t paths indicate millions of years from the beginning of the experiment. (b) Heating/cooling rates versus time for the markers from (a).
Geosciences 09 00499 g005
Figure 6. Six time-slice snapshots to show the evolution of experiment R2 with a prolonged slab rollback (left column) and the associated representative P–T–t paths of crustal material (right column). Colored circles in the snapshots are markers that refer to the diagrams with the P–T–t paths (a’f’). White arrows in the zoomed snapshots show the calculated velocity field. The model involves subduction of an oceanic plate, followed by (a) subduction of the continental plate, (a) decoupling of the upper crust, (bd) the exhumation of (ultra)high pressure ((U)HP) metamorphic rocks, (bf) accompanied by the continental slab rollback, (be) causing asthenospheric mantle upwelling, and (f) final slab breakoff.
Geosciences 09 00499 g006
Figure 7. The detailed P–T–t paths of five markers from experiment R2 that underwent heating after extraction (colors of the markers are identical with those from Figure 6). The numbers by the points on the P–T–t paths indicate millions of years from the beginning of the experiment.
Geosciences 09 00499 g007
Figure 8. Four time-slice snapshots to show the evolution of experiment B1 with a deep slab breakoff (left column) and the associated representative P–T–t paths of crustal material (right column). Colored circles on the snapshots are markers that refer to the diagrams with the P–T–t paths (a’d’). White arrows in a zoomed snapshot show the calculated velocity field. The model involves (a) subduction of an oceanic plate, followed by subduction of the continental plate, (bc) decoupling of the upper crust and its vertical exhumation, (c) the exhumation of (ultra)high pressure ((U)HP) metamorphic rocks, (bc) accompanied by the continental slab rollback, (bc) causing asthenospheric mantle upwelling, and (c) final slab breakoff with (d) following relaxation stage.
Geosciences 09 00499 g008
Figure 9. Four time-slice snapshots showing the evolution of experiment B2 with an intermediate slab breakoff (left column) and the associated representative P–T–t paths of crustal material (right column). Colored circles on the snapshots are markers that refer to the diagrams with the P–T–t paths (a’d’). The model involves (a) subduction of an oceanic plate, followed by subduction of the continental plate, (a) decoupling of the upper crust, (b) slab breakoff, followed by (bc) the exhumation of (ultra)high pressure ((U)HP) metamorphic rocks, and (c–d) final relaxation stage.
Geosciences 09 00499 g009
Figure 10. Four time-slice snapshots showing the evolution of experiment B3 with a shallow slab breakoff (left column) and the associated representative P–T–t paths of crustal material (right column). Colored circles on the snapshots are markers that refer to the diagrams with the P–T–t paths (a’d’). The model involves (a) subduction of an oceanic plate, followed by subduction of the continental plate, (b) slab breakoff, followed by (c) the exhumation of (ultra)high pressure ((U)HP) metamorphic rocks, and (d) final relaxation stage.
Geosciences 09 00499 g010
Figure 11. The time-slice snapshots showing the evolution of experiments B1D and B1E with a deep-middle slab breakoff (left column), at an ambient mantle temperature that was 50 degrees hotter than in the other experiments, and the associated representative P–T–t paths of crustal material (right column). Colored circles on the snapshots are markers that refer to the diagrams with the P–T–t paths (a’d’). The models involve (a and e) subduction of an oceanic plate, followed by subduction of the continental plate, decoupling of the upper crust, accompanied by asthenospheric mantle upwelling, and slab breakoff, (b and f) the later exhumation of (ultra)high pressure ((U)HP) metamorphic rocks, followed by (c and g) asthenospheric mantle upwelling, causing slab rollback, and (d and h) final relaxation stage.
Geosciences 09 00499 g011
Figure 12. Comparison of the β-shape P–T–t paths from the experiments with slab rollback shown in red (solid lines, R1; dashed lines, R2) and slab breakoff (B1E, shown in blue) with the end-member P–T–t paths from the natural examples: light grey field, LD+SM paths from Figure 1; dark grey field, KH+PC+GE paths from Figure 1.
Geosciences 09 00499 g012
Table 1. Main variable parameters in the experiments. R1, R2, etc. are the identification numbers of the experiments.
R1R2B1B2B3B1AB1BB1CB1DB1ER1AR1BR2A
Oceanic plate length (km)400400700700700700700700700700400400400
Oceanic plate age (Myrs)40404080404040404040404040
Pushing velocity (m/s)5553 *255555255
Time of pushing (Myrs)80108081780808808808010
Left continental lithosphere thickness (km)10010010070100100100100100100100100100
Right continental lithosphere thickness (km)1001001407070140140140140140100100100
Continental lithospheric density (kg/m3)3280328032803280328032803260326032803280328032803280
Ambient mantle temperature (°C)1300130013001300130013001300130013501350130013501350
Note: *, from both sides.