Article

Rock Mass Behavior under Tunnel Widening in Asymmetric and Symmetric Modes Considering Different Shapes and Parametric Conditions

1
NUST Institute of Civil Engineering, National University of Science and Technology (NUST), Islamabad 44000, Pakistan
2
Structural and Seismic Laboratory, Power Transmission Laboratory, KEPCO Research Institute, 105 Munji-ro, Yuseong-gu, Daejeon 34056, Korea
3
Department of Urban Infrastructure Research, Seoul Institute of Technology, 8F, 37 Maebongsan-ro, Mapo-gu, Seoul 03909, Korea
*
Author to whom correspondence should be addressed.
Geosciences 2019, 9(12), 518; https://doi.org/10.3390/geosciences9120518
Submission received: 26 September 2019 / Revised: 5 December 2019 / Accepted: 13 December 2019 / Published: 16 December 2019

Abstract

:
To accommodate traffic volume on roads due to ever-increasing population growth, the widening of highways and motorways is in high demand. Nevertheless, the widening of tunnels on these road networks is quite complex due to the presence of numerous rock types, in situ stress, and different widening modes. To overcome these complexities, eight different tunnel shapes were simulated under varying support conditions for asymmetric and symmetric widening. It was found that the tunnels with a round shape, such as horseshoe and semicircular with flatbed, are more effective for asymmetric widening, whereas the provision of a rounded invert in these shapes can reverse the widening option to symmetric. Furthermore, an insignificant effect of the difference in asymmetric and symmetric widening of regular tunnel shapes, such as box, rectangular, and semi-elliptical, was found. A full factorial design statistical analysis confirmed the decrease in tunnel deformation by using various tunnel support systems and showed a significant deformation difference according to monitoring locations at the tunnel periphery. The deformation difference in the case of both tunnel widening modes was also analyzed according to different design parameters. This study provides a comprehensive understanding of rock mass behavior when the widening of any underground opening is carried out.

1. Introduction

The population of the world is increasing with every passing year [1]. In addition to that, the phenomenon of urbanization is also increasing tremendously [2], thereby causing huge congestion on existing roads, highways, motorways, and railway systems. In this aspect, the provision of new roads and railway tracks is difficult, owing to construction and land costs, especially in urban areas. To overcome these issues and to minimize traffic disruptions, a conventional remedy is to provide an additional lane on highways/motorways and to provide additional railway tracks along with the old ones. This, in turn, results in the widening of tunnels on these roads and railway lines to accommodate the additional lanes or railway tracks.
To this end, the literature reveals several studies on the widening phenomenon of tunnels. For example, Khan et al. [3] studied the widening of different shapes of tunnels in different in situ stress states and in a variety of geological and geotechnical conditions. In this study, it was concluded that the asymmetric widening is suitable for horseshoe shape tunnels with flatbed/invert and circular tunnels, whereas symmetric widening is more suitable for semicircular tunnels with flatbed/invert. Moreover, it was concluded in the study that shotcrete contributes more towards stability for asymmetric tunnel widening than for symmetric tunnel widening. The rock bolts also provide a sufficient contribution to tunnel stability in both asymmetric and symmetric widening; however, the results show that the difference between deformation obtained through asymmetric and symmetric widening of tunnels by using rock bolts is not significant. According to Li [4], the increase in rock strength due to bolting is very limited. The essential function of bolting is to keep the fractured rock together to form a pressure arch around the open space, i.e., the rock bolts help the rock to support itself. Shang et al. [5] studied the behavior of a mortar bolt interface subjected to shearing, wherein, the characteristics of the interaction of rock bolts with mortar and the interaction of mortar with rock mass were analyzed. They concluded that rock bolts are more efficient in fractured rock, whereas, in the study of Khan et al. [3], the rock was slightly fractured with two to three joint sets. Consequently, the use of rock bolts in that case did not provide much difference in deformation between asymmetric and symmetric tunnel widening.
The case of tunnel widening in Hawkesbury sandstone during the extension of the M2 Motorway in Sydney, Australia was considered in [6]. A back analysis of the data was carried out by the author to determine the deformation modulus as well as the horizontal to vertical stress ratio, and these values were found to be in order with the range used in Sydney.
There are approximately 40 cases of extension of existing tunnels reported in Japan, as affirmed by Choi and Kim [7]. They devised a design technique for the widening of any existing tunnel. It was concluded in their work that bidirectional tunnel widening has a disadvantage, as the whole tunnel support must be removed, which consumes more time and cost. However, their study revealed that the centerline is not significantly shifted in a bidirectional expansion tunnel; therefore, the said widening provides more space to work on both sides of the tunnel profile. The method of stabilizing and strengthening the central pillar of two tunnels was formulated by applying tie bolt fastening.
The Castellano tunnel in Italy was evaluated [8] for the widening of the brick-lined railway tunnel in silty clay/clayey silt with lenses of sand. It was found that the consolidation of strata behind the lining could be achieved by the combined effect of fiberglass elements and cement motor grout injection, which led to tunnel stability during the widening process as well as to the control of tunnel convergence. However, the author presented a case study with illustrations of monitoring data both for convergence and measured stress. No stress analysis and no consideration of any other option for the widening of the tunnel was made in their paper.
Different studies have investigated the widening of tunnels under safety consideration simultaneous with traffic operations in a tunnel [9,10]. The concept of “traffic protecting steel shell” was introduced inside the existing profile of an original tunnel for traffic protection [9].
The behavior and stability of enlarged twin parallel tunnels were studied specifically with respect to stress and deformation on the central pillar for four different cases [11]. This study concluded that the requirement of shotcrete in the central pillar between two twin tunnels increases with the decrease in the width of the pillar, and the pillar width is directly proportional to the pillar stability.
For Damaoshan Tunnel in China, three modes of tunnel expansion [12,13] were considered: single side, double side, and peripheral expansions. It was found that the single side expansion was an appropriate solution. Mechanical computational models were devised for a single side widened tunnel. The widening of tunnels in urban areas can also be carried out effectively using the nonvibrational rock splitting method. The rock splitting method was elaborated by Jafri and Yoo [14], wherein the rock mass excavation in tunnels was analyzed through discrete element analysis.
The aforementioned studies either described the stress and behavior of the central pillar between two tunnels during widening or presented a method and design for the widening of tunnel. Worldwide, the tunnels at roads and railway lines are of different shapes and different sizes to cater for the requirement of roads/tracks. Additionally, the need for widening is required both for shallow tunnels on the roads, highways, subways, mass transit in urban areas as well as the tunnels in deep mountains like the Alps. However, our understanding on the comparison between asymmetric and symmetric widening of tunnels by using New Austrian Tunneling Method (NATM) of excavation in different shapes under different support systems with different design parameters and in situ conditions remains elusive because of various design parameters and in situ conditions that deserve to be investigated properly.
Likewise, a widening case was considered for the 8.5 km Lowari tunnel, which is situated in the northern area of Pakistan. The tunnel was initially envisaged as a piggy back rail tunnel profile; however, the tunnel was widened asymmetrically after the initial excavation and primary support system to a road tunnel to provide an additional lane to accommodate the traffic leading to the Central Asian States. During the planning for widening of the tunnel, there was a lot of debate among project authorities around whether to widen the tunnel asymmetrically or symmetrically. Finally, it was decided to convert the tunnel asymmetrically on its stability basis; however, there was no conclusive evidence why such decision was made. In addition, the following questions are worthy of research pursuit: Will the widening of the tunnel be safe in asymmetric or symmetric modes for different tunnel or cavern shapes? What will the effect of two different widening modes due to different tunnel support systems be? What effect of widening would change with different design parameters and variant in situ stress conditions?
To answer all of these questions, a study was carried out on the Lowari Tunnel model to determine the most appropriate tunnel widening mode (asymmetric or symmetric) under different support conditions for different tunnel profile shapes with a variety of design parameters. In this regard, it was mandatory to have an appropriate numerical technique to model the site condition of Lowari tunnel. In general, there are different numerical approaches which are being carried out in dealing with underground structures. Among them, the most common are the finite difference method (FDM), finite element method (FEM), discrete element method (DEM), and boundary element method (BEM) [15,16].
The FDM is a numerical technique based on the continuum approach and is an explicit solution scheme, which is constituted on the discretization of the governing of partial differential equations by replacing the partial derivatives with differences defined at neighboring grid points [15,16,17]. The grid system is used in FDM with uniformly spaced nodes at close intervals to get better results for objective functions like stress, velocity, and displacement. The dynamic behavior on the nodes is also represented numerically by a time-stepping algorithm, wherein each time step has the assumption of constant velocities and accelerations. The advantage of FDM is its convenience in grid generation and as an effective way of generating the objective function. Besides the explicit solution scheme, the FDM has some limitations, i.e., the technique is inflexible in dealing with fractures, complex boundary conditions, and material homogeneity. Developments of the FDM method are being carried out to address these shortcomings [16].
The FEM is also a numerical technique based on the continuum approach and is an implicit solution scheme which is based on the approximation of equivalent governing integral relations using finite segments. It makes a pointwise approximation of governing equations. The FEM is highly flexible in handling material inhomogeneity and anisotropy, complex boundary conditions, and dynamic problems. Different authors have used the FEM to evaluate the constitutive model of jointed rock mass [18]. Besides the different advantages, FEM requires domain meshing. It is a time consuming computation process and is not suitable for infinite problems.
The DEM is numerical technique based on the discontinuum approach, which simulates the behavior of a population of independent particles. It is the method that allows finite displacements and rotations of discrete bodies, including complete detachment, and recognizes new contacts automatically as the calculation progresses [19]. In this technique, each particle is represented numerically and is identified with its specific properties like shape, size, material, initial velocity, etc. This technique is used in many studies, especially for the investigation of the shear failure of incipient rock discontinuities to investigate the influence of the boundary conditions [5,20]. The drawback of DEM is that the technique is not well used for continuum problems.
BEM is a numerical technique based on the continuum approach which constitutes an approximation of equivalent governing integral relations using boundary segments [21]. This method has various advantages, for example, the BEM requires discretization of the excavation boundary only and generates the mesh very easily as compared with other methods. As a result, it requires less data and time for computation. However, this method has mostly nonsymmetrical matrices, thus requiring complicated integral relations. This method is unsuitable for inhomogeneous and nonlinear problems.
Keeping in view the pros and cons of different numerical techniques, it was found that the case under study was related to the continuum approach with two to three joint sets and a complicated rock mass behavior (i.e., displacements). Therefore, it was considered appropriate to use the FDM method with an explicit finer grid to evaluate the rock mass behavior. This explicit scheme can follow arbitrary nonlinear stress/strain laws in almost the same computer time as linear laws, whereas the implicit solutions can take significantly longer to solve nonlinear problems. In this regard, the tunnel model based on the geometry and site-specific conditions of Lowari tunnel project was evaluated using FDM by means of the FLAC 3D (Fast Lagrangian Analysis Continua in three Dimension—Itasca International, Inc. Minneapolis, MN, USA) [22].
The model with asymmetric widening was validated with actual deformation obtained at the project site. There was no in situ test carried out at the site or in the nearby vicinity; therefore, no reliable in situ data were available. In this respect, the different commonly available equations and formulas were used to determine the in situ stresses which were then validated using a back analysis of tunnel deformations and found to be best suited to in situ stress assumptions. After validation of the model, a detailed study was carried out using numerical simulation to evaluate the rock mass behavior in asymmetric and symmetric tunnel widening utilizing eight different shapes: horseshoe shape with flatbed, horseshoe shape with invert, circular shape, semicircular shape with flatbed, semicircular shape with invert, box shape, rectangular shape, and semi-elliptical shape. These shapes were evaluated for three support system modes which were related to (a) a tunnel without any support, (b) a tunnel with shotcrete support, and (c) a tunnel with shotcrete along with rock bolt support. Thereafter, the study was extended to evaluate the effect of behavioral differences between asymmetric and symmetric widening of the tunnel with respect to the variation of different tunnel parameters including different rock types, elastic moduli (E), horizontal to vertical stress ratios (K), overburden heights over the tunnel (H), and geological strength index (GSI) values.
This study provides a sound understanding of the planning of asymmetric or symmetric tunnel or cavern widening using NATM with various shapes in a variety of geological conditions under different in situ stress conditions. Hydropower tunnels can also be widened under the concept elucidated in this study to accommodate more water through them. Nevertheless, the risk, cost, and uncertainties will be mitigated, thereby increasing the comfort in the planning and safety of future widening of any tunnel or cavern.

2. Engineering Overview and Numerical Methods

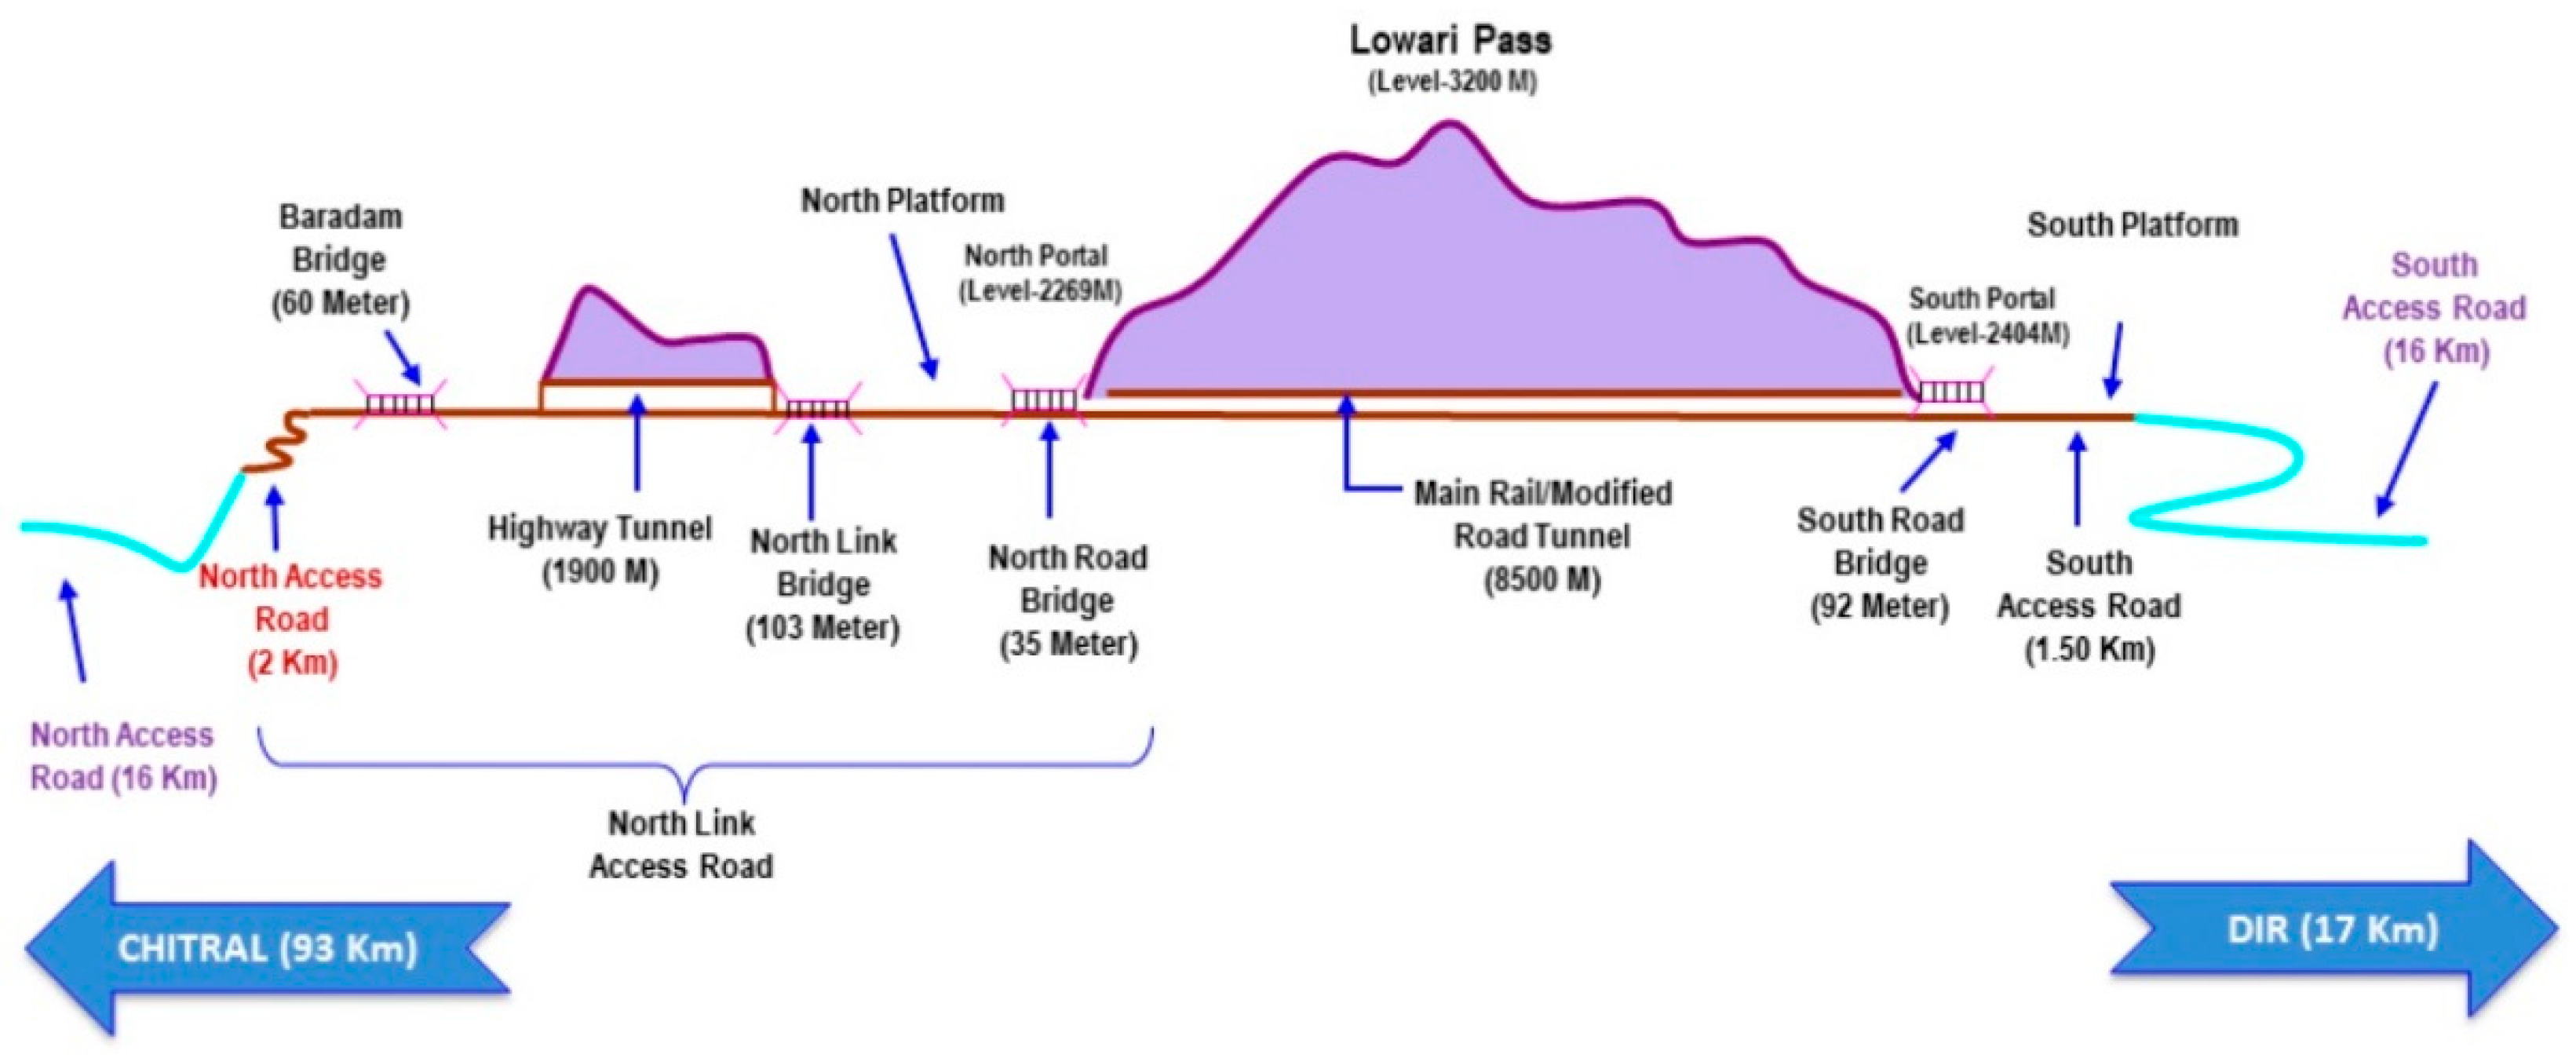
2.1. Lowari Tunnel Project

Lowari pass is situated in Pakistan at a height of 3200 m above the Mean Sea Level (MSL) at the junction of the Chitral and Dir districts. It is generally covered with snow for half of the year, which prevents the access of people of the Chitral Valley to the rest of country. To provide all weather link access to the people of the valley, the Lowari tunnel project was initiated in 2005 with a length of 8.5 km based on the concept of the piggy back rail tunnel. The project layout is depicted in Figure 1.
Excavation of the tunnel was carried out using NATM [23]. Excavation of the horseshoe tunnel profile with a cross section area of 45 m2 was carried out in early 2006, wherein excavation of the 8.5 km tunnel was achieved in January 2009 with a primary support system including rock bolts, wire mesh, a lattice girder, and shotcrete, as per the Excavation Classes (EC) defined on the basis of the Rock Mass Behavior Type (RBT) in NATM.

2.1.1. Geology of the Site

The project site is situated in the Kohistan Complex, which is duly positioned between the Eurasian Continental and Indian Plates [24,25]. The most dominant rock present at the site is Granite rock mass interbedded with Gneiss, Gabbro, and Granodiorite [26].

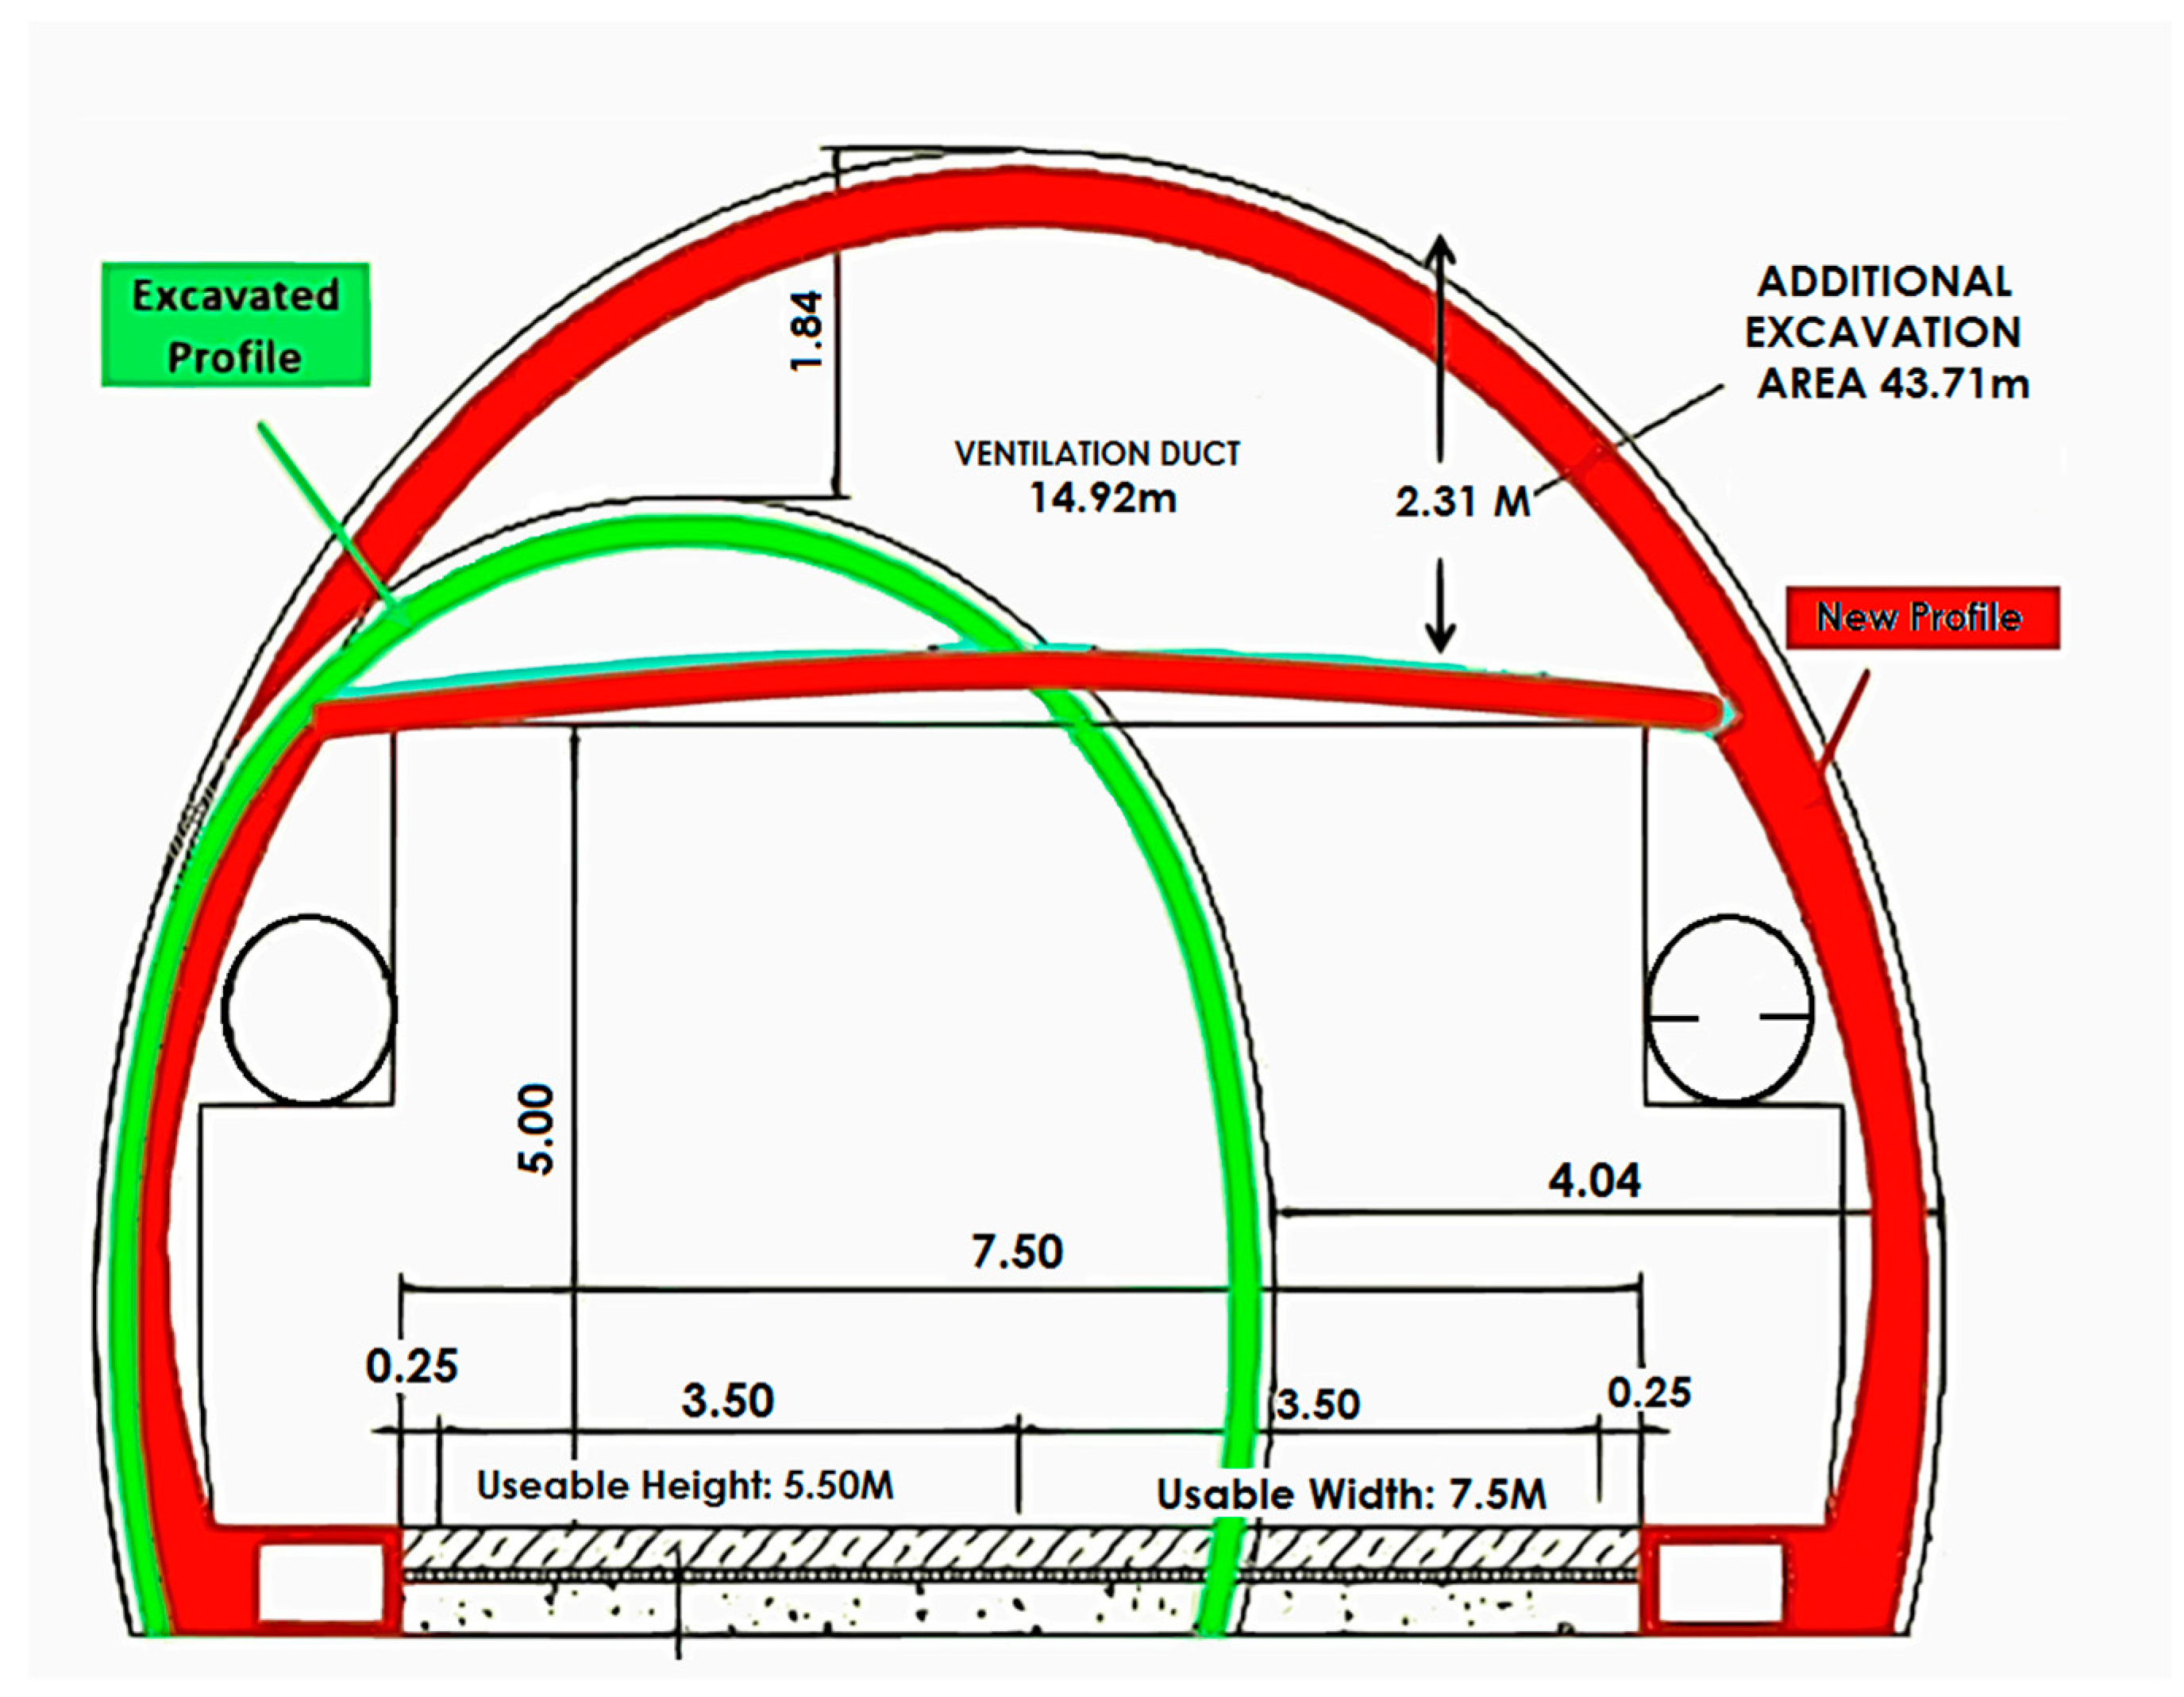
2.1.2. Conversion of Rail to Road Tunnel

As the tunnel was scheduled for secondary concrete lining during the year 2009, the regulatory authority of the project decided to convert the rail tunnel profile into a road tunnel in order to develop a two-lane road through the tunnel which would accommodate the traffic that was anticipated from the Central Asian States once the highway was extended. At the time, it was presumed that the tunnel widening could easily be carried out, since no secondary lining was installed for the original tunnel concept. Thus, asymmetric widening of the tunnel was carried out to get a total excavated area of 85 m2 to accommodate two lanes of 3.5 m road with walkways. The initial tunnel profile and widening pattern are shown in Figure 2.

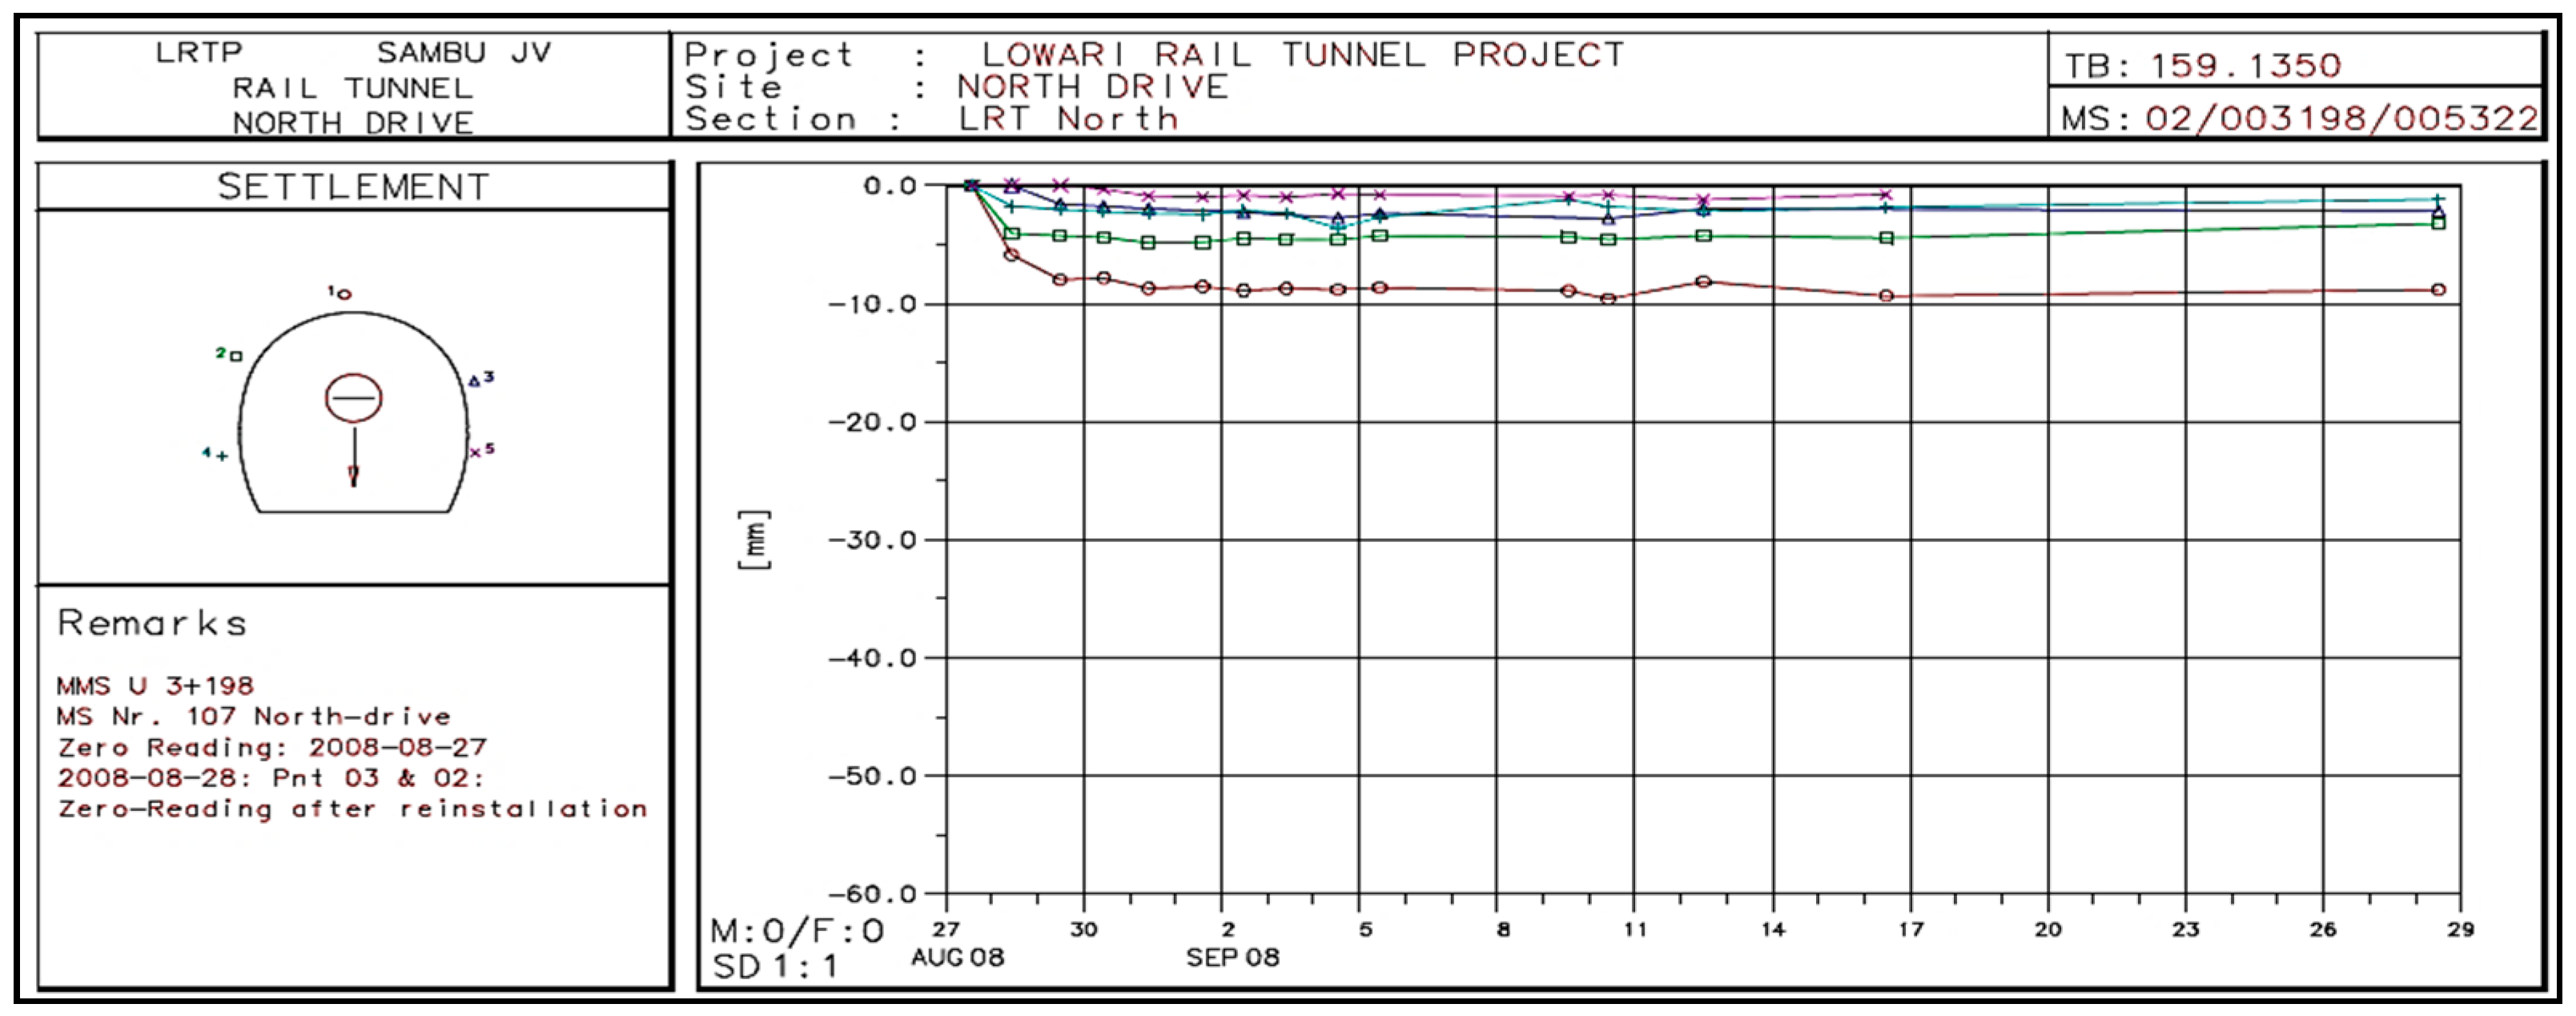
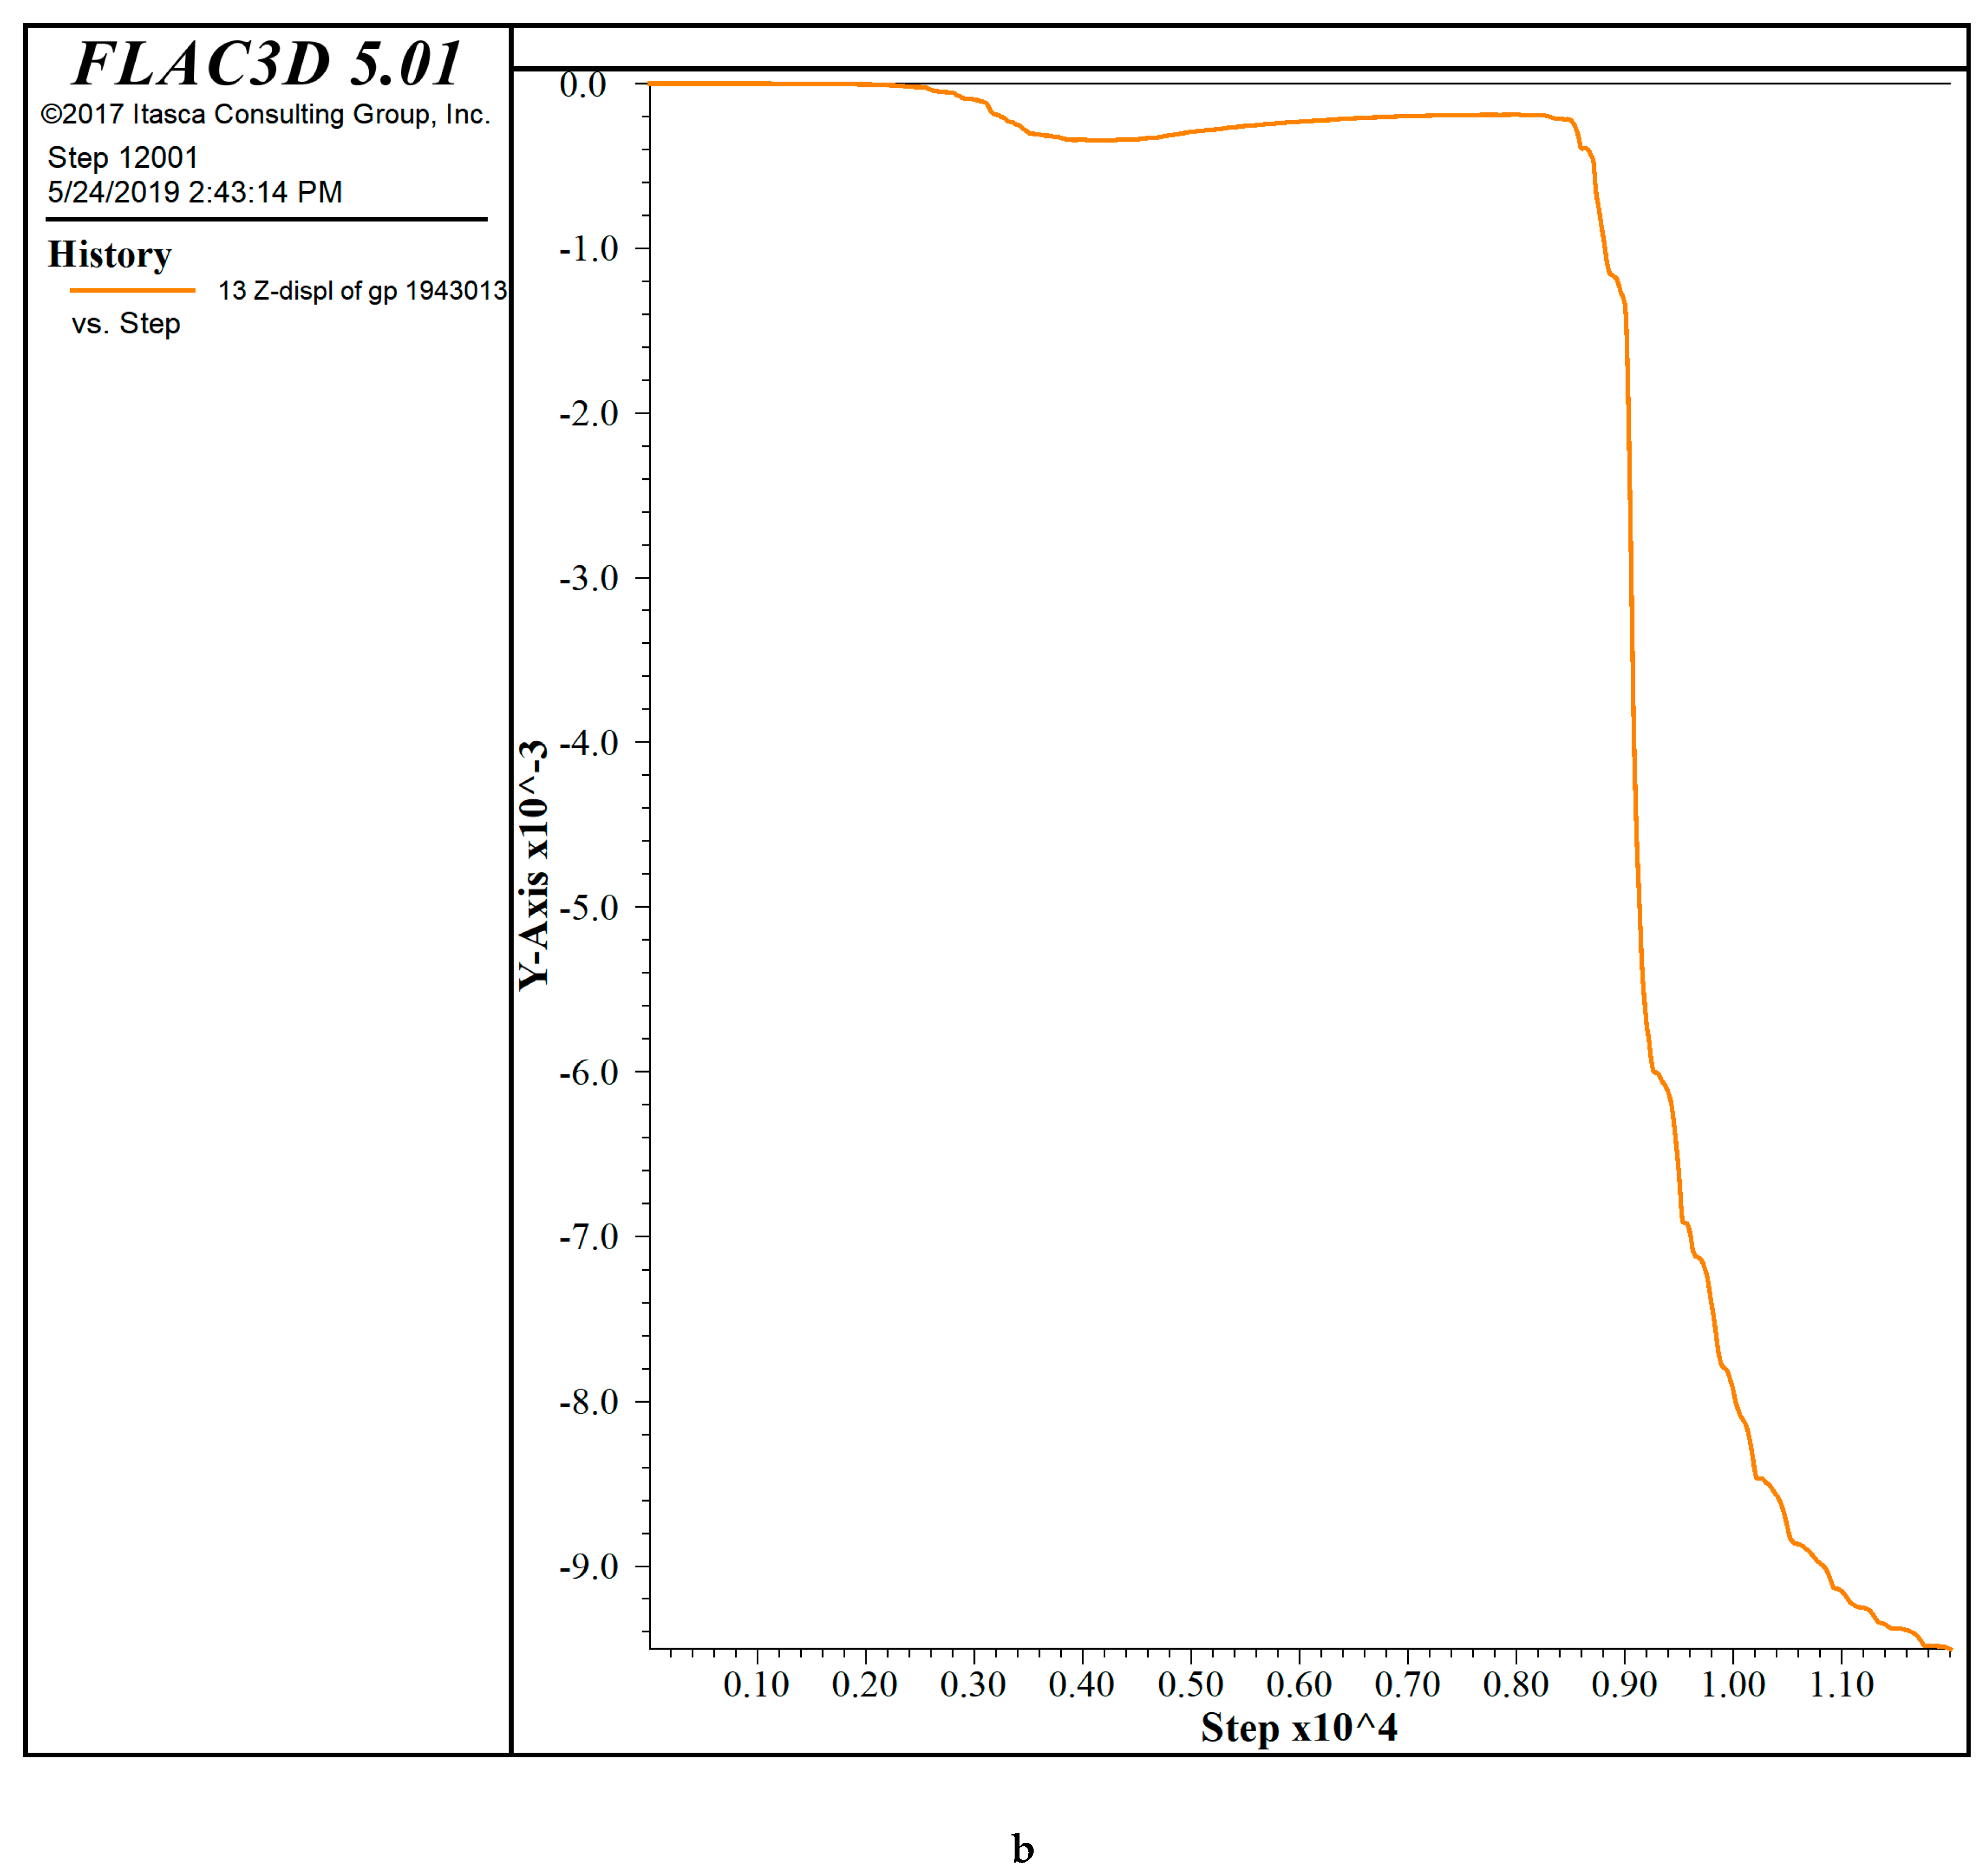
2.2. Correlation of Tunnel Deformation Obtained through In Situ Monitoring and Numerical Simulation

The initial profile used for the Lowari tunnel was a horseshoe shape. The analytical method used for calculating the deformation at the periphery of a tunnel cavity as well as the deformation far away from the tunnel for a circular tunnel under homogeneous, continuous, and isotropic conditions was proposed by Kirsch [27]. In this study, the tunnel stress analysis and deformation were not addressed for noncircular tunnels, particularly for horseshoe shaped tunnels. However, the deformation of a noncircular profile tunnel was reported in [6] using the shape function, which is not frequently used in the literature.
In this respect, the association of deformation at a horseshoe shaped tunnel, as opted for in the Lowari tunnel, was made between actual tunnel monitoring at the project site and tunnel deformation using numerical simulation through the Finite Difference Technique using FLAC 3D [22], given the in situ and parametric conditions of the Lowari tunnel.
The maximum overburden of 1250 m was recorded at tunnel chainage 5 + 322, which was considered for the analysis in this study. This section encompassed medium to strong Granite Gneiss with intercalation of Amphibolite and moderate discontinuity spacing. The in situ vertical stress was calculated based on the following empirical relation [28]:
σ v   =   0.027   Z .
Since the field test for determining horizontal stresses was not carried out at the project site as well as in its near vicinity, no reliable data were available. Therefore, the extensively used general equations were used to calculate the horizontal to vertical stresses ratio as proposed by Sheorey [29] and duly reported in different studies [30,31]. In this regard, the horizontal to vertical stress ratio “K” [29] is given in Equation (2), which was established through the elasto-static thermal stress model of the Earth for estimating crustal stresses considering the variation of elastic constants, density, and thermal expansion coefficients using the Earth’s crust and mantle. This analytical solution for determining the K value is in correlation with the field observation data [28] was established by measuring in situ stresses around the world. In the absence of field test results, the model given below is a useful basis for estimating horizontal in situ stresses:
K = 0.25   +   7 E h [ 0.001   +   1 / Z ] .
The values of Eh and Ei were assumed to be equal owing to isotropic nature of rock, whereas horizontal stress can be calculated through Equation (3):
σ h = K   σ v .
As granite gneiss rock was encountered at the selected section of Lowari tunnel, the bulk and shear moduli were calculated from the deformation modulus, which was derived from GSI [32]. The equation proposed by Hoek and Diederichs [32] was adopted for calculating the deformation modulus (Erm) of rock mass:
E r m   =   E i   [ 0.02   + 1 D 2 ( 1 + e ( 60 + 15 D G S I 11 ) ) ] ,
whereas the values of GSI were selected with respect to the rock site conditions from the general principles and guidelines [33]. The different minor discontinuities including the fissures, fractures, joints, and major discontinuities like folds and faults were also considered in rock mass through the GSI [32]. “Ei” was calculated from the following equation:
E i   =   M R · σ c i .
The value of MR for different rock types was reported by Deere [34], whereas the value of “σci” was taken as 150 MPa in moderately to high strength state rock, which was an approximate value adapted from the Geotechnical Interpretative Report of Lowari tunnel for granite gneiss rock [26]. The Poisson’s Ratio (ʋ) was duly adapted from [35], whereas the Bulk Modulus (K) and Shear Modulus (G) values were calculated from Equations (6) and (7), respectively [35,36]:
K =   E r m 3 ( 1 2 υ )
  G =   E r m 2 ( 1 + υ ) .
The rock strata at the section under study, i.e., at 5 + 322 chainage, comprised Granite Gniess with two to three joint sets. Accordingly, the rock mass parameters are defined in Table 1, which were calculated using Equations (1)–(5) given above on the basis of the site condition. The GSI value was obtained by correlating the geological face mapping made at the tunnel face during excavation with the GSI chart [37], while the Hoek–Brown parameters were based on empirical relations [38]. As the tunnel was excavated by controlled blasting of excellent quality, the value of the Disturbance Factor (D) was taken as D = 0 [32].
The validation of the assumption for the in situ stress, as calculated with Equations (2) and (3), was also confirmed through back analysis. In this regard, the model was created in FLAC 3D, as shown in Figure 3a. The grid was generated such as to adjust and shape the mesh to fit the physical profiles of the initial and widened tunnels. Finer mesh was generated around the tunnel cavity which gradually increased toward the model boundaries to get a zone aspect ratio close to unity for more accurate results. The deformation was recorded at the crown of a tunnel in the Z-axis. The deformation result obtained through numerical simulation is plotted in Figure 3b and tabulated in Table 2. However, the actual deformation monitored at the crown of the tunnel during excavation of the tunnel at a chainage of 5 + 322 is mentioned in Figure 4 and reported in Table 2.
The analytical and numerical results revealed a difference in settlement/deformation of 0.15 mm at the crown of the tunnel for which the percent error was around 1.85%. Thus, it was found that both results are similar, and it can be concluded that it was appropriate to use the FLAC 3D tool in this study. Furthermore, it was also concluded that the equations used for calculating horizontal stresses were commensurate with the site conditions.

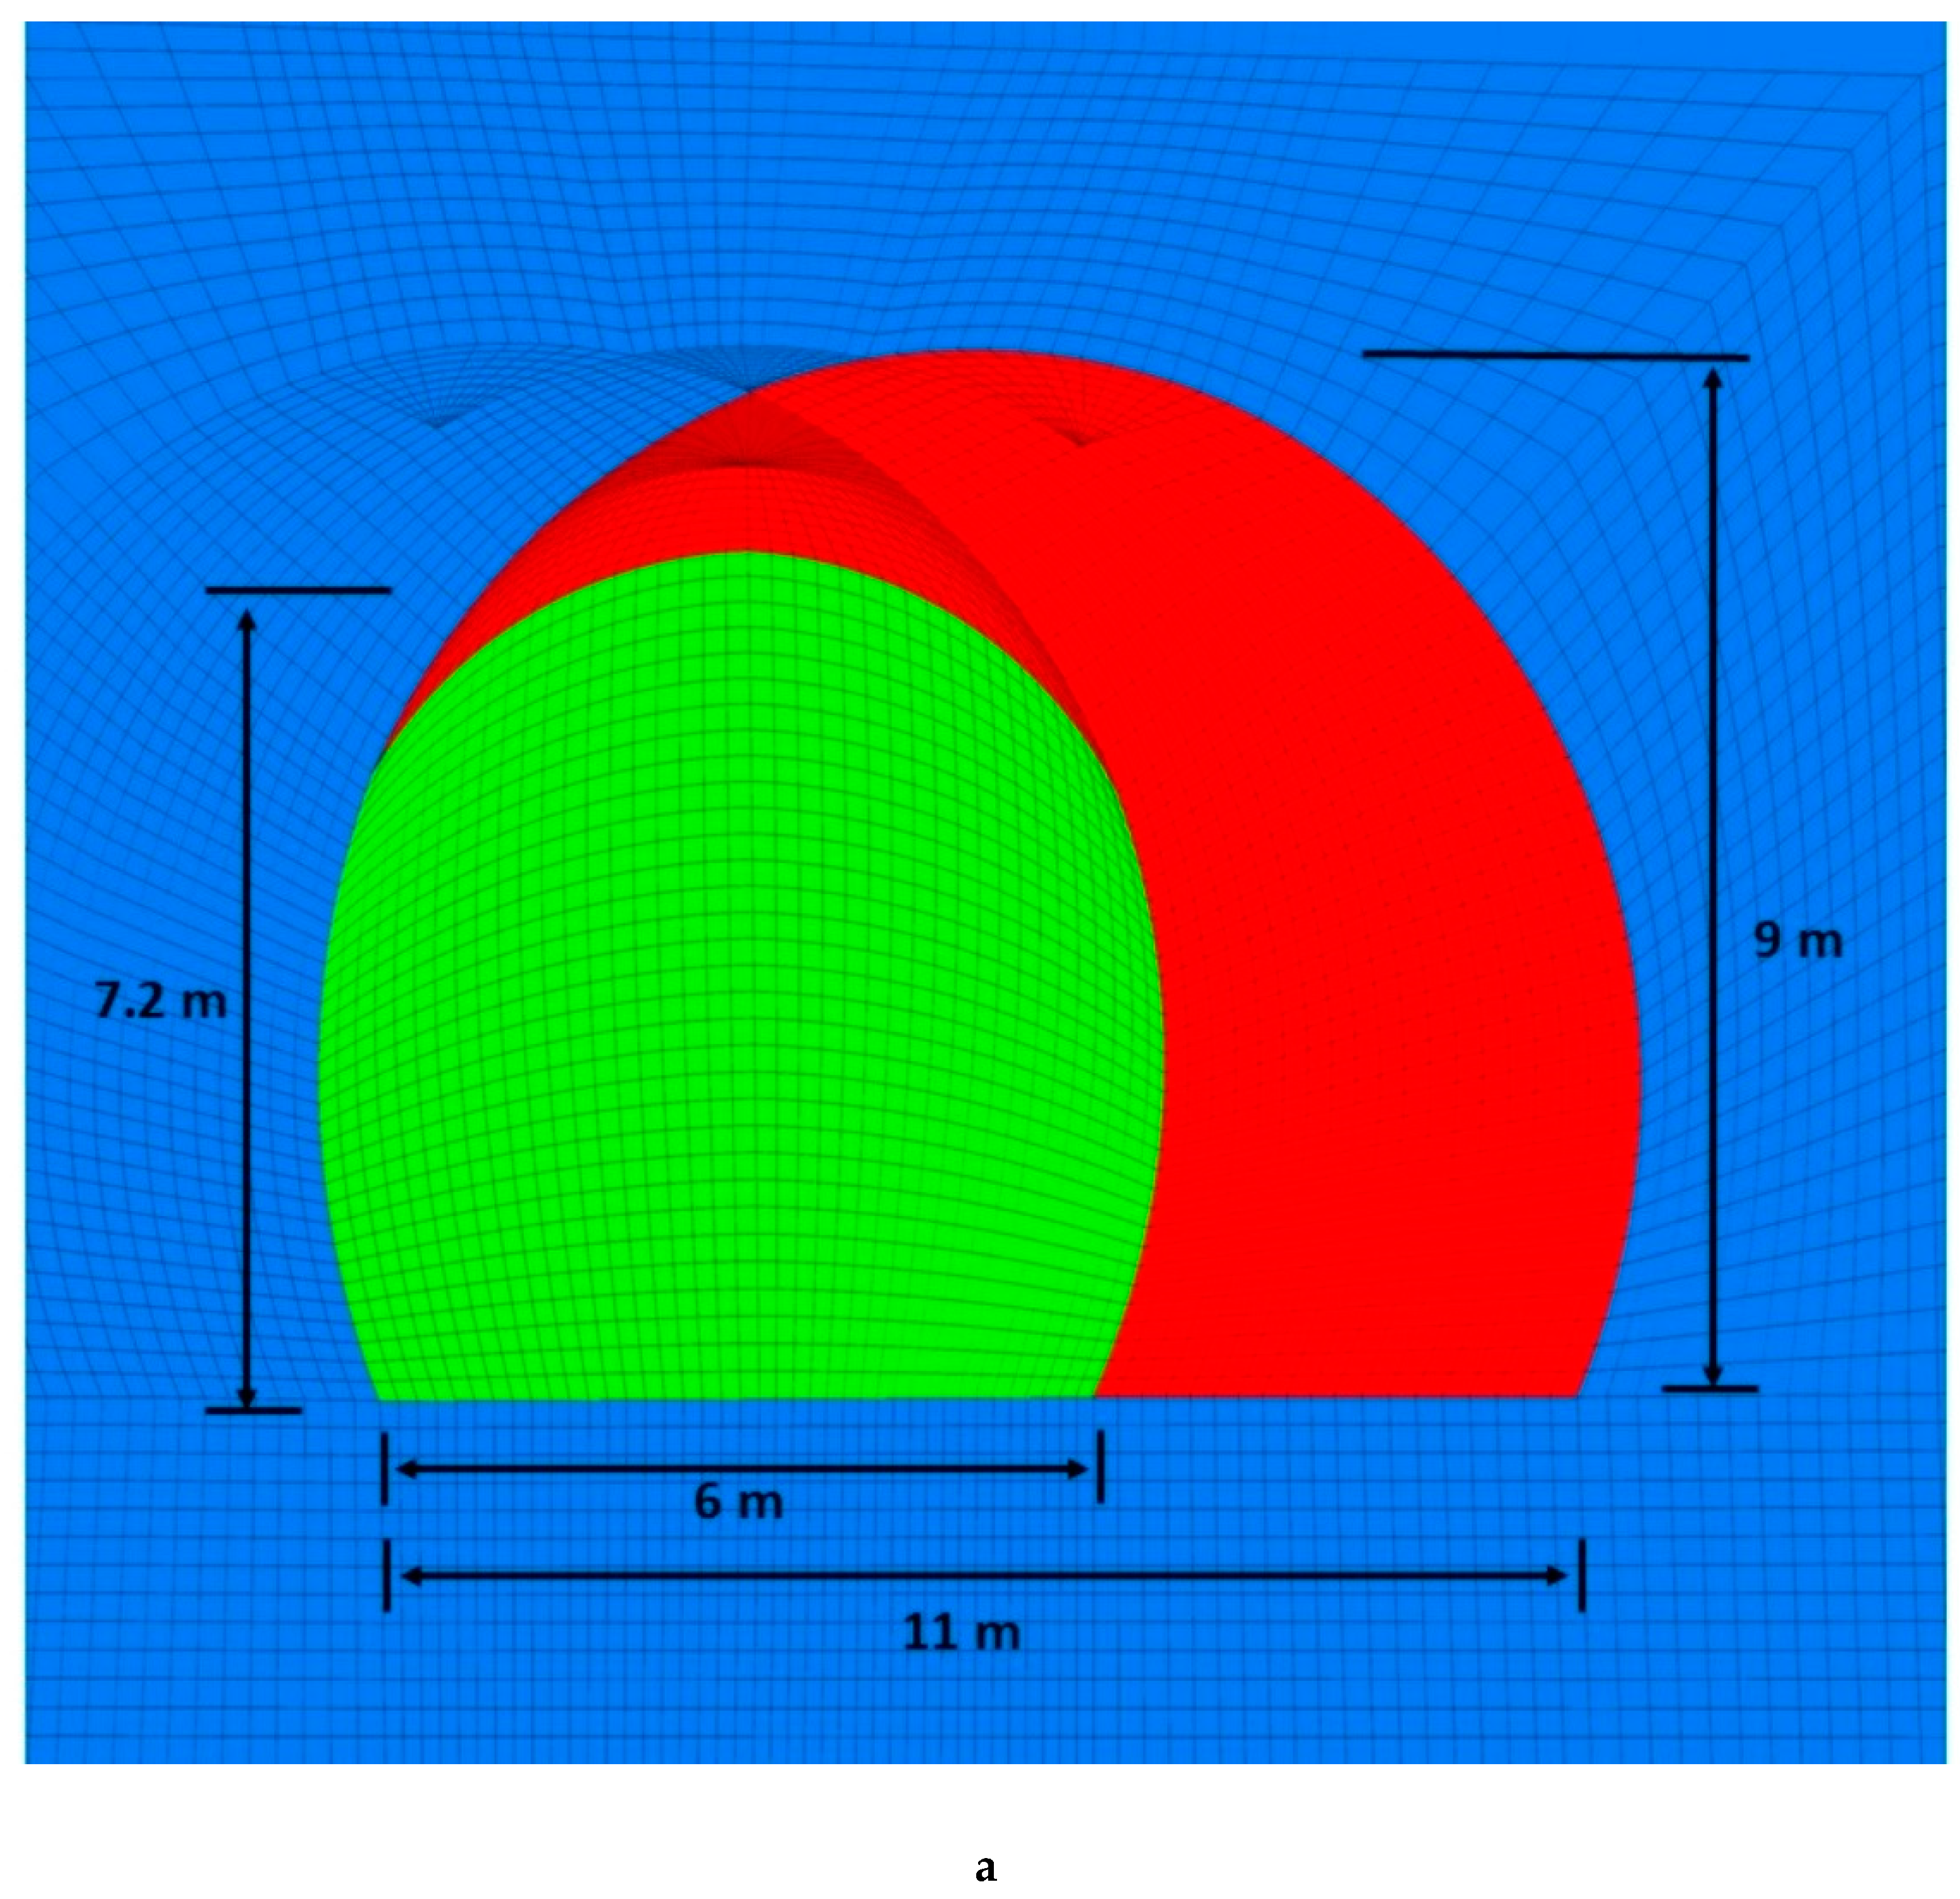
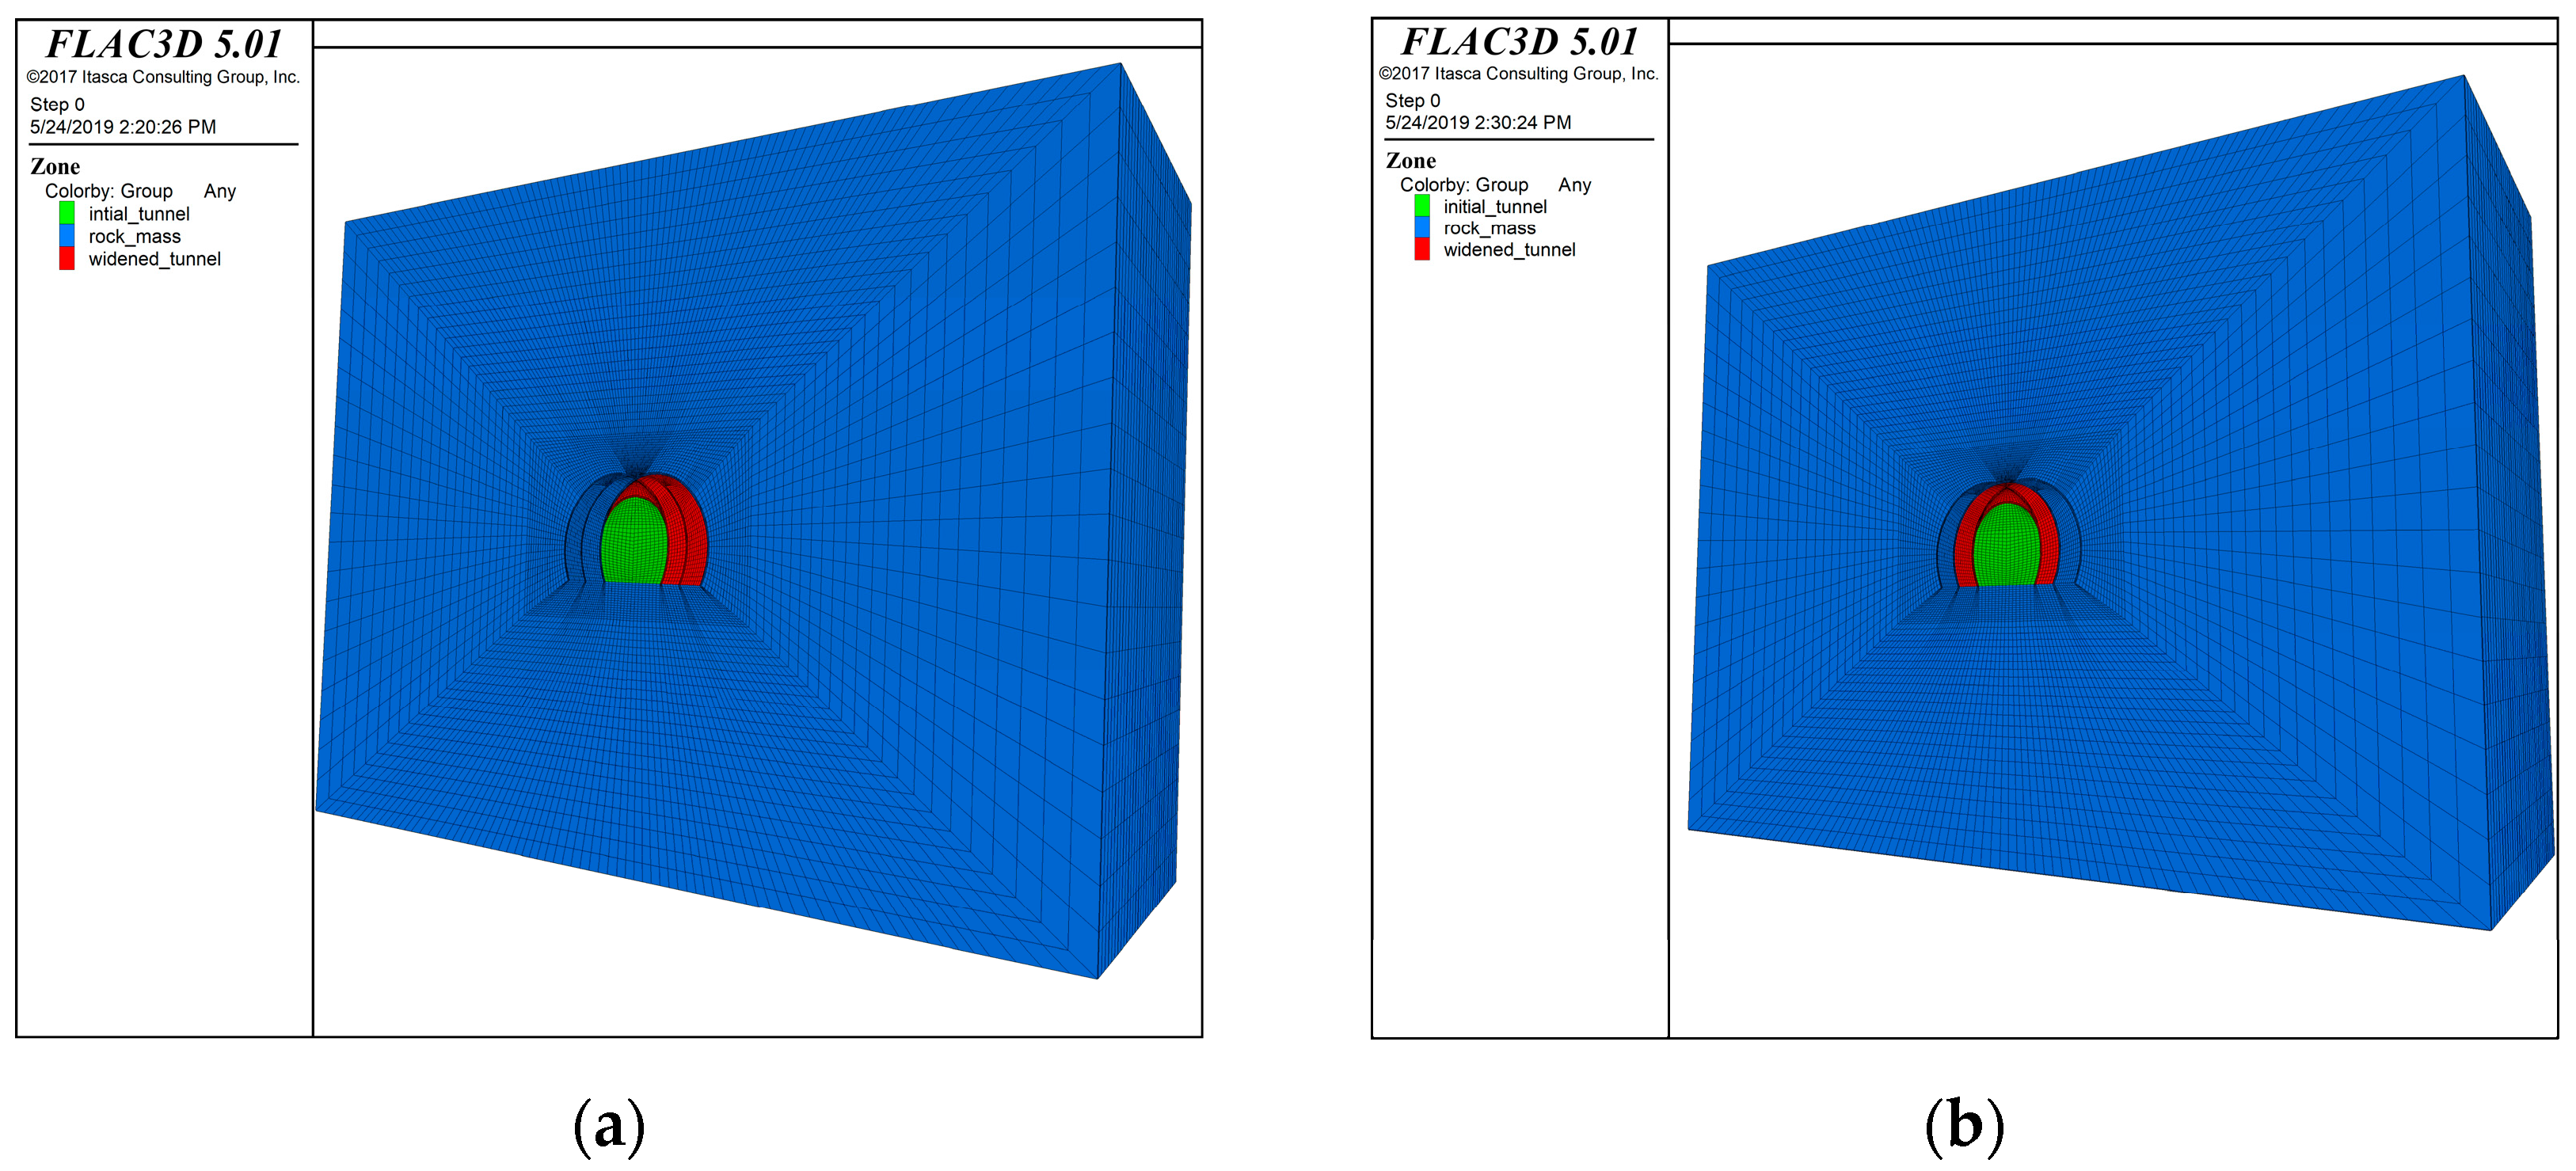
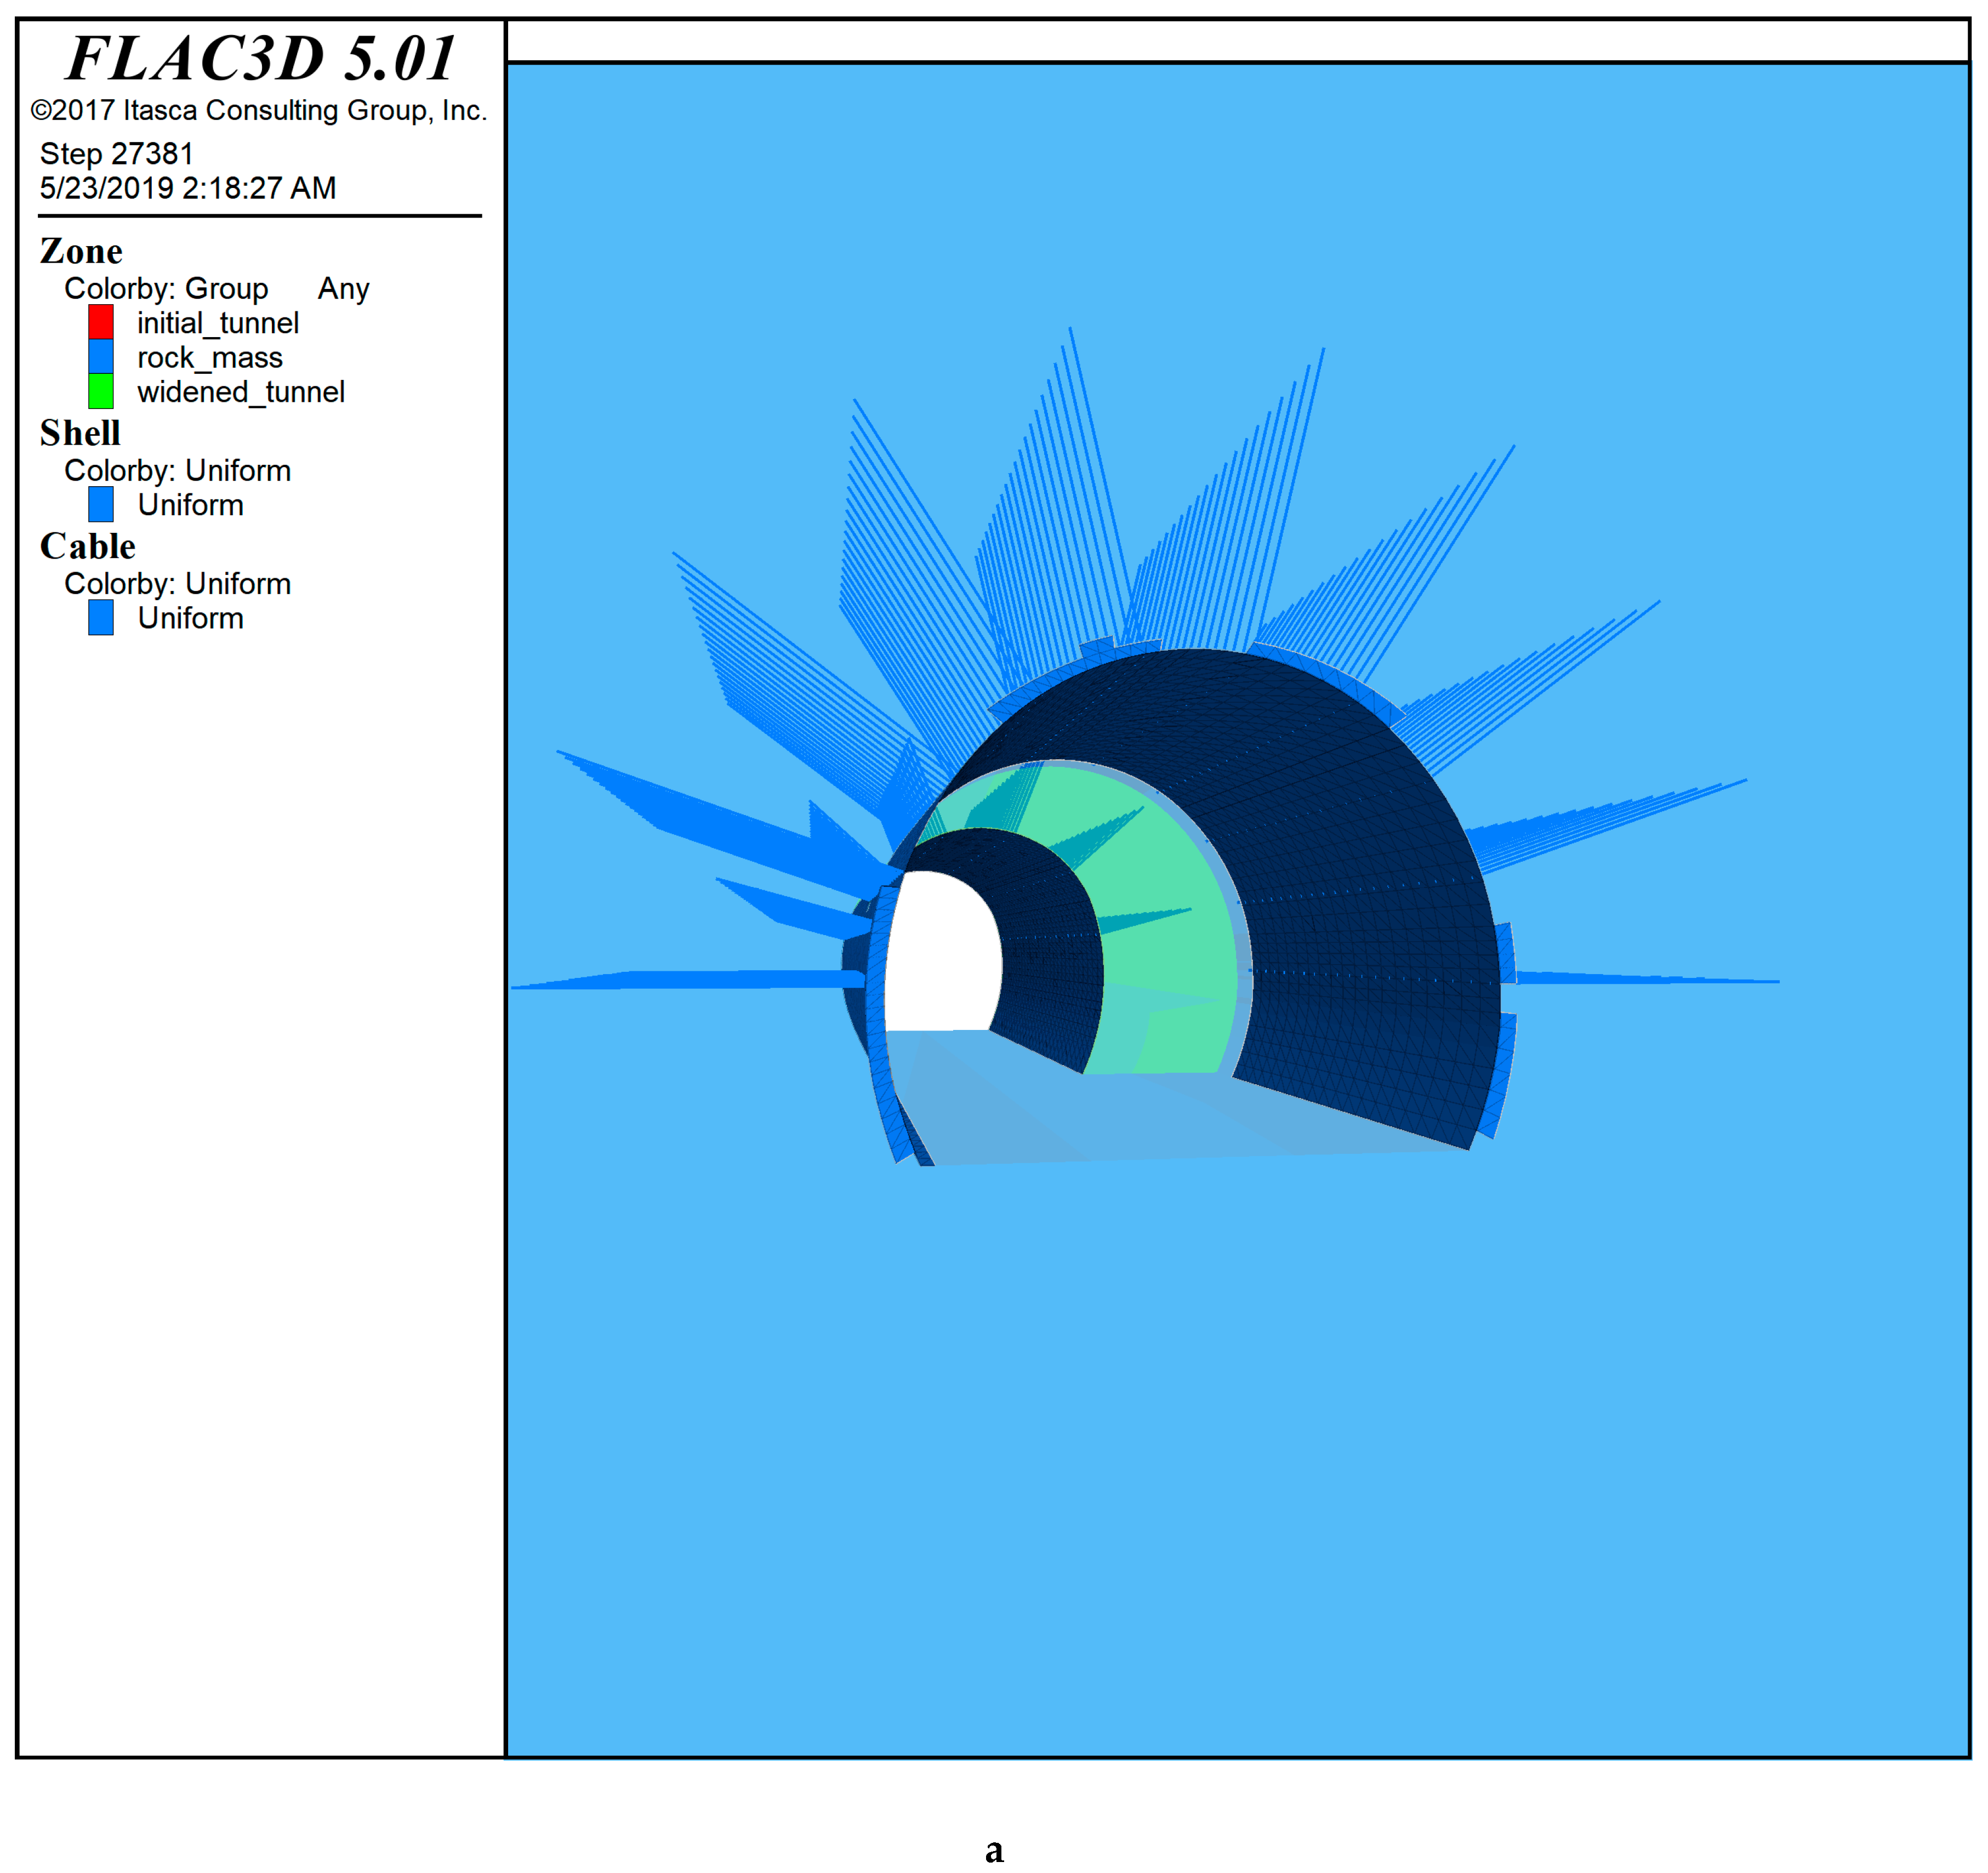
2.3. Initial Model Preparation for Asymmetric and Symmetric Widening

The horseshoe tunnel was modelled first for the simulation of both asymmetric and symmetric tunnel deformation. The Lowari tunnel profile was first developed separately for asymmetric and symmetric widening in AutoCAD as a DXF file. Afterwards, the profile in the DXF file was imported into FLAC3D [22] and the model was simulated with all parameters assigned as per the parameters and in situ stresses encountered at the project site, as stipulated in Table 1 and Table 2. Both models were analyzed with continuum modelling wherein the discontinuities recorded from the site conditions encountered at the Lowari tunnel were modelled as elements [40,41].
The model was executed without any support system to check the behavior of the rock mass in an in situ state without any internal pressure. The assigned in situ stresses and parameters were the same for both models. The boundaries of the model were extended up to six times the radius of the tunnel from all four sides under plane strain while the length of 30 m was extended along the tunnel in the longitudinal direction (y-direction). The tunnel models are shown in Figure 5.
Each excavation drive was considered for a 3 m length with full face excavation; thus, excavation of the initial and widened tunnels was simulated separately for 10 advancement drives. A time step of 500 was taken for each excavation drive; thus, a total of 5000 steps were taken for the initial small tunnel excavation, and the same steps were considered for the excavation of the widened tunnel with a cumulative 10,000 time steps.
The monitoring points were selected at the midway point of the tunnel in the longitudinal direction at 15 m from the start of the tunnel. The history points were recorded at four prominent locations at the crown, right, and left walls along the spring line and at the invert of both the initial and widened tunnels, as shown in Figure 6. The final deformation was recorded at the history points after the excavation of both small and large tunnels at the completion of 10,000 time steps. The model was prepared in such a way that the initial small tunnel excavation and the widening of tunnel, either asymmetric or symmetric, were simulated in continuous models so that the behavior of the rock mass around the tunnel cavity could be studied independently.

3. Simulation of Asymmetric and Symmetric Widening Models

3.1. Different Tunnel Modes for Evaluation

Three different tunnel excavation and support system modes were considered, where the first mode was developed without any tunnel support. The second mode was developed with shotcrete of 200 mm thickness, and the third mode was developed with shotcrete of 200 mm with rock bolts of 4 m length in a 2 × 3 m grid spacing. The schematic diagrams of three different tunnel excavation modes with the horseshoe shape are shown in Table 3.

3.2. Different Tunnel Shapes for Evaluation

The study was extended to eight tunnel shapes, as assembled in Table 4, to evaluate tunnel deformation under asymmetric and symmetric widening conditions. All three tunnel support modes shown in Table 3 were analyzed using the specific project in situ conditions, as tabulated in Table 1 and Table 2 under FDM. The width of all of the shapes considered was equal to that of the horseshoe profile adopted in the Lowari tunnel. The monitoring points of different tunnel shapes were the same for each tunnel, as illustrated in Figure 6, such that the deformation can easily be compared between the asymmetric and symmetric widening approaches.

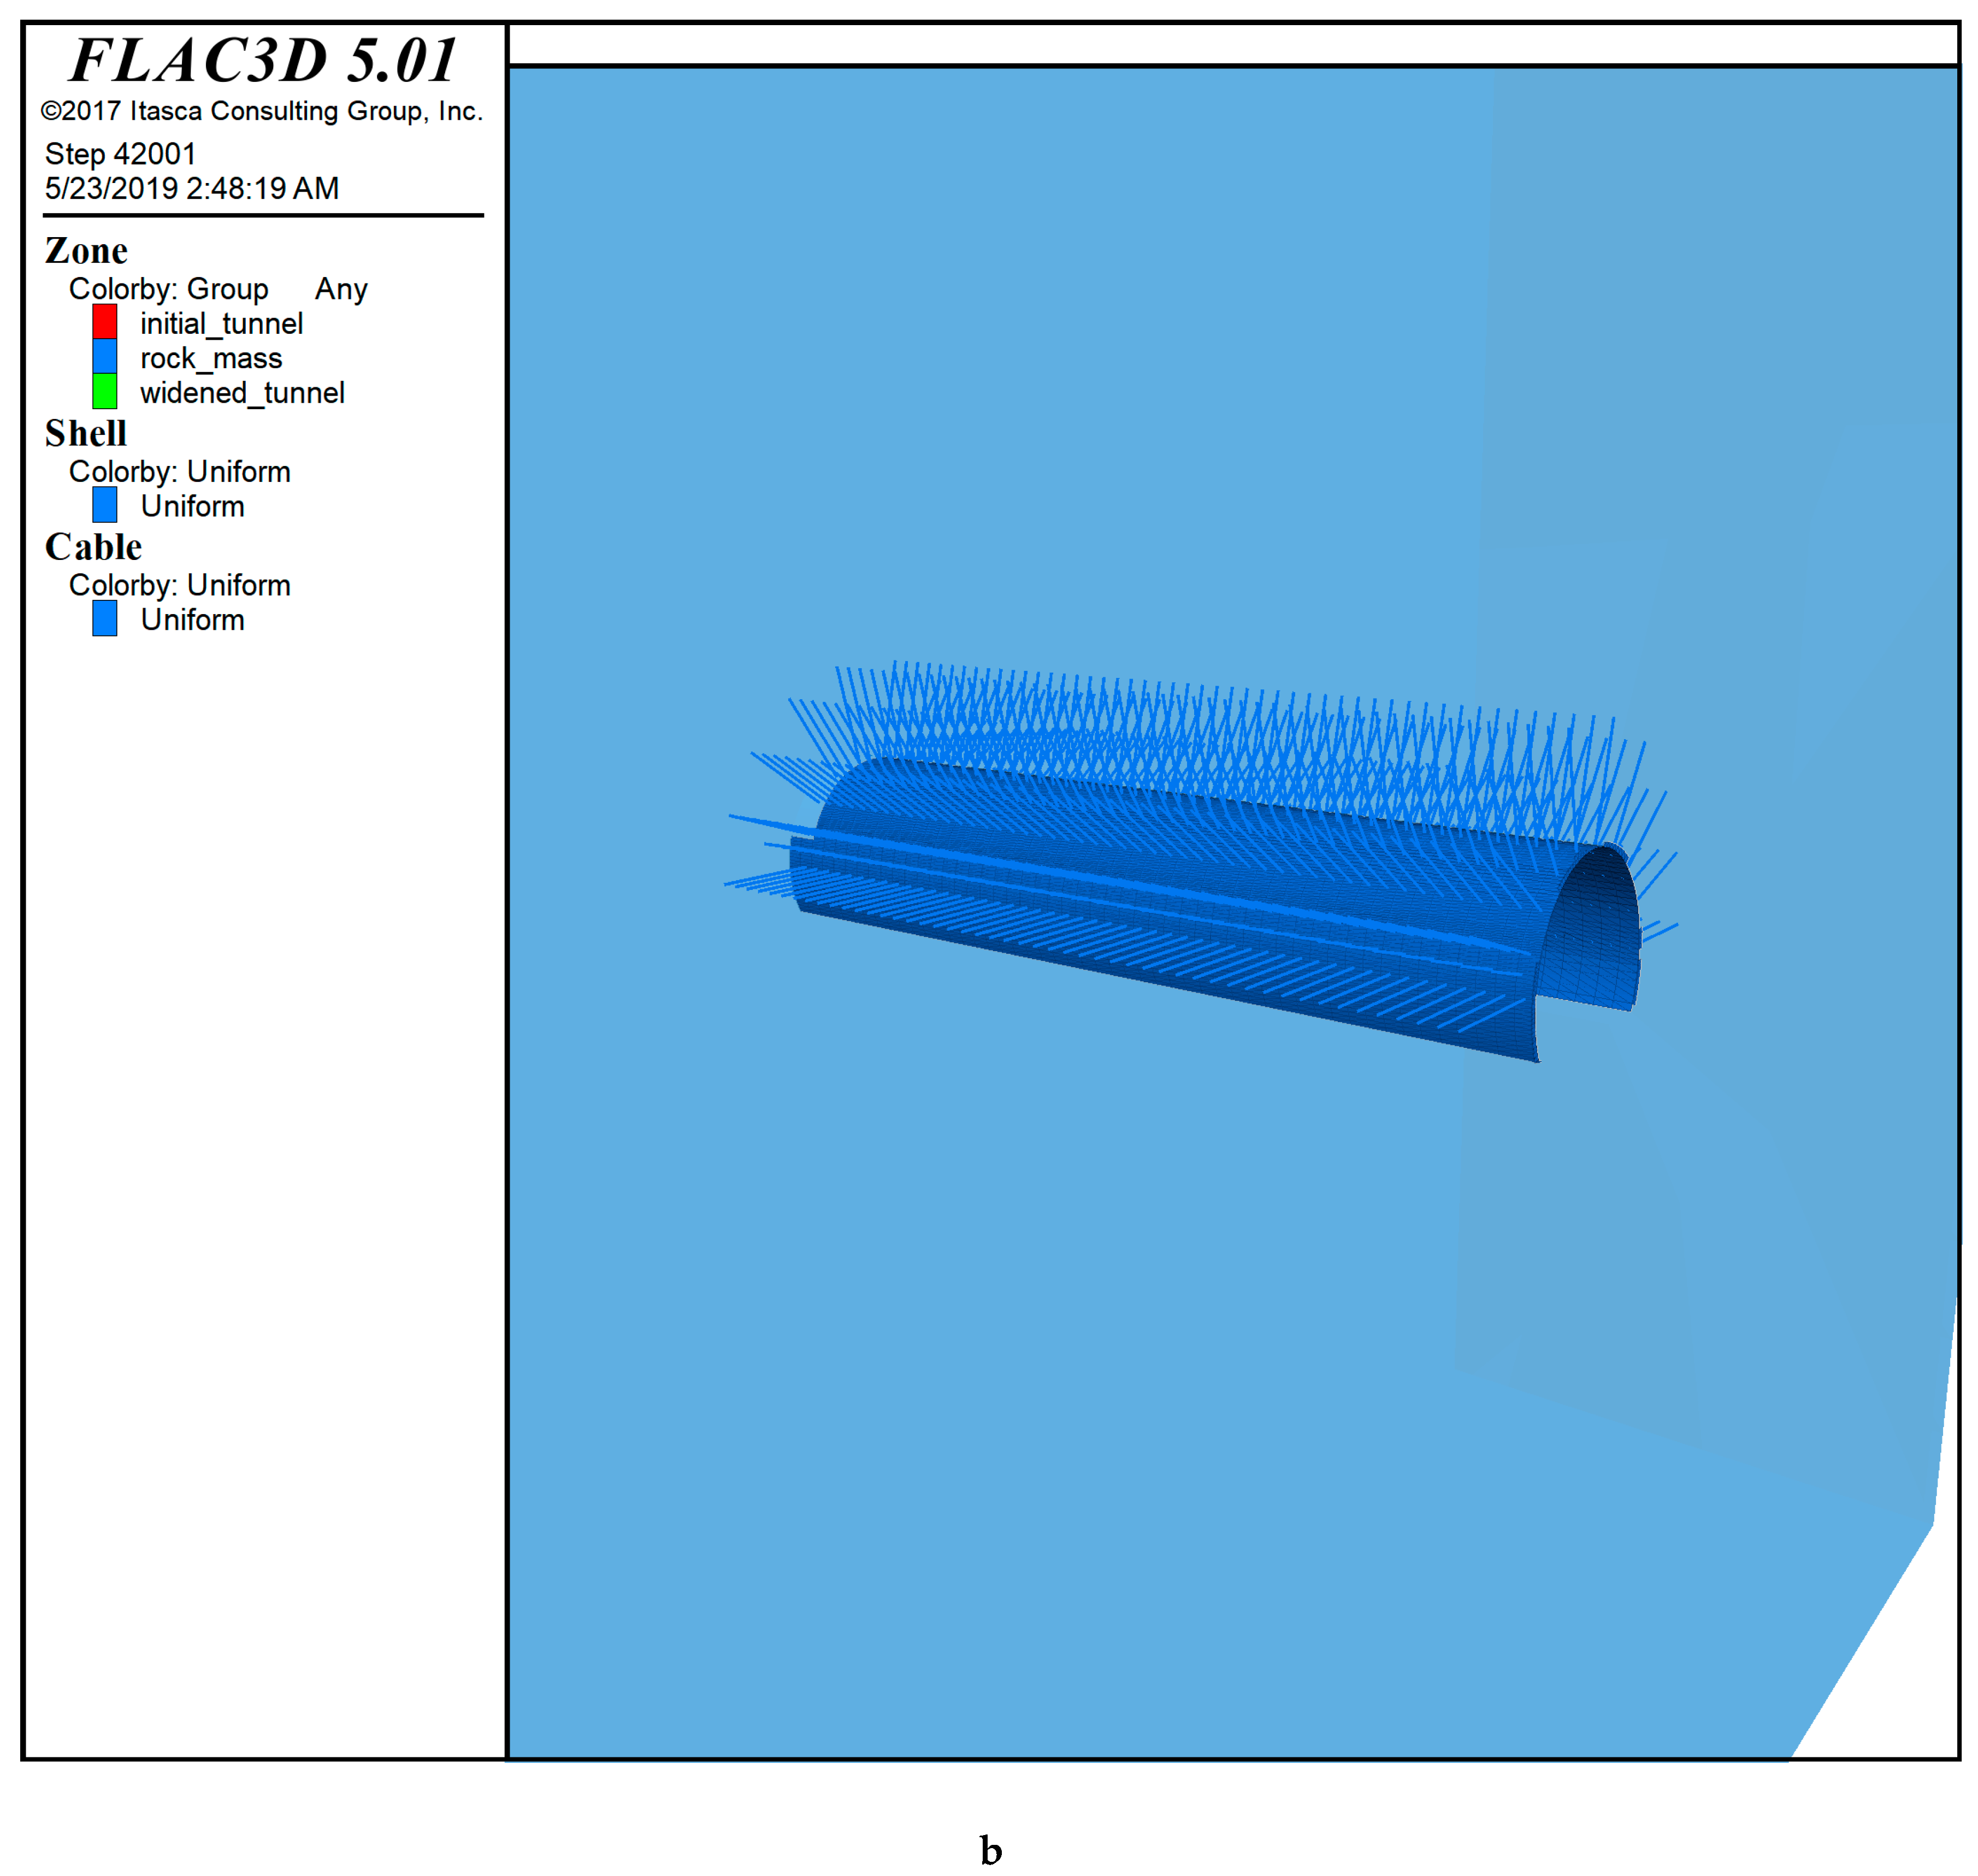
3.3. Models Geometry and Tunnel Support Characteristics

The models for different tunnel shapes, as stated in Table 4, were developed with the boundary extended up to six times the diameter of the tunnel in each direction in plane symmetry, whereas the model was extended up to 30 m length in the longitudinal direction. The vertical and horizontal constraints were applied to the model boundary, while the horizontal, vertical, and longitudinal stresses were applied to the model with the values stated in Table 2. The monitoring point was adopted at the crown of the widened tunnel at the midway of the longitudinal direction, i.e., 15 m from the face of the tunnel and the overburden depth over the tunnel model was considered as 1250 m, similar to that of the Lowari tunnel with the stresses stated in Table 2. The pictorial view of the models is shown in Figure 7, whereas the tunnel support characteristics are defined in Table 5.

4. Results

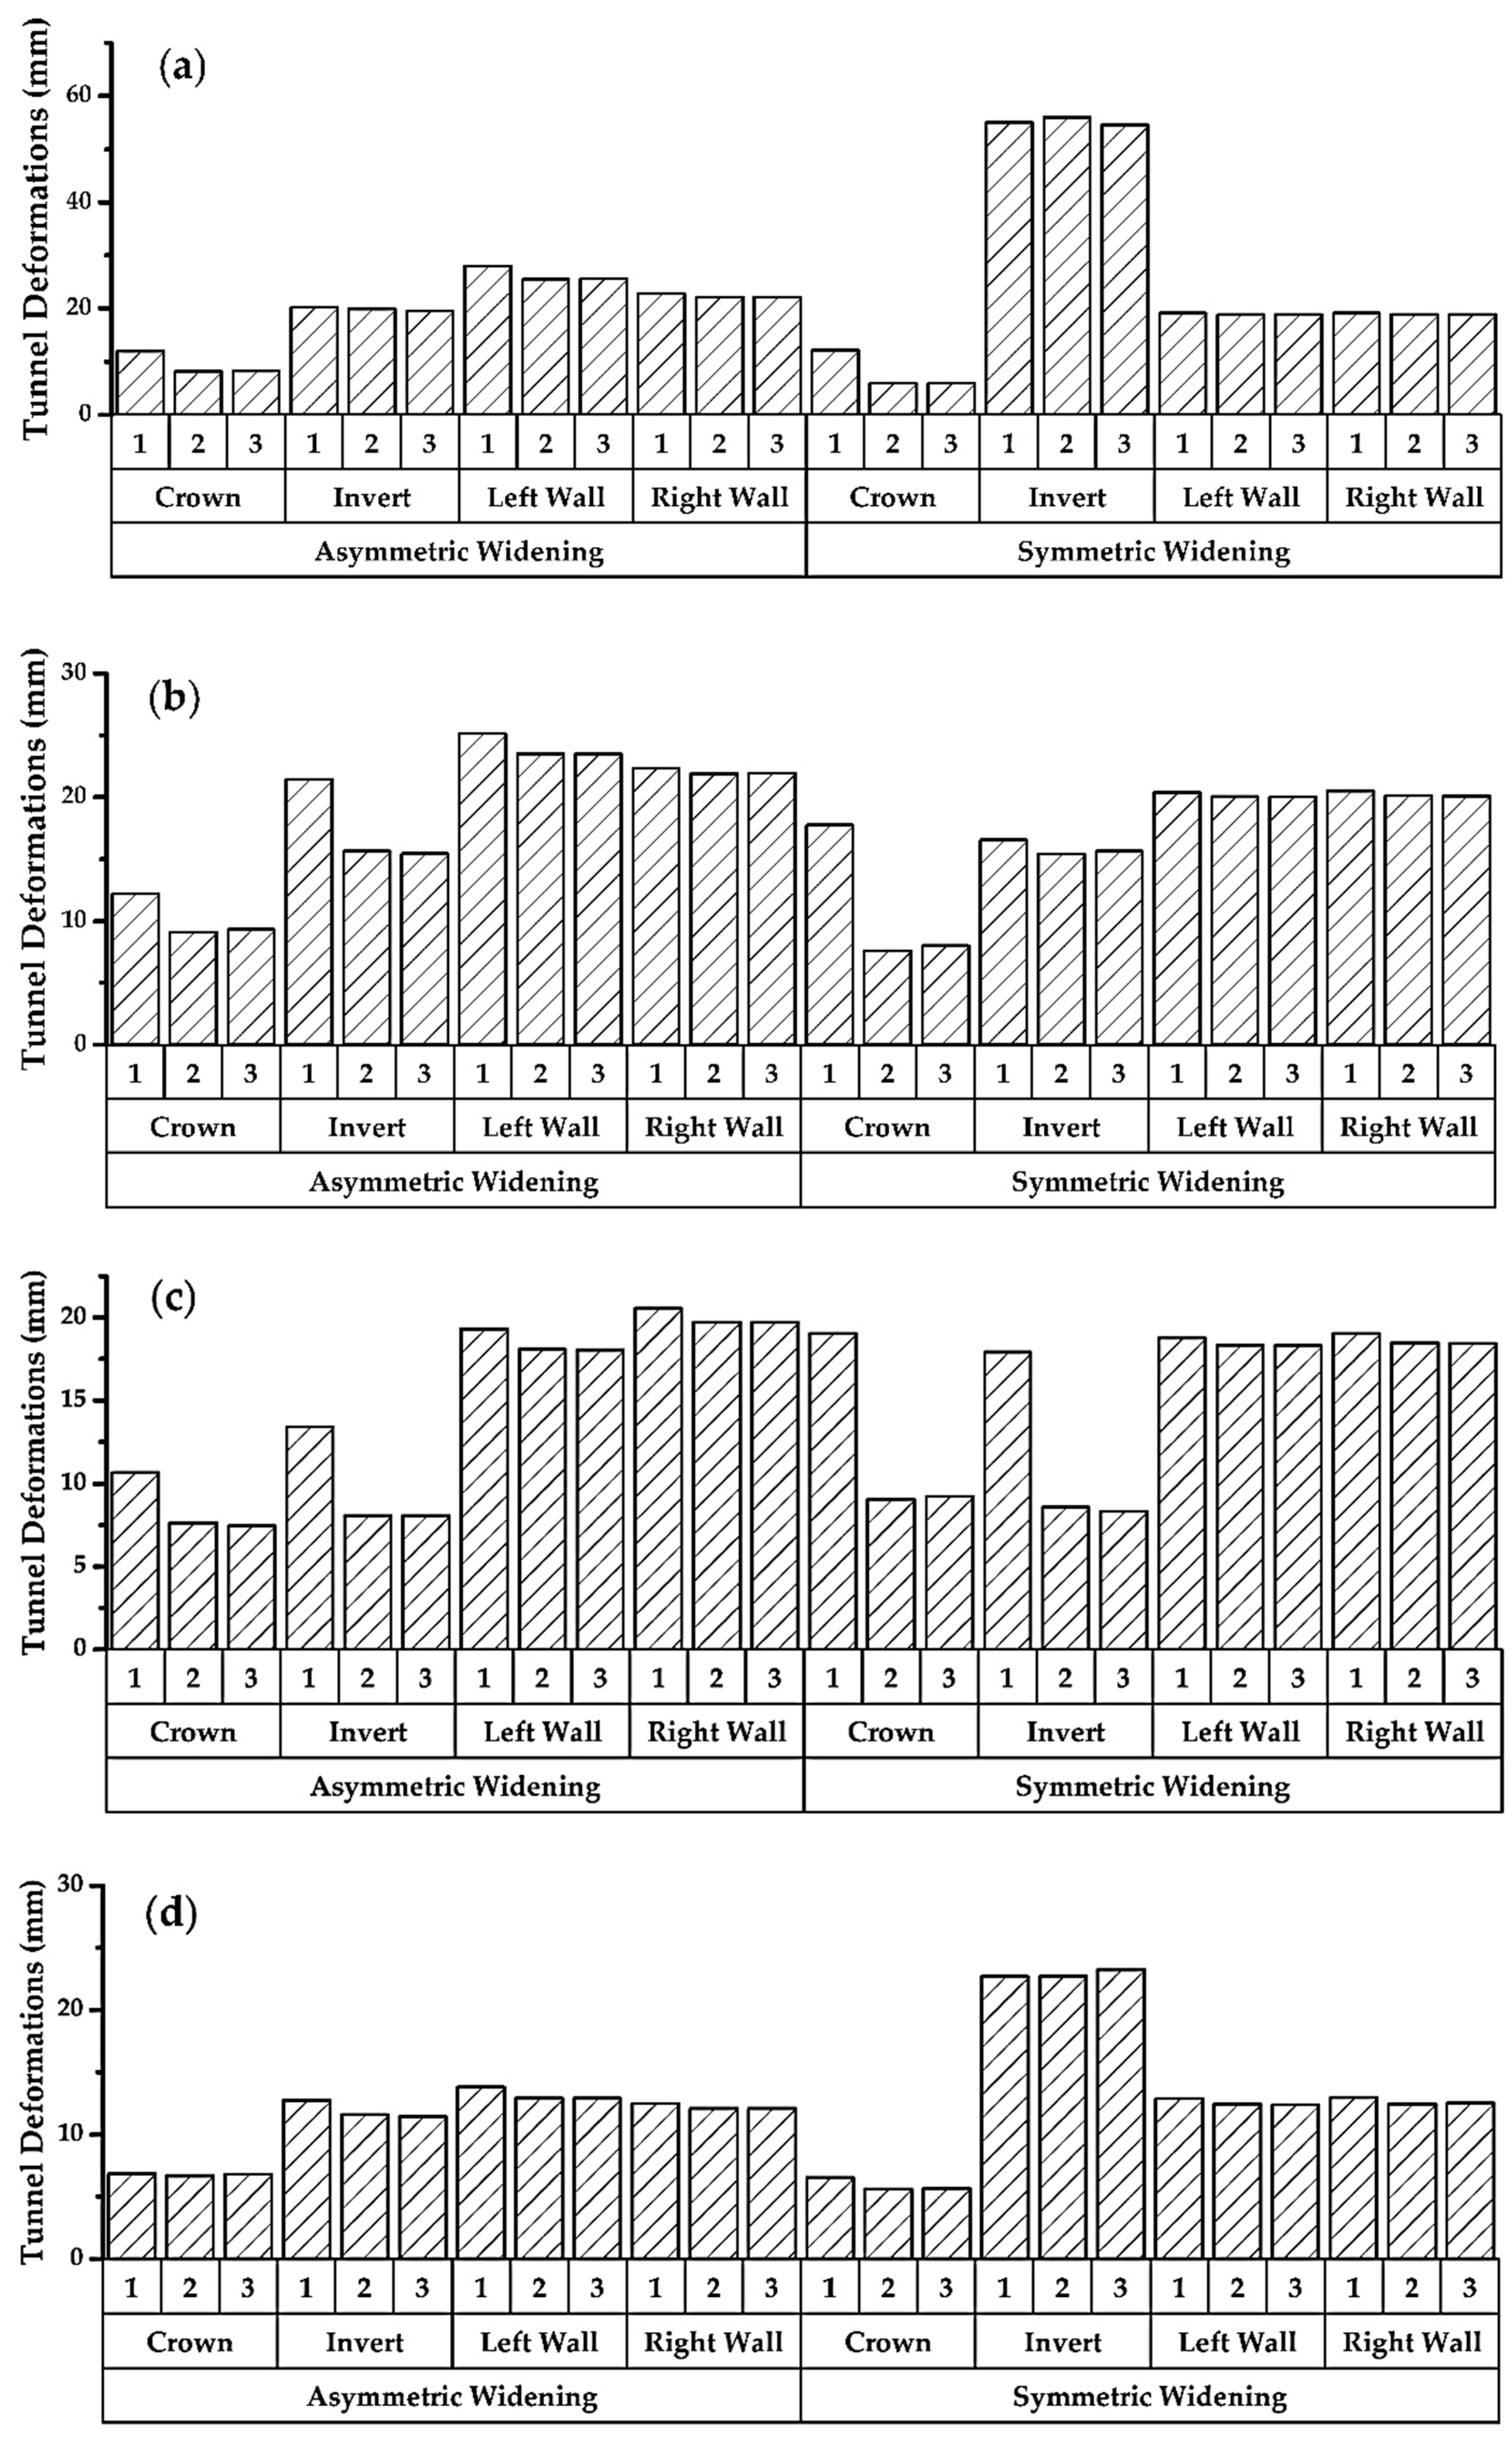
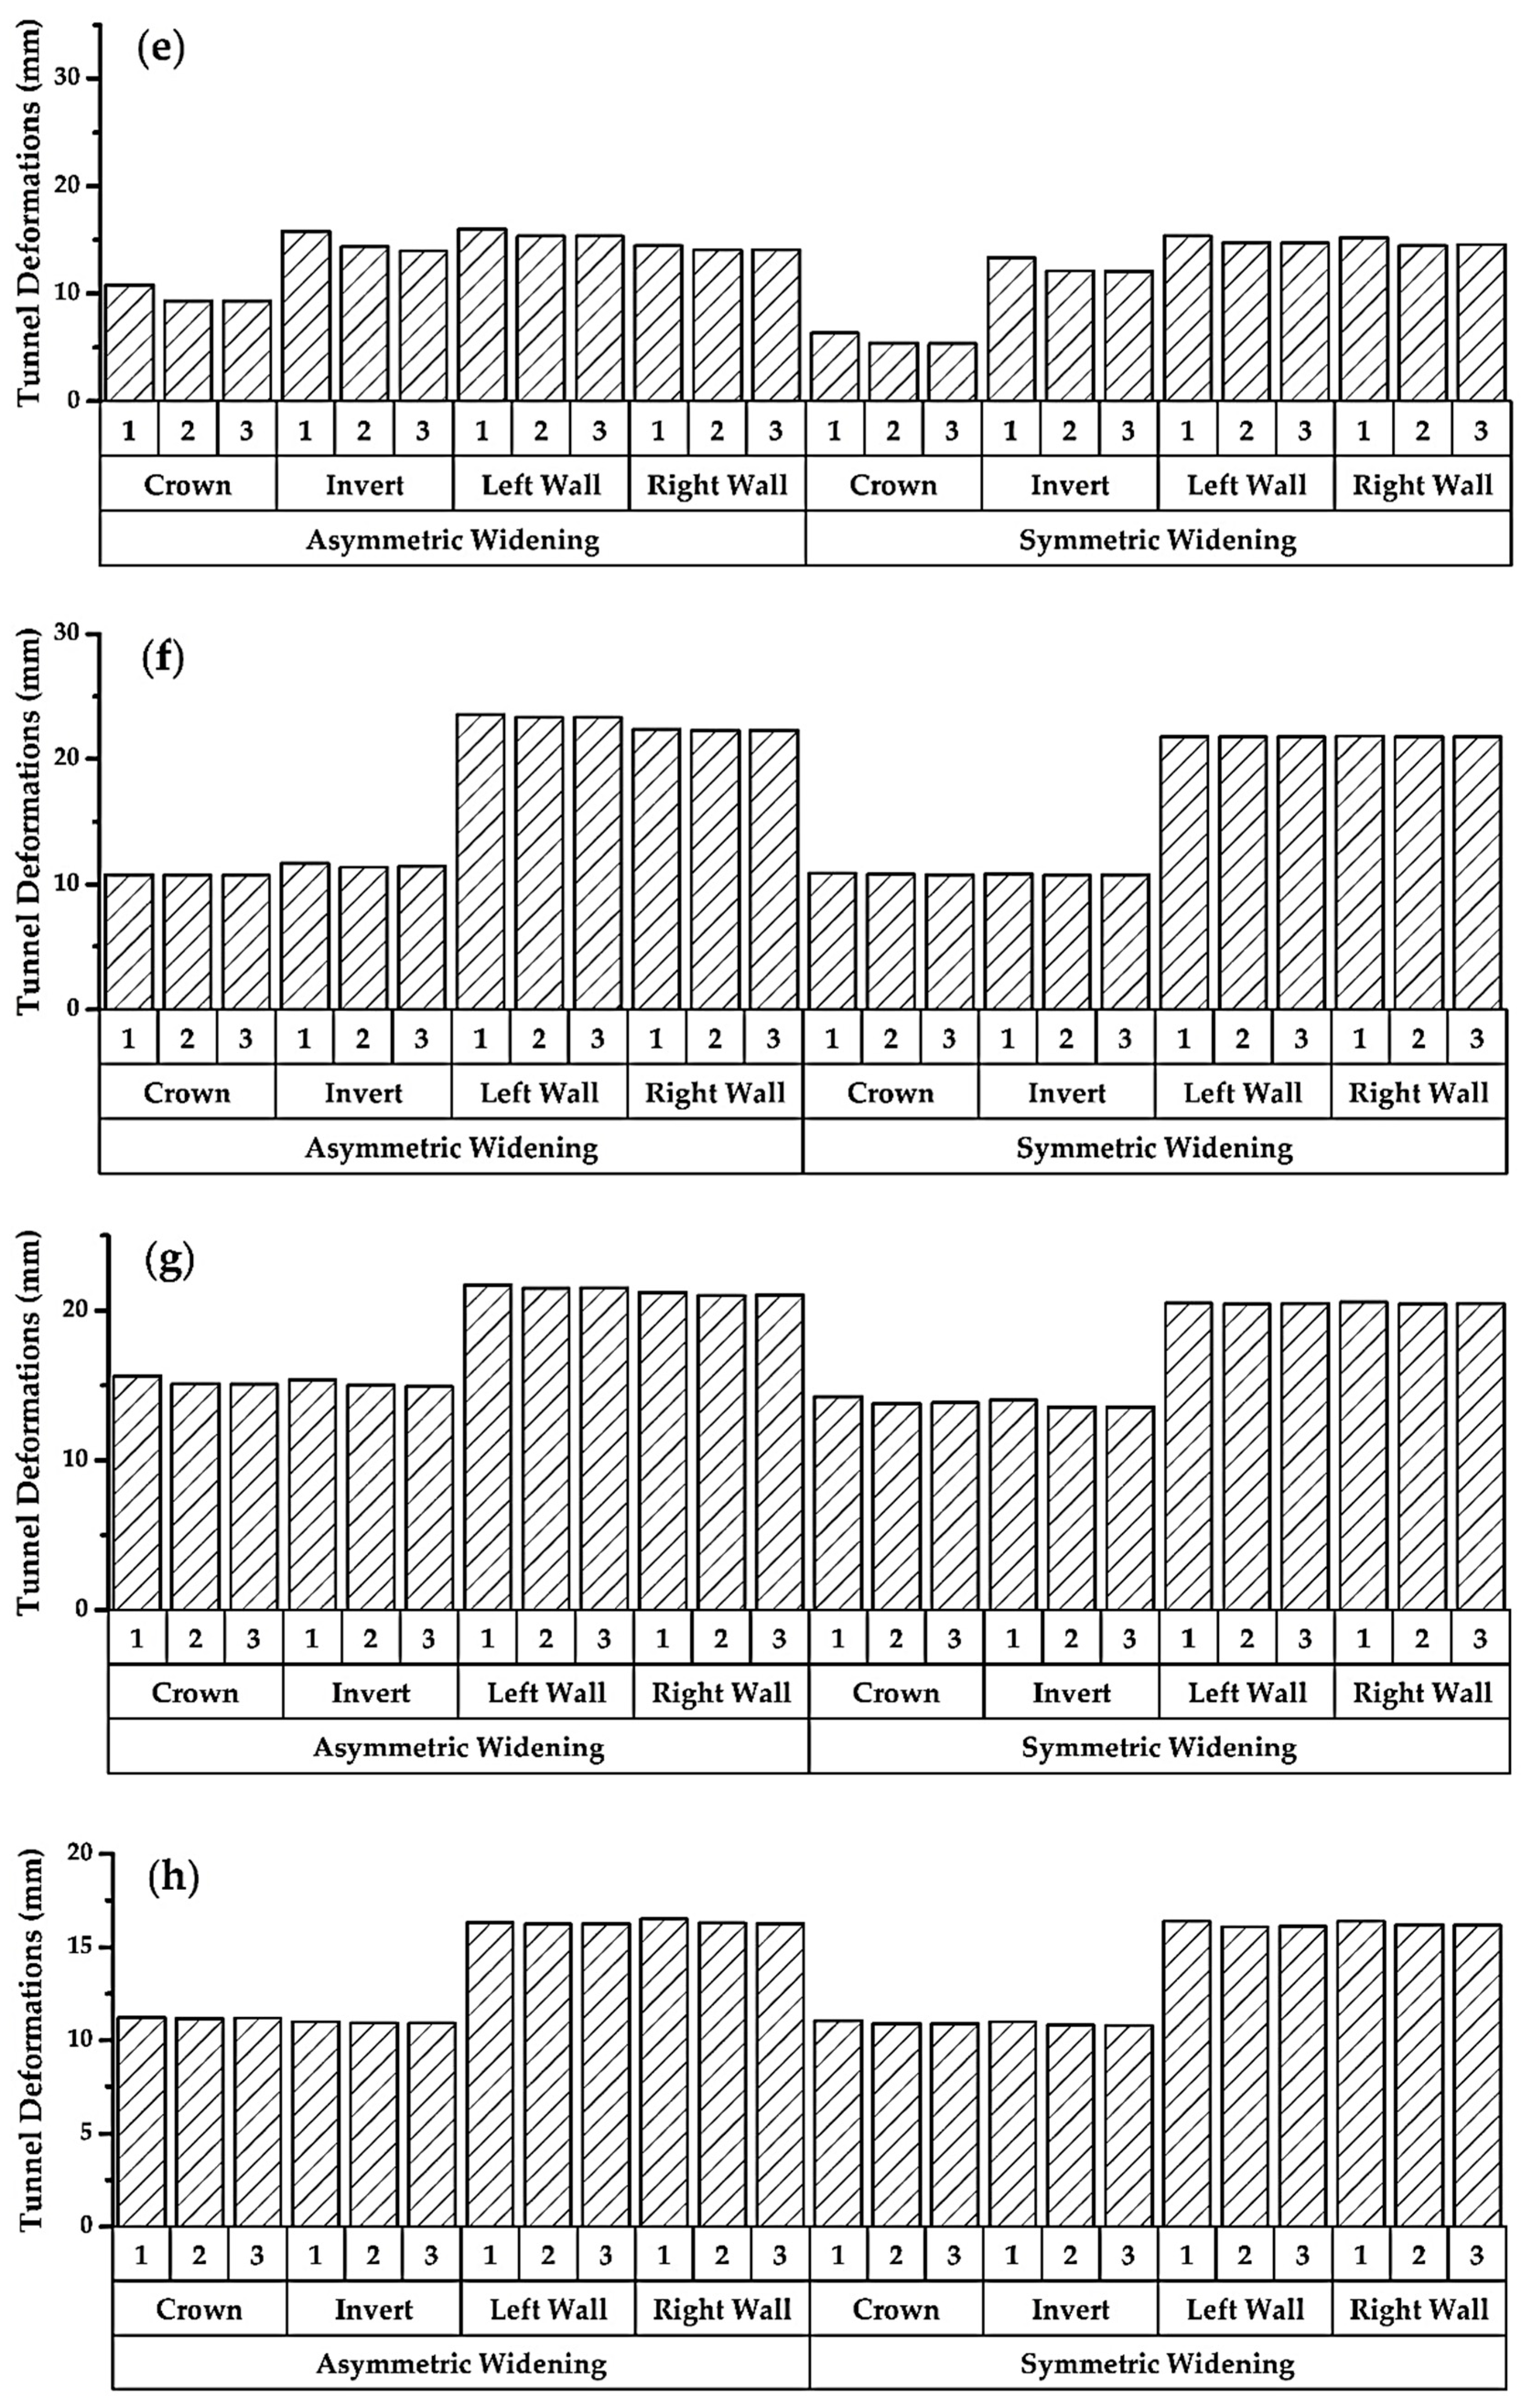
4.1. Simulated Deformation of Different Tunnel Shapes

The tunnel deformation at the monitoring section of eight different tunnel shapes (Table 4) was observed during asymmetric and symmetric widening under three different support modes (Table 3). The deformation results are summarized in the bar chart presented in Figure 8.
It was found in case-a (Figure 8a) that the deformation at the invert of the horseshoe shape tunnel with flatbed is very high in the case of symmetric widening as compared to asymmetric widening. However, when an invert was introduced into the horseshoe shape tunnel in case-b (Figure 8b), the deformation at the invert was controlled considerably during symmetric widening. Moreover, the overall deformation was less in symmetric widening as compared to asymmetric widening. Thus, it is concluded that asymmetric widening is the best option for horseshoe shape tunnels with flatbed while symmetric widening provided best results when an invert was introduced.
In case-c (Figure 8c), the tunnel deformation for the circular tunnel at the crown and invert in the first support/mode was greater in asymmetric widening. However, it was able to be controlled by applying a support system. It can be concluded that in the case of an unsupported tunnel, the symmetric option is better for circular tunnels; however, if the support system is introduced into the circular tunnel, then it is insignificant to widen the tunnel asymmetrically or symmetrically.
In case-d (Figure 8d), the deformation at the invert for a semicircular tunnel with flatbed was more in symmetric widening as compared to asymmetric widening. This revealed that the tunnel stress and deformation accumulated in the invert that can better be handled through the asymmetric widening. However, in case-e (Figure 8e), the semicircular tunnel was provided with an invert, which controls the deformation of symmetric widening as compared with asymmetric widening. Thus, it is concluded here that asymmetric widening is preferable in semicircular tunnels with flatbed, whereas the symmetric widening is recommended in semicircular tunnels with an invert.
In cases f to h in Figure 8f–h, the tunnel deformation in both widening areas was similar with an insignificant difference. Therefore, it can be assumed that the tunnels with regular, box, rectangular, and semi-elliptical shapes have insignificant differences between asymmetric or symmetric widening.
It was found that the shotcrete played an important role in increasing the difference in deformation between the two types of tunnel. However, the rock bolts reduced the deformation but did not contribute to the difference in deformation in both modes of widening.

4.2. Full Factorial Design

The full factorial design was conducted in order to determine the significant factors affecting the tunnel deformation in two different modes of tunnel widening (asymmetric and symmetric). The pattern was formulated for different variables and modes, as shown in Table 6. The confidence level for the experiment was taken as 95% with a significance level of 5% [42] in this study.
The relationships among different support modes along with cases under consideration and monitoring locations in asymmetric and symmetric widening are shown in Figure 9, Figure 10 and Figure 11.

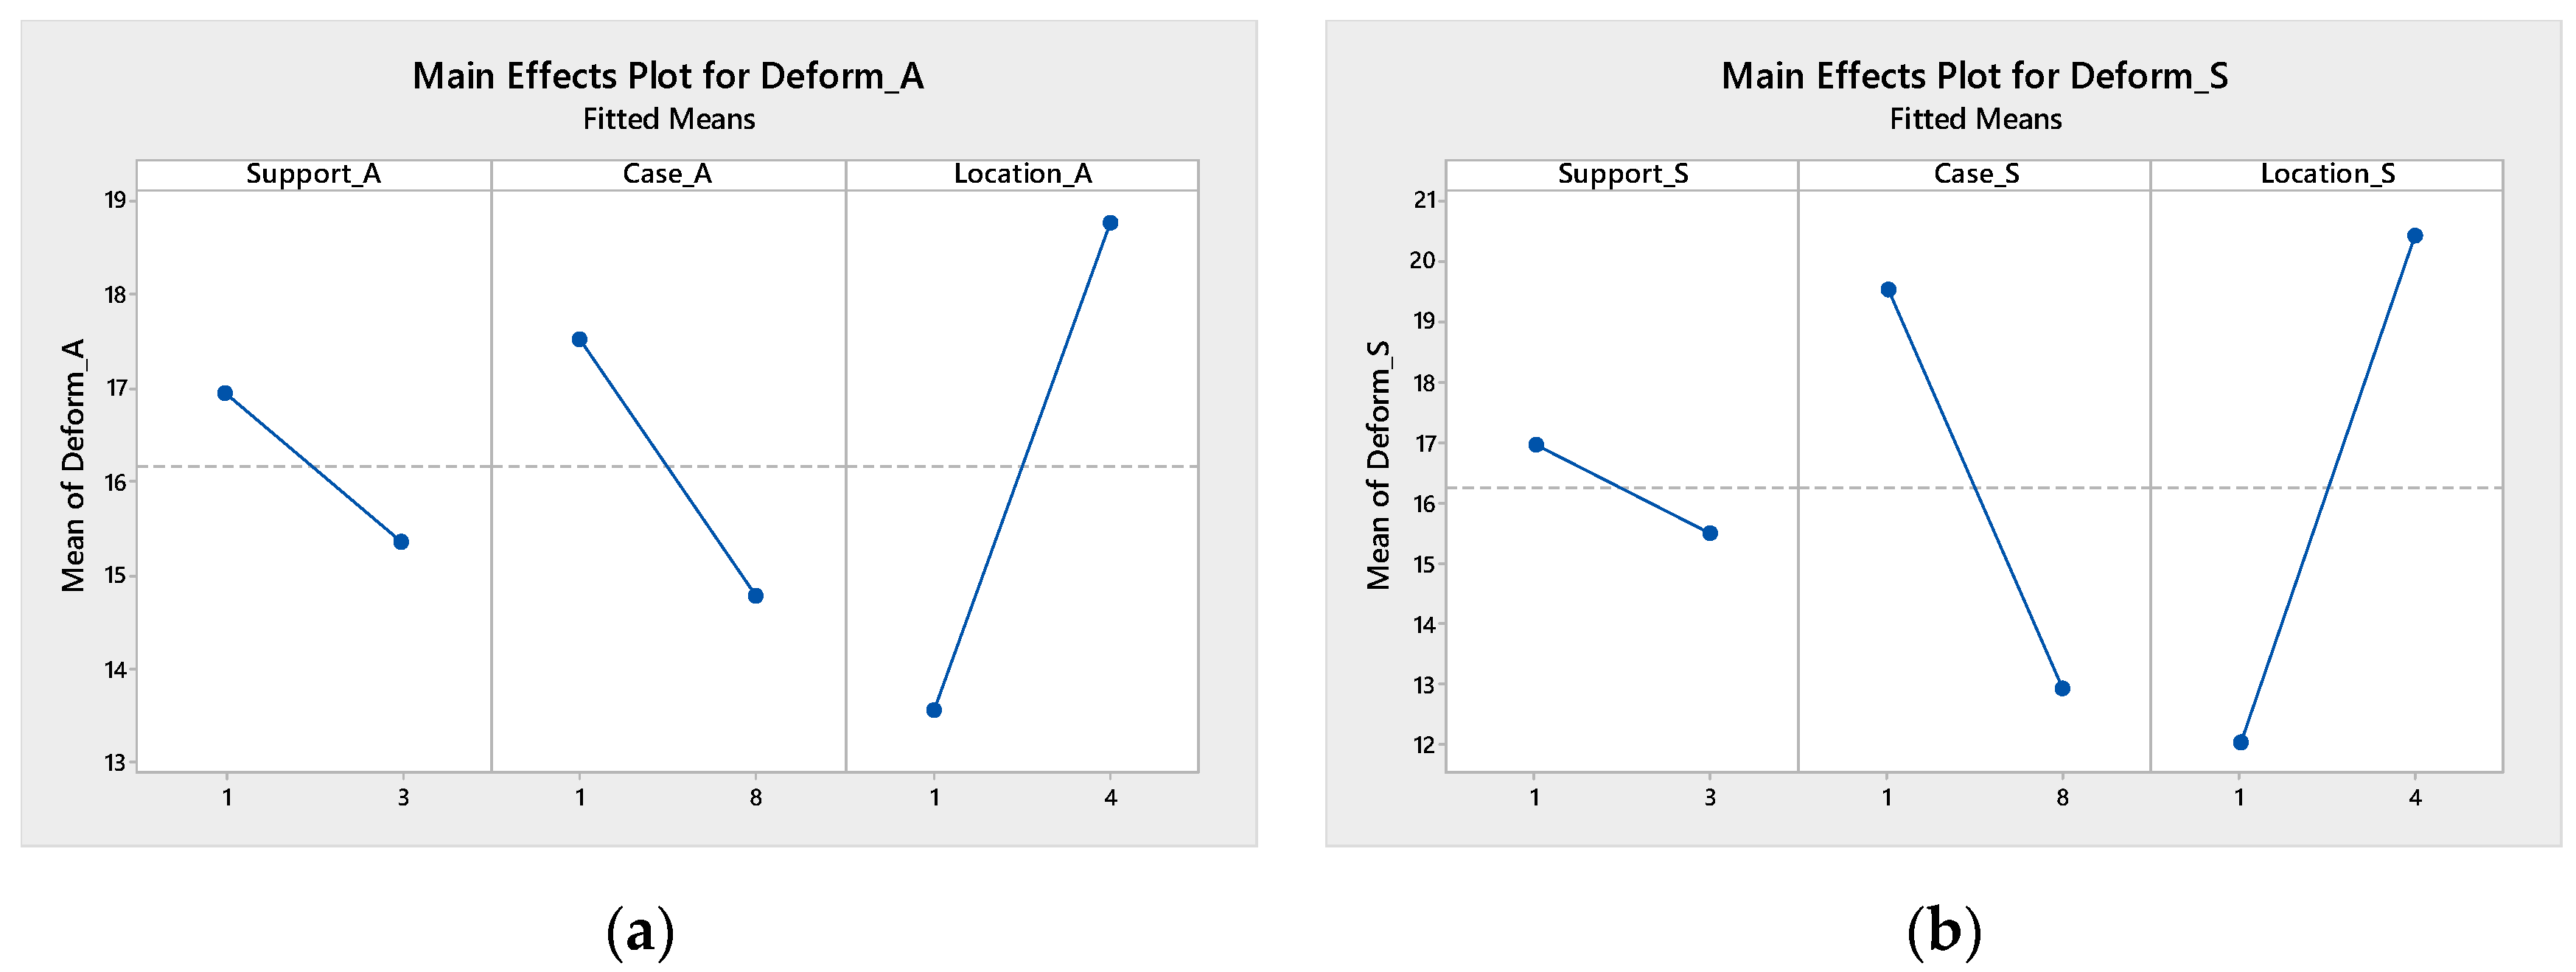
4.2.1. Main Effect Plot

The plot of the main effect versus deformation (Figure 9) was initially considered to evaluate the tunnel deformation under asymmetric and symmetric widening with three variables, i.e., tunnel support from 1 (tunnel without support) to 3 (tunnel with 200 mm shotcrete + rock bolts), tunnel shape case from 1 (horseshoe shape without invert) to 8 (semi-elliptical shape), and tunnel monitoring location from 1 (crown) to 4 (invert). The main effect plot (Figure 9a) for asymmetric deformation reveals that the type of support installed in the tunnel has a significant effect on the deformation. More specifically, with the variation of the support type from 1 to 3, the deformation tends to decrease by approximately 2 mm (13.33%). A similar and more profound impact has been observed for case types when the case type is varied from 1 to 8, showing a decrease of 3 mm. A close inspection of Figure 9a reveals that the tunnel monitoring of locations 1 to 4 has the most significant impact on deformation, regardless of the support type, which tends to increase by approximately 5.5 mm.
The main effect plot for symmetric widening (Figure 9b) reveals that the support type has a significant effect on the deformation. More specifically, with the variation of the support type from 1 to 3, the deformation tends to decrease by approximately 1.5 mm (8.82%). A similar and more reflective impact has been observed for case types varying from 1 to 8 where the deformation difference was recorded as 6.5 mm. A close inspection of Figure 9a reveals that the monitoring location has the most significant impact on deformation, which tends to increase by approximately 8.5 mm.
Figure 9 provides insight into the behavioral comparison of asymmetric and symmetric widening. The impact of the support type is more prominent in asymmetric widening (as indicated by the steeper line in the main effects plot) as compared to that in symmetric widening. The case and location have higher effects on symmetric deformation as compared to that on the counterpart.

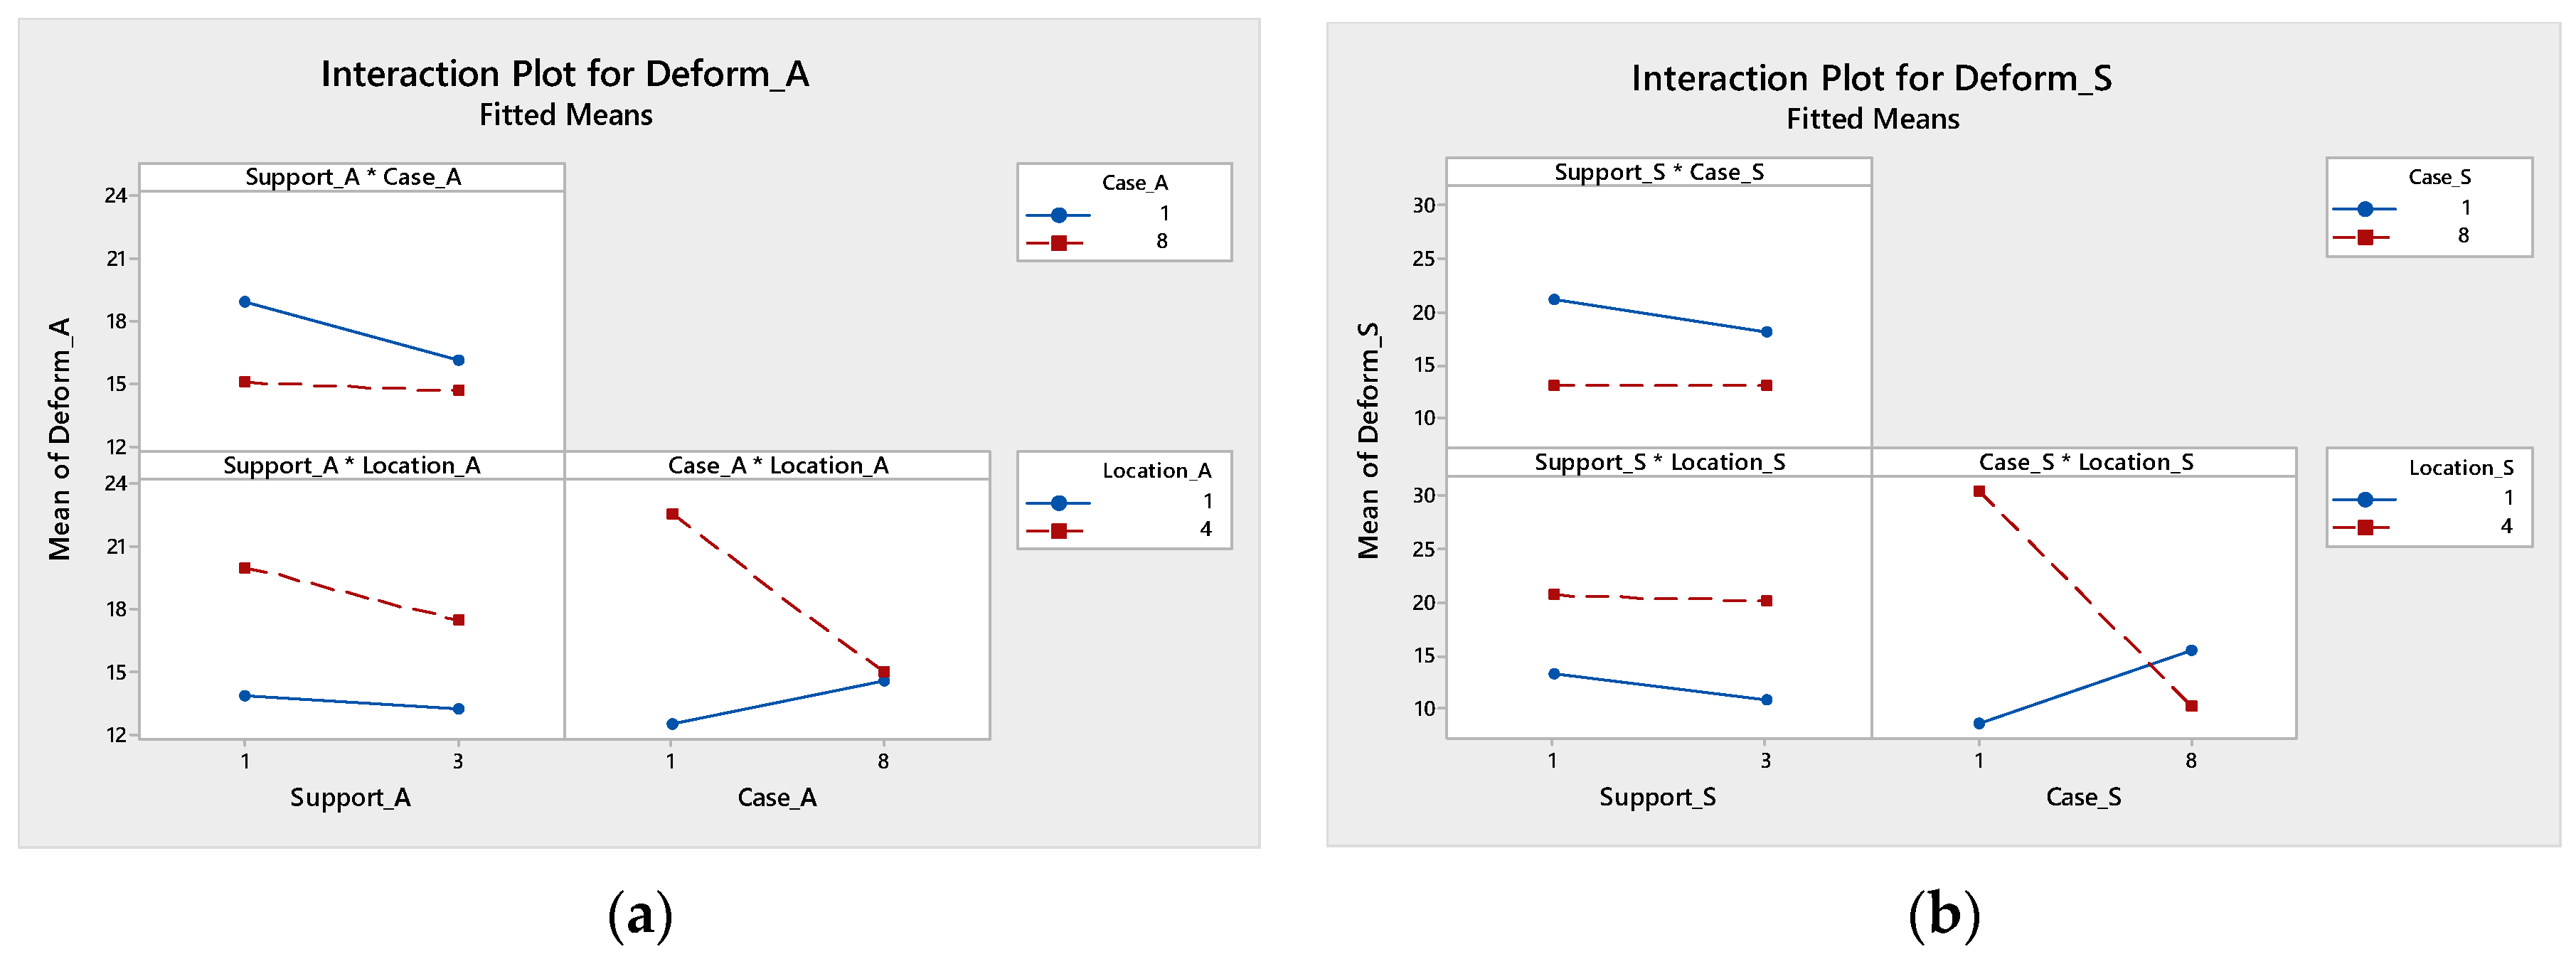
4.2.2. Interaction Effect Plot
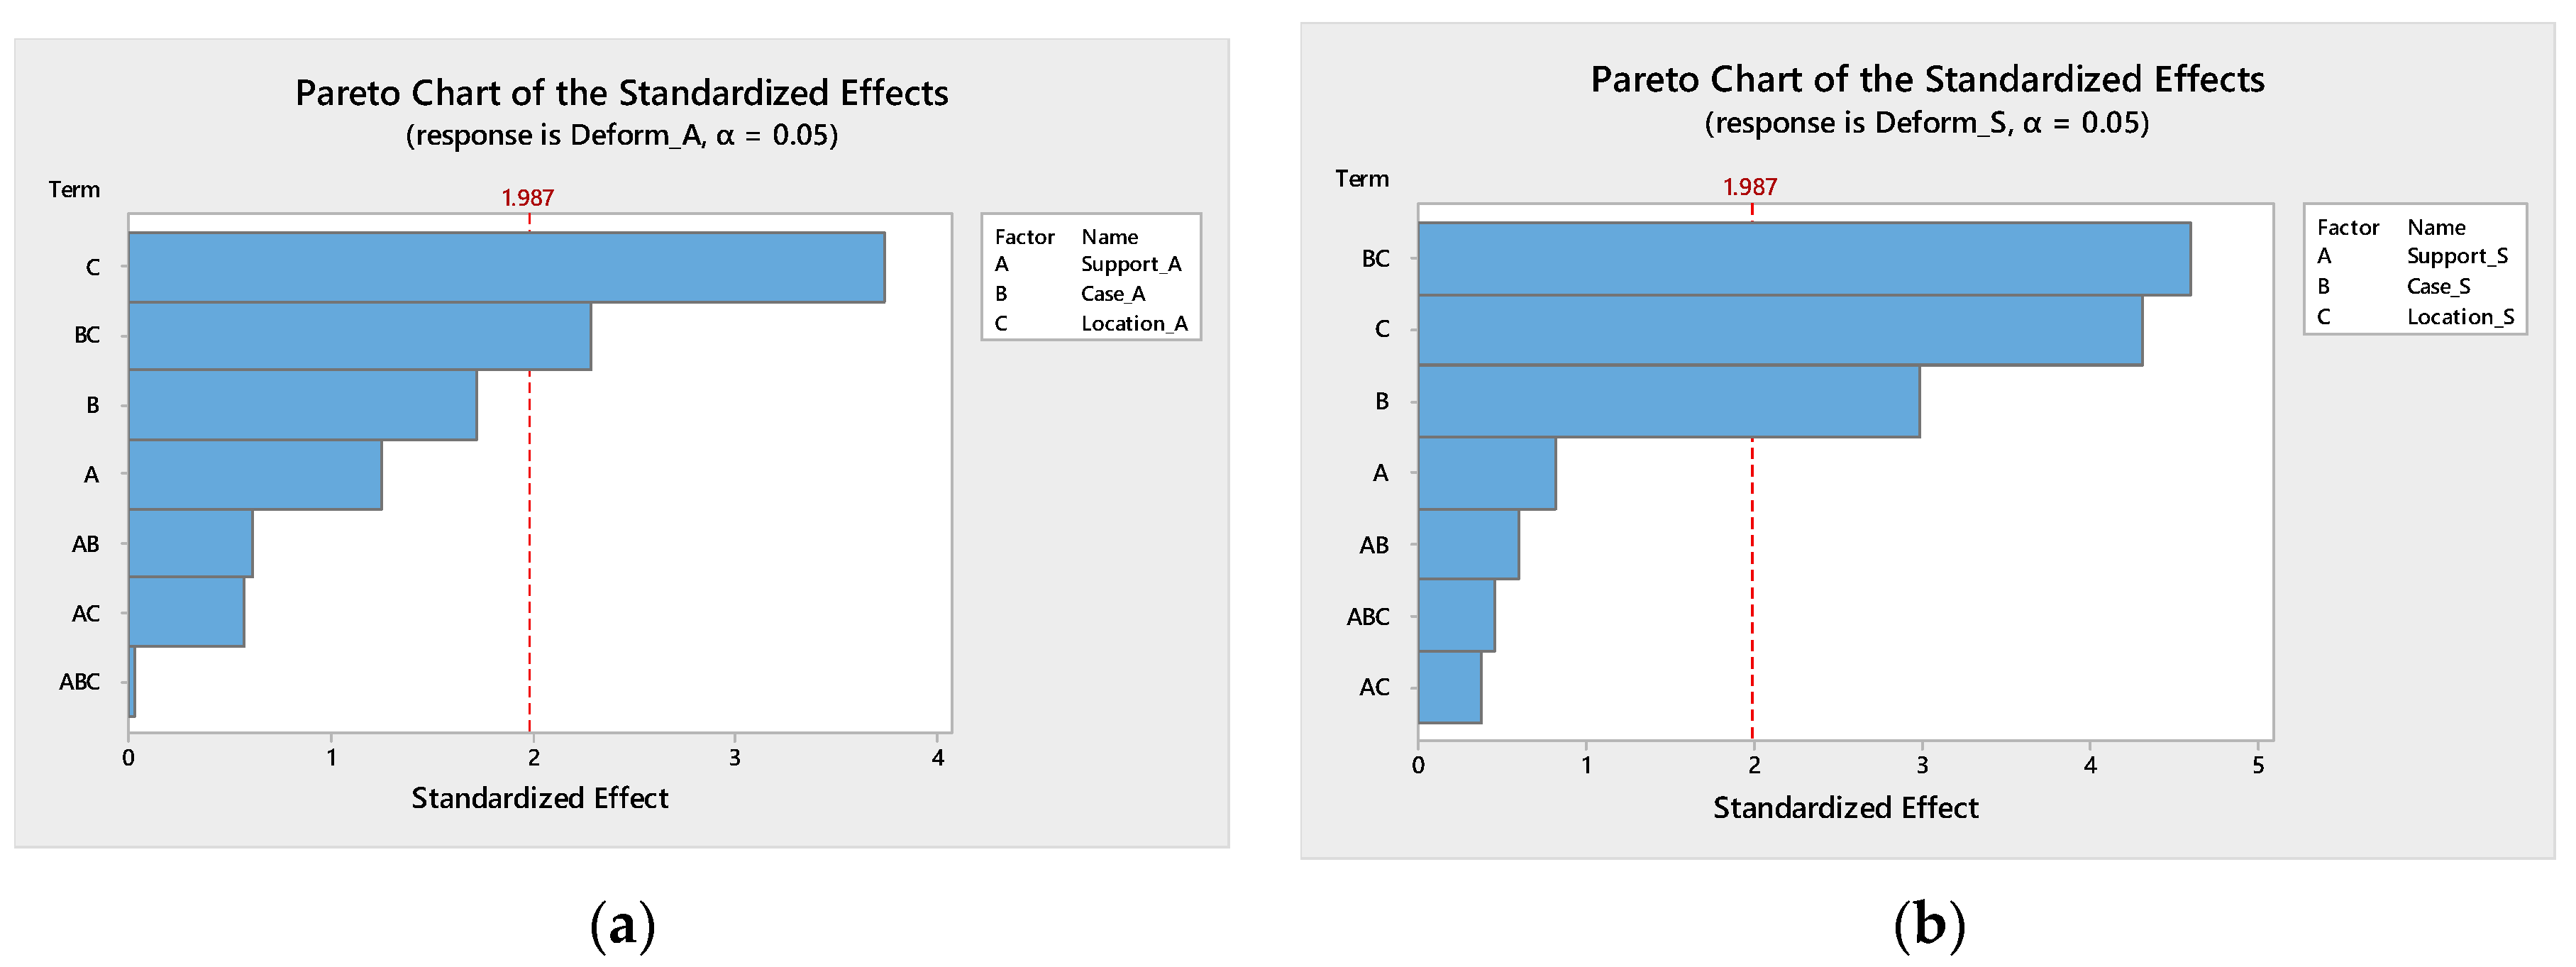
The “Interaction Effect Plot” for an asymmetric widening tunnel (Figure 10a) infers that the interaction of different modes of tunnel support from 1 (i.e., tunnel without support) to 3 (i.e., tunnel with 200 mm shotcrete + rock bolts) with cases (different tunnel shapes from 1 to 8) and interaction of support with tunnel monitoring locations (i.e., 1 = crown; 2 = right wall; 3 = left wall; 4 = invert) has a weak relationship as both the representative lines are near to parallel; however, there is a highly significant effect for the interaction of different tunnel cases and monitoring locations. The Interaction Effect Plot for symmetric widening (Figure 10b) revealed an insignificant relationship for the interaction of support with cases and locations, whereas a significant correlation was observed for the interaction of different tunnel cases with locations.
Figure 10 provides insight into the comparison between asymmetric and symmetric widening. The influence correlation of different tunnel cases and locations is more prominent in symmetric (as indicated by the intersection of two interacting variables plot lines) as compared to asymmetric widening.

4.2.3. Pareto Chart

The Pareto chart of the standardized effects for tunnel deformation, as shown in Figure 11, defines the significance of factors as well as the interaction effect of the mean response. The relative importance of the factor effect is also revealed in the Pareto chart. The chart encompasses the standardized effect of each factor’s mean response. The t-critical reference line is drawn on the chart which indicates that the bars crossing the reference line are significant and vice versa.
The Pareto chart for asymmetric widening (Figure 11a) revealed that the location itself as well as the interactions with different cases are significant as they cross the reference line of a standardized effect of 1. However, the support and cases as well as their interactions with other variables have insignificant relationships with deformation. The Pareto chart for symmetric widening (Figure 11b) revealed that the different cases and locations as well as the interactions of both are significant while the support and its interactions with other factors have insignificant effects.

4.3. Parametric Study

A parametric study was carried out to examine the effects of different parameters on the tunnel widening phenomenon. The horseshoe shape tunnel was selected and analyzed for 10 drives with 500 steps per drive for both the initial as well as the widened tunnel with a total of 10,000 steps. The model was extruded for a 30 m length in the longitudinal direction.
The rock mass and in situ condition were maintained as those selected for the initial simulation from Table 1 and Table 2. The model for the parametric study was considered similar to the initial study, as detailed in Figure 5, whereas deformation at the crown was taken to compare between asymmetric and symmetric widening.
The parametric study was carried out for different rock types as well as for different parameters including variation in elastic modulus (E), the horizontal to vertical stress ratio (K), overburden (H), and the geological strength index (GSI). The detailed analysis is provided in the following section.

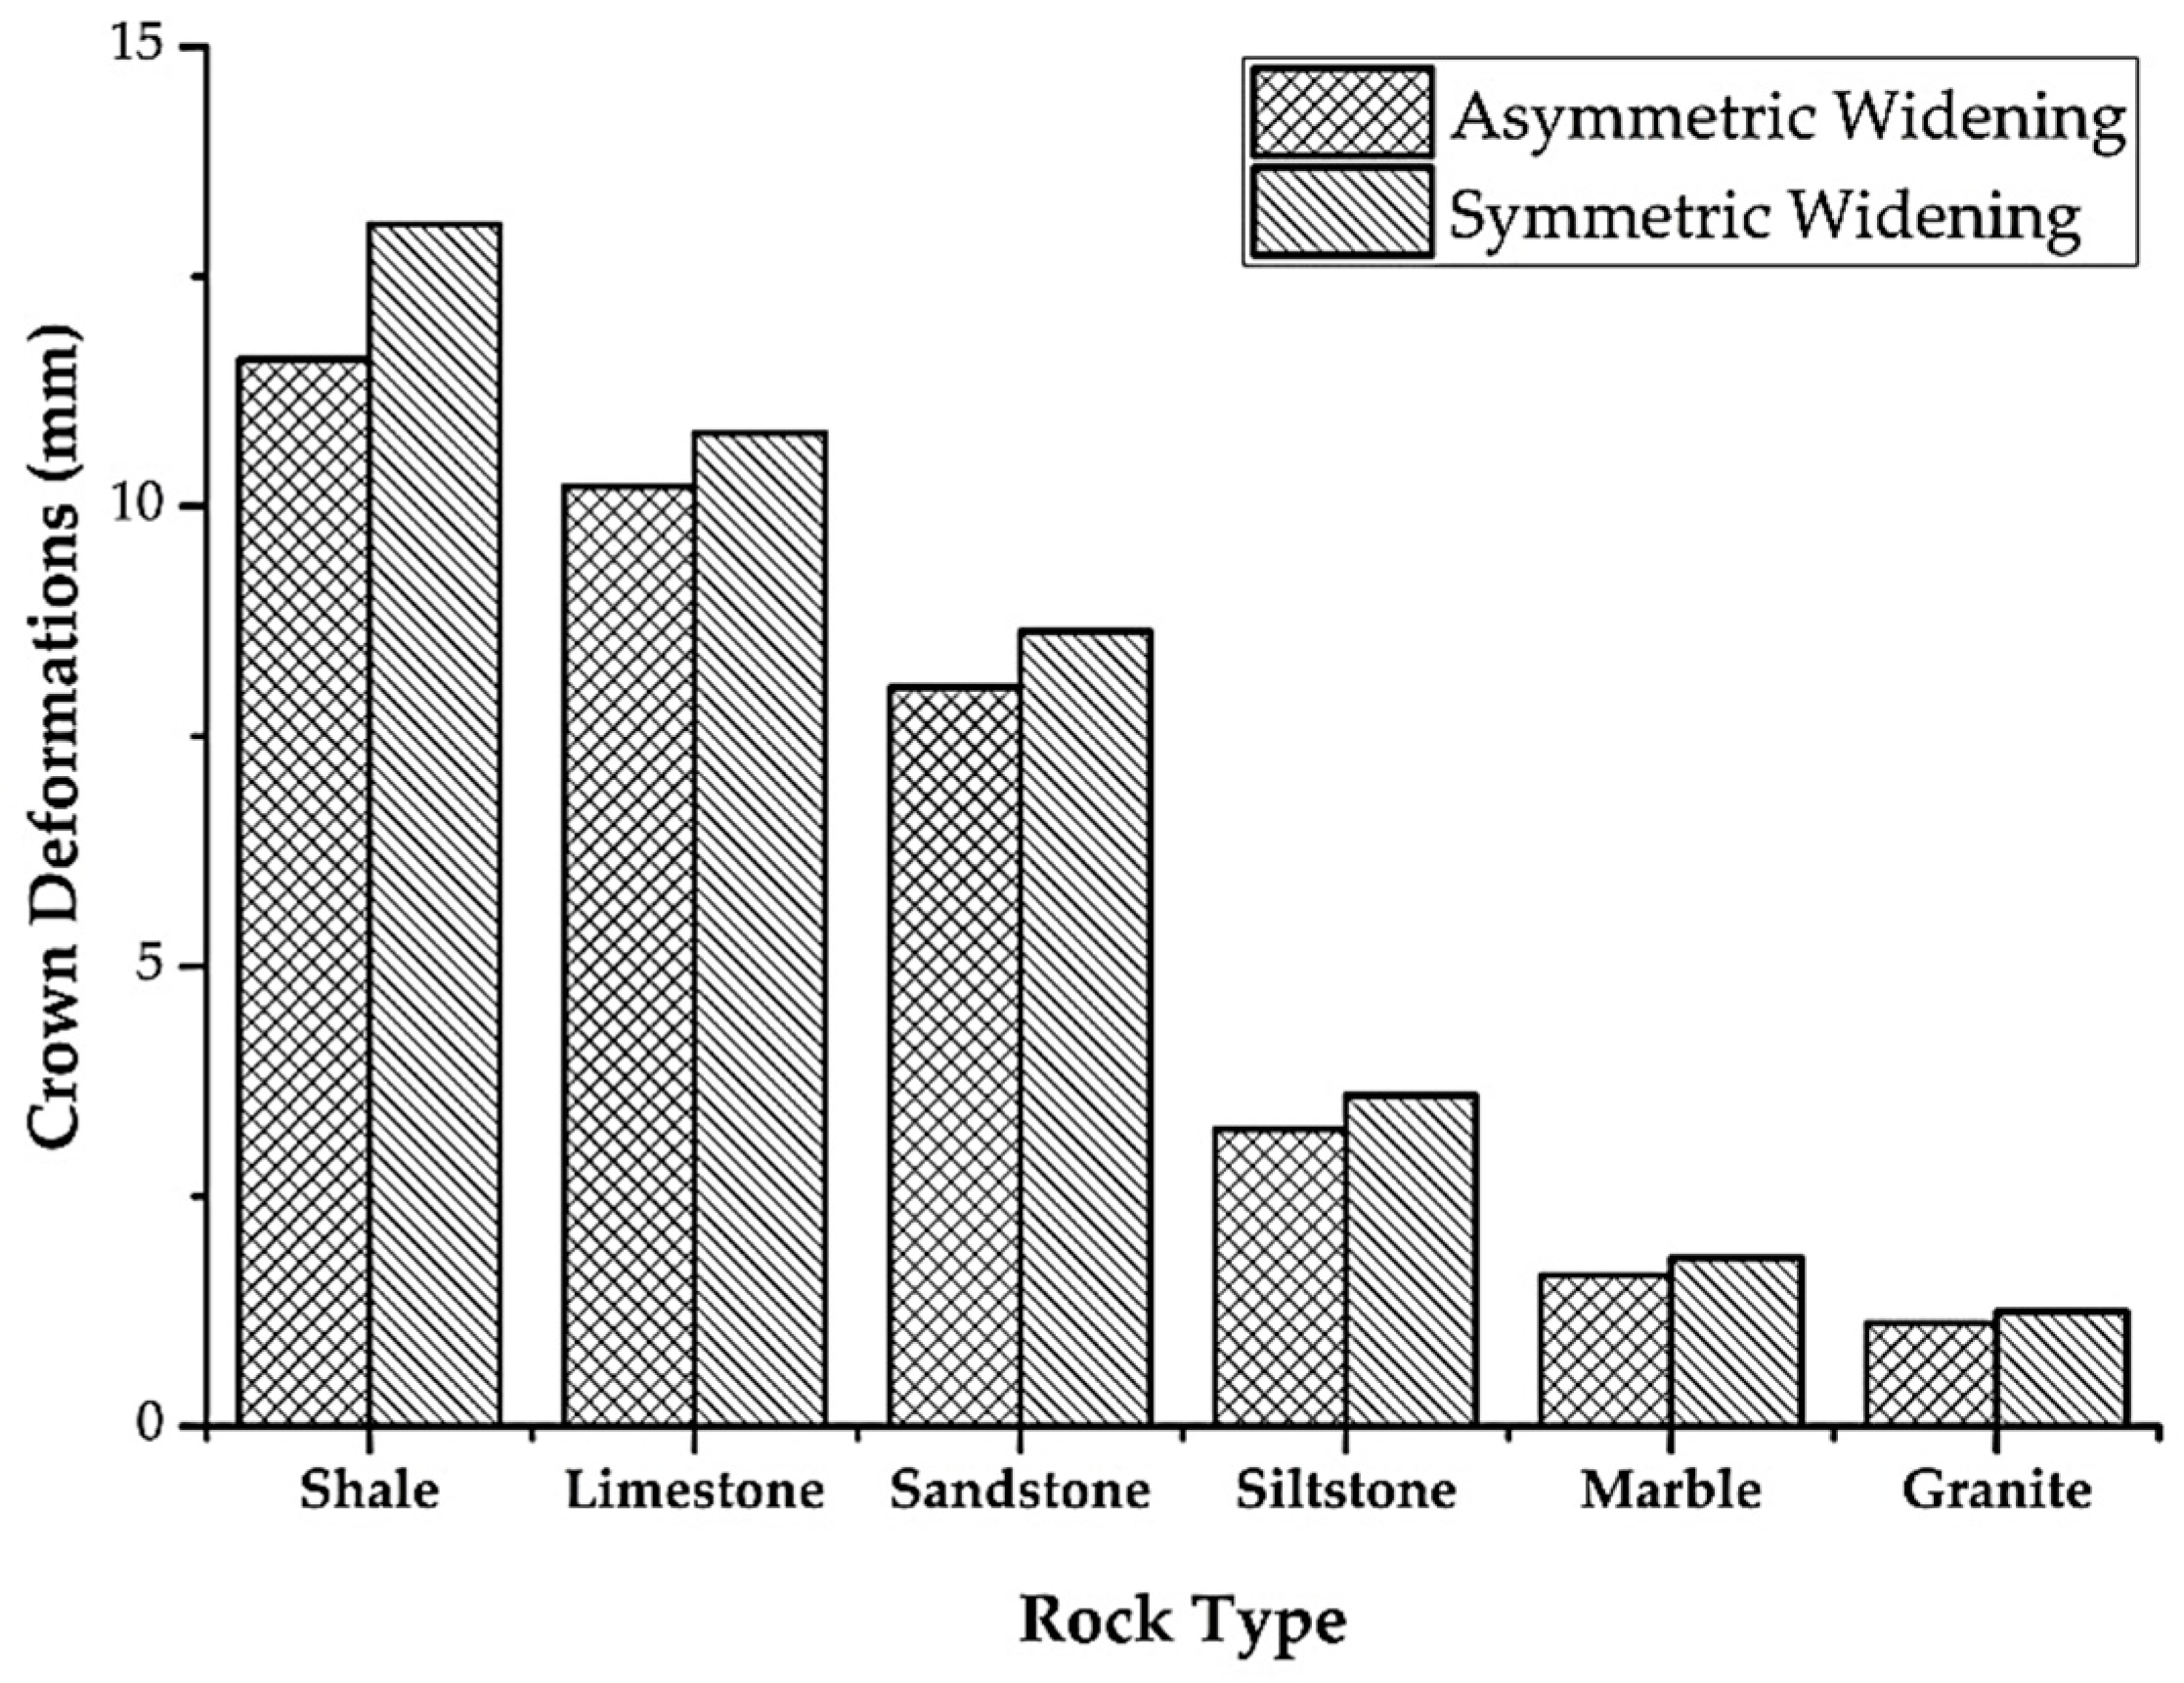
4.3.1. The Effects of Different Rock Types on Rock Mass Behavior

In the first exercise, different rock types were analyzed with respect to parameters as defined by Goodman [35], which is also tabulated in the FLAC 3D User Guide [22]. The parametric values of different rock types are presented in Table 7, whereas the results of crown deformation under symmetric and asymmetric widening are shown in Figure 12.
The simulation results revealed that the deformation of the tunnel is inversely proportional to the rock strength. As the horseshoe shape tunnel was used in the parametric study, which revealed that the crown deformation is greater in symmetric widening than in asymmetric widening while the difference in asymmetric and symmetric ratios between different rock types is approximately the same from high to lower strength rock.

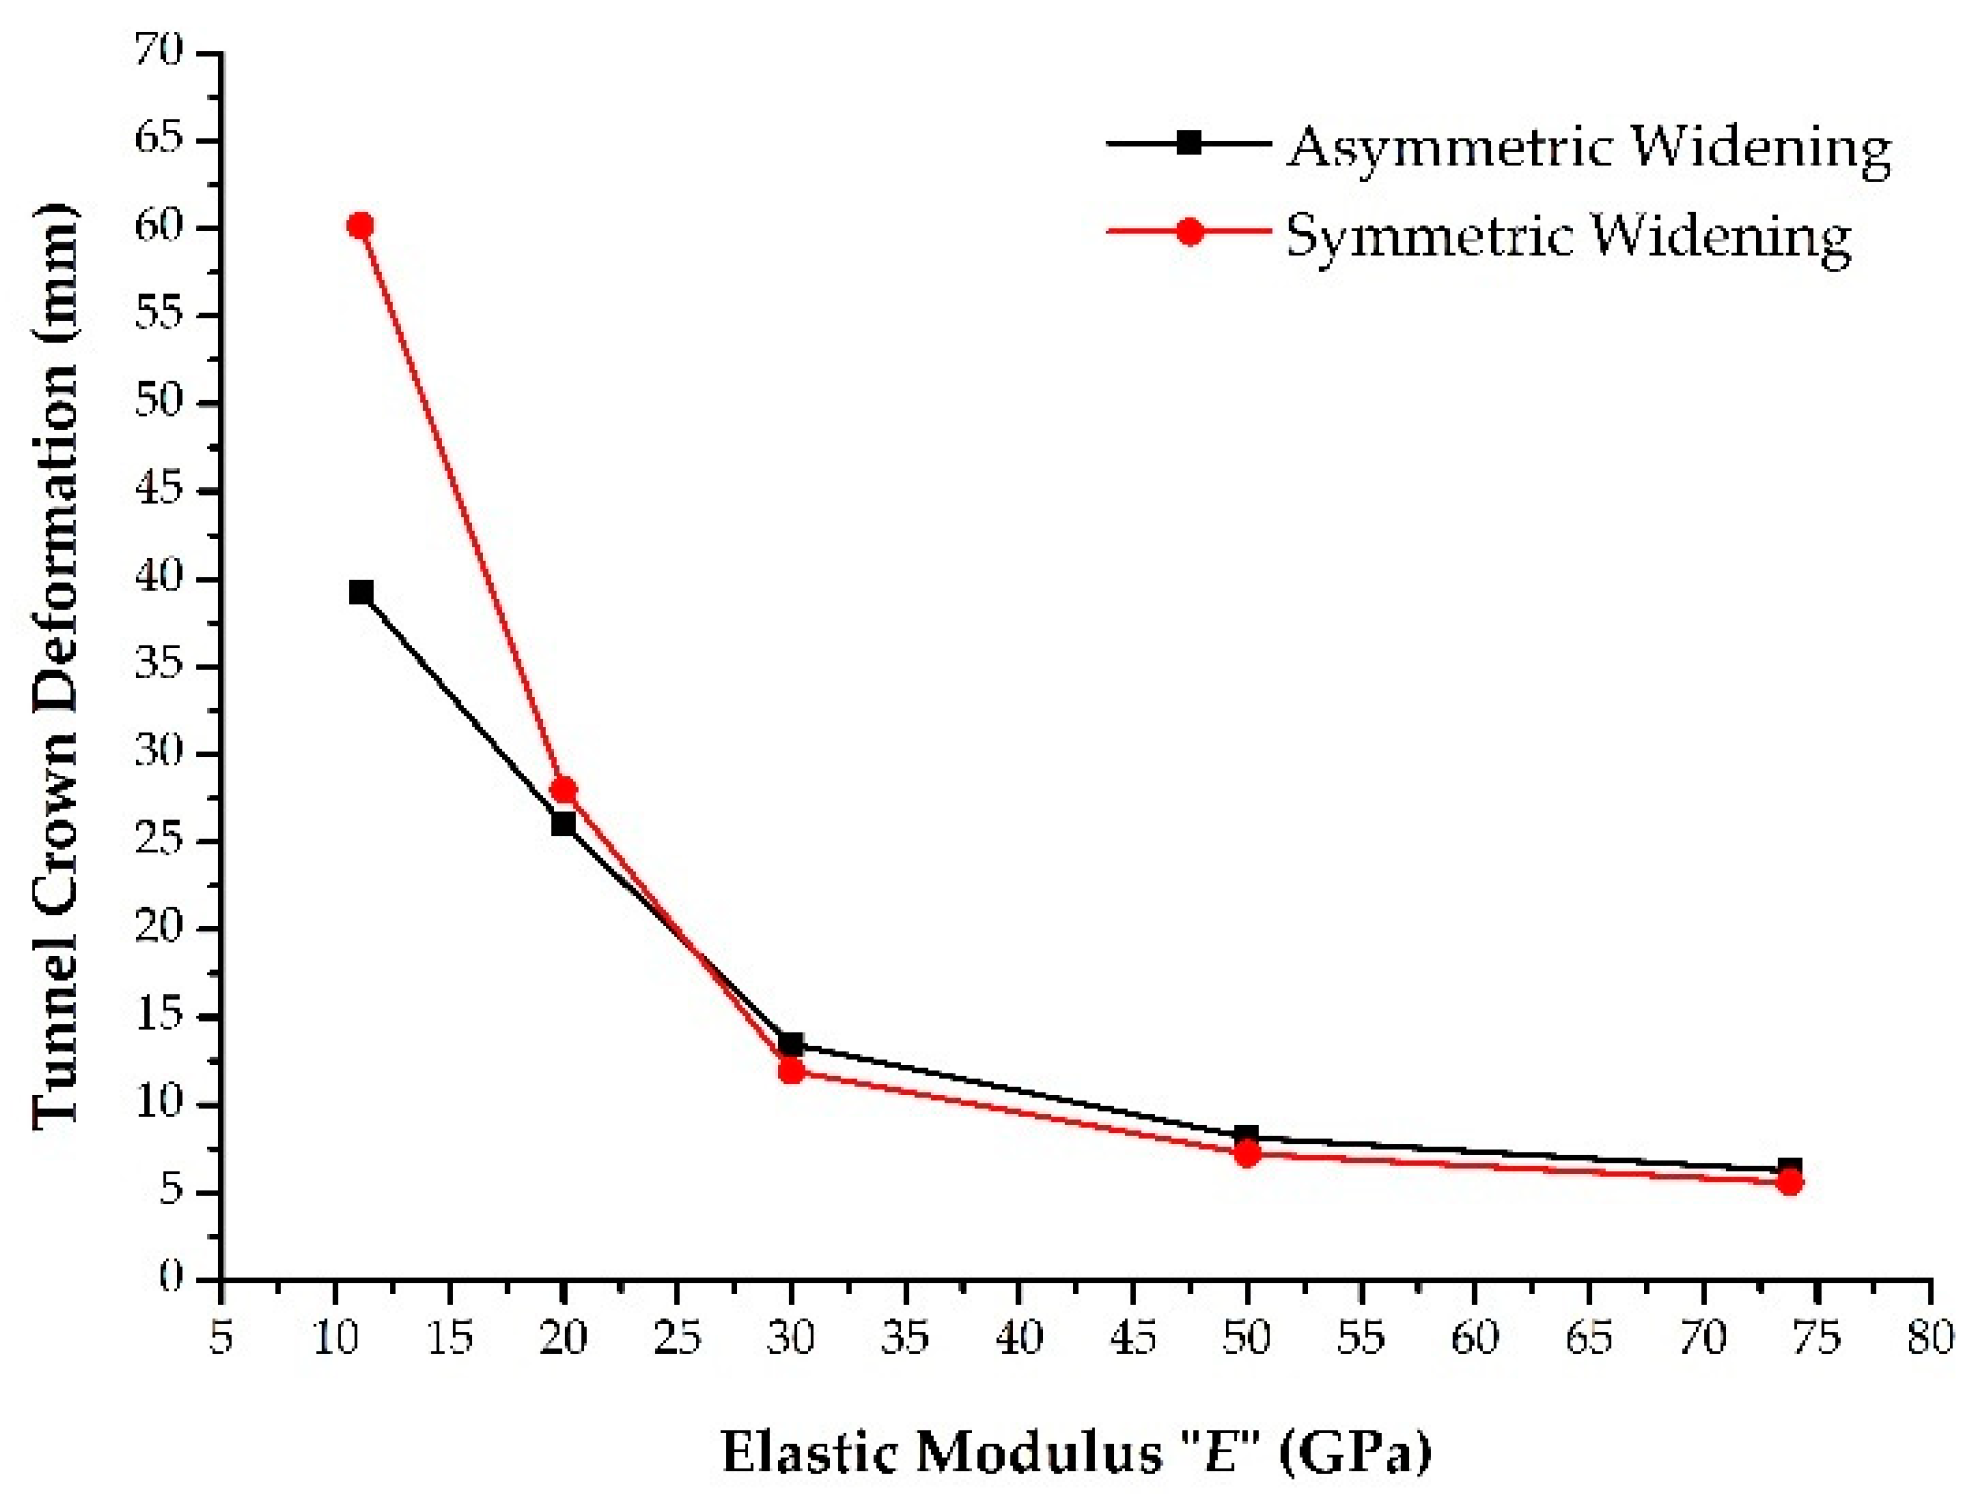
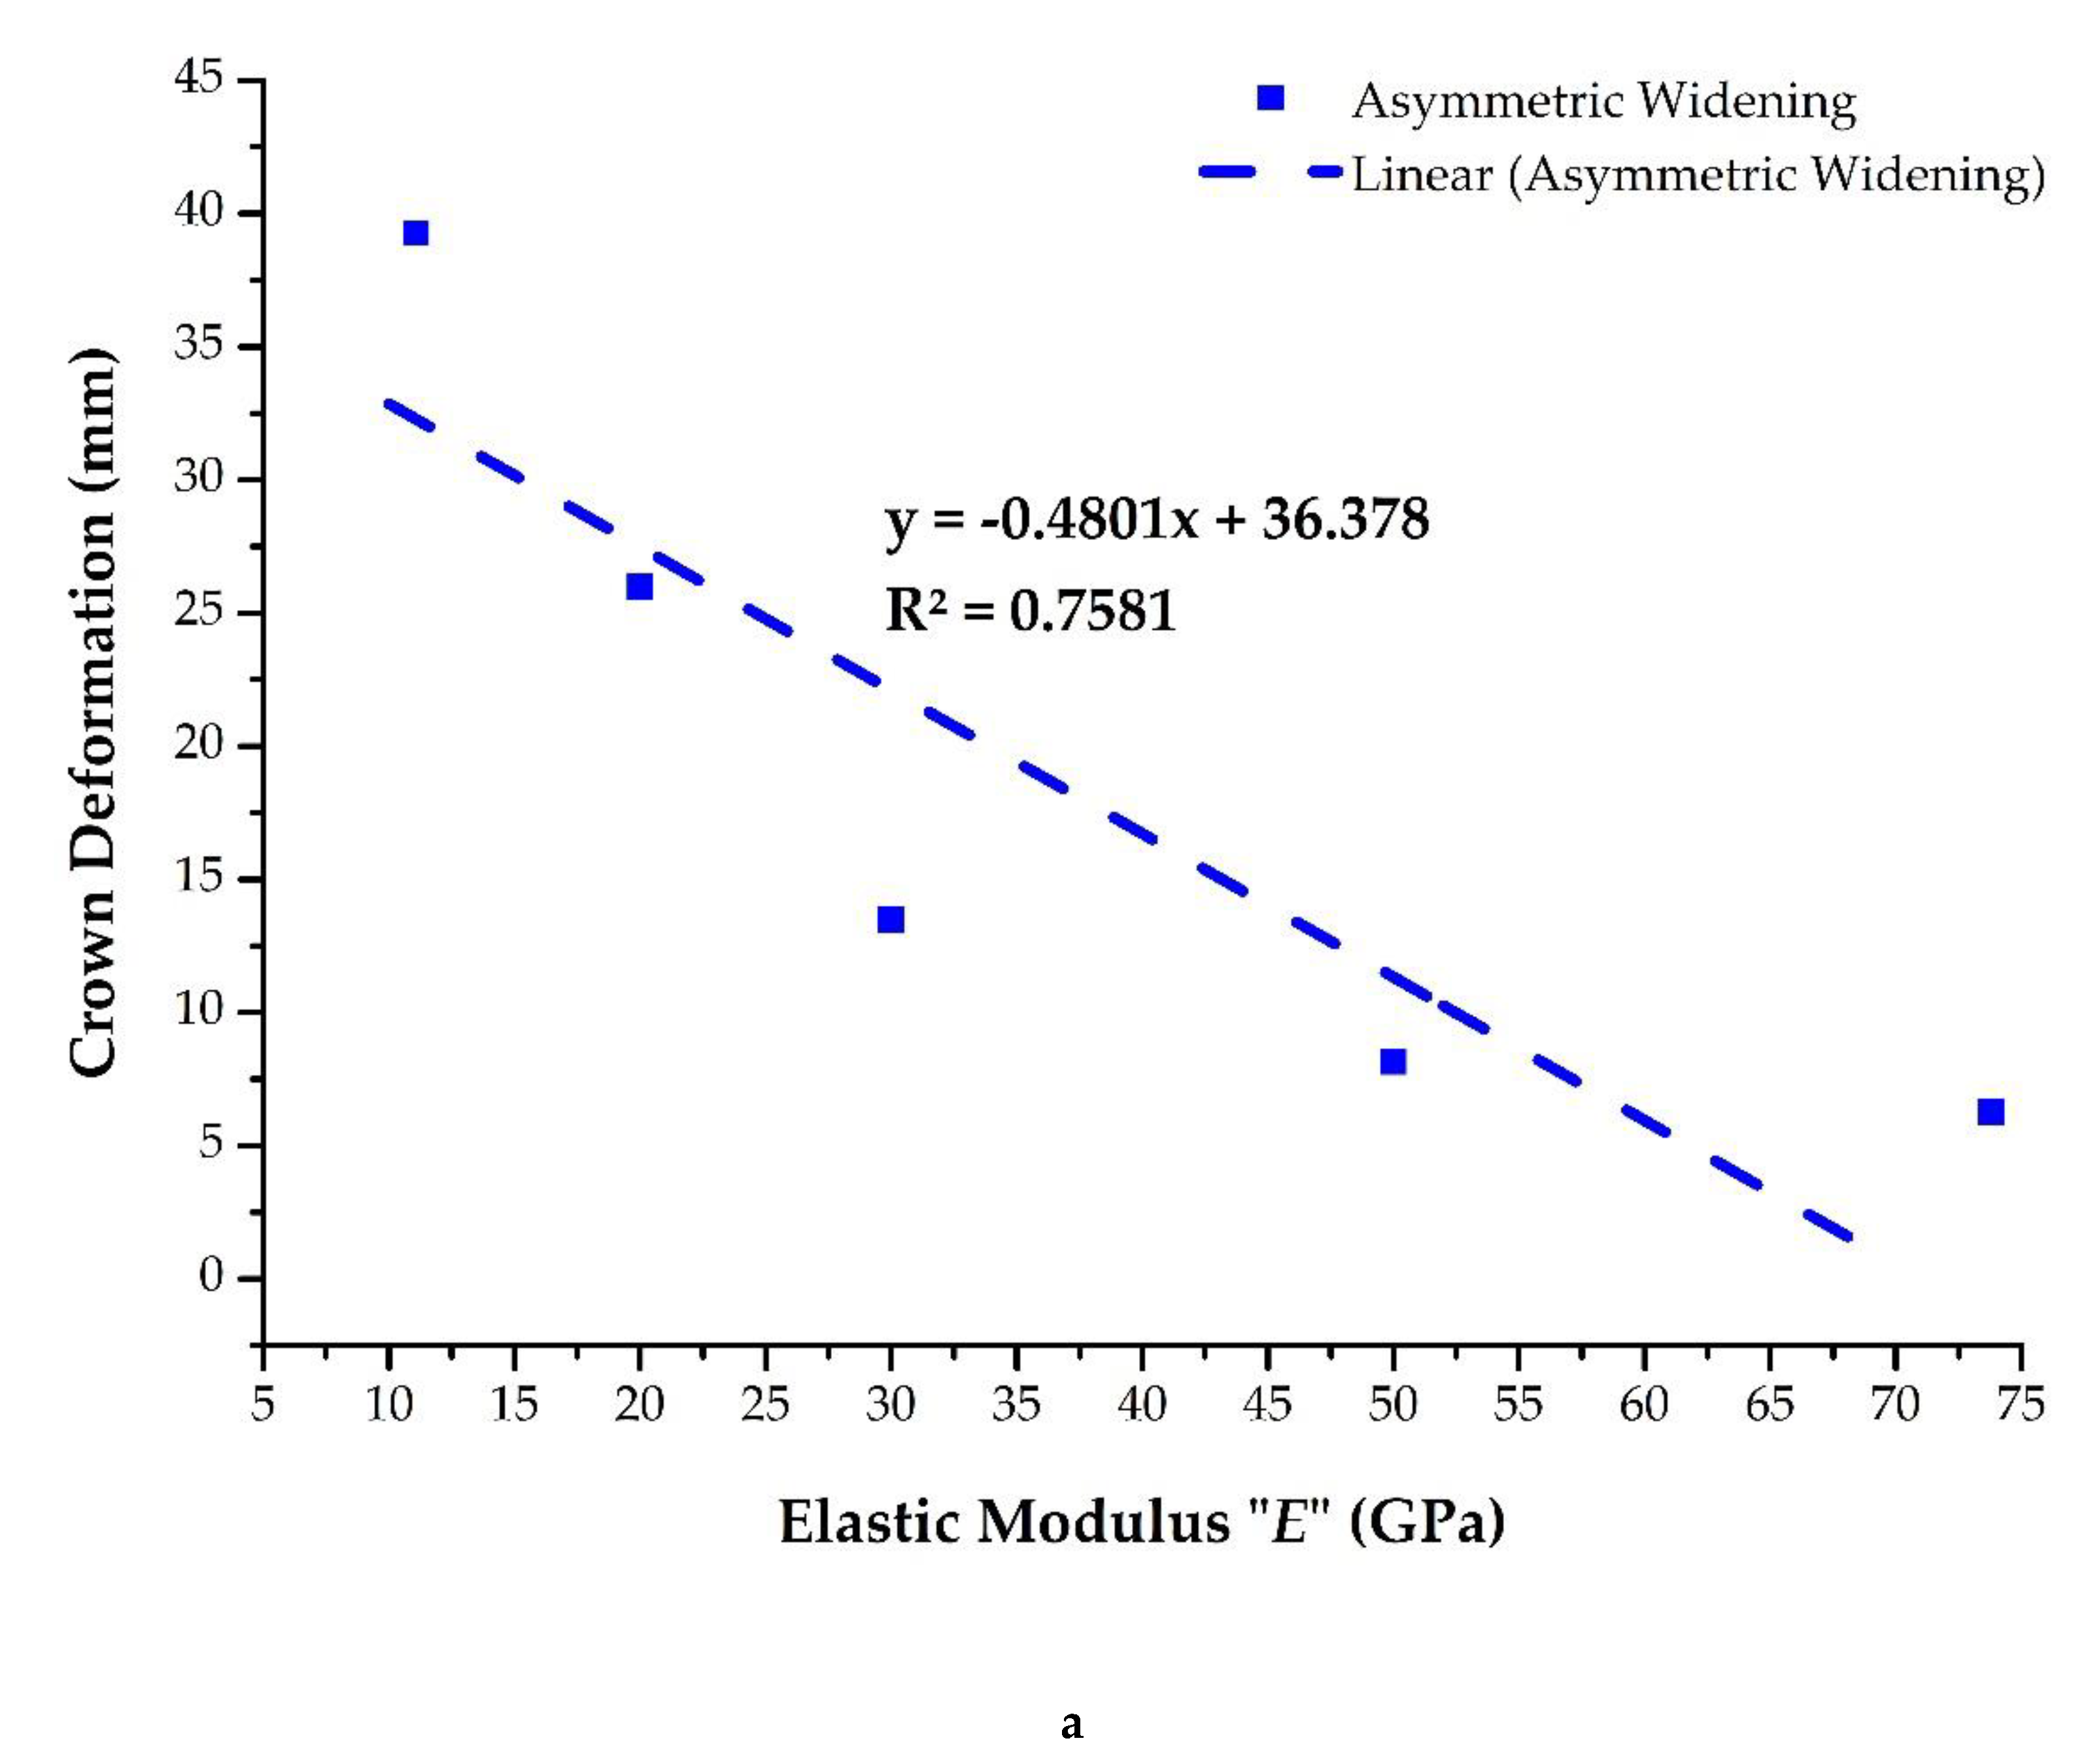
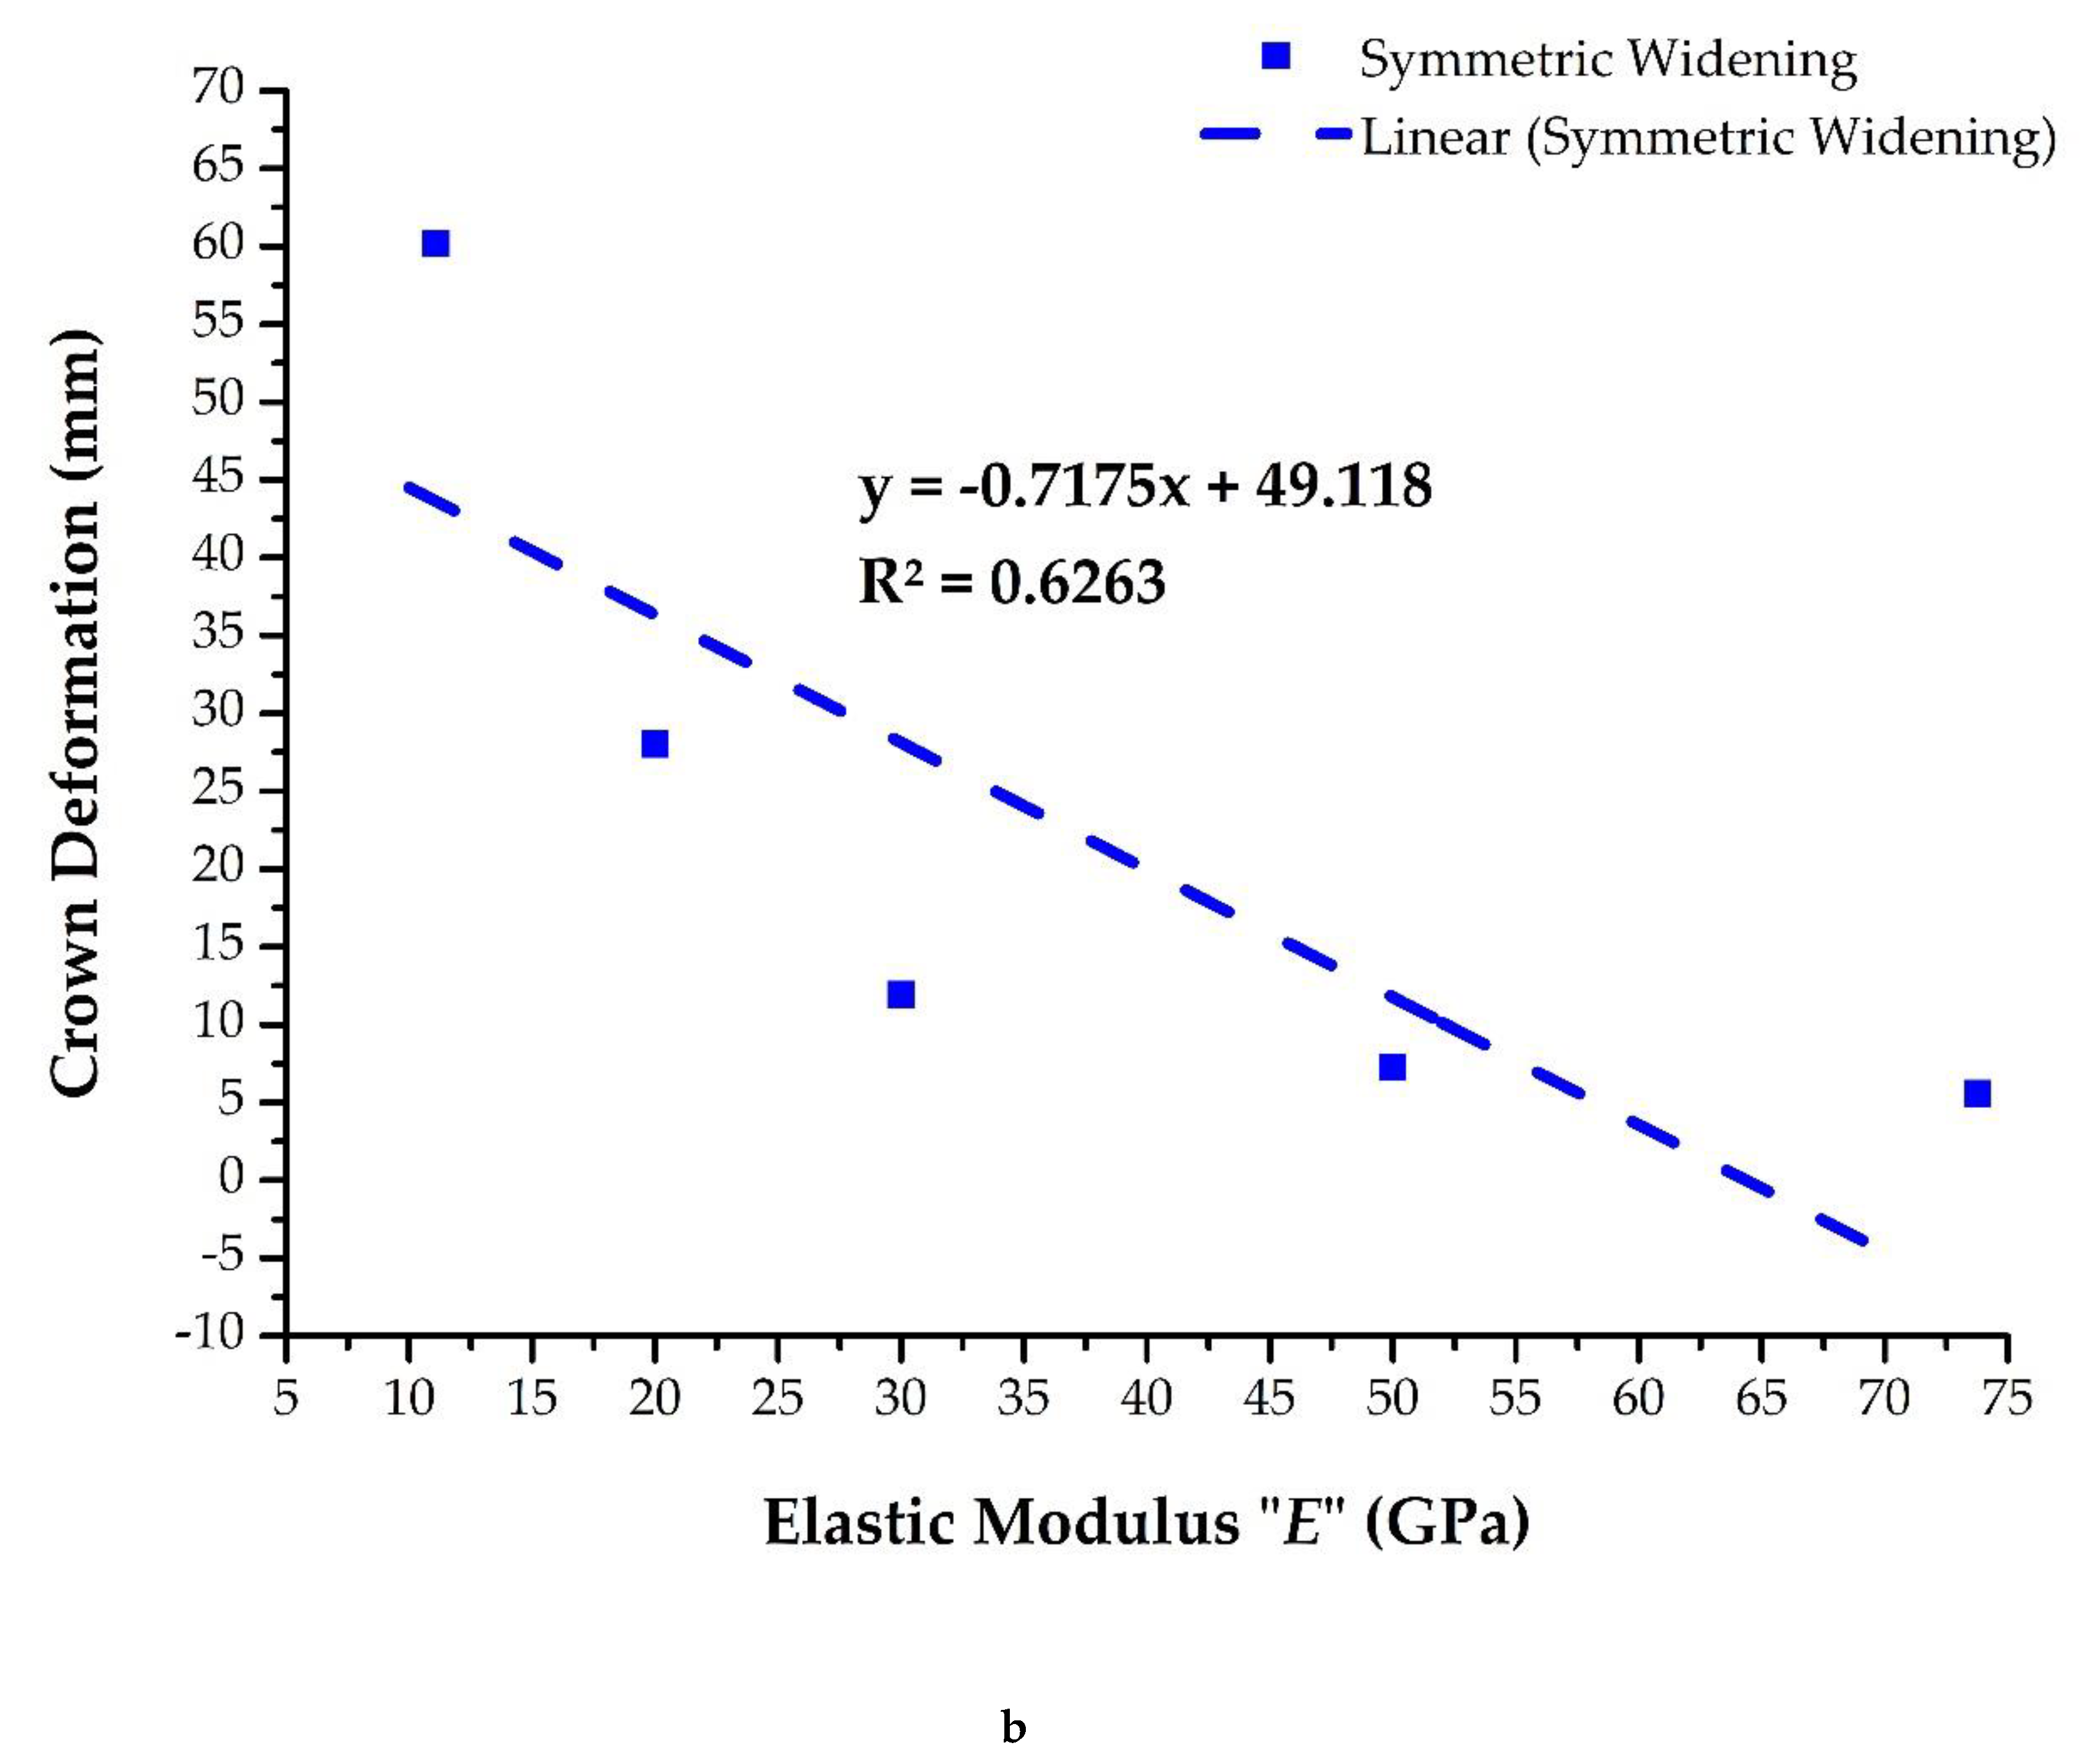
4.3.2. The Effect of the Elastic Modulus (E) on Rock Mass Behavior

During the analysis for variation in E, all parameters were kept constant except for E, which was varied to evaluate the effect on the widening process of the horseshoe shape tunnel as that adapted in Lowari tunnel project. The E was selected within a range from 11.1 to 73.8 GPa. The difference in behavior of rock mass deformation in asymmetric and symmetric widening with respect to different ranges of E is shown in Figure 13, whereas the linear regression analysis for deformation is shown in Figure 14.
While evaluating the effect of the elastic modulus (E), it was found that the deformation of the tunnel is inversely proportional to the E, as with the increase of E, the deformation decreases. The difference in deformation in the tunnel increases as the rock gets softer. Therefore, for the soft rock mass, when the elastic modulus is smaller, the excavation of asymmetric widening can provide better results. Furthermore, the regression analysis revealed that the slope variation of symmetric widening is greater as compared to asymmetric widening with the variation of E.

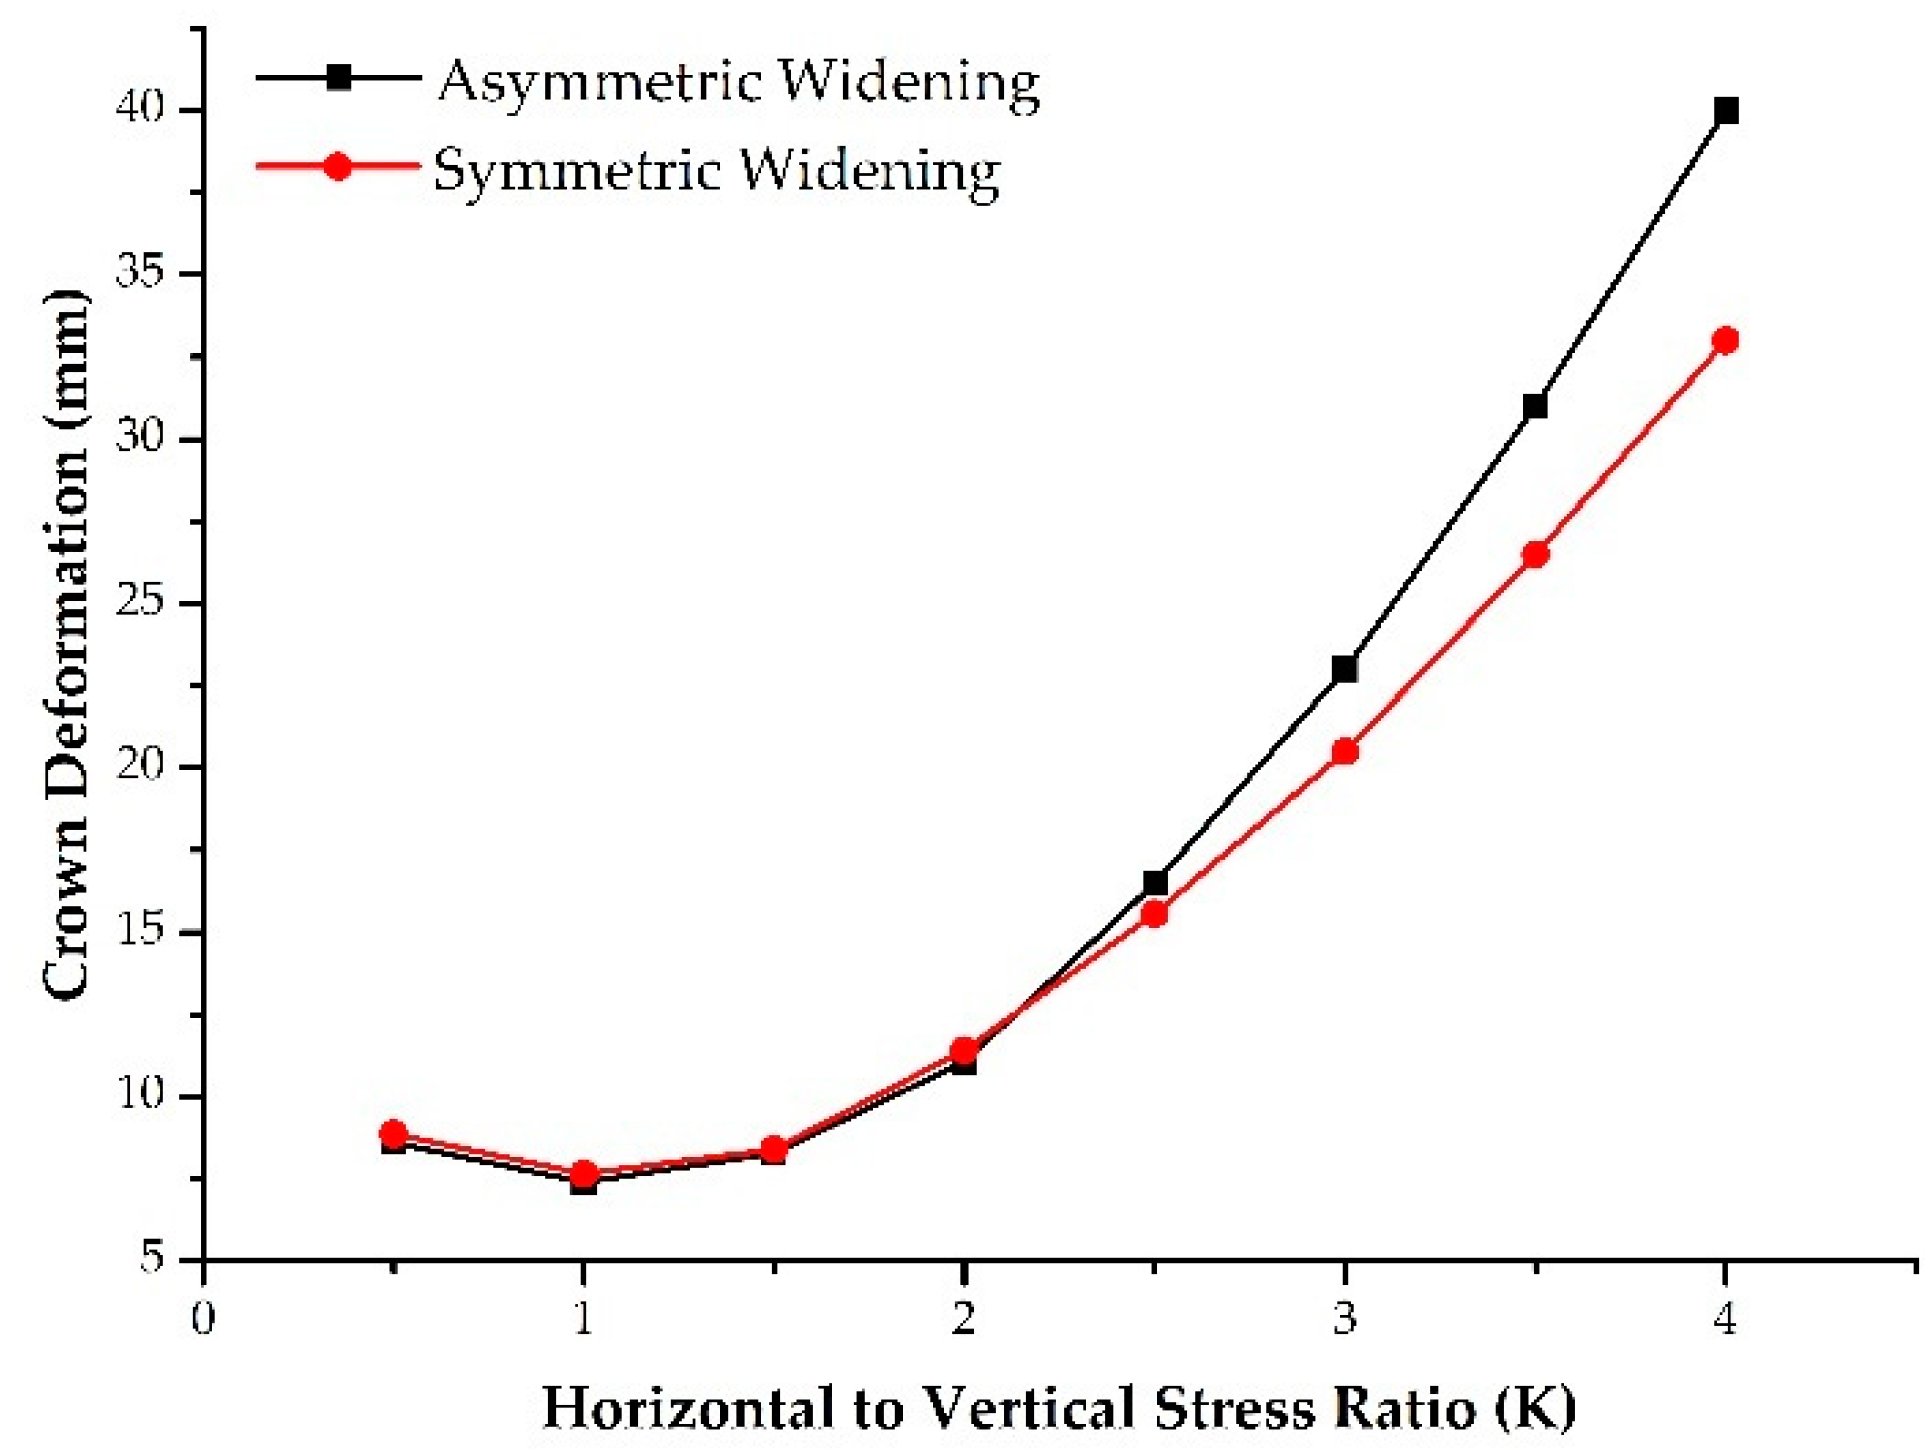
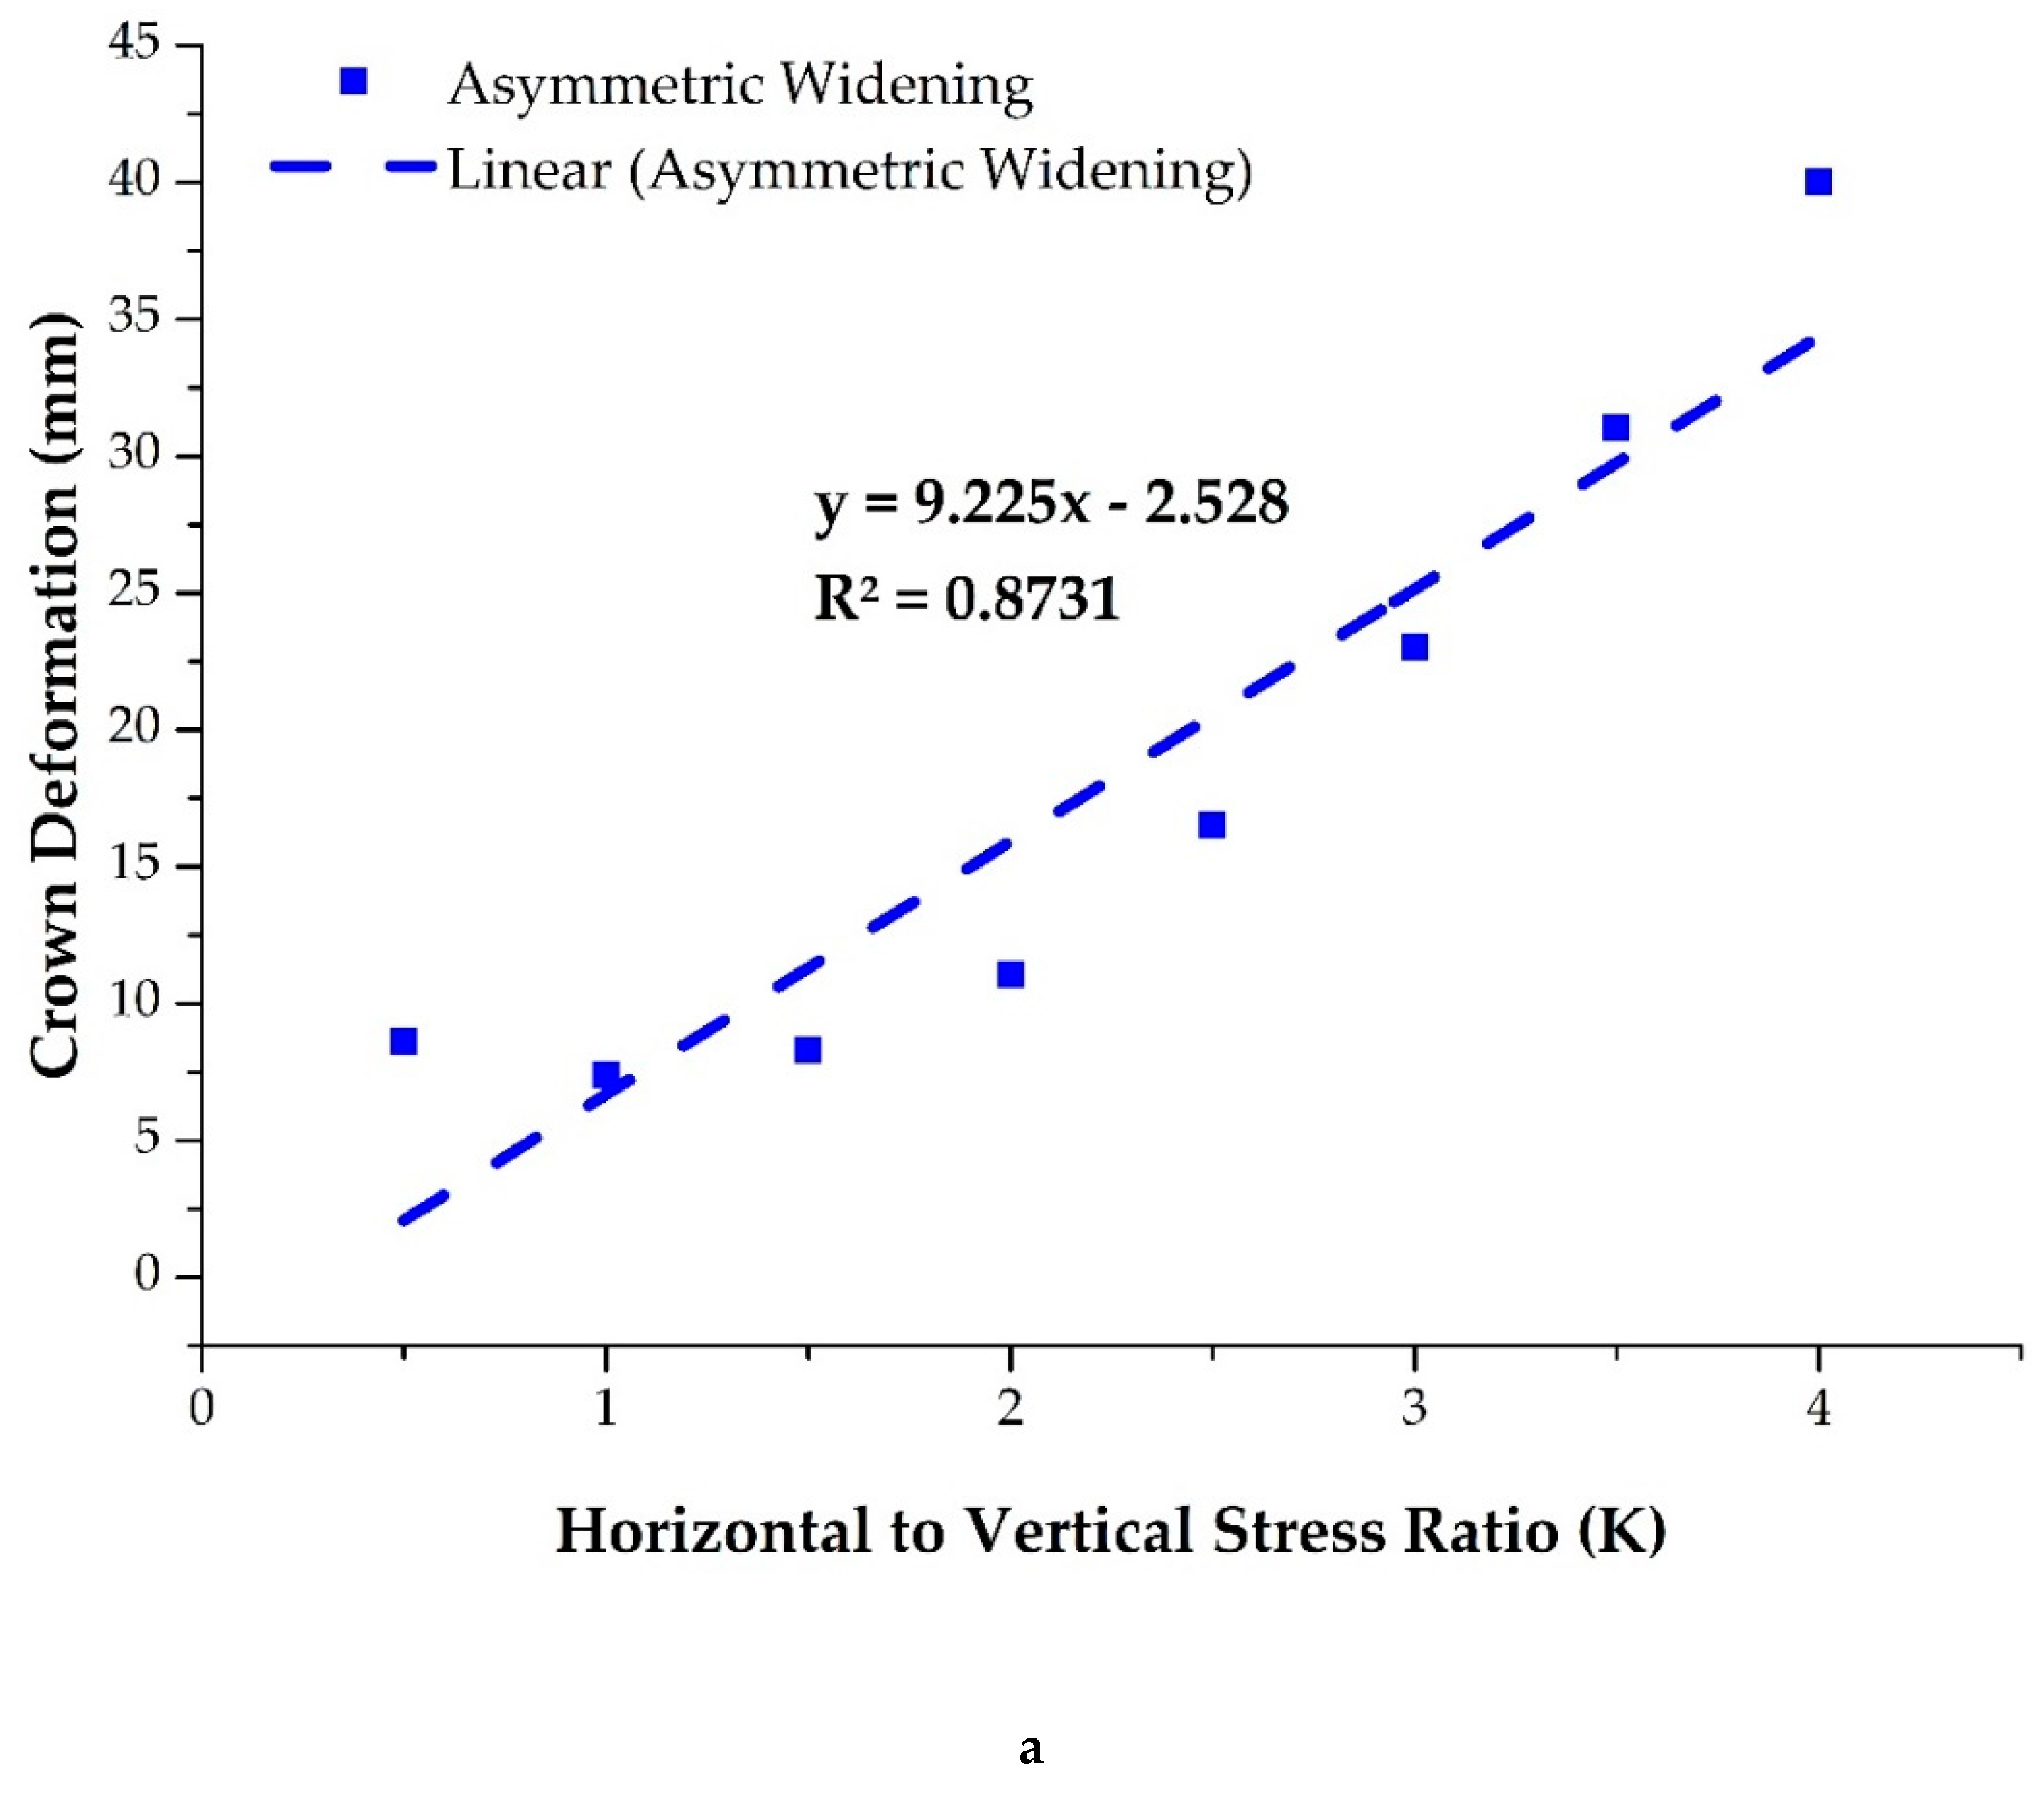
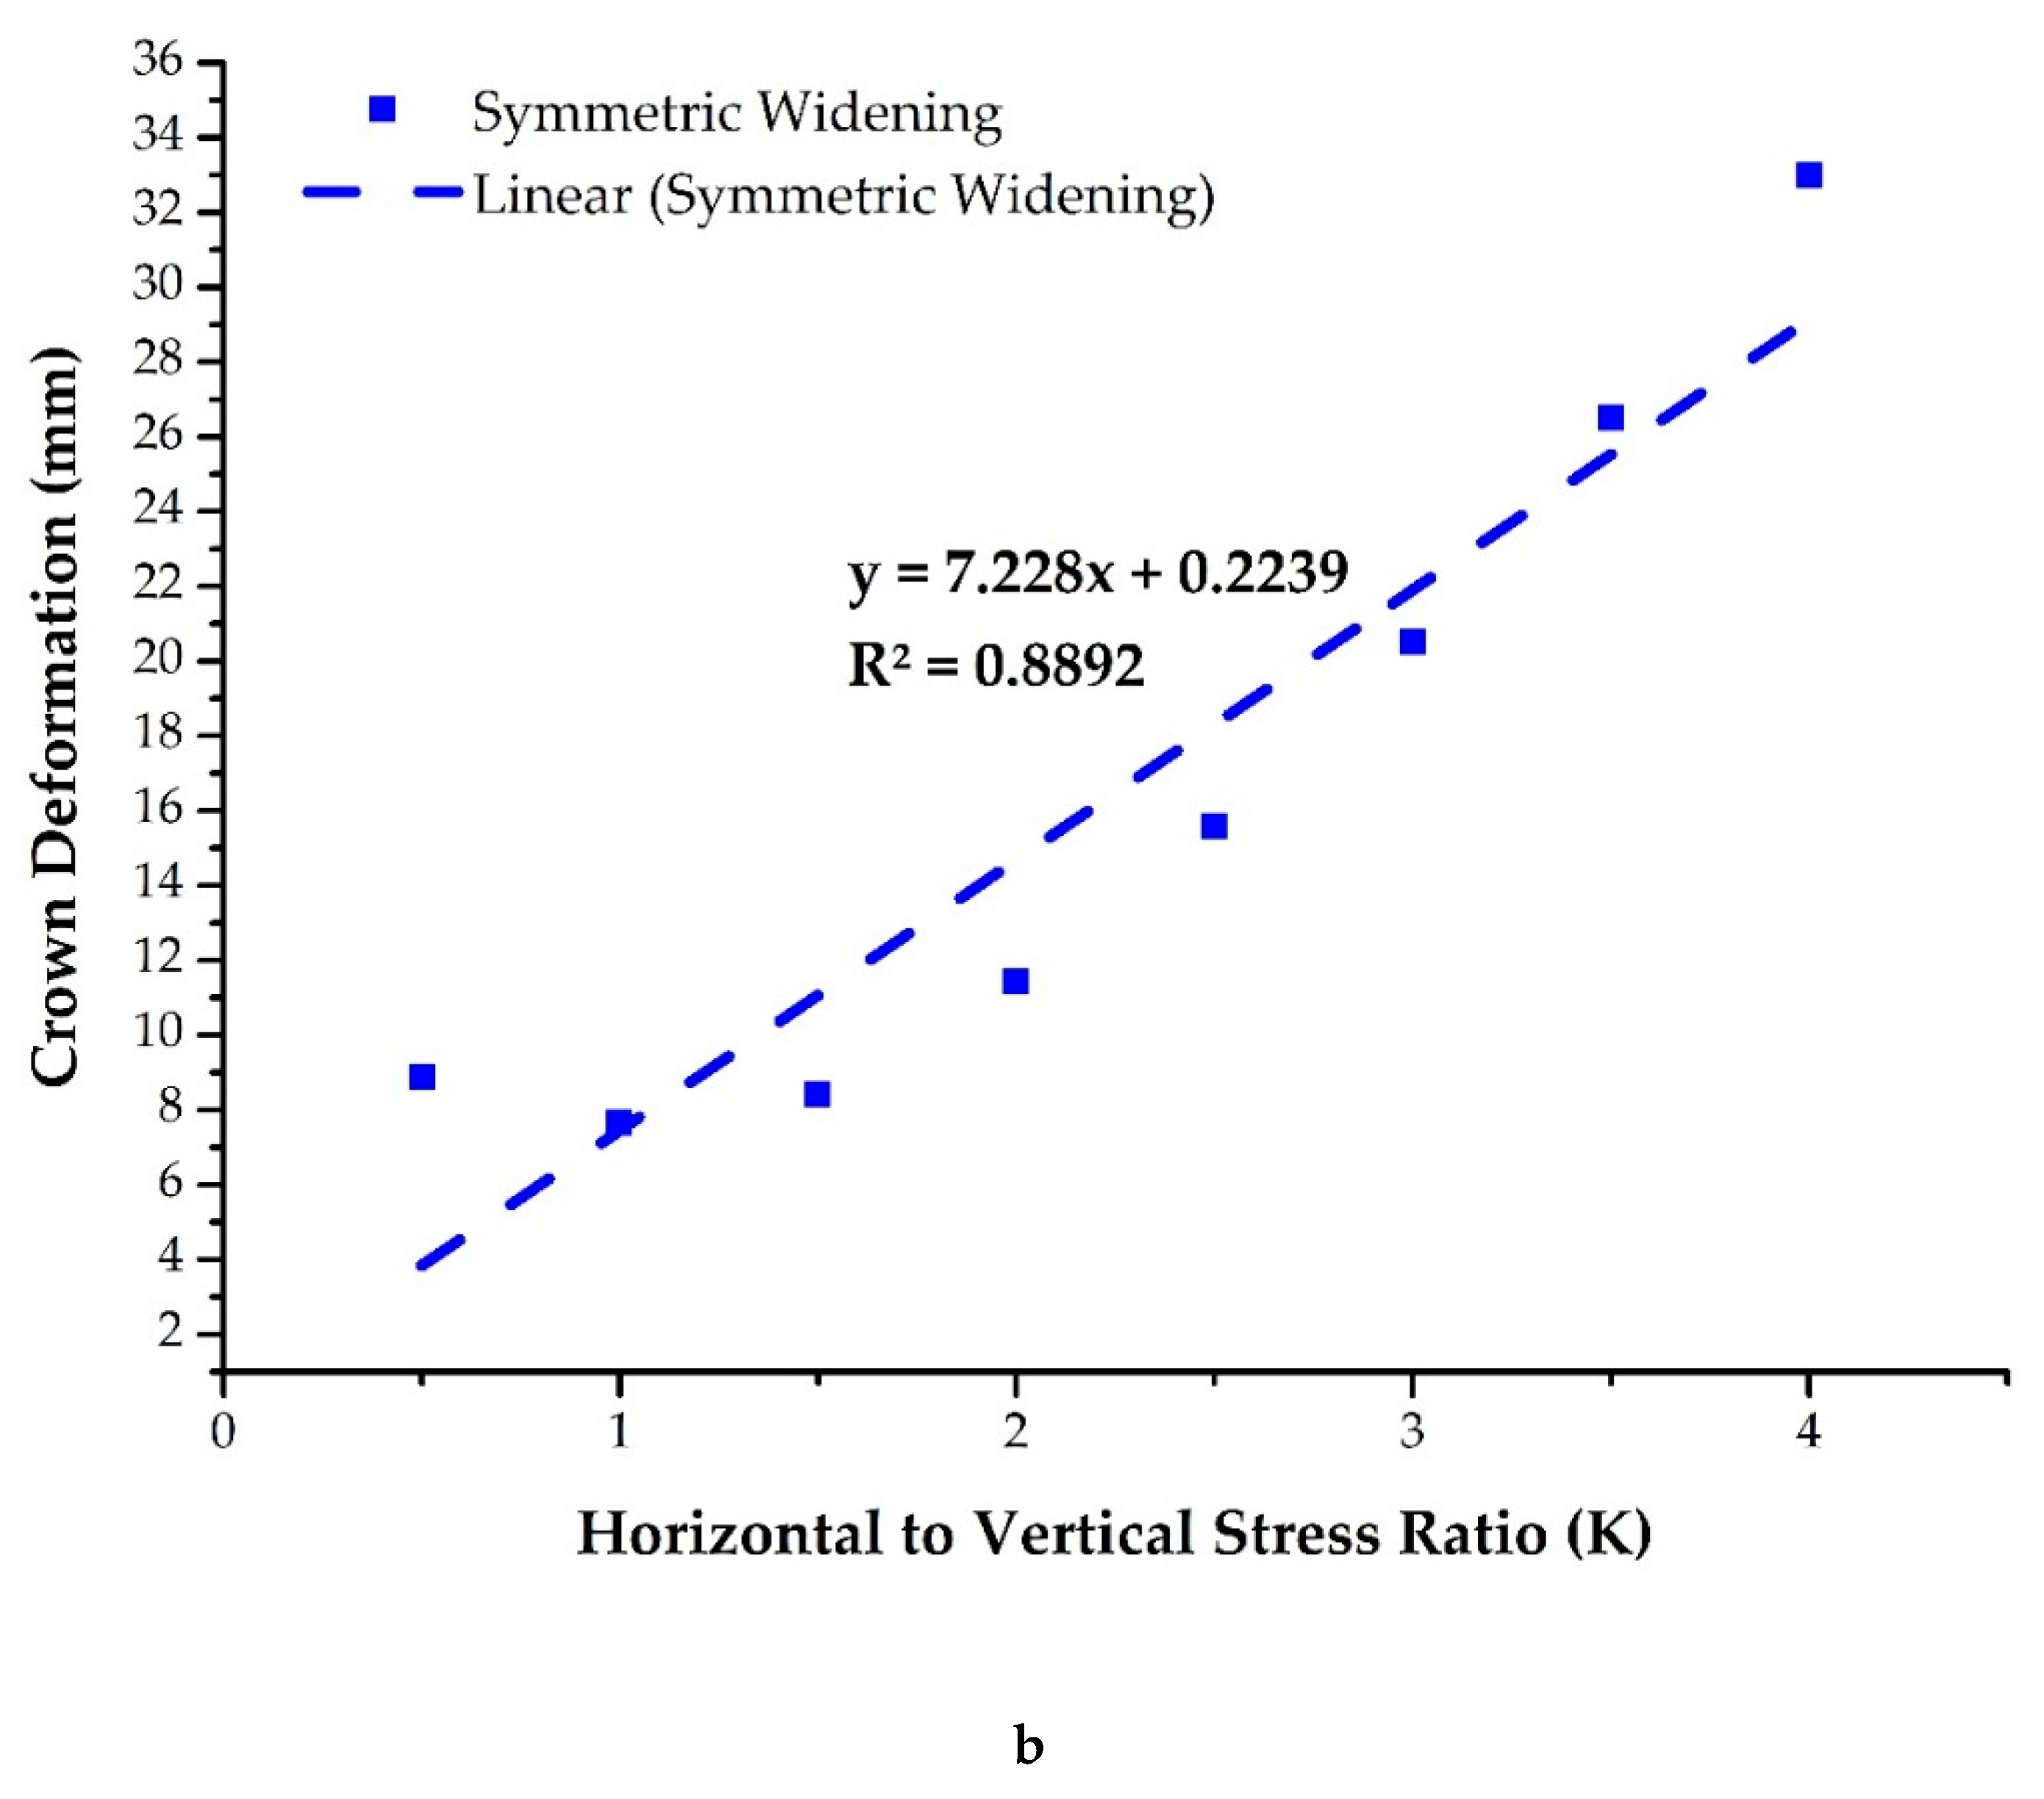
4.3.3. The Effect of the Horizontal to Vertical Stress Ratio (K) on Rock Mass Behavior

A different horizontal to vertical stress ratio (K) value was selected for parametric analysis while keeping the other parameters constant. In this respect, a different value of K, varying from 0.5 to 2.5, was selected. The correlation of different values of K and respective deformation at the crown for both asymmetric and symmetric widening is plotted in Figure 15. For the linear regression of the two separate graphs, as shown in Figure 16, two-separate equations are provided for both cases.
The value of the horizontal to vertical stress ratio (K) has a considerable effect on the tunnel deformation, in which the effect on the asymmetric widening is greater than that of its counterpart. Therefore, the slope is comparatively steep for asymmetric widening, hence revealing that the tunnel can widen symmetrically more comfortably with high K values.

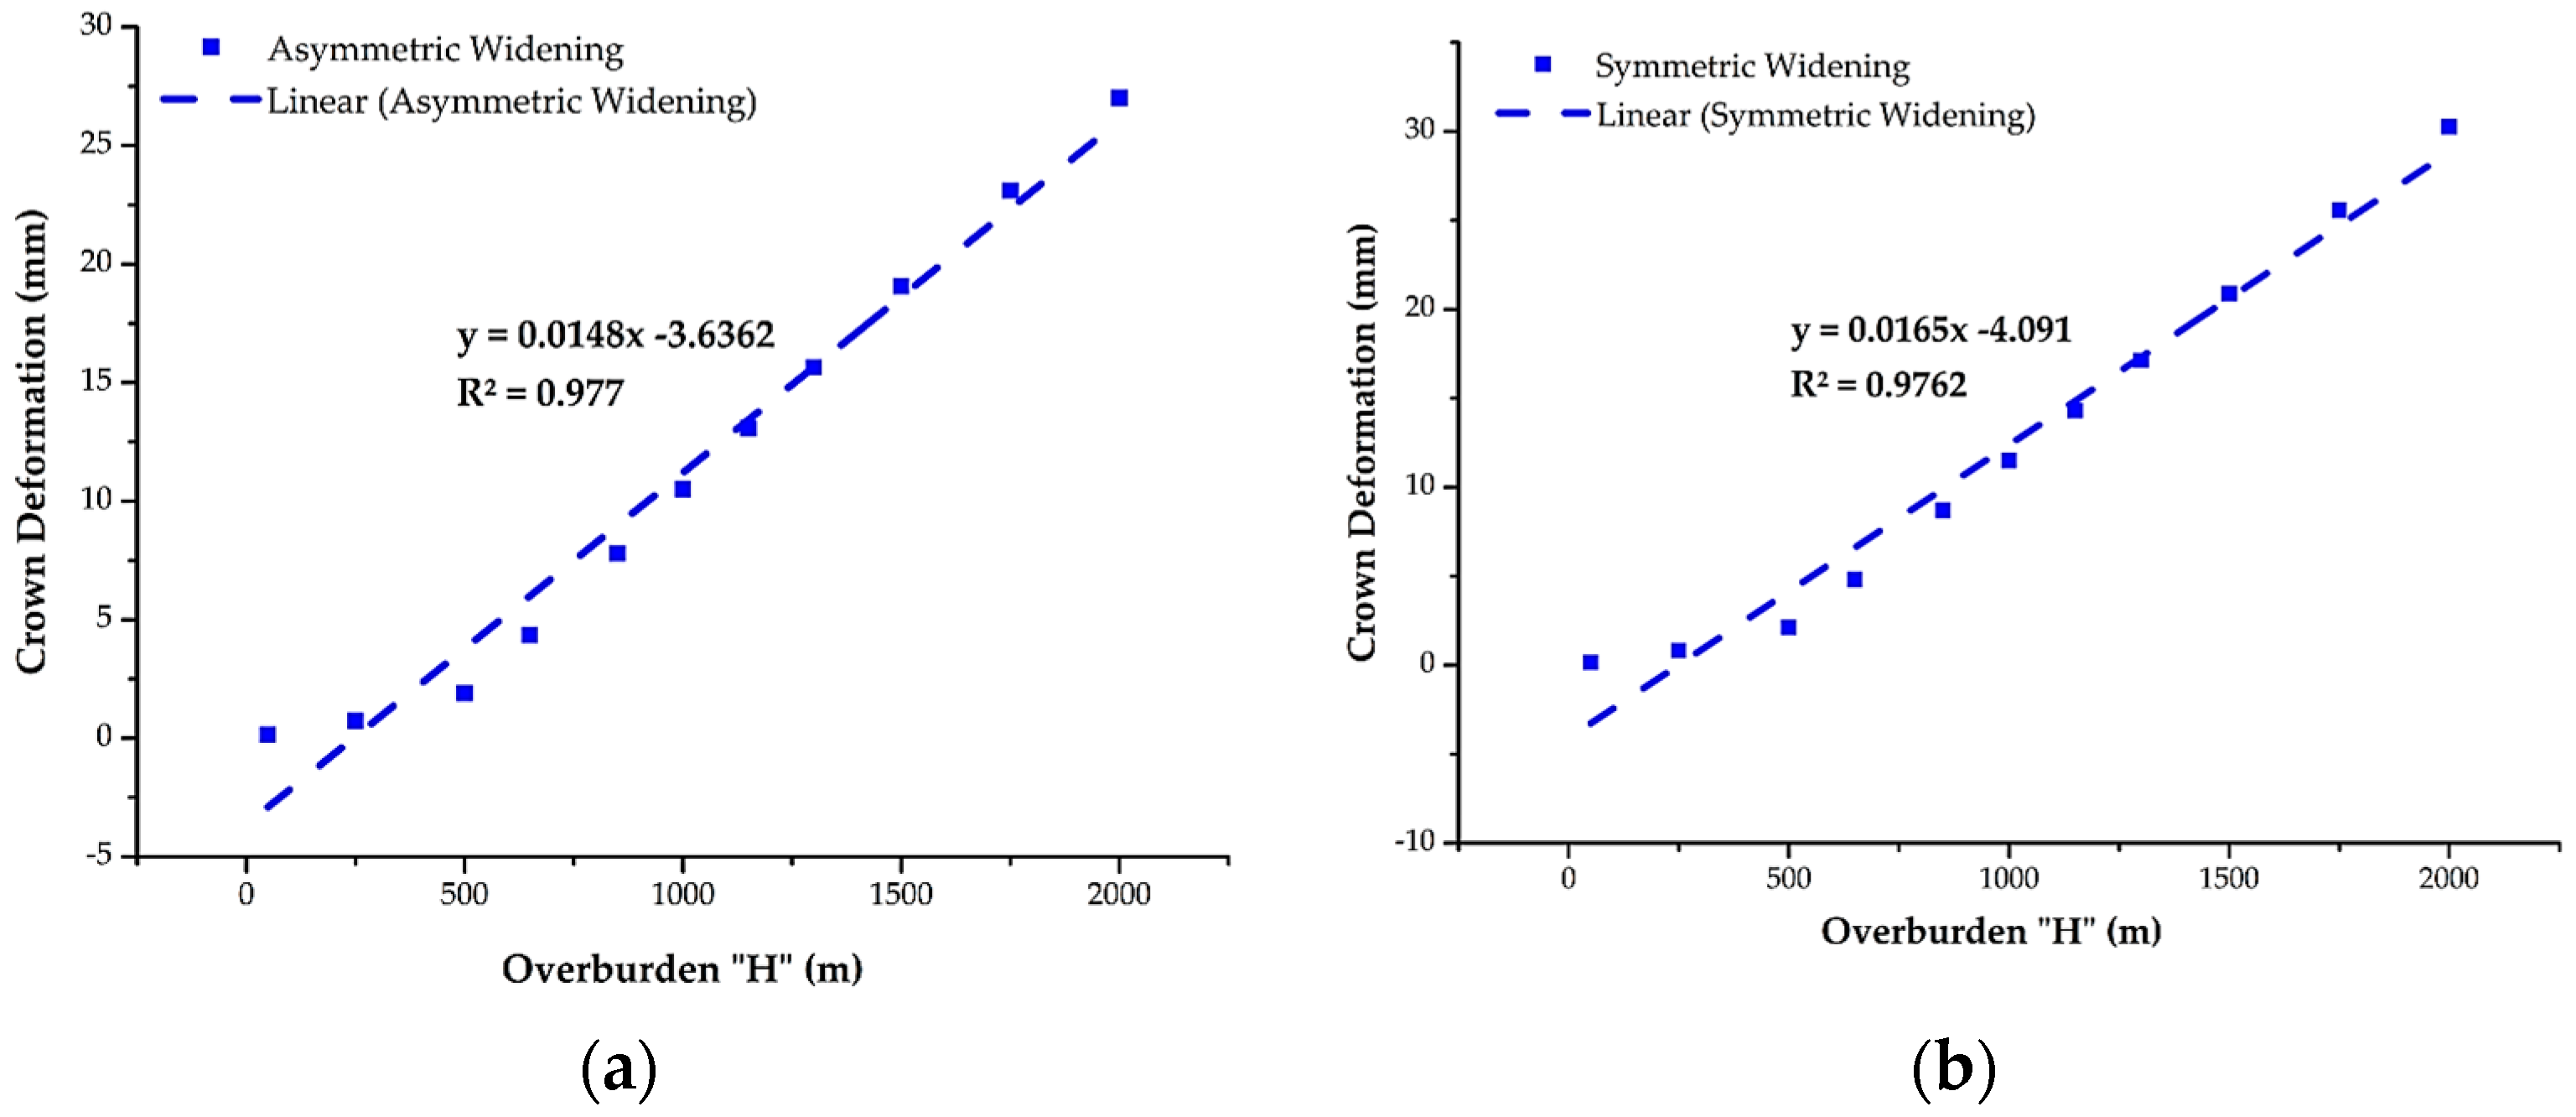
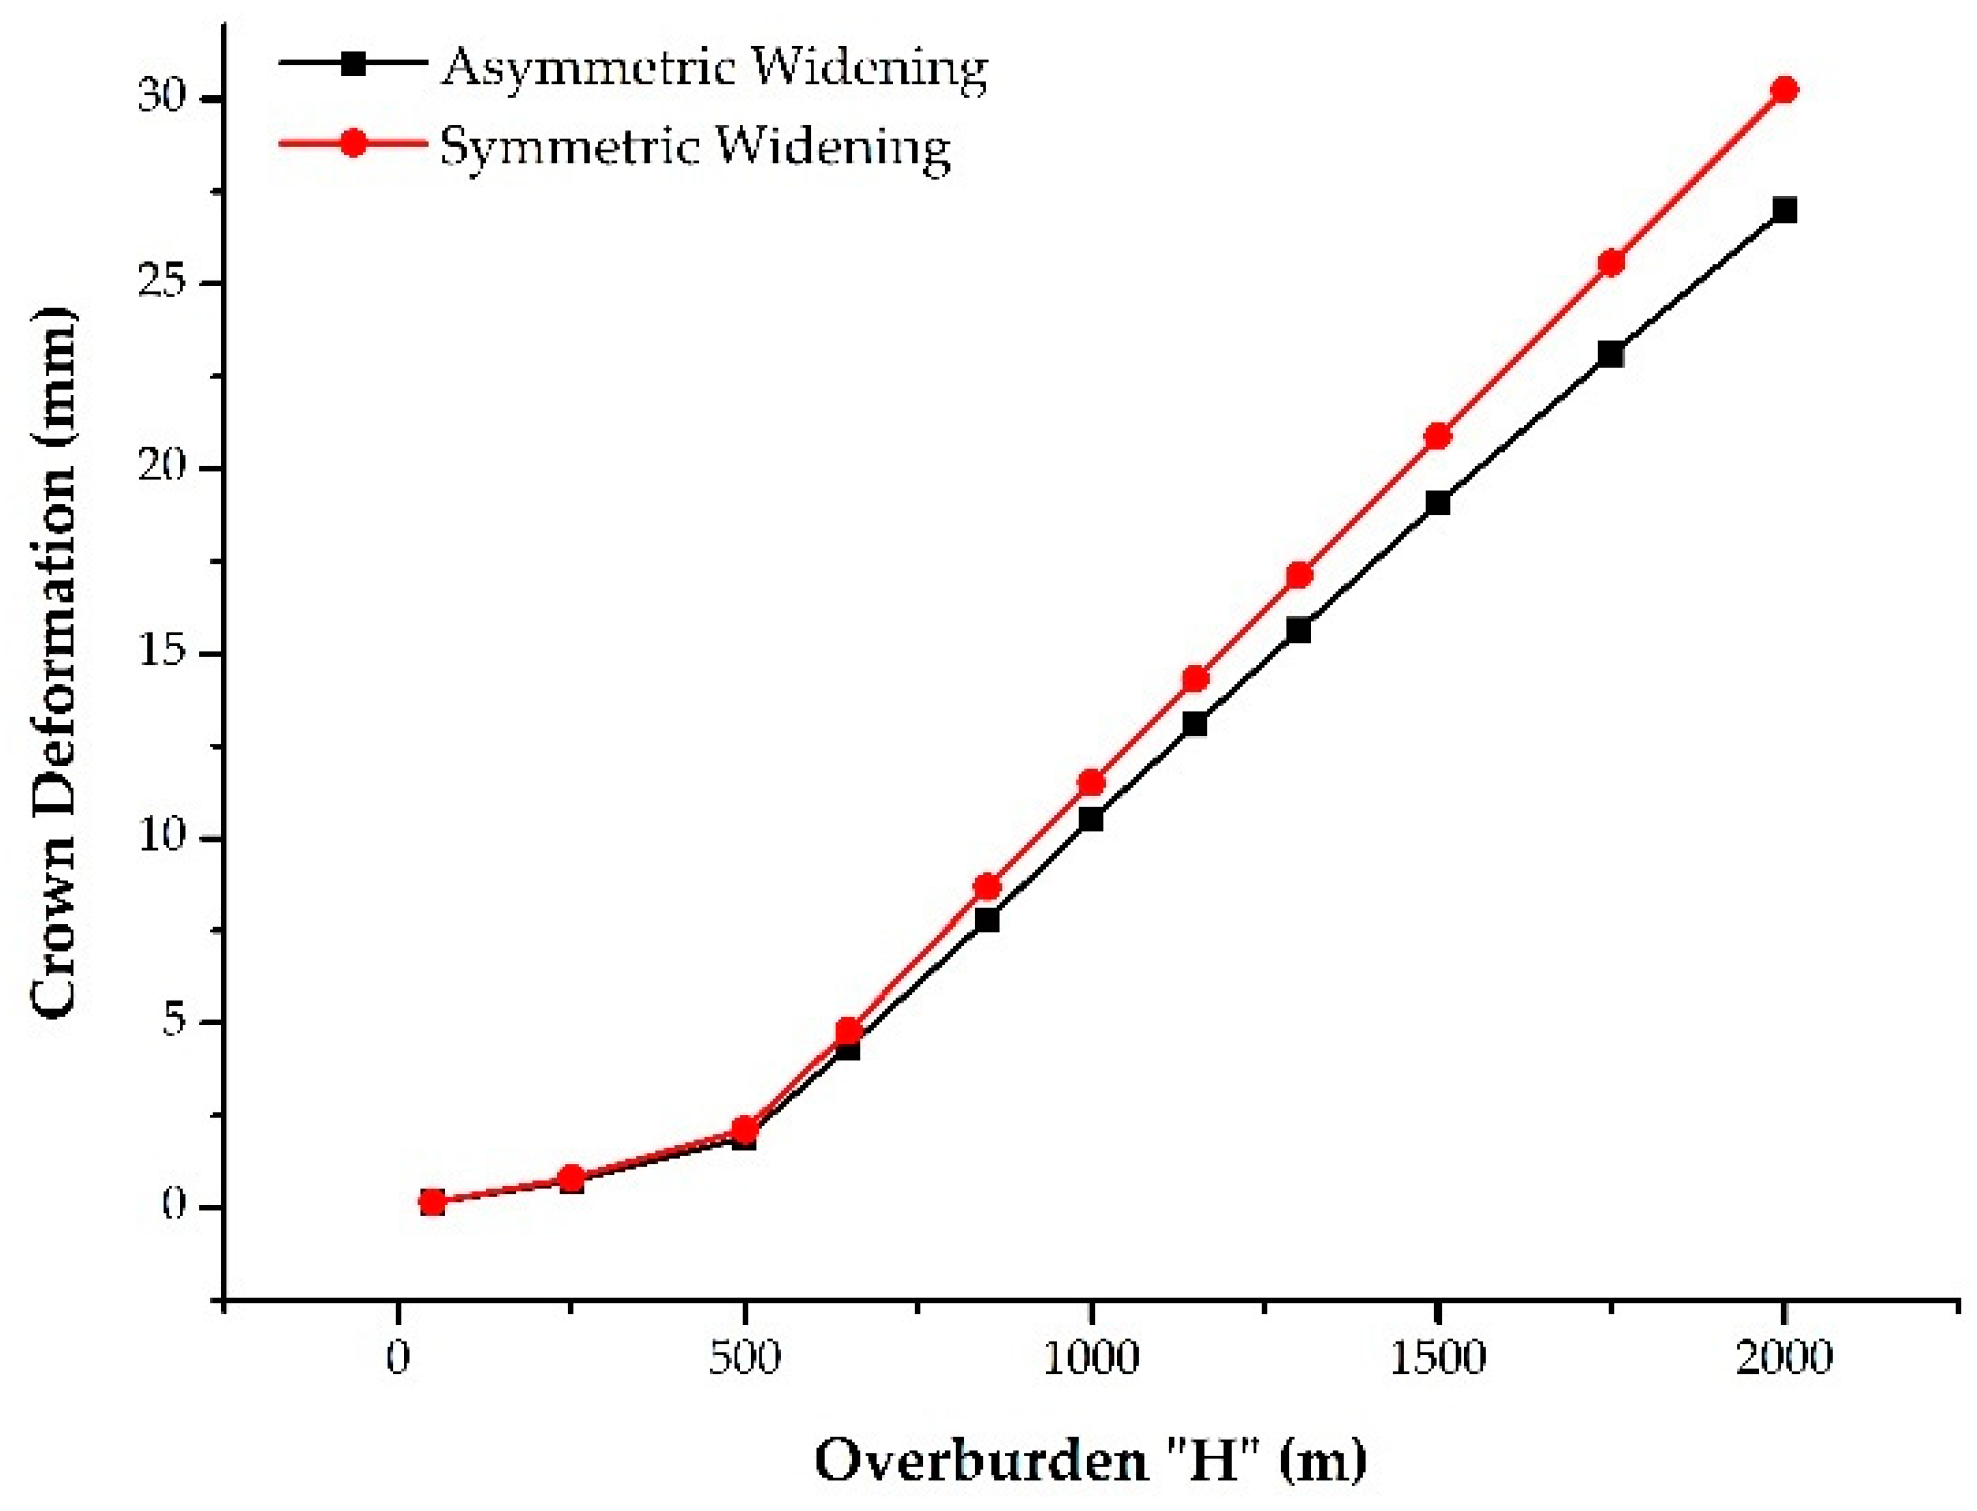
4.3.4. Effect of the Overburden Height (H) on Rock Mass Behavior

Mountainous tunnels are usually deep tunnels, and urban tunnels mostly have a shallow depth; therefore, it is also vital to get an understanding of the effect of overburden stresses on the tunnel widening for a variety of H values. For this purpose, the overburden of different ranges was considered for the study between a shallow depth of 50 m to the deep tunnel depth of 2000 m for a horseshoe tunnel while keeping all other parameters constant. The differences in the behavior of rock mass deformation in asymmetric and symmetric widening are shown in Figure 17. The linear regression analysis of the two separate widening modes is shown in Figure 18, which provides the two separate equations.
The overburden height (H) is directly proportional to the tunnel deformation and depicts a steep gradient. Among both types of tunnel widening, more deformation was recorded in the symmetric tunnel as compared to the asymmetric tunnel. Therefore, it is concluded that the asymmetric tunnel widening is the better option in deep tunnels, and symmetric widening can be carried out at shallow depths as both have a similar effect. The linear regression also revealed that the tunnel crown deformation slopes with different H values are comparatively less in asymmetric widening mode as compared to the other mode of widening.
The stresses on the tunnel are directly linked with H under the prevailing conditions of the tunnel model in the study. A stress comparison is shown in Figure 19, wherein the horizontal stresses are critical because K = 2, compared to at depths of 50 and 2000 m, where the ground stress becomes 2.7 and 108 MPa, respectively. The side walls show that the stress accumulation in the wall at a depth of 50 m is less than 1 MPa; however, the stress accumulation in the wall at a depth of 2000 m is around 12 MPa. Thus, the stresses have a great influence on the deformation of the tunnel owing to the considerable difference in the stress at the widening zone of the tunnel. The variation in deformation in both asymmetric and symmetric widening can be examined in Figure 17.

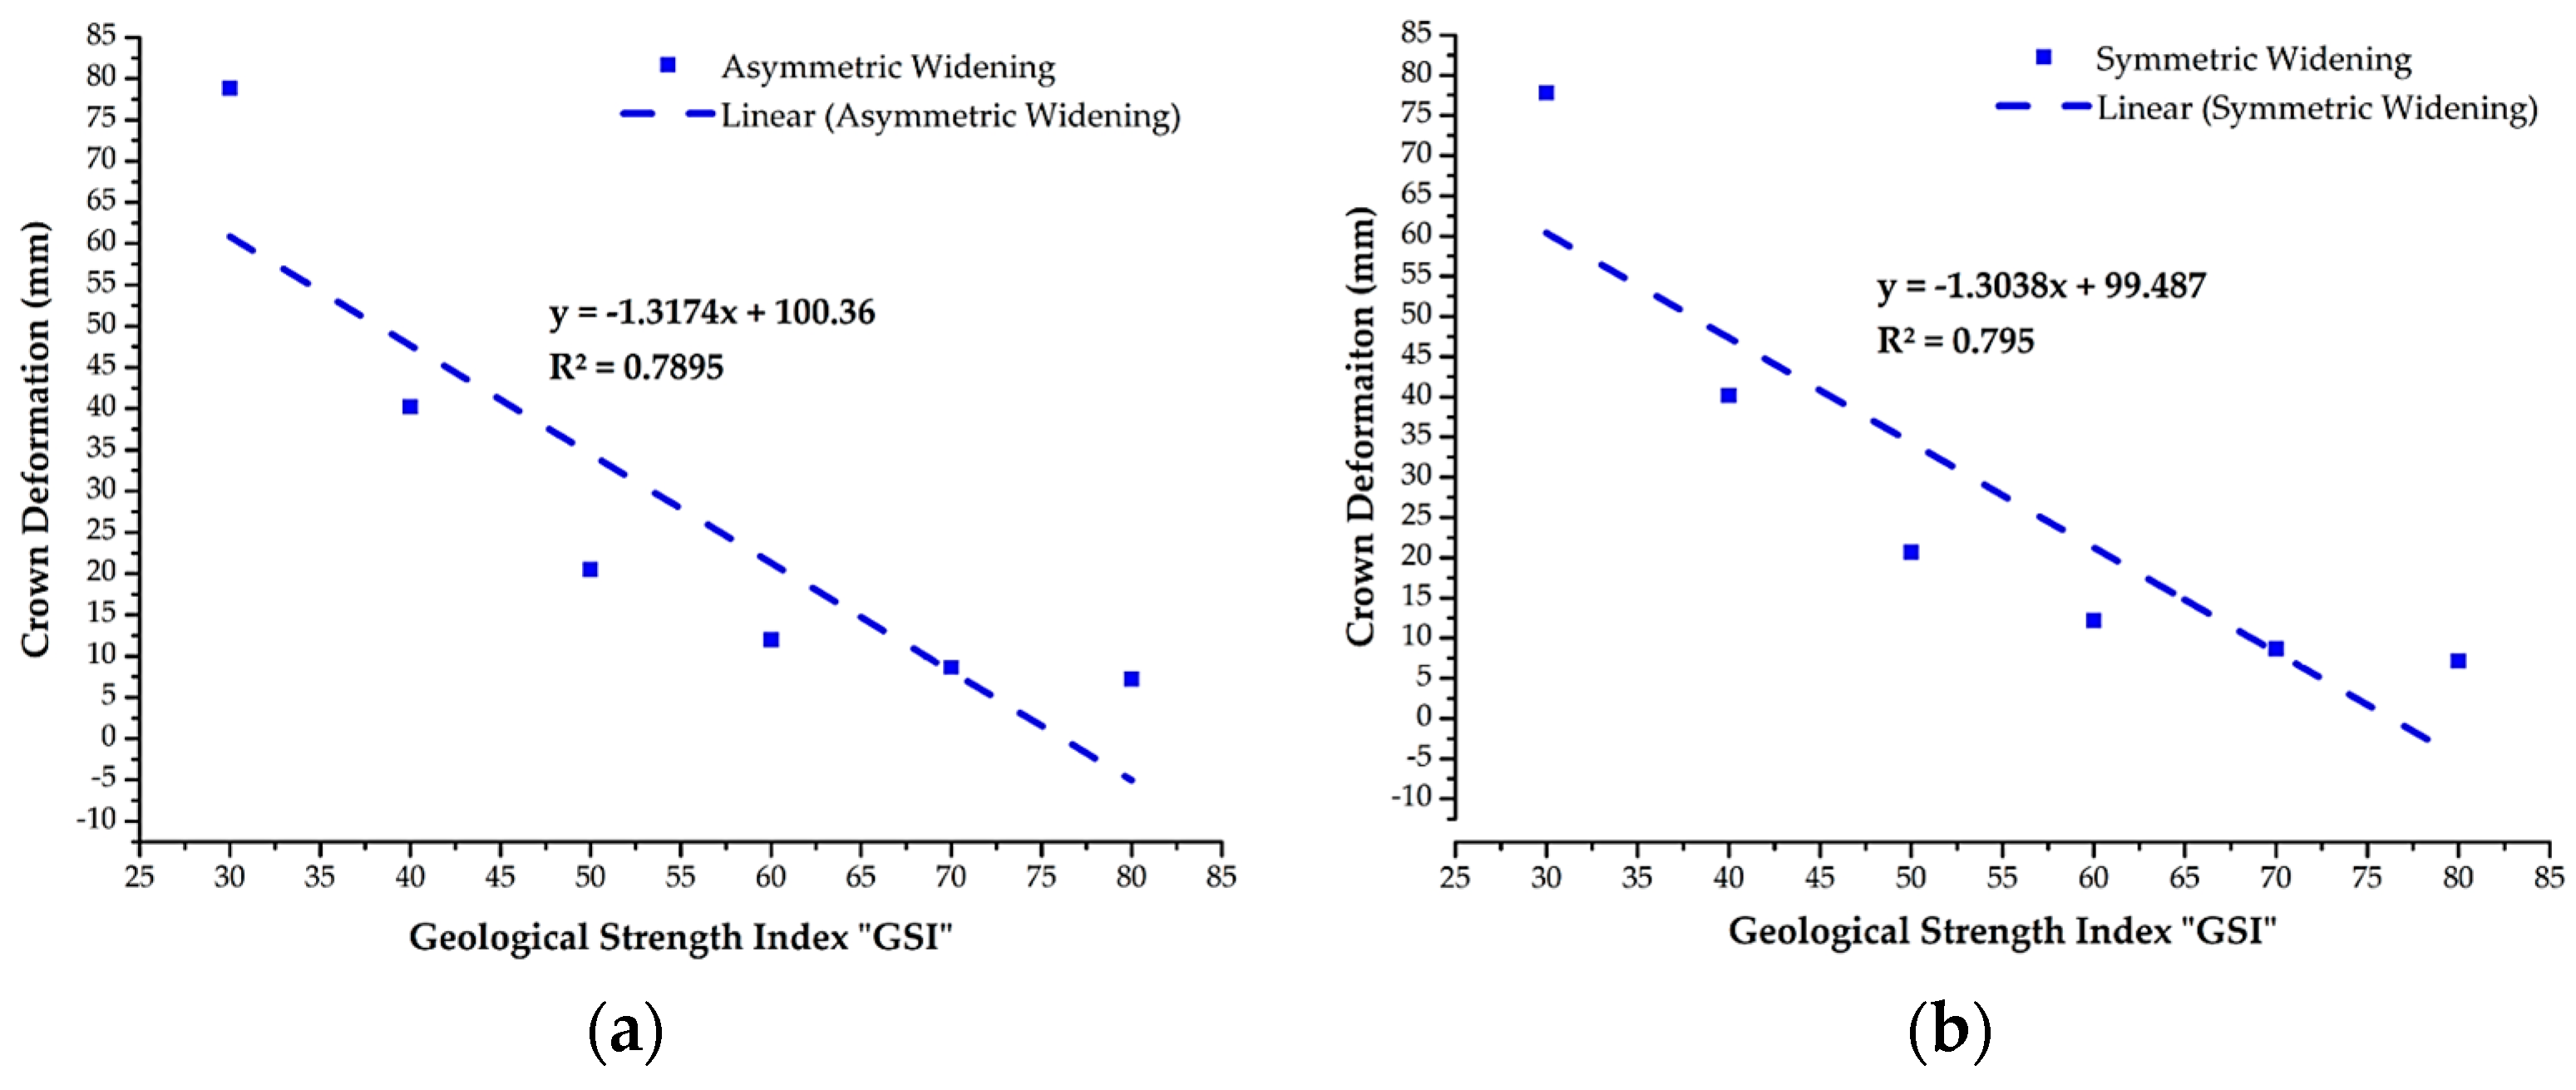
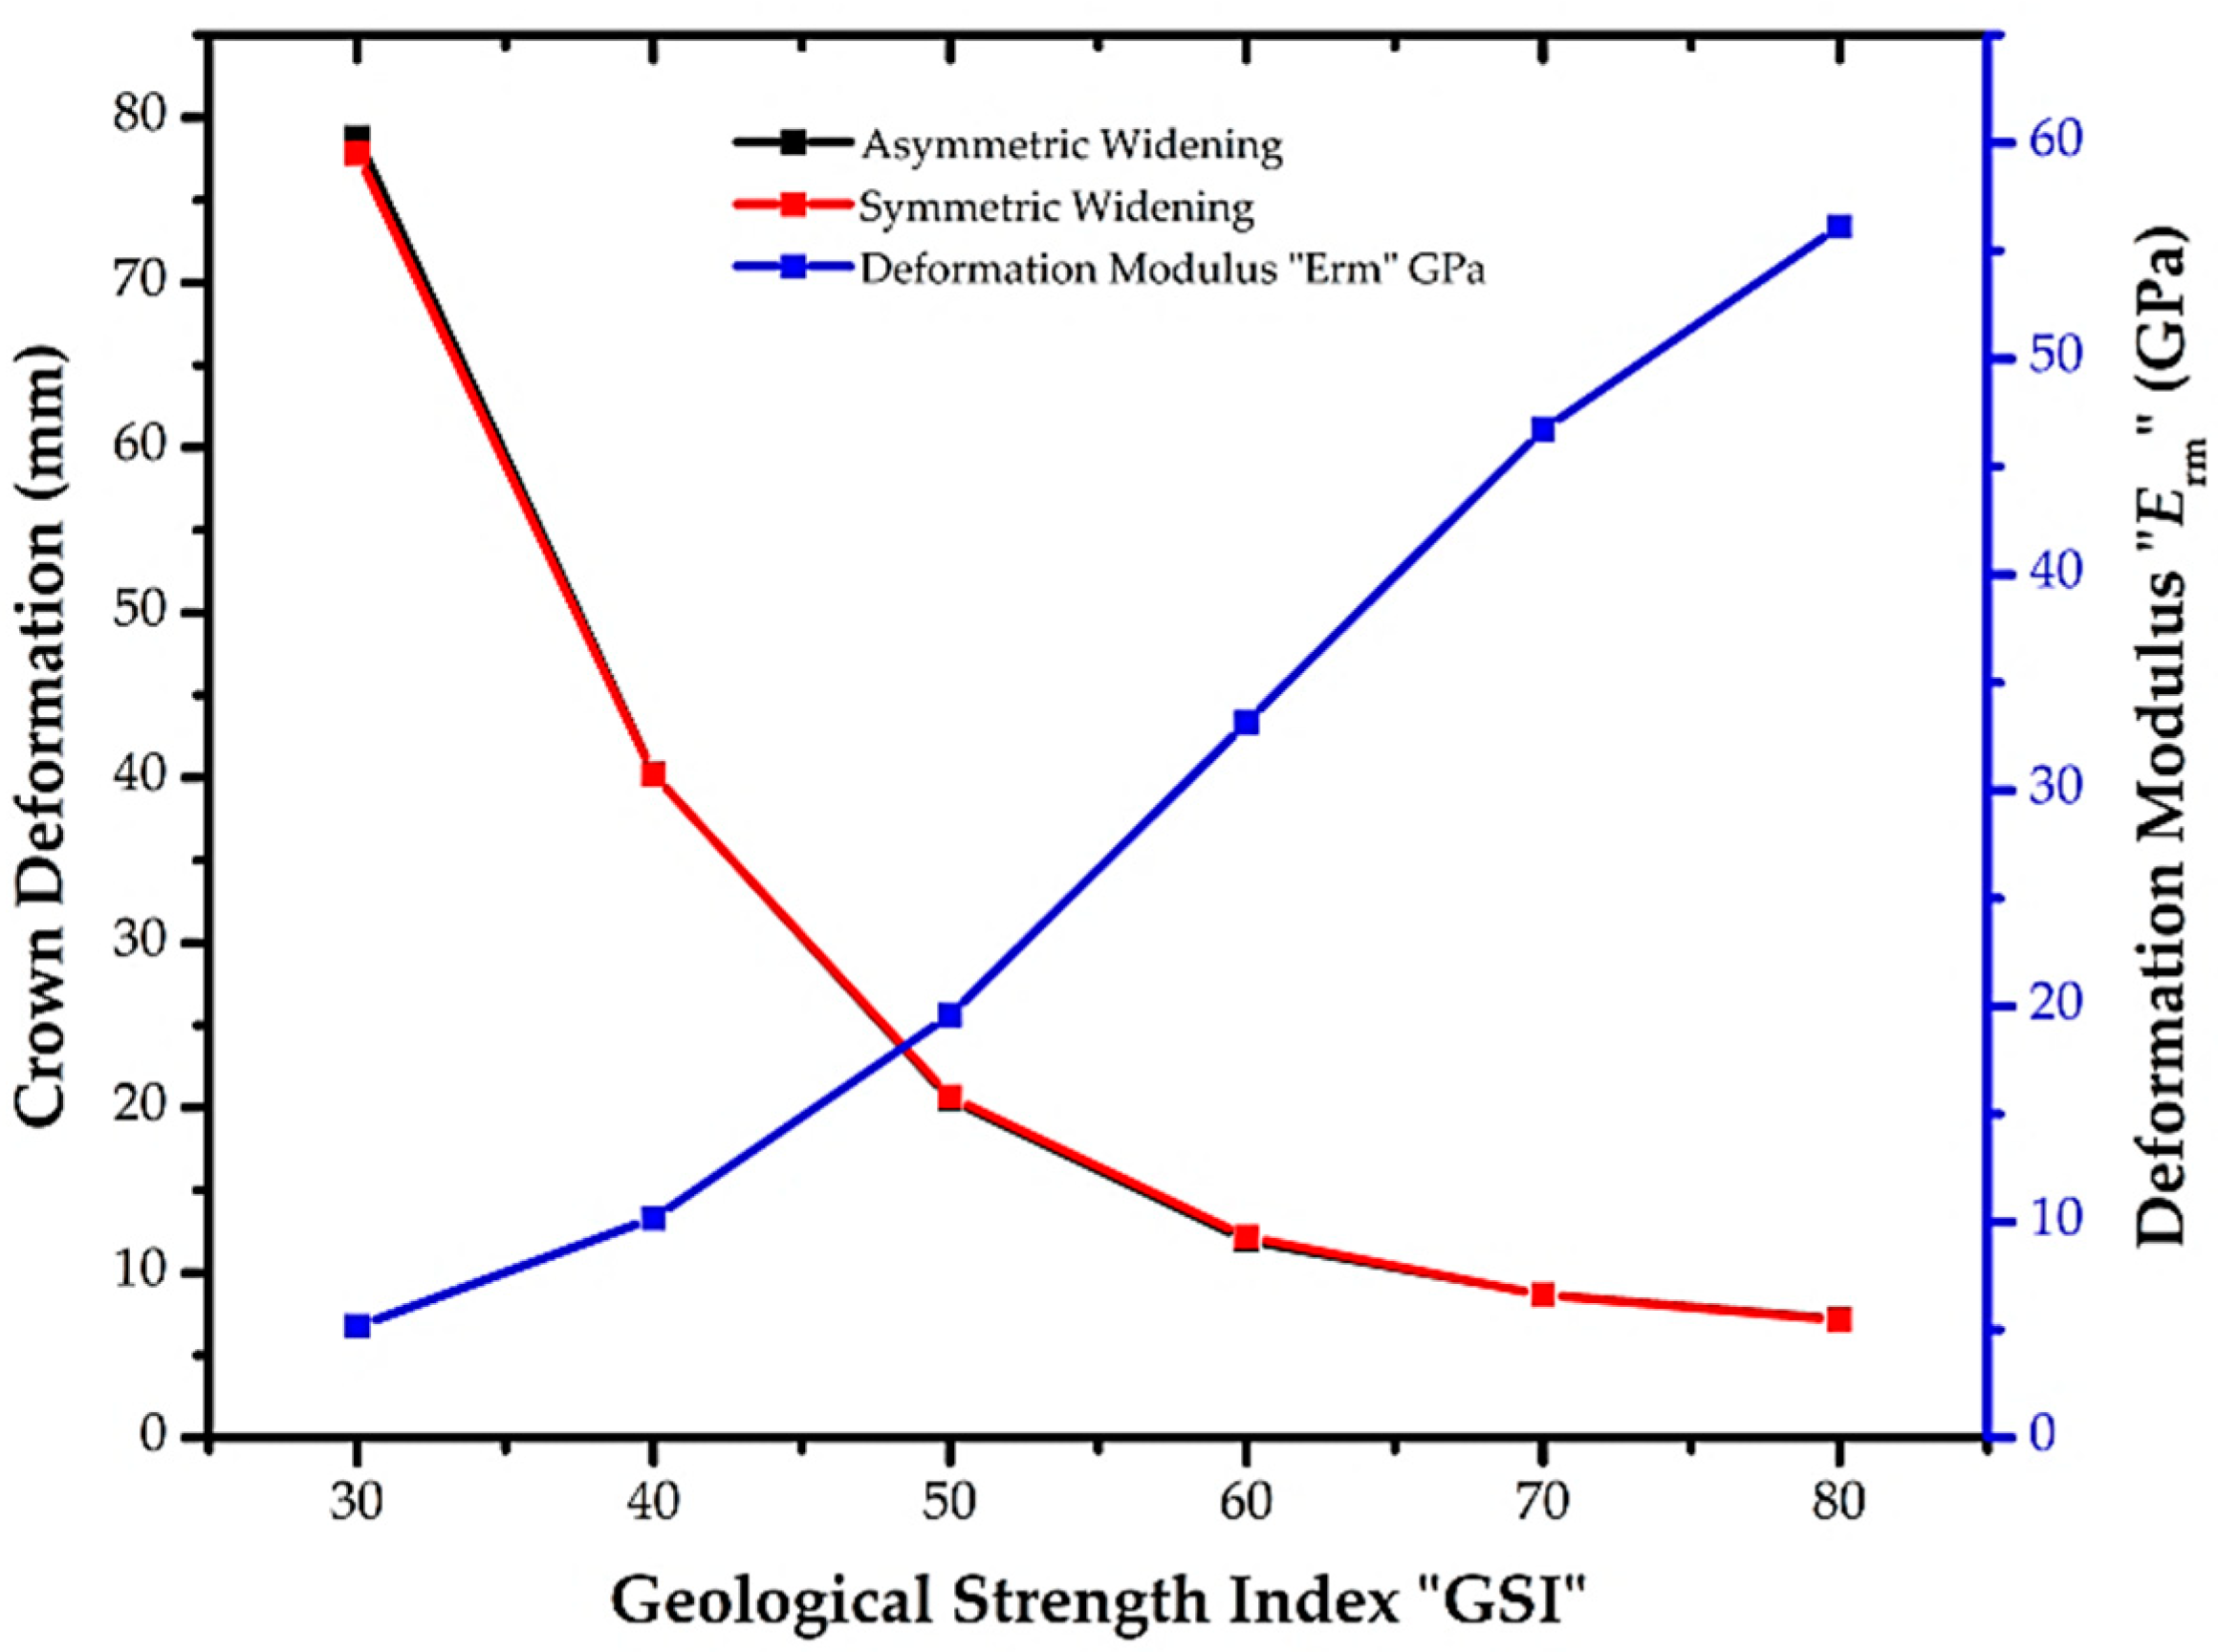
4.3.5. Effect of the Geological Strength Index (GSI) on Rock Mass Behavior

The Hoek–Brown criterion [38] was used for this study. This includes the GSI as one of the main parameters, and the value was picked from the chart defined by Hoek et al. [37]. The value of GSI was taken as 60 for the main study. The value of the parameter was varied to determine the effect of rock mass behavior and effect of the difference of the two modes of excavation—asymmetric and symmetric widening of the tunnel. For this purpose, the GSI of different ranges was considered for the study between very poor to excellent rock conditions by varying the value of the GSI between 30 and 80 for the horseshoe tunnel while keeping the other parameters the same. As the tunnel was excavated with controlled blasting of excellent quality, the value of the Disturbance Factor (D) was taken as D = 0. The correlation between GSI and tunnel crown deformation is shown in Figure 20. This plot shows the effect of GSI on the Deformation Modulus “Erm” deduced from the equation proposed by Hoek and Diederichs [32]. The plot shows that for the considered set of values used for the estimation of Erm, for GSI values between 50 and 70, Erm is approximately directly proportional to the GSI. Furthermore, with D = 0, the plot also shows a resemblance to the plot of the simplified Hoek and Diederichs equation (as mentioned at Equation (4)) for Chinese and Taiwanese data, which is based on the sigmoid function [32]. The linear regression analysis between GSI and crown deformation is shown separately for asymmetric and symmetrical tunnel widening in Figure 21, which provides the two separate equations for both the cases.
The geological strength index (GSI) has an inverse relation with tunnel deformation. However, the difference in tunnel crown deformation is approximately similar, which is also confirmed from the linear regression analysis that depicts approximately the same slope.

5. Conclusions

This study analyzed rock mass behavior using different tunnel shapes for asymmetric and symmetric widening under different support conditions using an advanced numerical technique. The following conclusions are drawn from this study:
  • During symmetrical widening, tunnels with a round shape, like horseshoe and semicircular with flatbed, have accumulated stress and deformations at the invert, whereas such deformations can be controlled through asymmetric widening of the tunnel.
  • By introducing the round invert to round shape tunnels, the deformations at invert can be minimized. Moreover, in contrast to the flatbed case, symmetric widening can provide more controlled tunnel deformations than asymmetric widening.
  • Symmetric widening is recommended for circular tunnels under unsupported conditions; however, there is the same behavior for both types of widening in the case of tunnel support.
  • There is an insignificant effect of the difference between asymmetric and symmetric widening in regular shaped tunnels, i.e., box, rectangular, and semi-elliptical shapes.
  • In the asymmetric condition, the tunnel’s left side wall remains unaltered during tunnel widening, which provides support to the open cavity around the excavation periphery.
  • In the statistical analysis, it was found that the tunnel support system in different tunnel shapes decreases tunnel deformation by an average of 13.33% in asymmetric tunnel widening and around 8.82% in symmetric tunnel widening.
  • The shotcrete provides more stability in the widening process, especially in asymmetric widening. However, the rock bolts reduce the deformation but impart less effect on the difference in deformation between the two widening modes.
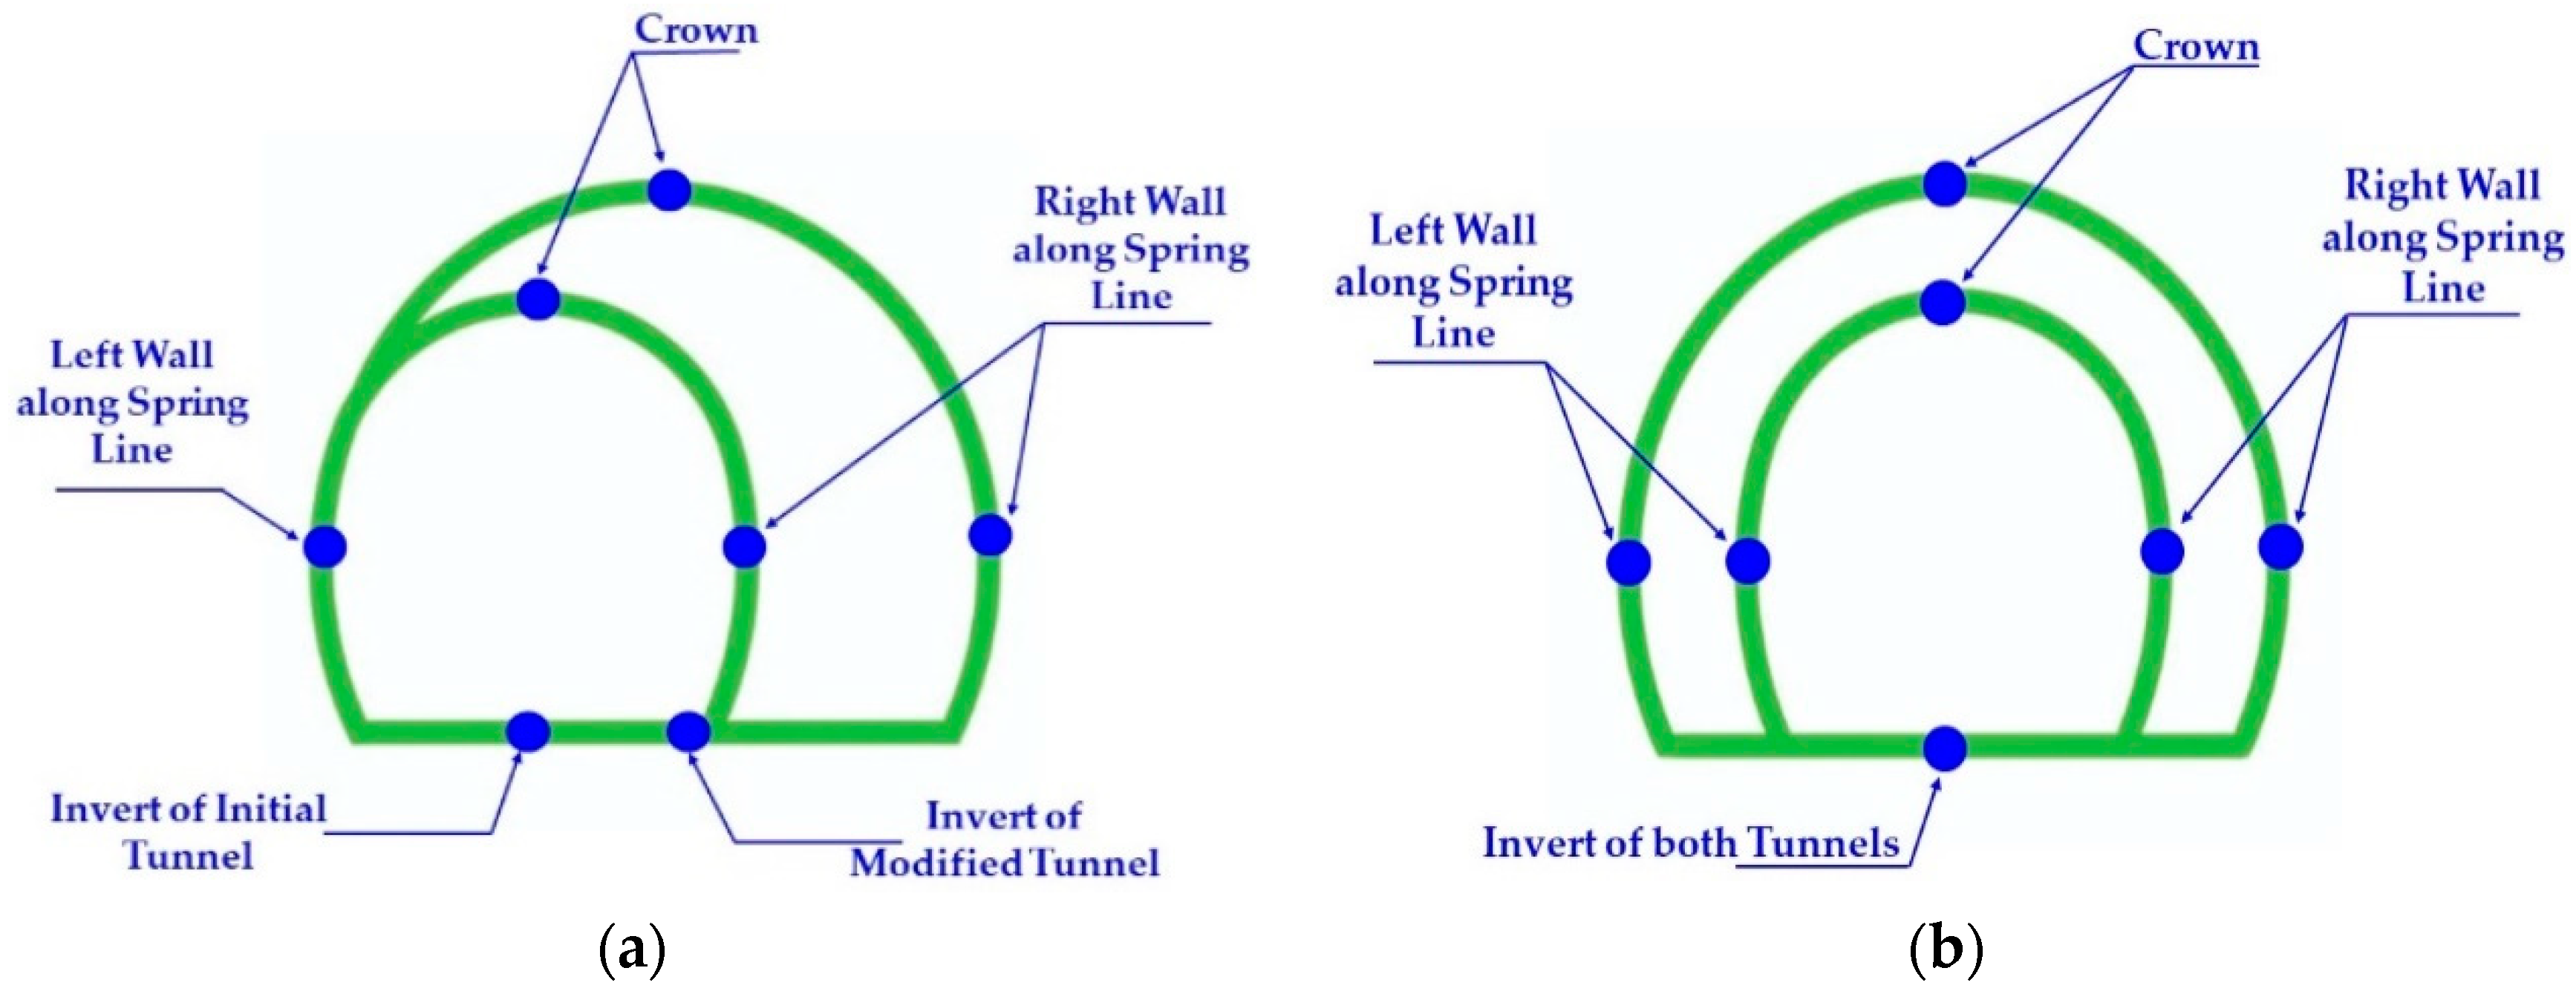
  • The differences in tunnel monitoring locations, i.e., crown, right wall, left wall, and invert have significant relationships with each other and with the interaction of different tunnel support modes.
  • The tunnel deformation is inversely proportional to the rock strength, wherein the ratio of the difference in deformation at the crown of the horseshoe tunnel between asymmetric and symmetric widening is the same from high to low strength rock.
  • In a parametric study, the results revealed that the lower elastic modulus value, higher horizontal to vertical stress ratio, and higher overburden height values have a greater difference in deformation for both widening options.
  • Geological Strength Index variation is inversely proportional to tunnel deformation, whereas it imparts an insignificant deformation difference between asymmetric and symmetric widening.
  • The study provides a better understanding and guidelines for the planning stage of tunnel and cavern widening scenarios for different shapes under different in situ stress conditions and with different underground support conditions under a variety of parametric conditions, which ultimately increases the tunnel and cavern stability as well as the safety and provides a viable economical solution.
  • For future research, it is advisable to work out the rock mass behavior with different widths and the size of asymmetric and symmetric widening of different shapes of the tunnel. Furthermore, the effect of asymmetric widening tunnel on the Longitudinal Displacement Profile (LDP) should also be studied.

Author Contributions

The main idea was conceptualized by B.K., S.M.J., and J.J.K., whereas the methodology was defined by B.K., T.H.J., and J.K. The software simulation was conducted by B.K. and T.H.J. The original draft was prepared by B.K. and reviewed and edited by T.H.J. and J.K. The overall work was carried out under supervision of S.M.J. and J.J.K.

Funding

This research received no external funding.

Acknowledgments

This research was supported by National Highway Authority (NHA) Pakistan by providing the rock mass deformation data of the Lowari tunnel project. The contribution by the author Jonguk Kim was supported by Seoul Institute of Technology (SIT) (19-1-3, A study on the groundwater undrainage method and monitoring of excavation work and underground infrastructure to conserve groundwater).

Conflicts of Interest

The authors declare no conflict of interest.

Nomenclature

σvVertical stress, MPa
σciUniaxial compressive strength, MPa
DDisturbance factor
EiElastic modulus, GPa
EhAverage deformation modulus, GPa
MRModulus ratio
ZVertical height of rock over the tunnel, m

References

  1. Simon, J.L. The Economics of Population Growth; Princeton University Press: Princeton, NJ, USA, 2019; Volume 5403. [Google Scholar]
  2. Broere, W. Urban underground space: Solving the problems of today’s cities. Tunn. Undergr. Space Technol. 2016, 55, 245–248. [Google Scholar] [CrossRef] [Green Version]
  3. Babar Khan, T.H.J.; Jamil, S.M. Effect of Symmetric and Asymmetric Widening of Tunnel on Rock Mass Behaviour in Various Rock Types and In Situ Stress State. In 7th Annual International Conference on Architecture and Civil Engineering—ACE-2019; GSTF, Ed.; GSTF: Singapore, 2019; p. 10. [Google Scholar]
  4. Li, C.C. Principles of rockbolting design. J. Rock Mech. Geotech. Eng. 2017, 9, 396–414. [Google Scholar] [CrossRef]
  5. Shang, J.; Yokota, Y.; Zhao, Z.; Dang, W. DEM simulation of mortar-bolt interface behaviour subjected to shearing. Constr. Build. Mater. 2018, 185, 120–137. [Google Scholar] [CrossRef]
  6. Bertuzzi, R. Back-analysing rock mass modulus from monitoring data of two tunnels in Sydney, Australia. J. Rock Mech. Geotech. Eng. 2017, 9, 877–891. [Google Scholar] [CrossRef]
  7. Choi, H.-J.; Kim, D.-K. A study on the enlargement of 2-Lane road tunnel under construction. J. Korean Tunn. Undergr. Space Assoc. 2011, 13, 33–50. [Google Scholar]
  8. Andrea, O. Design and excavation for the widening of a railway tunnel: The case of the Castellano tunnel in Italy. In Proceedings of the SEE Tunnel: Promoting Tunneling in SEE Region“ITA WTC 2015 Congress and 41st General Assembly, Dubrovnik, Croatia, 22–28 May 2015. [Google Scholar]
  9. Lunardi, P. Method for Widening Road, Superhighway or Railway Tunnels, Without Interrupting the Traffic. U.S. Patent 6,375,390, 23 April 2002. [Google Scholar]
  10. Lunardi, P.; Calcerano, G. A new construction method for widening highway and railway tunnels. In Atti del Congresso Internazionale su Progress in Tunnelling After; Pàtron Editore: Bologna, Italy, 2000. [Google Scholar]
  11. Lee, M.-H.; Koh, S.-Y.; Kim, B.-J.; Jang, Y.-S.; Yun, J.-N. Stability evaluation on widening of parallel tunnels. In Geotechnical Aspects of Underground Construction in Soft Ground; CRC Press: Boca Raton, FL, USA, 2014; p. 269. [Google Scholar]
  12. Hu, J.; Huang, L. Research on Wallrock Deformation and Mechanical Properties of In-Situ Expansion Tunnel. Technol. Highw. Transp. 2011, 6, 21. [Google Scholar]
  13. Hu, J.; Chen, L.; Huang, L. Research on Expansion Modes of Two-lane to Four-lane Tunnels. Technol. Highw. Transp. 2010, 5, 93–97. [Google Scholar]
  14. Jafri, T.; Yoo, H. REV Application in DEM Analysis of Non-Vibrational Rock Splitting Method to Propose Feasible Borehole Spacing. Appl. Sci. 2018, 8, 335. [Google Scholar] [CrossRef] [Green Version]
  15. Jing, L.; Hudson, J. Numerical methods in rock mechanics. Int. J. Rock Mech. Min. Sci. 2002, 39, 409–427. [Google Scholar] [CrossRef]
  16. Jing, L. A review of techniques, advances and outstanding issues in numerical modelling for rock mechanics and rock engineering. Int. J. Rock Mech. Min. Sci. 2003, 40, 283–353. [Google Scholar] [CrossRef]
  17. Debecker, B. Influence of Planar Heterogeneities on the Fracture Behaviour of Rock. Ph.D. Thesis, Katholieke Universiteit Leuven, Leuven, Belgium, 2009. [Google Scholar]
  18. Cai, M.; Horii, H. A constitutive model and FEM analysis of jointed rock masses. Int. J. Rock Mech. Min. Sci. Geomech. Abstr. 1993, 30, 351–359. [Google Scholar] [CrossRef]
  19. Potyondy, D.O.; Cundall, P. A bonded-particle model for rock. Int. J. Rock Mech. Min. Sci. 2004, 41, 1329–1364. [Google Scholar] [CrossRef]
  20. Shang, J.; Zhao, Z.; Ma, S. On the shear failure of incipient rock discontinuities under CNL and CNS boundary conditions: Insights from DEM modelling. Eng. Geol. 2018, 234, 153–166. [Google Scholar] [CrossRef]
  21. Prazeres, P.G.; Thoeni, K.; Beer, G. Nonlinear analysis of NATM tunnel construction with the boundary element method. Comput. Geotech. 2012, 40, 160–173. [Google Scholar] [CrossRef]
  22. FLAC 3D: Fast Lagrangian Analysis of Continua in 3 Dimensions; Itasca Consulting Group Inc.: Minneapolis, MN, USA, 2015.
  23. Chakeri, H.; Unver, B.; Ozcelik, Y. A novel relationship for predicting the point of inflexion value in the surface settlement curve. Tunn. Undergr. Space Technol. 2014, 43, 266–275. [Google Scholar] [CrossRef]
  24. Petterson, M.G. The Structure, Petrology and Geochemistry of the Kohistan Batholith, Gilgit, Kashmir, N. Pakistan. Ph.D. Thesis, University of Leicester, Leicester, UK, 1984. [Google Scholar]
  25. Petterson, M. The plutonic crust of Kohistan and volcanic crust of Kohistan-Ladakh, north Pakistan/India: Lessons learned for deep and shallow arc processes. Geol. Soc. Lond. Spec. Publ. 2018, 483, 123–164. [Google Scholar] [CrossRef]
  26. Geoconsult, M.S. Geotechnical Interpretative Report; Wiley: Salzburg, Austria, 2004. [Google Scholar]
  27. Kirsch, C. Die theorie der elastizitat und die bedurfnisse der festigkeitslehre. Z. Des Ver. Dtsch. Ing. 1898, 42, 797–807. [Google Scholar]
  28. Brown, E.; Hoek, E. Trends in relationships between measured rock in-situ stresses and depth, lnt. J. Rock Mech. Min. Sci. Geomech. Abstr. 1978, 15, 211–215. [Google Scholar] [CrossRef]
  29. Sheorey, P. A theory for in situ stresses in isotropic and transverseley isotropic rock. Int. J. Rock Mech. Min. Sci. Geomech. Abstr. 1994, 31, 23–34. [Google Scholar] [CrossRef]
  30. Hoek, E.; Marinos, P. Tunnelling in overstressed rock. In Proceeding of the EUROCK2009, Dubrovnik, Croatia, 29–31 October 2009. [Google Scholar]
  31. Jaeger, J.C.; Cook, N.G.; Zimmerman, R. Fundamentals of Rock Mechanics; John Wiley & Sons: Hoboken, NJ, USA, 2009. [Google Scholar]
  32. Hoek, E.; Diederichs, M.S. Empirical estimation of rock mass modulus. Int. J. Rock Mech. Min. Sci. 2006, 43, 203–215. [Google Scholar] [CrossRef]
  33. Hoek, E.; Brown, E.T. Practical estimates of rock mass strength. Int. J. Rock Mech. Min. Sci. 1997, 34, 1165–1186. [Google Scholar] [CrossRef]
  34. Deere, D.U. Geological Considerations, Rock Mechanics in Engineering Practice, Stagg and Zienkiewicz; John Wiley: New York, NY, USA, 1968. [Google Scholar]
  35. Goodman, R.E. Introduction to Rock Mechanics; Wiley: New York, NY, USA, 1989; Volume 8. [Google Scholar]
  36. Inc., I. C. G. FLAC 3D User’s Guide; Itasca Consulting Group Inc.: Minneapolis, MN, USA, 2013. [Google Scholar]
  37. Hoek, E.; Marinos, P. Predicting tunnel squeezing problems in weak heterogeneous rock masses. Tunn. Tunn. Int. 2000, 32, 45–51. [Google Scholar]
  38. Hoek, E.; Carranza-Torres, C.; Corkum, B. Hoek-Brown failure criterion-2002 edition. Proc. NARMS-Tac 2002, 1, 267–273. [Google Scholar]
  39. SWECO. Final Feasibility Study and Design Review; SWECO: Islamabad, Pakistan, 1995. [Google Scholar]
  40. Goodman, R. Effect of Joints on the Strength of Tunnels. In Clearinghouse Fed Sci & Tech Info; National Association of Housing & Redeve: Washington, DC, USA, 1968. [Google Scholar]
  41. Marinos, P.; Marinos, V.; Hoek, E. Geological Strength Index (GSI). A characterization tool for assessing engineering properties for rock masses. In Underground Works under Special Conditions; Taylor and Francis: Lisbon, Portugal, 2007; pp. 13–21. [Google Scholar]
  42. Ali, Y.; Irfan, M.; Ahmed, S.; Khanzada, S.; Mahmood, T. Investigation of factors affecting dynamic modulus and phase angle of various asphalt concrete mixtures. Mater. Struct. 2016, 49, 857–868. [Google Scholar] [CrossRef]
Figure 1. Layout plan of the Lowari tunnel project comprising two tunnels of 8.5 and 1.9 km with access roads and bridges. The maximum overburden at the main tunnel was recorded as 1250 m.
Geosciences 09 00518 g001
Figure 2. Conceptual illustration of tunnel profiling. The original tunnel concept with a piggy-back rail tunnel with a cross-sectional area of 45 m2 is shown in green, whereas the widening tunnel cross-sectional area of 85 m2 is shown in red.
Geosciences 09 00518 g002
Figure 3. Initial tunnel modelling: (a) the initial horseshoe tunnel profile is presented in green and the widened profile is presented in red; (b) displacement at the crown of the initial tunnel.
Geosciences 09 00518 g003aGeosciences 09 00518 g003b
Figure 4. Actual monitoring of the tunnel at chainage 5 + 322. The deformations at crown are shown with red circular dots. The end deformation of 8.25 mm was recorded at the project site.
Geosciences 09 00518 g004
Figure 5. Tunnel widening models: (a) model of asymmetric widening of the tunnel; (b) model of symmetric widening of the tunnel.
Geosciences 09 00518 g005
Figure 6. Monitoring points at the tunnel periphery for (a) the asymmetric widened tunnel; (b) the symmetric widened tunnel.
Geosciences 09 00518 g006
Figure 7. Three-dimensional view of the tunnel support system for (a) the asymmetric widened tunnel, (b) the symmetric widened tunnel.
Geosciences 09 00518 g007aGeosciences 09 00518 g007b
Figure 8. The simulated deformation at the crown, invert, left wall, and right wall in three different modes: (1) tunnel without support, (2) tunnel with shotcrete only, and (3) tunnel with shotcrete and rock bolts, in different tunnel shapes: (a) horseshoe shape; (b) horseshoe shape with invert; (c) circular shape; (d) semicircular shape; (e) semicircular shape with invert; (f) box shape; (g) rectangular shape; (h) semi-elliptical shape.
Geosciences 09 00518 g008aGeosciences 09 00518 g008b
Figure 9. Main effect plot for tunnel deformation: (a) asymmetric widening of the tunnel; (b) symmetric widening of the tunnel.
Geosciences 09 00518 g009
Figure 10. Interaction plot for tunnel deformation: (a) asymmetric widening of the tunnel; (b) symmetric widening of the tunnel.
Geosciences 09 00518 g010
Figure 11. Pareto chart of the standardized effect: (a) asymmetric widening of the tunnel; (b) symmetric widening of the tunnel.
Geosciences 09 00518 g011
Figure 12. Crown deformation of the horseshoe shape tunnel with different rock types in asymmetric and symmetric tunnel widening modes.
Geosciences 09 00518 g012
Figure 13. Crown deformation with different values of the elastic modulus “E”.
Geosciences 09 00518 g013
Figure 14. Elastic modulus trend with tunnel crown deformation for (a) asymmetric widened tunnel, (b) symmetric widened tunnel.
Geosciences 09 00518 g014aGeosciences 09 00518 g014b
Figure 15. Crown deformation with different K-values.
Geosciences 09 00518 g015
Figure 16. Deformation trend for tunnel widening with respect to a different range of K-values for (a) the asymmetric widened tunnel, (b) the symmetric widened tunnel.
Geosciences 09 00518 g016aGeosciences 09 00518 g016b
Figure 17. Deformation with variation in the overburden height.
Geosciences 09 00518 g017
Figure 18. Deformation trend for tunnel widening with respect to a different range of overburden heights for (a) the asymmetric widened tunnel, (b) the symmetric widened tunnel.
Geosciences 09 00518 g018
Figure 19. Horizontal stress trend: (a) stresses at 50 m depth, (b) stresses at 2000 m depth.
Geosciences 09 00518 g019aGeosciences 09 00518 g019b
Figure 20. Crown deformation at the tunnel with variation in the geological strength index (GSI).
Geosciences 09 00518 g020
Figure 21. Deformation trend for tunnel widening with respect to different ranges of GSI for (a) the asymmetric widened tunnel, (b) the symmetric widened tunnel.
Geosciences 09 00518 g021
Table 1. Rock mass parameters for the adaptive model of the Lowari tunnel [26,39].
DescriptionDetail
Rock TypeGranite Gniess with intercalation of Amphibolite
Uniaxial Compressive Strength (σci)150 MPa
Geological Strength Index (GSI)60
Poisson’s Ratio (ʋ)0.25
Modulus Ratio (MR)425
Elastic Modulus of Intact Rock (Ei)63.75 GPa
Deformation Modulus (Erm)33.15 GPa
Bulk Modulus (K)22.10 GPa
Shear Modulus (G)13.26 GPa
Disturbance Factor (D)0
Hoek–Brown parameter (mi)30
Hoek–Brown parameter (mb)7.19
Hoek–Brown parameter (s)0.01174
Hoek–Brown parameter (a)0.5028
Table 2. In situ stress conditions chosen for the analysis and deformation (z-axis) at the tunnel crown.
Tunnel Radius
(m)
Horizontal to Vertical Stress Ratio
(K)
Vertical Stress
σz
(MPa)
Horizontal Stress
σx
(MPa)
Longitudinal Stress
σy
(MPa)
Displacement at Crown of Small Tunnel (mm)
Field Monitored ValueNumerical Calculated Value
2.523468348.258.10
Table 3. Different support modes of tunnel excavation.
Widening PatternMode-A
(Tunnel without Any Support System)
Mode-B
(Tunnel with 200 mm Thick Shotcrete Only)
Mode-C
(Tunnel with 200 mm Thick Shotcrete + Rock Bolts)
Asymmetric Widening Geosciences 09 00518 i001 Geosciences 09 00518 i002 Geosciences 09 00518 i003
Symmetric Widening Geosciences 09 00518 i004 Geosciences 09 00518 i005 Geosciences 09 00518 i006
Table 4. Different tunnel shapes used for the evaluation of tunnel deformation under asymmetric and symmetric widening conditions (green indicates the initial/original tunnel and red indicates the widening portion of tunnels).
CaseDifferent Types of Tunnel ShapesAsymmetric WideningSymmetric Widening
a.Horseshoe Shape without Invert Geosciences 09 00518 i007 Geosciences 09 00518 i008
b.Horseshoe Shape with Invert Geosciences 09 00518 i009 Geosciences 09 00518 i010
c.Circular Shape Geosciences 09 00518 i011 Geosciences 09 00518 i012
d.Semicircular Shape without Invert Geosciences 09 00518 i013 Geosciences 09 00518 i014
e.Semicircular Shape with Invert Geosciences 09 00518 i015 Geosciences 09 00518 i016
f.Box/Square Shape Geosciences 09 00518 i017 Geosciences 09 00518 i018
g.Rectangular Shape Geosciences 09 00518 i019 Geosciences 09 00518 i020
h.Semi-Elliptical Shape Geosciences 09 00518 i021 Geosciences 09 00518 i022
Table 5. Rock bolts and shotcrete parameters.
Rock Bolts Parameters
Rock Bolt SN Type Rock Bolt
Bolt Length 4 m
Elastic Modulus45,000 MPa
Cross-Sectional Area1.57 × 10−3 m2
Bolt Ultimate Tensile Capacity 250 KN
Grout Bond Stiffness1.75 × 107 N/m/m
Grout Cohesive Strength2.0 × 105 N/m
Shotcrete Parameters
Shotcrete Thickness200 mm
Elastic Modulus (E)10.5 GPa
Poisson’s ratio (v)0.25
Table 6. Pattern used for the statistical analysis of tunnel deformation for different shapes and in different modes.
VariableAbbreviationLevels
Support/ModeSupport-A or Support-S
(where A and S, respectively, indicate asymmetric and symmetric)
1 = Tunnel without Support
2 = Tunnel with 200 mm Shotcrete
3 = Tunnel with 200 mm Shotcrete + Rock Bolts
CaseCase-A or Case-S1 = Horseshoe Shape without Invert
2 = Horseshoe Shape with Invert
3 = Circular Shape
4 = Semicircular Shape without Invert
5 = Semicircular Shape with Invert
6 = Box Shape
7 = Rectangular Shape
8 = Semi-elliptical Shape
LocationLocation-A or Location-S1 = Crown (Z-Axis Displacement)
2 = Right Spring Line (X-Axis Displacement)
3 = Left Spring Line (X-Axis Displacement)
4 = Invert (Z-Axis Displacement)
Table 7. Different rock properties chosen for the study adapted from Goodman [35].
Rock TypeModulus of Elasticity “E
(GPa)
Poisson’s Ratio
v
Bulk Modulus
“K”
(GPa)
Shear Modulus
“G”
(GPa)
Tensile Strength
(MPa)
Friction Angle
(Degrees)
Cohesion
(MPa)
Shale11.10.298.84.3-14.438.4
Sandstone19.30.3826.87.01.1727.827.2
Siltstone26.30.2215.610.8-32.134.7
Limestone28.50.2922.611.11.5842.06.72
Marble55.80.2537.222.3-31.066.2
Granite73.80.2243.930.2-51.055.1

