Article

An Experimental Investigation on the Progressive Failure of Unsaturated Granular Slopes

Department of Engineering, University of Campania “Luigi Vanvitelli”, Via Roma 29, 81031 Aversa, Italy
*
Author to whom correspondence should be addressed.
Geosciences 2019, 9(2), 63; https://doi.org/10.3390/geosciences9020063
Submission received: 29 December 2018 / Revised: 18 January 2019 / Accepted: 24 January 2019 / Published: 29 January 2019
(This article belongs to the Special Issue Mountain Landslides: Monitoring, Modeling, and Mitigation)

Abstract

:
Slope failure is a complex process which depends on several factors concerning nature and properties of soil, slope morphology and structure, past stress history, groundwater regime, boundary conditions, and their changes. As a consequence, the mechanism of slope failure is typically characterized by the development of a highly non-uniform strain field, which does not allow an easy prediction of the failure conditions. Usually, the process which will bring the slope to final collapse starts with local soil failure, which then leads to formation and propagation of a shear zone, and finally to general slope failure. This mechanical process is called progressive failure. However, in spite of the progresses in the knowledge of the slope behavior, a complete framework about the progressive failure is still missing; in particular, information about the response of granular unsaturated sloping soils is very poor. This paper reports the results of a couple of small-scale experiments on slopes reconstituted with unsaturated pyroclastic soils and subjected to continuous rainfall. The use of miniaturized sensors and optical fibers provided useful data to read some aspects of the mechanics of failure.

1. Foreword

Slope failure is often progressive. It may involve any type of soil, depending on the initial and induced stress field. The mechanisms which bring slopes to failure cannot be easily predicted and are generally characterized by a complex and non-uniform strain field, which, first, triggers local soil failure, then leads to formation and propagation of a shear zone, which eventually brings the so-called general slope failure. A significant consequence of the progressive failure in brittle soils is the mobilization of an average shear strength, which may be much lower than the initially available peak value [1]. The first soil rupture may occur everywhere in the slope depending on morphology, initial stress conditions, groundwater regime, and local shear strength. A description of cases of progressive failure commencing at the toe, at the crest, or at any internal zone of the slope is reported by Leroueil et al. [2]. However, well documented data are still quite scarce [3,4,5,6]. Hence, there is an urging need to collect more information, and to check the role that different factors and conditions may play in the process.
In particular, little attention has been paid to the behavior of steep unsaturated coarse-grained deposits, which are usually mobilized by precipitations. In this case, the pre-failure deformation process is associated with a gradual decay of the shear strength due to a process of soil “softening”, induced by water infiltration and suction decrease. A recent paper on the subject has been published by Yerro et al. [7], who describe the development of shear bands in embankments made with sandy soils, as a consequence of the suction decrease induced by continuous rainfall.
In Campania (Southern Italy) sloping air-fall pyroclastic deposits are periodically subjected to rainfall-induced landslides. Such steep unsaturated mantles are stable due to the contribution of matrix suction to shear strength. However, the decrease in suction induced by extreme precipitations can trigger mass movements, which often keep a flow-like style [8,9]. In the simplified assumption of infinite slope having an inclination equal or lower than the friction angle of the soil, Olivares and Damiano [10] have described slope failure as the result of a mechanical chain process characterized by water content increase, mechanical degradation, volumetric collapse, and static liquefaction. However, in slopes characterized by a more complex morphology, landslide can be the result of inhomogeneous strain and stress fields induced by rainwater infiltration, which can lead to progressive failure. Unfortunately, well documented data about such a failure mechanism still lack. To this aim, physical modelling may play a key role, allowing investigation of the slope behavior under controlled conditions by means of a set of sensors which can follow the entire strain and pore pressure evolution.
The paper reports some data which have been obtained by a couple of experiments on small-scale model slopes aimed at favoring the triggering of a progressive failure under the combined influence of buried slope morphology, which is characterized by a local change in the slope angle, inhomogeneous stress field due to a variable water content, and artificial rainfall. The slope monitoring has been performed with the support of both traditional transducers and distributed optical fibers, of which the use for structural and geotechnical monitoring is greatly increasing [11,12,13] and, of which, in perspective, may be used to support traditional early warning systems for landslides [14,15,16].

2. Materials and Methods

2.1. Equipment

Two experiments, namely RP2 and RP3, have been performed by the instrumented flume shown in Figure 1 [17]. The internal dimensions are 1.90 m in length, 0.50 m in width, and 0.50 m in height. The flume could be tilted to any inclination up to 65°. A plastic sheet with glued calcareous grains located at the bottom of the channel has been used to reproduce a frictional impervious interface. The slope toe has been restrained by a rigid pervious wall, which allowed free water drainage; however, the length/depth ratio has been selected high enough to not significantly condition the failure process. Rainfall has been produced by means of a number of spray nozzles located above the lateral sides of the flume, and arranged in such a way as to generate a uniform artificial rainfall over the entire soil model area. A water pressure ranging between 2 and 5 bar has been used to reproduce rainfall intensities between 10 and 80 mm/h. The water particles had a diameter of about 0.1 mm in order to avoid erosion of the ground surface.
The soil has been laid down by the moist-tamping technique by putting in place 1-cm-thick layers, which have been gently tamped while wetted, up to reaching a total thickness of 10 cm. The flume has been then tilted and sensors installed. In the described experiments, the imposed slope angle has been 38°, which corresponds to the effective friction angle of the soil. In order to favor the progressive failure, the 40-cm-long uppermost part of the slope base has been 4° steeper than the remaining part (Figure 1b,c).
Suction has been measured by some mini tensiometers installed at three different sections, at middle depth and at soil bottom. If water ponding formed at the base of the layer, positive pore pressures could be measured by two transducers placed at the base of the layer respectively at the top and at the foot of the slope as shown in Figure 1b,c.
Laser sensors, installed above the ground surface, have allowed for the recording of soil settlements, while two digital photo cameras, which could monitor a 0.5 m × 1.0 m area of the slope surface, have been used to retrieve the displacement and velocity distribution. The images, stored with a 0.1 Hz frequency sampling, have been processed by a commercial code (PivView2C, PIVTEC GmbH) implementing the particle image velocimetry (PIV) technique.
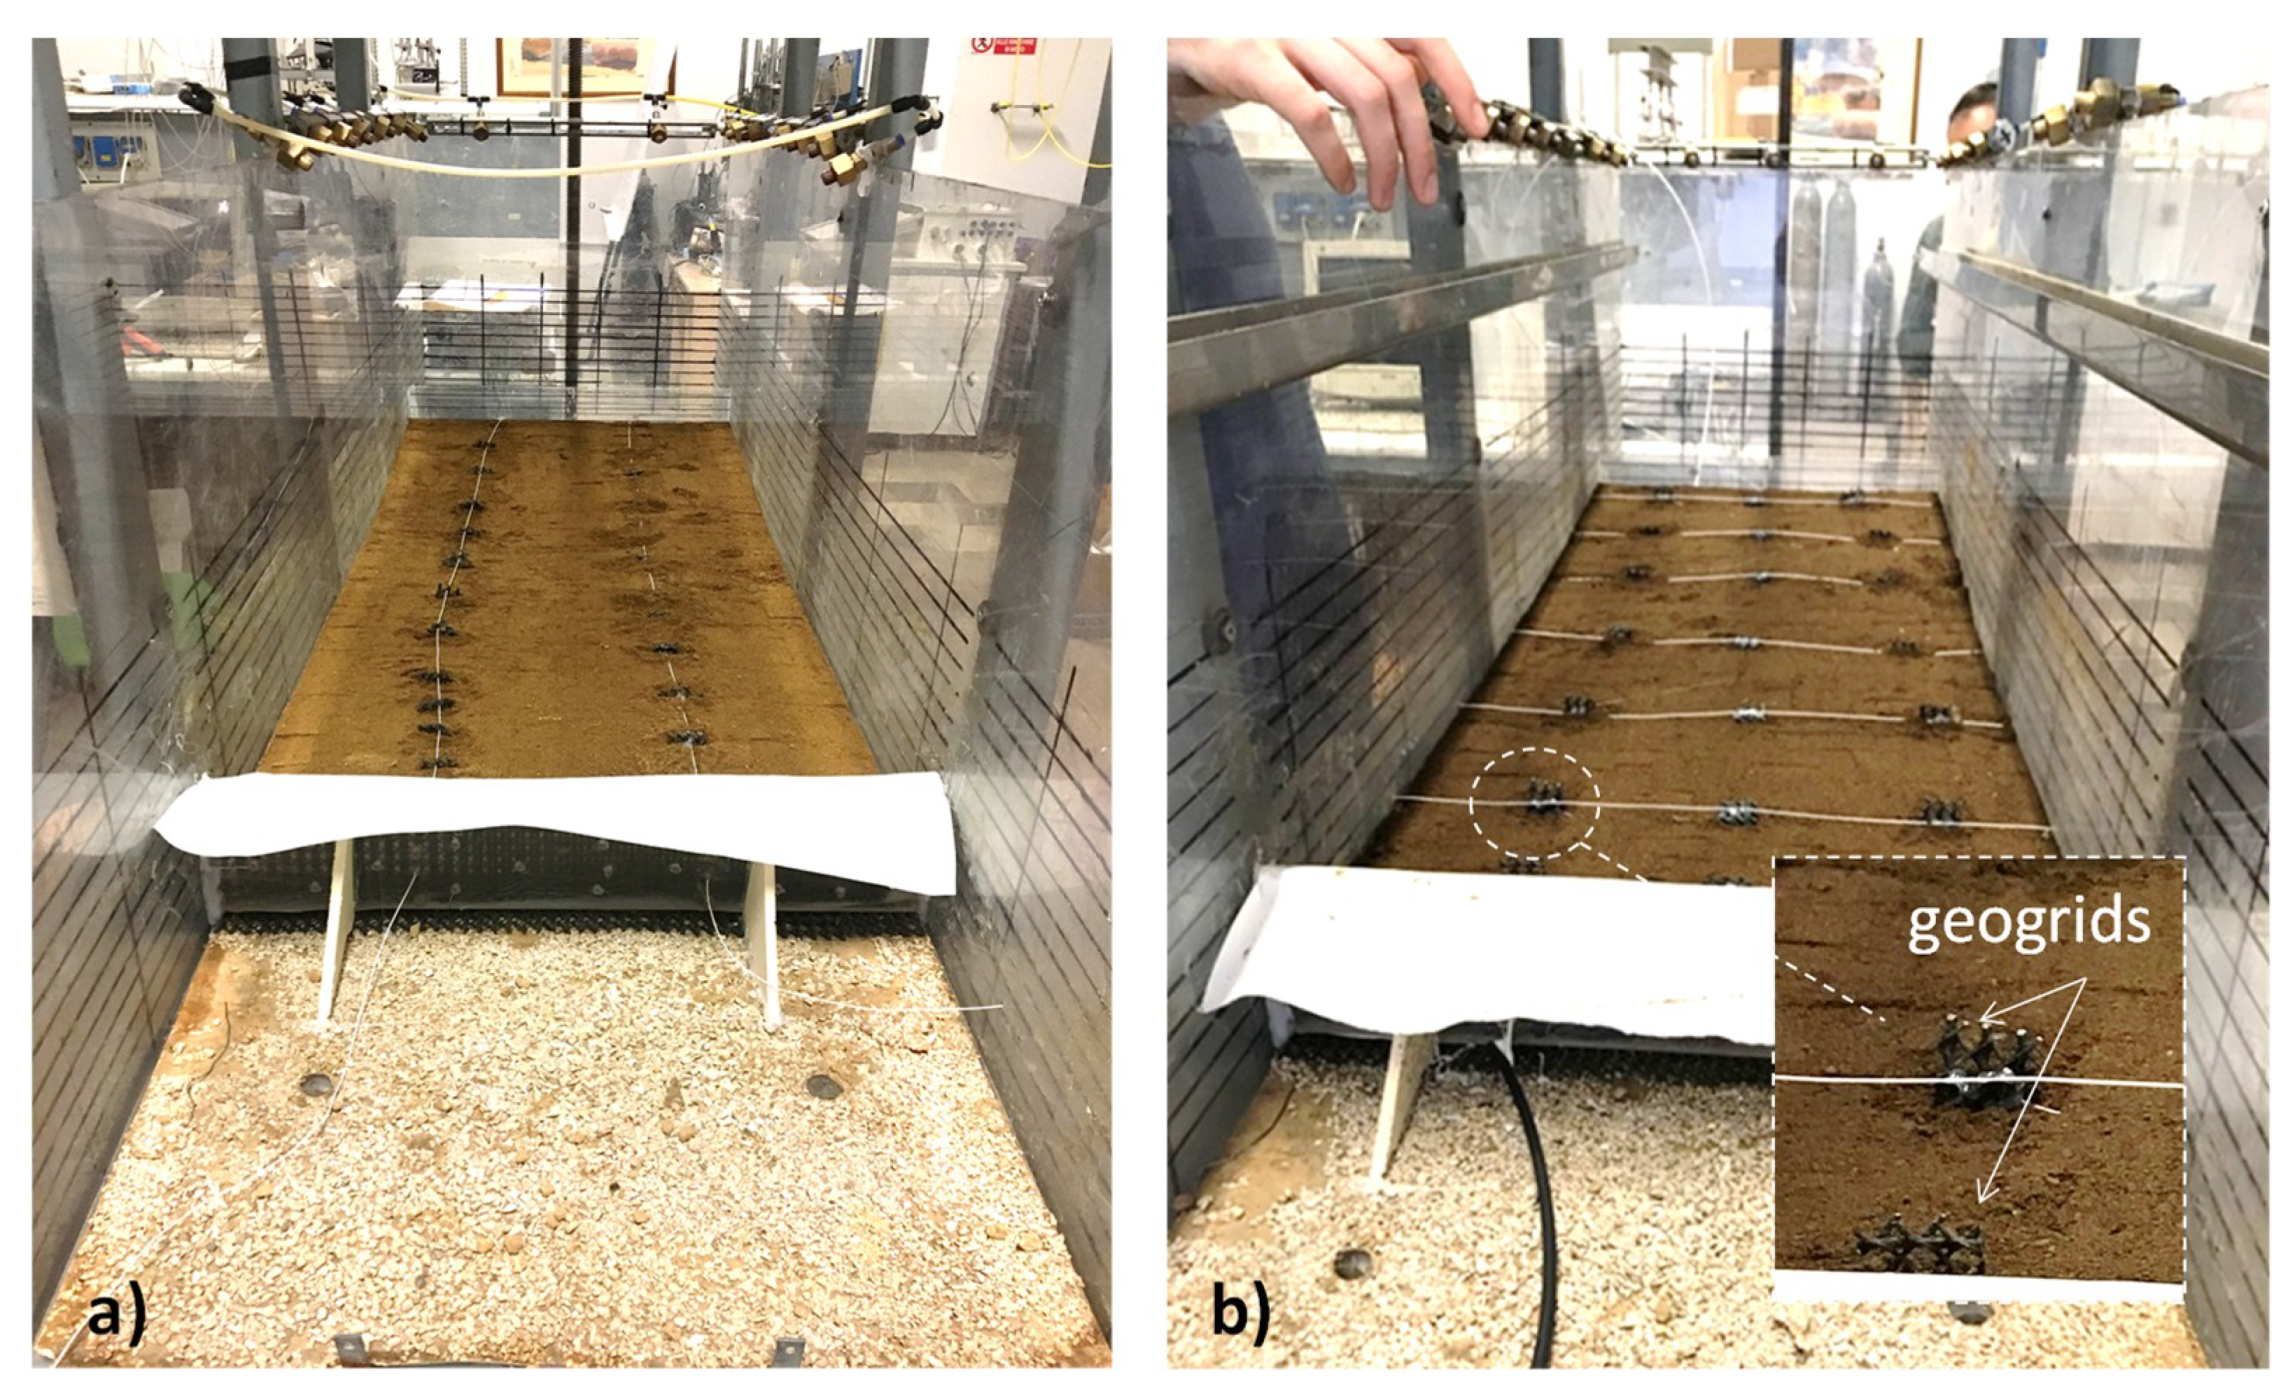
Finally, optical fiber sensors have been adopted to obtain complete information about the strain field. The fibers have been installed during formation of the slope, at a depth of 5 cm (i.e., at mid-depth); their edges have been fixed at the flume walls. Figure 2 shows the fiber position in the two experiments described in this paper: two longitudinal strands have been installed in the first test; seven transversal strands in the second one. The reason for the different settings is discussed in the next section. To improve strain transfer between soil and fiber sensor [18], small pieces of geogrids have been glued to the fiber cable (Figure 2b). The position of all sensors in the two experiments is shown in Figure 1b,c.

2.2. Technical Characteristics of the Fibers

The experiments have been carried out using two different types of distributed sensing techniques: the Brillouin optical time domain analysis (BOTDA) and the Brillouin optical frequency domain analysis (BOFDA). Both techniques rely on the stimulated Brillouin scattering, according to which a pump optical wave and a probe optical wave are injected at the opposite sides of a single-mode optical fiber. The sensing principle is the same and relies on the fact that changes in strain or temperature along the cable result in changes of the Brillouin frequency shift. However, the two techniques differ in the type of modulation impressed on the pump wave: In the BOTDA method, a pulsed pump wave is employed, while BOFDA requires the use of a sinusoidally-modulated pump beam. The different modulation format leads to different characteristics of the two sensing methods: BOFDA systems are advantageous when one wants to detect highly localized strain or temperature changes, as they offer cm-scale or even mm-scale spatial resolution; while BOTDA systems are limited to meter-scale spatial resolution. However, this advantage of BOFDA systems comes with a downside: while in BOTDA measurements the acquisition time is only limited by the round-trip time of light in the sensing fiber, BOFDA measurements rely on time-consuming frequency sweeps performed by a vector network analyzer. In practical terms, while BOTDA measurements are completed in fractions of seconds, the measurement time in BOFDA systems is usually in the minute’s range.
In general, the choice of the method depends on the application requirements: It is clear that a high spatial resolution calls from frequency-domain configurations (BOFDA), while high temporal resolution calls from time-domain configurations (BOTDA). In this paper, both methods have been employed: The RP2 experiment has been carried out using a BOFDA system with 2-cm spatial resolution and an acquisition time of about 1 min. The aim of this experiment was to reveal the exact distribution of the strain along the small-scale slope during the pre-failure stage, when slope movement is still slow and characterized by velocity in the order of 10−2 mm/s. The RP3 experiment has been carried out using a BOTDA system featuring 50-cm spatial resolution and 5 s time resolution. This experiment was aimed at detecting the onset of slope failure at the earliest stage, when the rate of slope movement approaches a value of 0.1 mm/s. As already shown, in this experiment the fiber has been installed along multiple transversal strands, in such a way that the limited spatial resolution of measurements did not affect the capability of the system to detect, eventually, the mechanism of progressive failure.

2.3. Soil Properties

The soil used in the experiments has been taken from the Cervinara site (North-East to Naples), in the area affected by the 1999 debris avalanche [9,19]. Here, less than 2.5 m deep layered air-fall pyroclastic soils mantle the 35–45° limestone slopes which surround the town. The thickest pyroclastic layer consists of loose unsaturated ash; the cover includes pumices and other ashy layers.
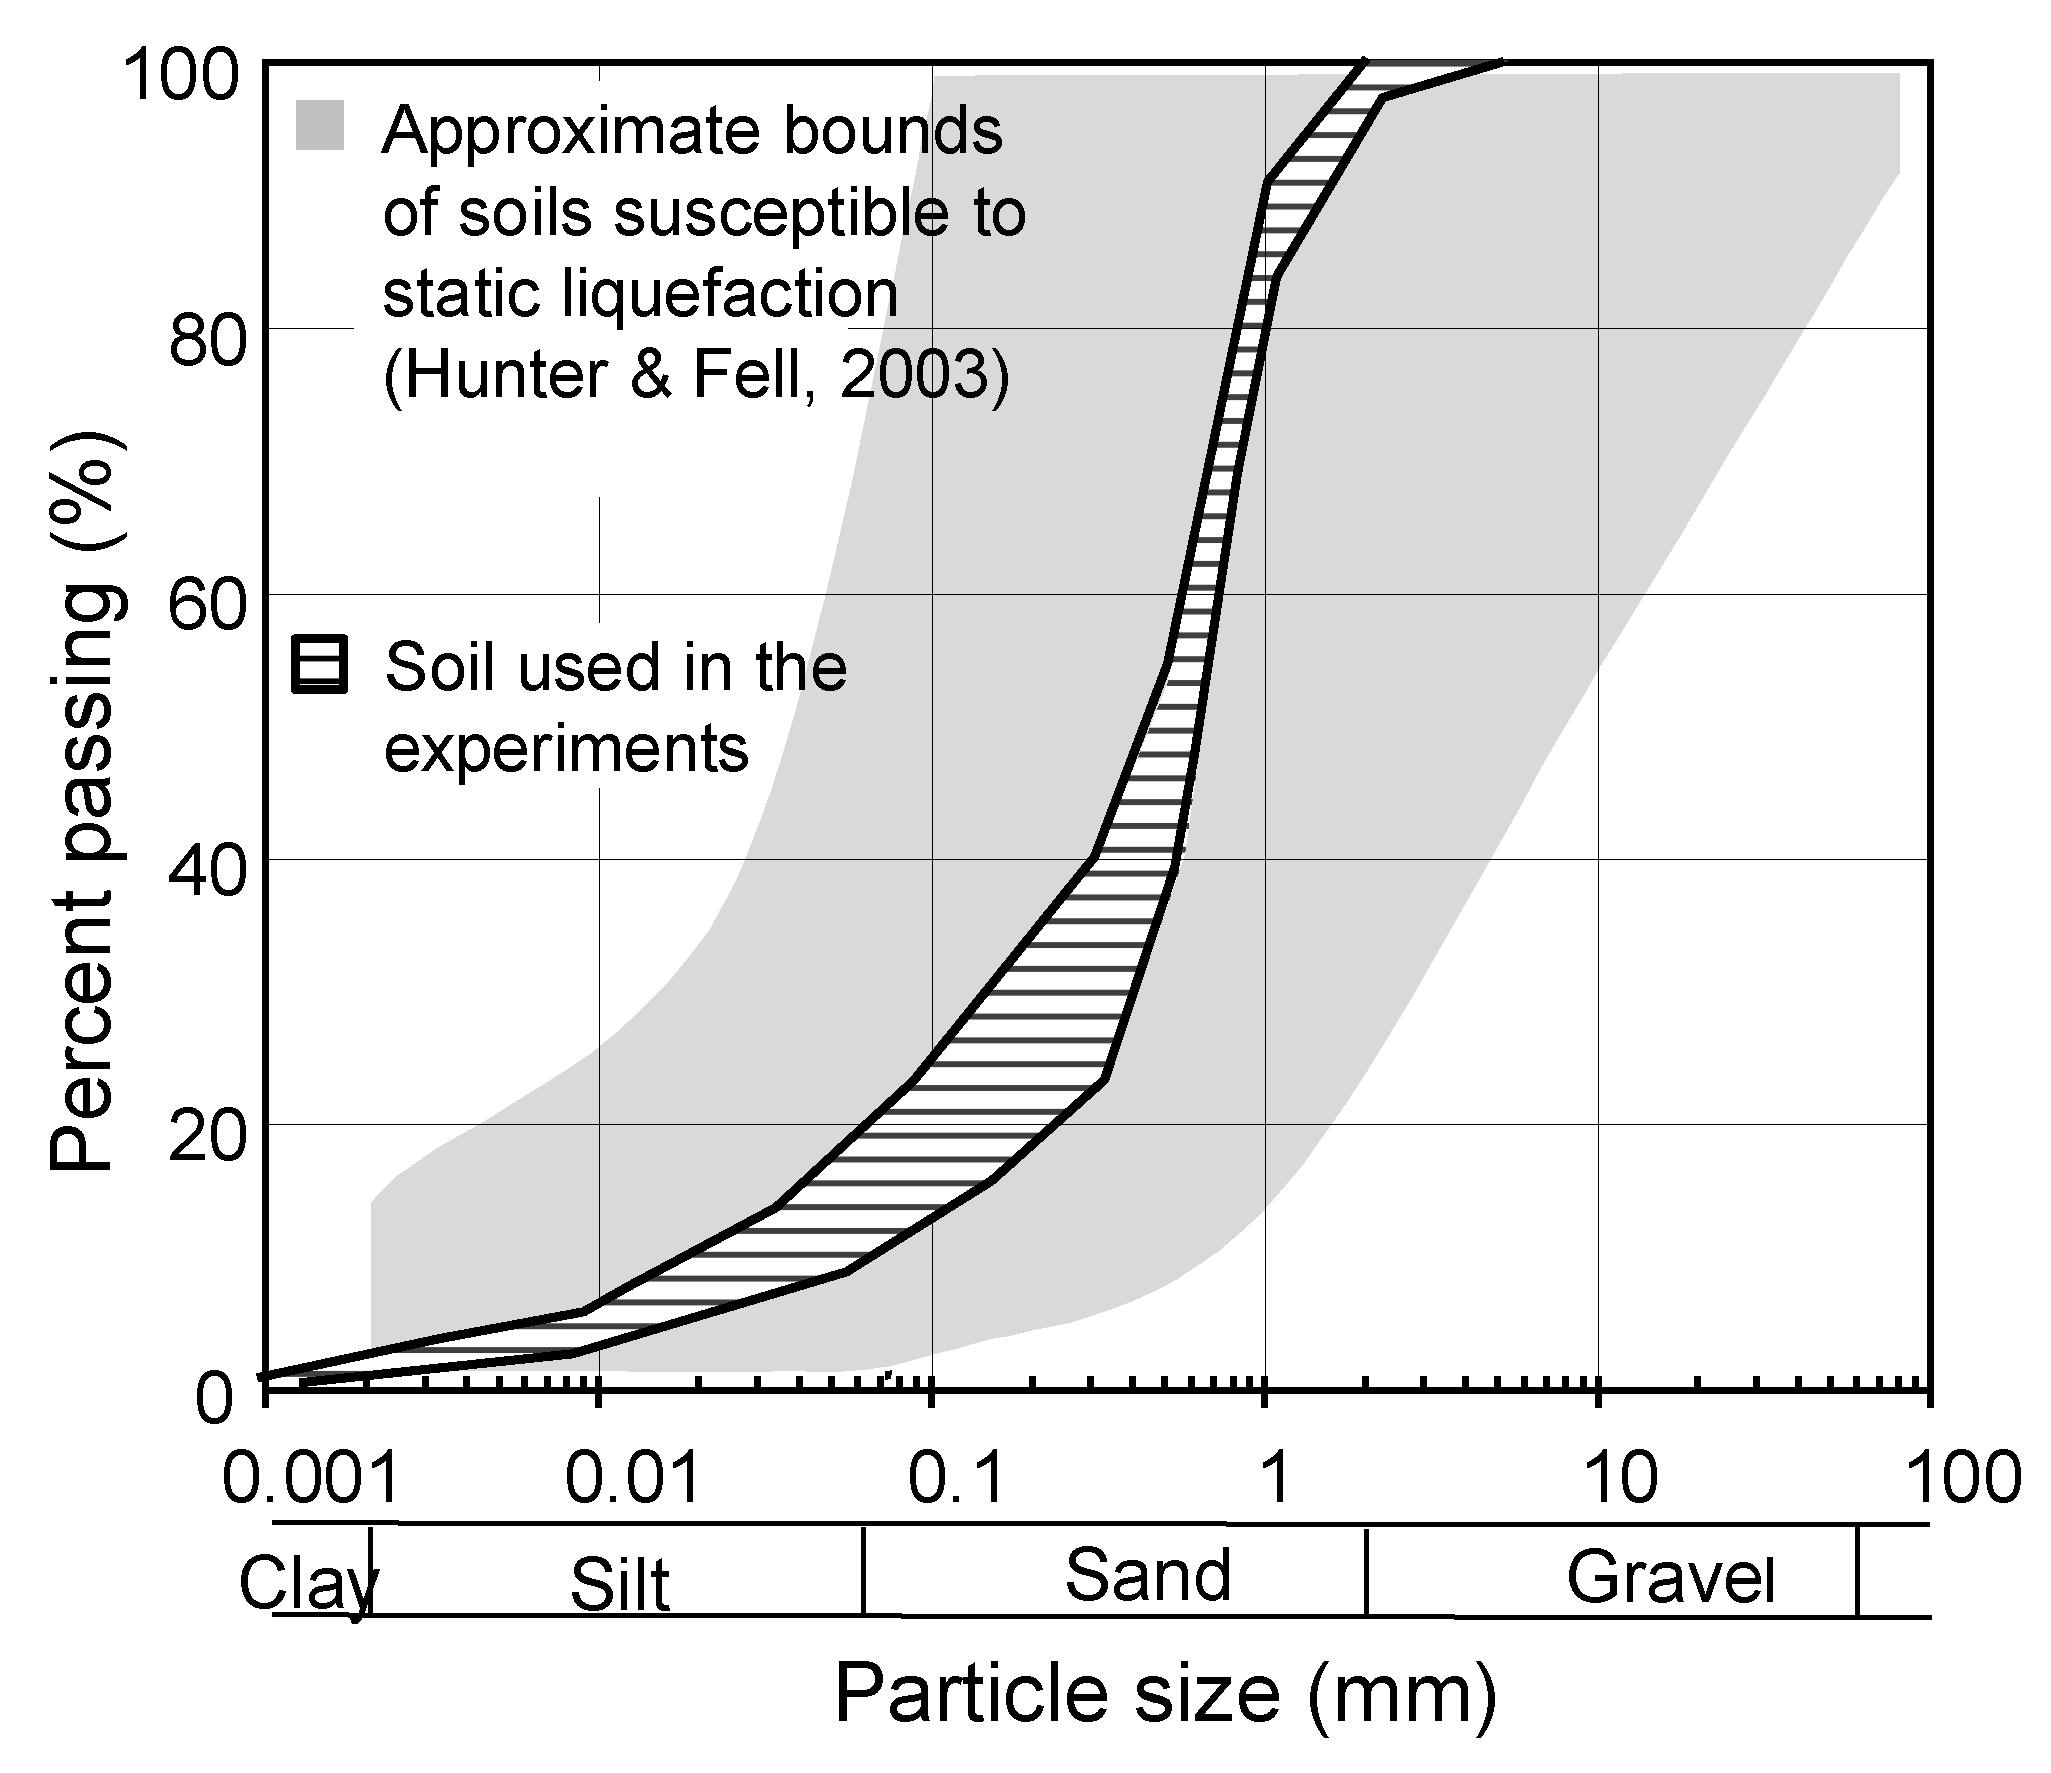
The thickest ash layer is supposed to have been responsible for the 1999 event [20], thus it has been selected for this study. This soil is classified as sand with 10–20% of non-plastic finer content (Figure 3). It falls within the bounds of deposits which are susceptible to static liquefaction [21]. The presence of non-plastic silty grains and the high soil porosity, which ranged between 65% and 72%, are further features which make the soil fabric metastable and collapsible.
Based on the results of constant head tests in the triaxial apparatus, the saturated hydraulic conductivity of this soil ranges between 1 × 10⁻⁶ and 5 × 10⁻⁶ m/s [19]. However, the value inferred from previous back-analysis of infiltration tests, conducted in the same apparatus used in these experiments, is in the order of 1 × 10⁻⁵ [22]. This gap can be justified by the different size of tested soil volumes and the different operative confining stresses, more than the effect of different initial degrees of saturation of the reconstituted soils [23,24]. In unsaturated conditions, the decrease of the hydraulic conductivity is of about two orders of magnitude [25]. The water retention curve of the ash is typical of the granular materials characterized by an air-entry value lower than 1 kPa and a residual volumetric water content of 0.17 [22].
As shown by both drained and undrained triaxial tests, the soil is cohesionless and its effective friction angle is 38° [26]. Its drained behavior is ductile; in contrast, when saturated and sheared in undrained conditions it displays a brittle and unstable response [27].
The influence of partial saturation on shear strength was stressed by Olivares [28] by means of a suction-controlled triaxial tests (SCTX): Assuming a shear strength envelope parallel to the SSL, the relationship between intercept of cohesion and suction is strongly non-linear; for values of suction higher than 1 kPa (corresponding to the air-entry value), it may be roughly obtained by the function c = 2.4·ln(ua − uw) [29]. This “apparent cohesion” can justify the stability conditions of steep slopes even for low values of suction.
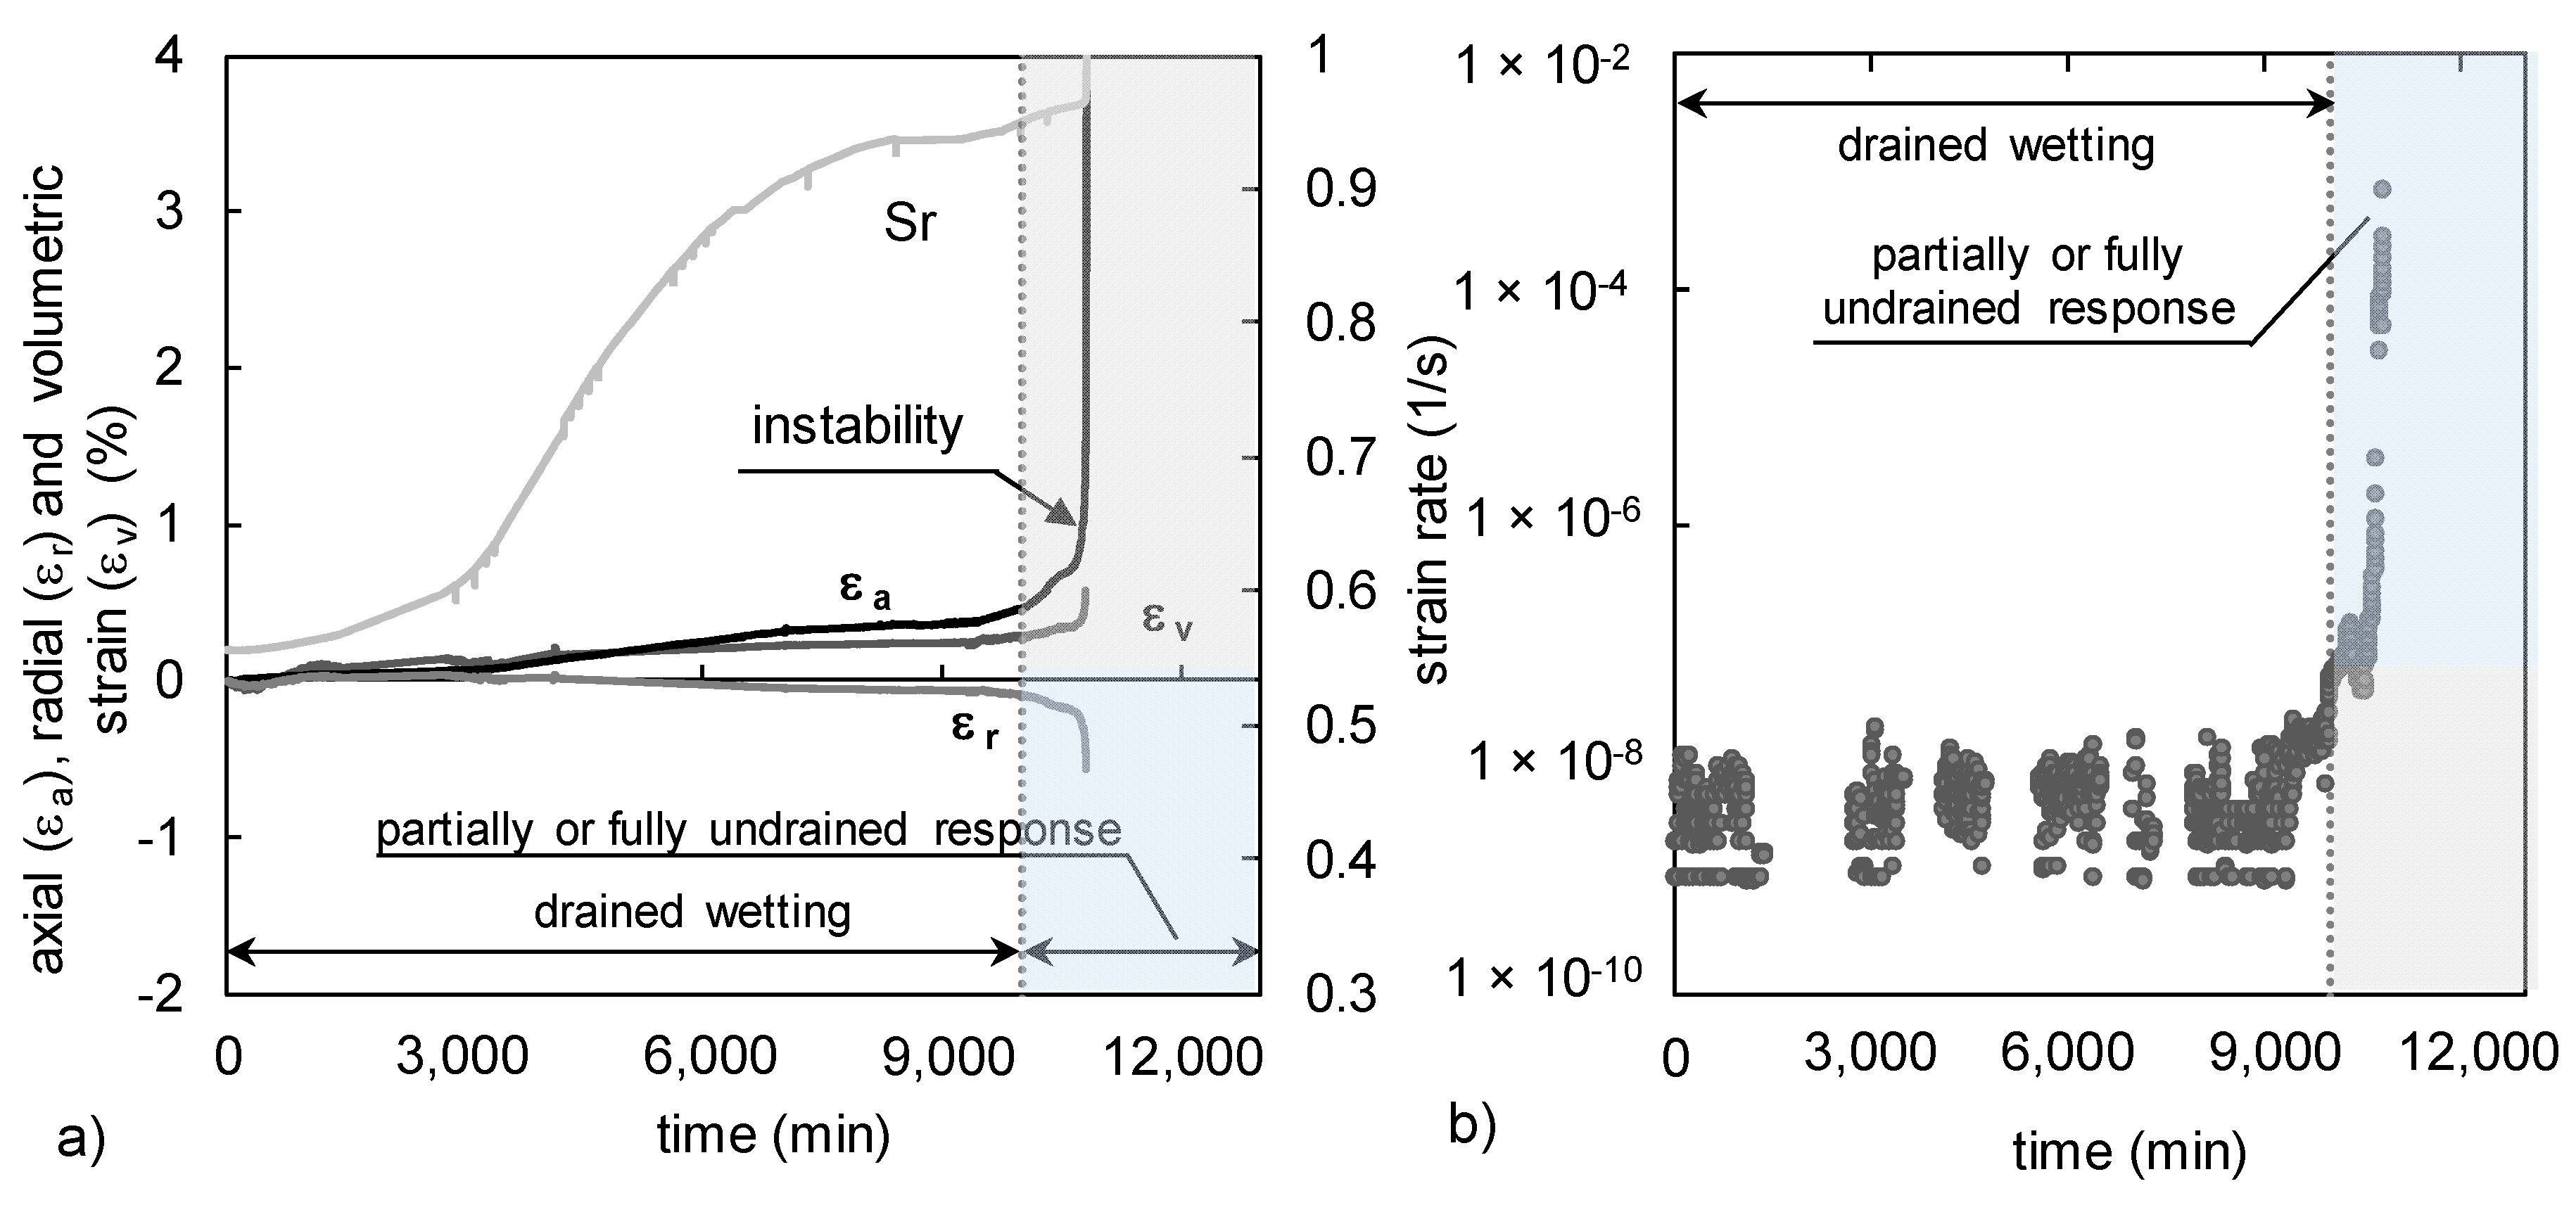
The soil response to wetting was investigated through some special wetting tests on undisturbed specimens, conducted in a SCTX apparatus [10]. After a reconsolidation procedure aimed at reproducing the natural state of stress in the dry season, the specimens are subjected to a stress path simulating the effects of rain water infiltration; in particular, suction is gradually decreased with a rate of 4 kPa/h (wetting stage) under constant deviator stress, q, and mean net stress, p-ua. Figure 4, which reports one of such tests, shows that the first stage of wetting is characterized by a roughly constant deviatoric strain rate (Figure 4b), while the degree of saturation, Sr, increases (Figure 4a). Soil failure is characterized by the sudden increase of the deviatoric strain rate, which shortly rises from about 10−9 to 10−3 1/s (Figure 4b), while the degree of saturation reaches a value as high as 0.96, indicating that suction is dropping to a practically nihil value. The contrast between the sudden increase of axial strain (εa in Figure 4a) and the almost constant volumetric strain (εv in Figure 4a) in the final stage of the test, despite free drainage being allowed, is indicative of a practically undrained failure process.

3. Experimental Results

As indicated above, the experimental program has been focused on the progressive failure, induced by continuous rainfall, of an unsaturated sloping ash layer resting on an impervious surface. In this study, progressive failure is favored by the geometry of the physical model, which presents a local change in the basal slope angle, and by non-uniform initial soil water content, characterized by a higher degree of saturation in the top part of the slope.
The geometrical characteristics of the slope, the initial soil properties (water content, w, porosity, n, and degree of saturation, Sr) and the rainfall intensity (i) and duration of rainfall (Δt) in the two experiments are reported in Table 1. In particular, in the first experiment (RP2) the rainfall intensity has been kept constant (30 mm/h), while in the second one (RP3) it has been increased in two steps.

3.1. RP2 Experiment

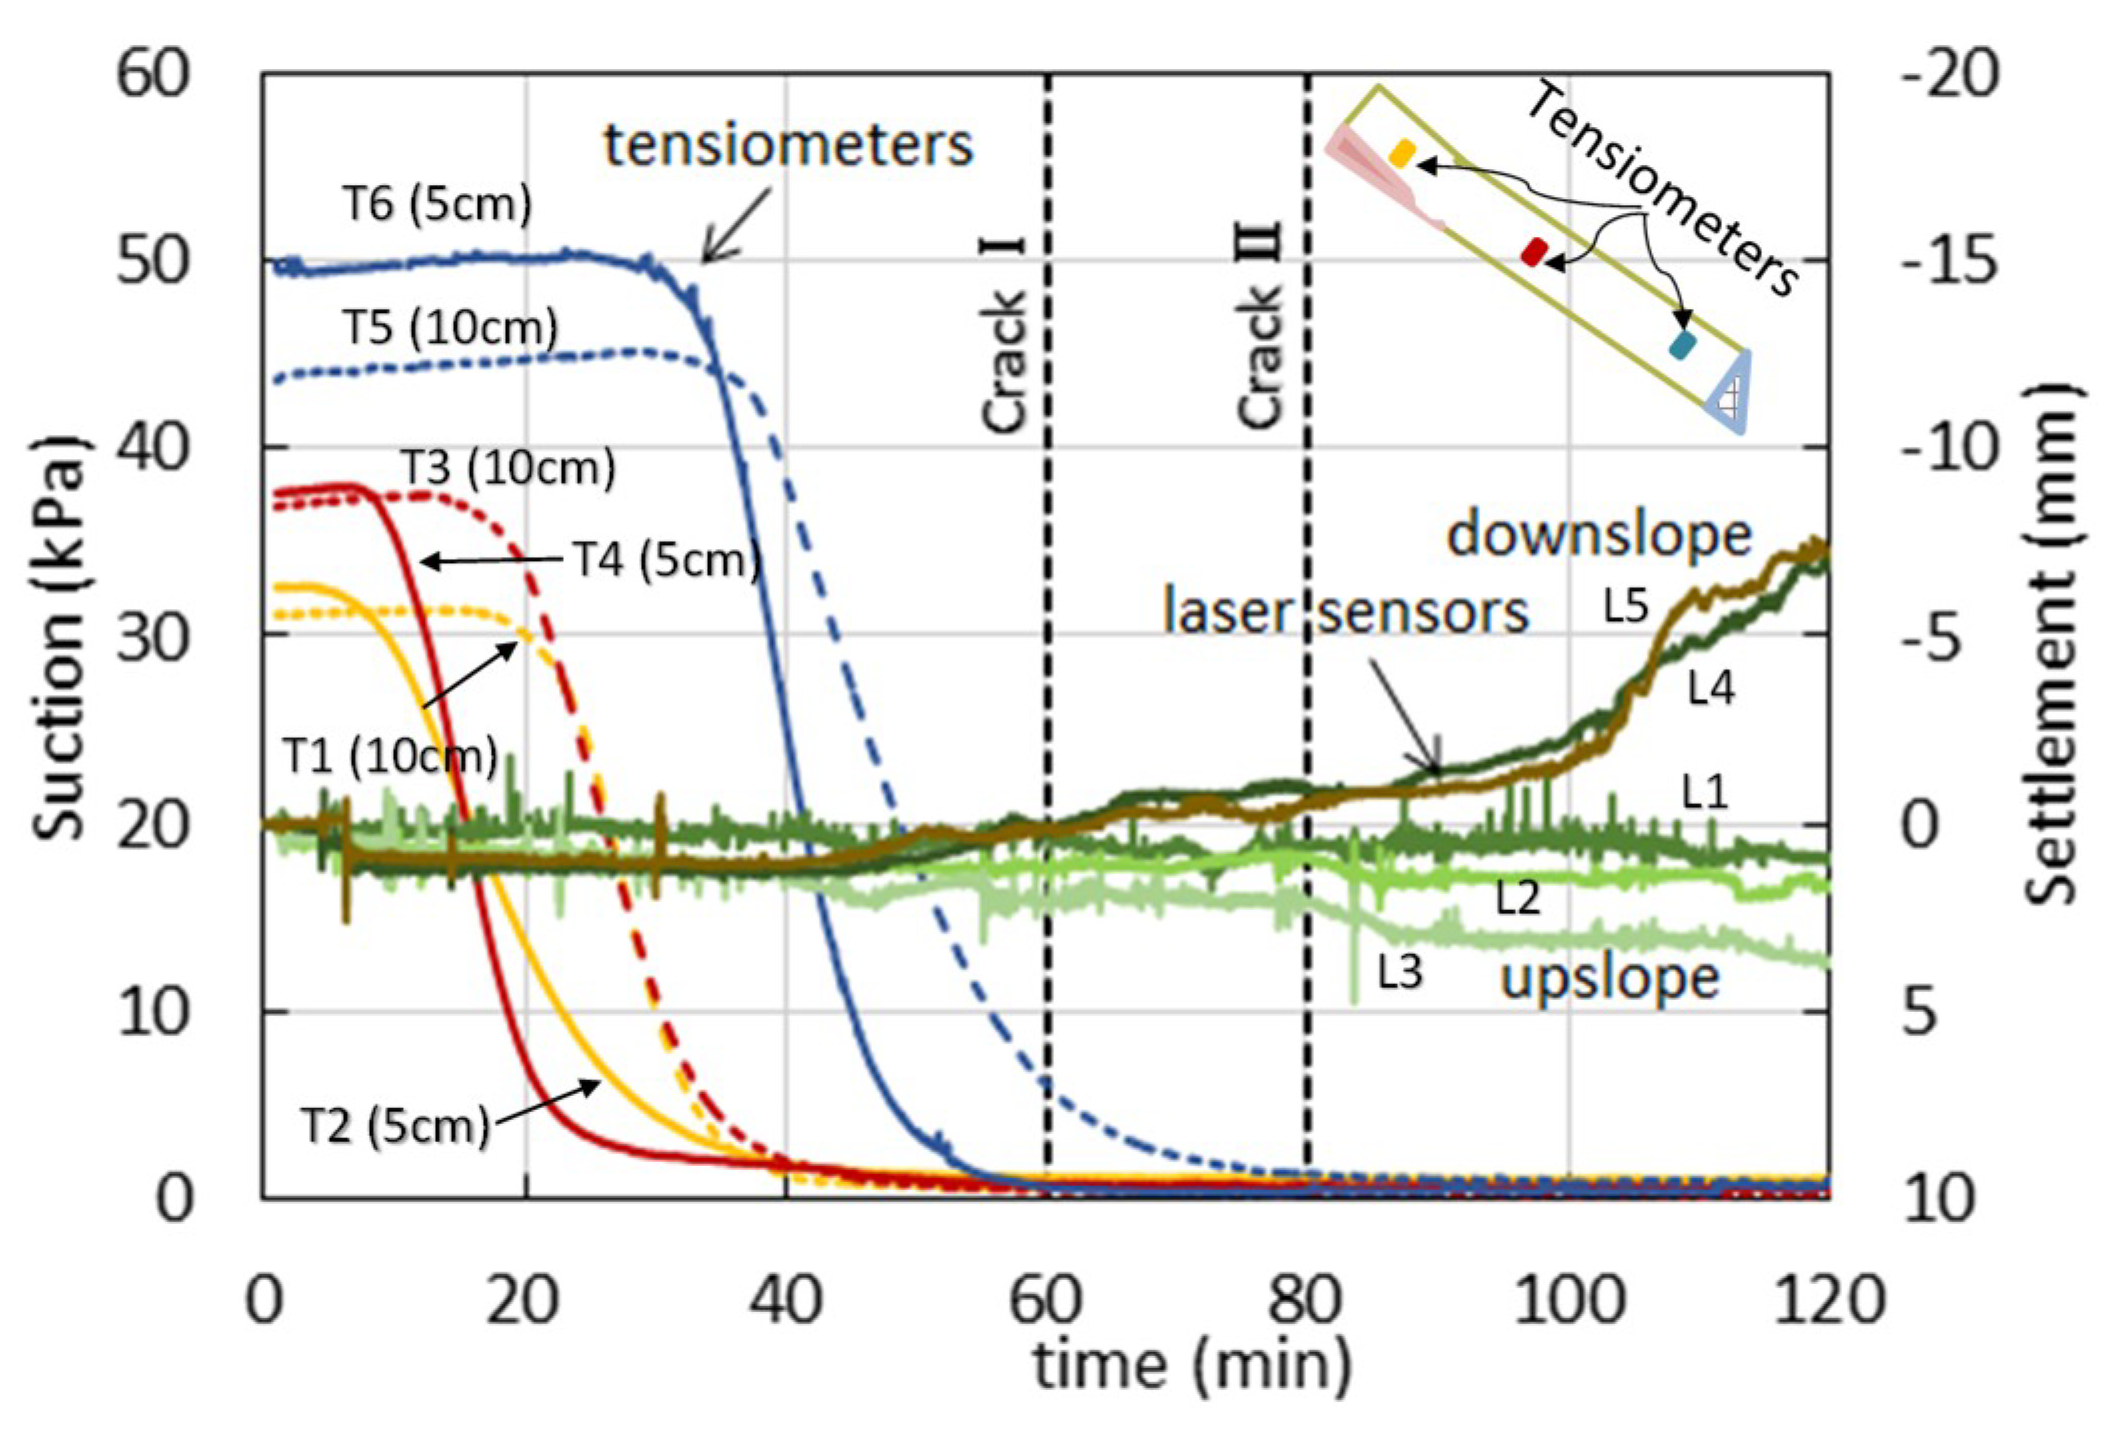
Figure 5, Figure 6, Figure 7 and Figure 8 summarize the results of the first experiment. In particular, Figure 5 shows the effects of rainfall on soil suction and deformation of the ground surface. The decrease in suction at the different depths shows the advance of the infiltration front. About 10 min after the beginning of the experiment, the water front firstly reaches the two tensiometers installed, at mid-depth (z = 5 cm), at top and middle zone of the slope, then the deepest sensors (z = 10 cm) at the same sections. Later on (i.e., 30’ after the beginning of the test), the water front reaches the sensors installed at the slope toe. Such a delayed decrease in suction reflects a non-uniform progress of the infiltration process due to the non-uniform initial water content distribution, testified by the different initial values of suction (Figure 5), which affects the local hydraulic conductivity. Only 80 min after the beginning of the experiment, when suction reaches everywhere at a value of a few kPa, the water content, as inferred by the retention curve of the soil, becomes fairly uniform in the slope. About 20 min later, suction attains everywhere at a value around 0.5 kPa, corresponding to a saturation degree of 92%, which indicates the establishment of a nearly stable stress condition. In fact, since then the water content no longer significantly changes and the transducers located at the bottom of the slope cannot record any positive pore pressure value.
During the first phase of the experiment, the laser sensors show that the slope surface is experiencing a settlement, up to a maximum value of 2 mm, which testifies some volumetric collapse (εv = 2%); 40 min after the beginning of test, while the uppermost zone is displaying continuing compressive strains, the ground surface in the toe zone starts heaving, as indicated by the laser sensors L4 and L5 (Figure 1b). The beginning of this diverging effect is featured by formation of cracks at about 25 and 40 cm from the upslope part of the slope, respectively, 60 and 80 min after the start of the test. It is worth noting that the second crack is more or less located at the section that marks the change in the basal slope angle.
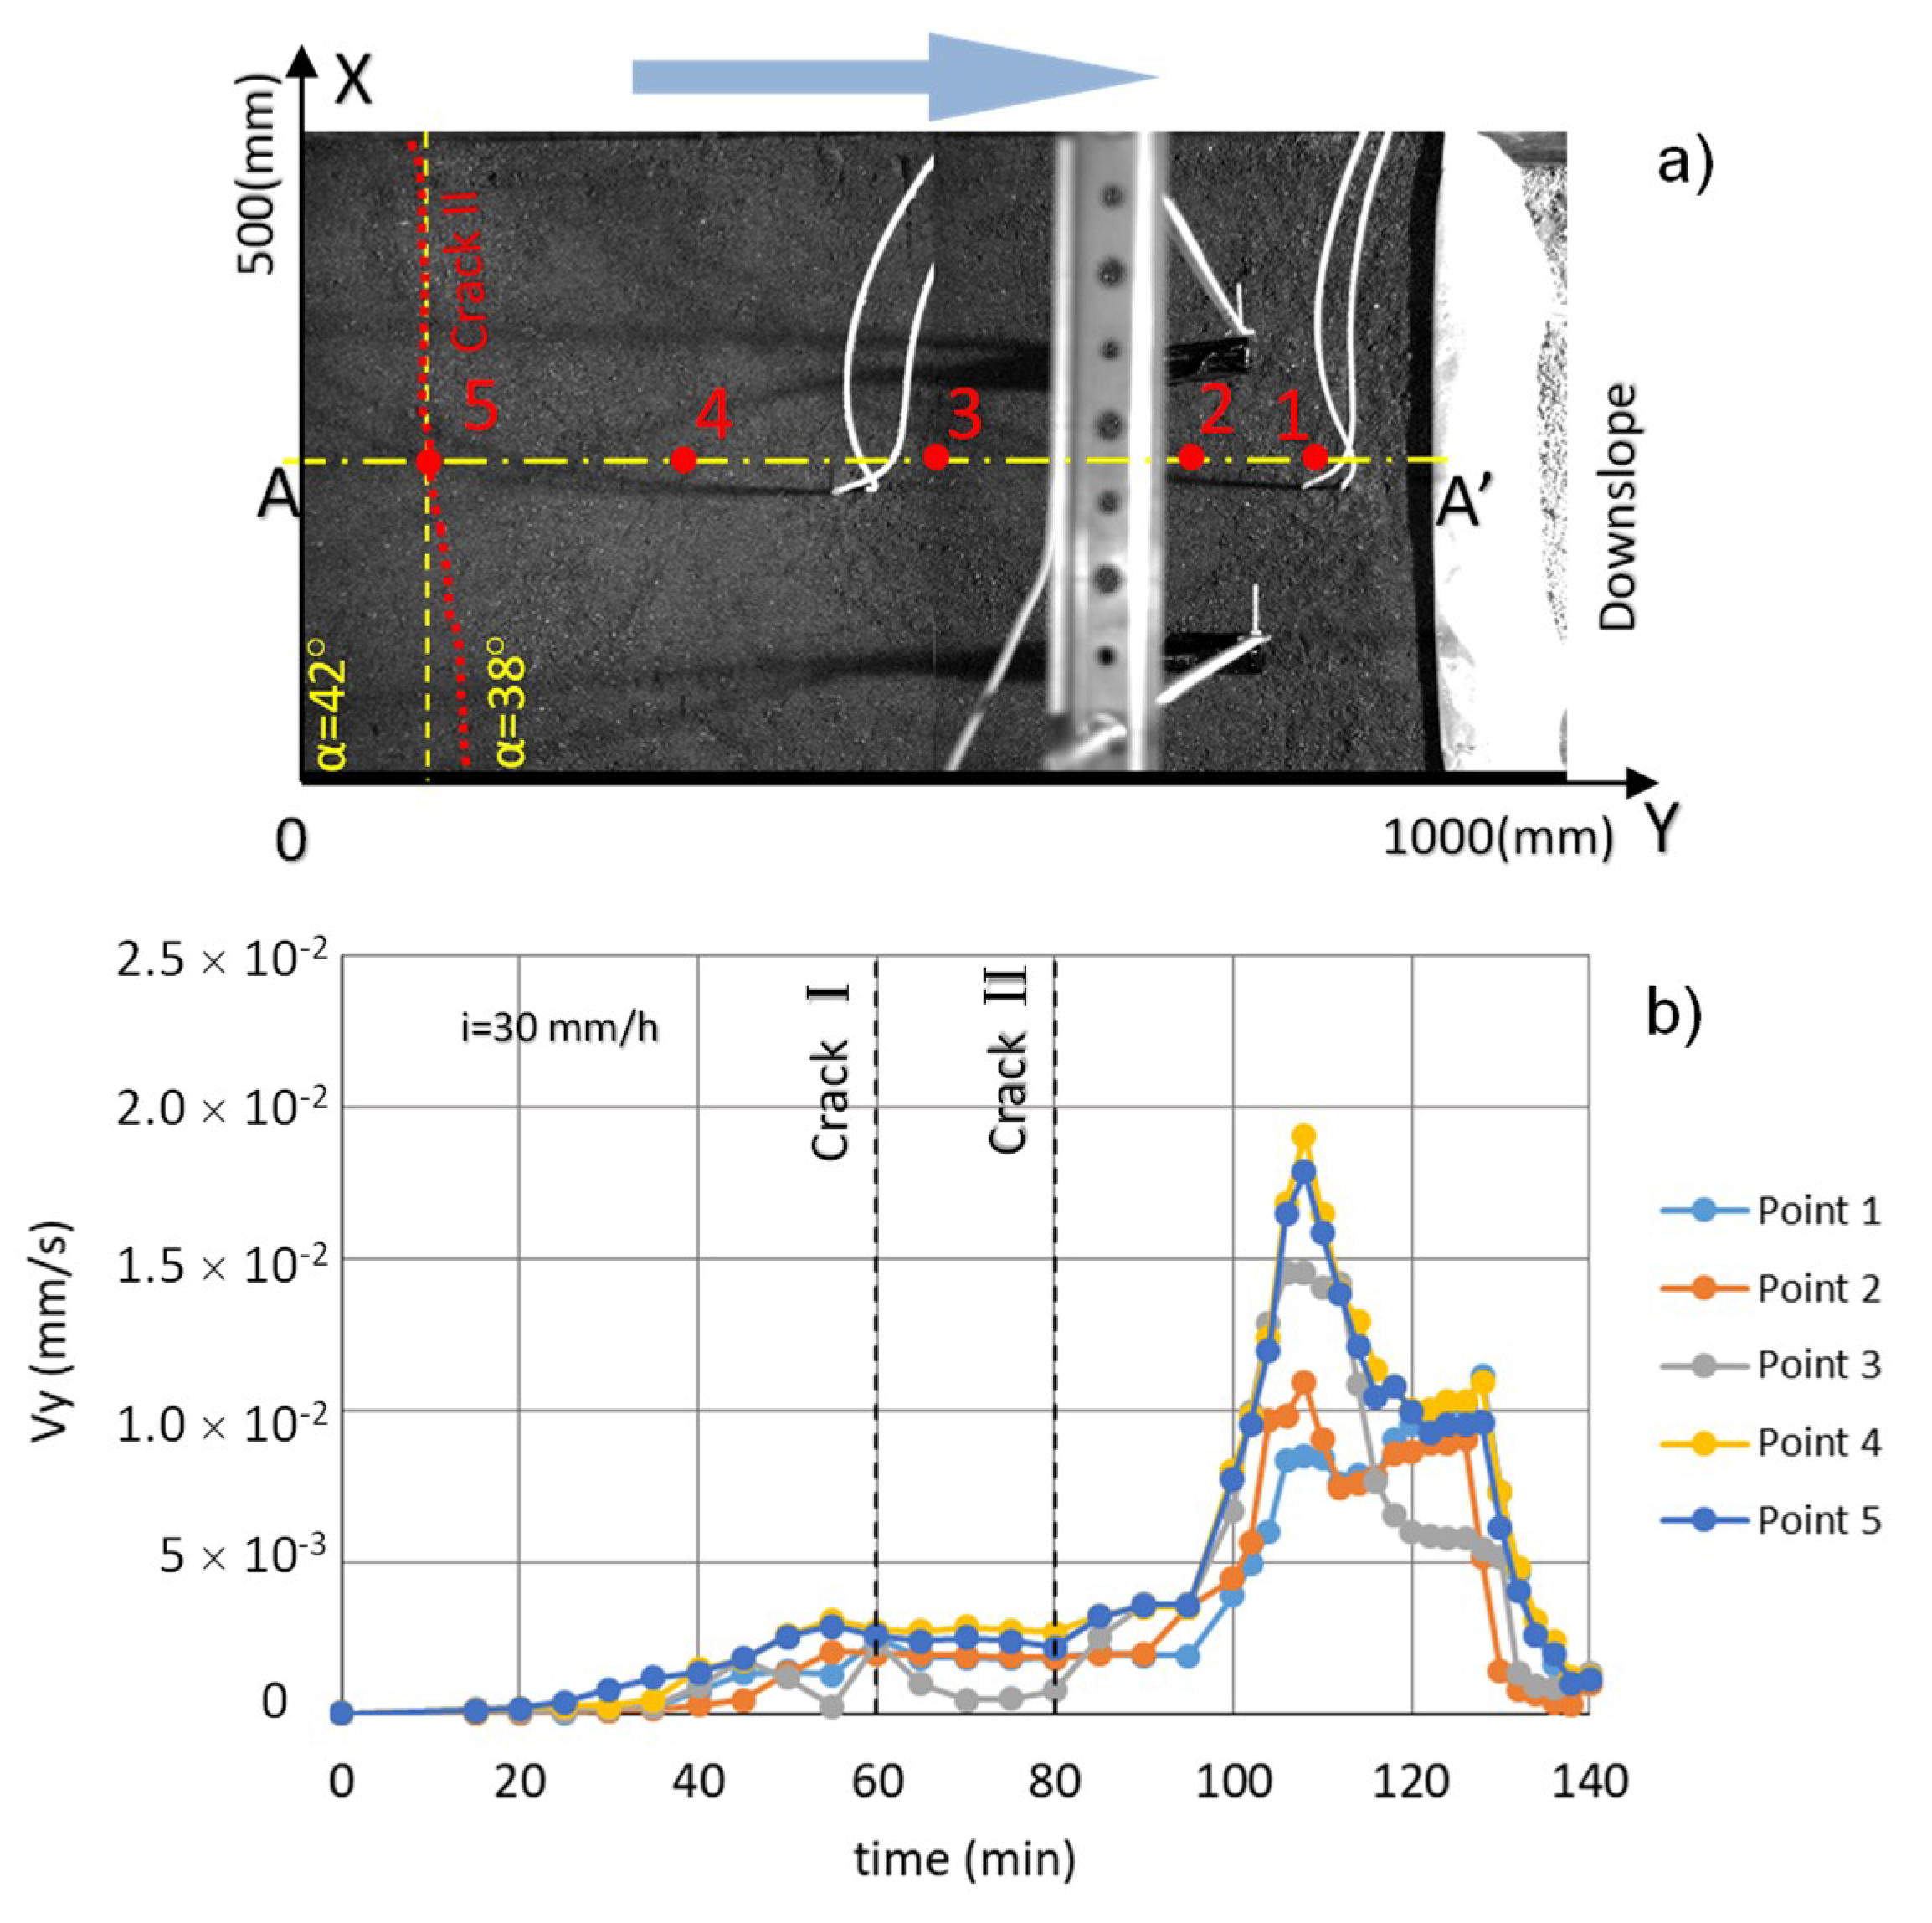
Figure 6 reports the downslope displacement rate (Vy) obtained from PIV technique at some points of the ground surface along section A–A′ (Figure 6a). The readings show that first movements occur upslope (point 5 in Figure 6b) about 20’ after the beginning of rainfall. This is a clear effect of the faster local reduction in suction and of the higher slope angle. Some role is also played by the presence of a rigid wall at the toe, which hinders downslope displacements. About 40 min after the beginning of the experiment, other parts of the slope start to accelerate (points 1, 2, and 3 in Figure 6b). After the initial increase, the displacement rate maintains everywhere a nearly constant value for about 35’ (time interval comprised between 60 and 95 min), then it grows again, reaching a peak of 1.8 × 10⁻² mm/s. However, in the following minutes, it drops to a negligible value, leading to a new stable slope configuration, which is assured by a small residual suction of 0.5 kPa (Figure 5). This is due to the fact that the rainfall intensity cannot lead to full soil saturation as it is less than the saturated conductivity of the soil (about 70 mm/h) retrieved by back-analysis of previous infiltration tests.
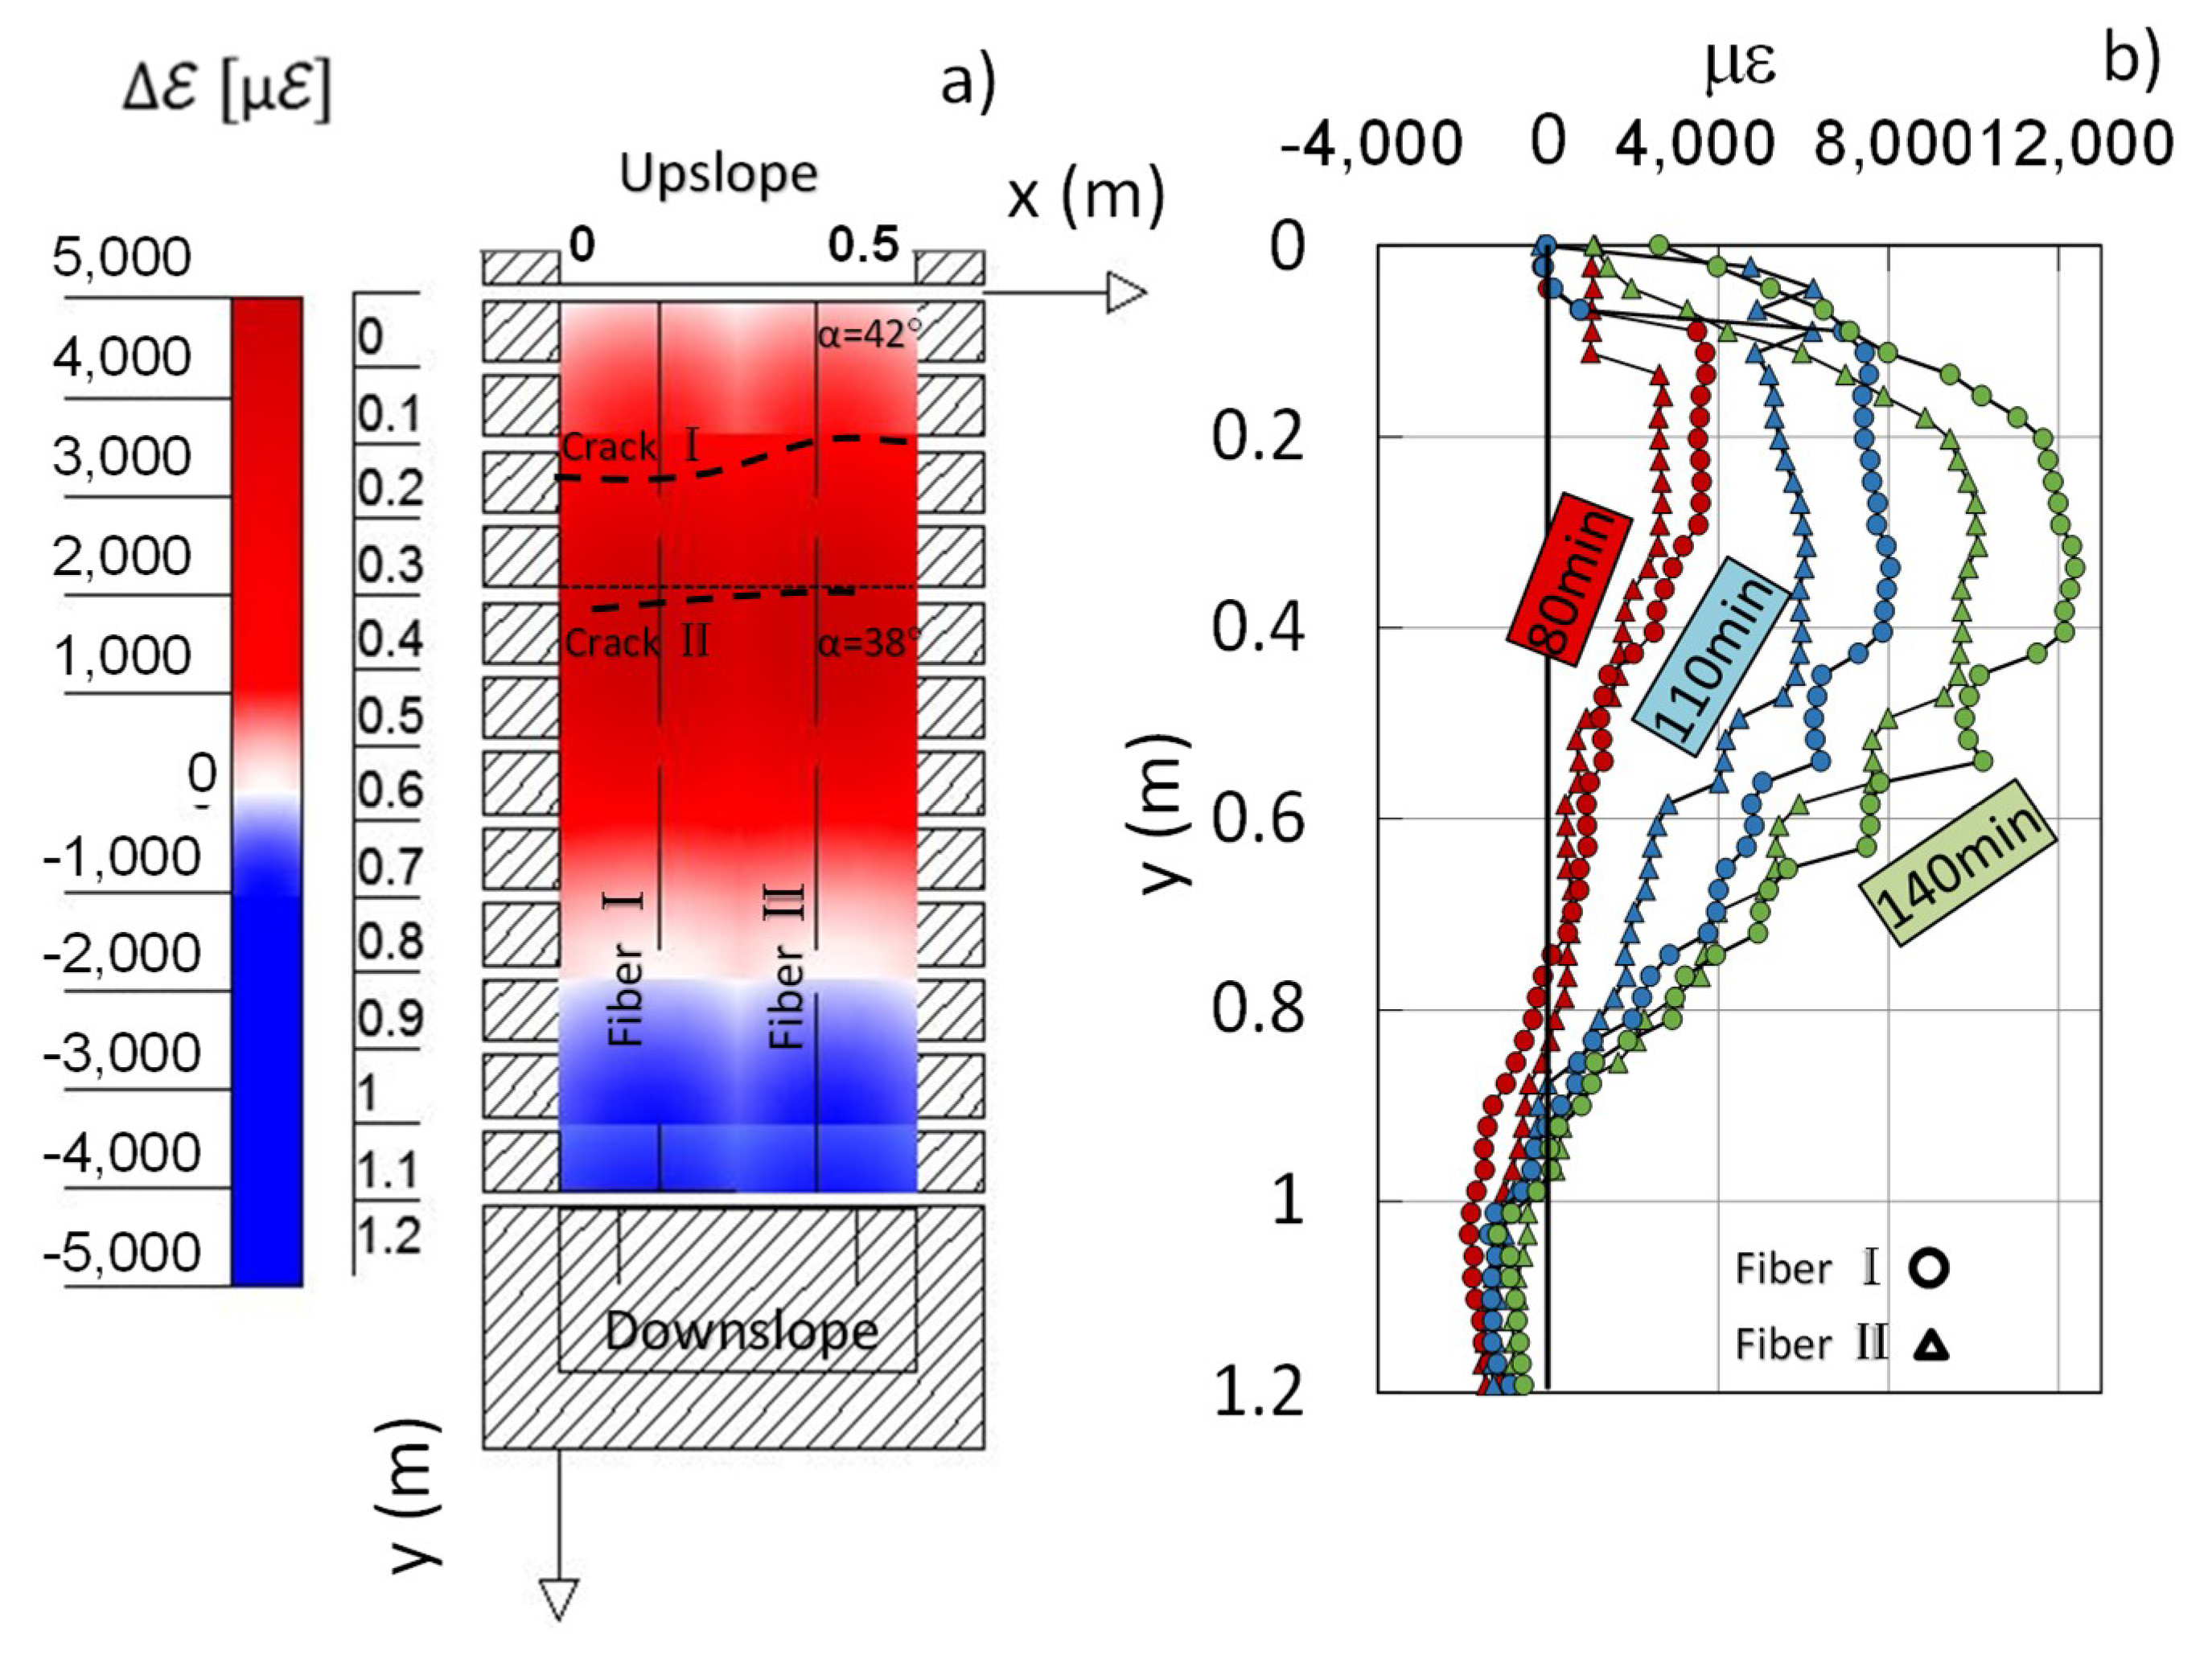
A detailed soil strain profile over the entire slope is provided by the high spatial resolution BOFDA readings. Figure 7 shows the evolution of measured fiber strains at three different positions (slope top, middle, and toe; as in the schematic plan-view in Figure 7) along the two longitudinal embedded strands. About 20 min after the beginning of the experiment the fiber can show, extension strain in the uppermost part of slope (positive values of εf, which correspond to fiber elongation) and compression strain in the lowermost zone. Such data match the readings provided by the other sensors. It is worth mentioning that the peak strain is detected just at the section where the slope angle changes and the second crack has taken place. This is clearly shown by the strain profile recorded 80 min after the beginning of rainfall (Figure 8b). However, as shown by all the strain profiles reported in Figure 8b, the deformation of a significant upslope part of the layer is uniform and its evolution in time (light blue data series in Figure 7) is characterized by initial acceleration, then by deceleration until almost complete arrest. Therefore, in agreement with findings suggested by the elaboration of PIV data (Figure 6), the slope is no longer subjected to significant movements even though the high strains recorded seem to indicate that a local failure condition (ε = 1.2%) has been reached.

3.2. RP3 Experiment

In order to lead the slope to fail, in the second experiment the rainfall intensity has been increased in two steps. It is also worth noting the higher initial saturation degree in the upper part of the model.
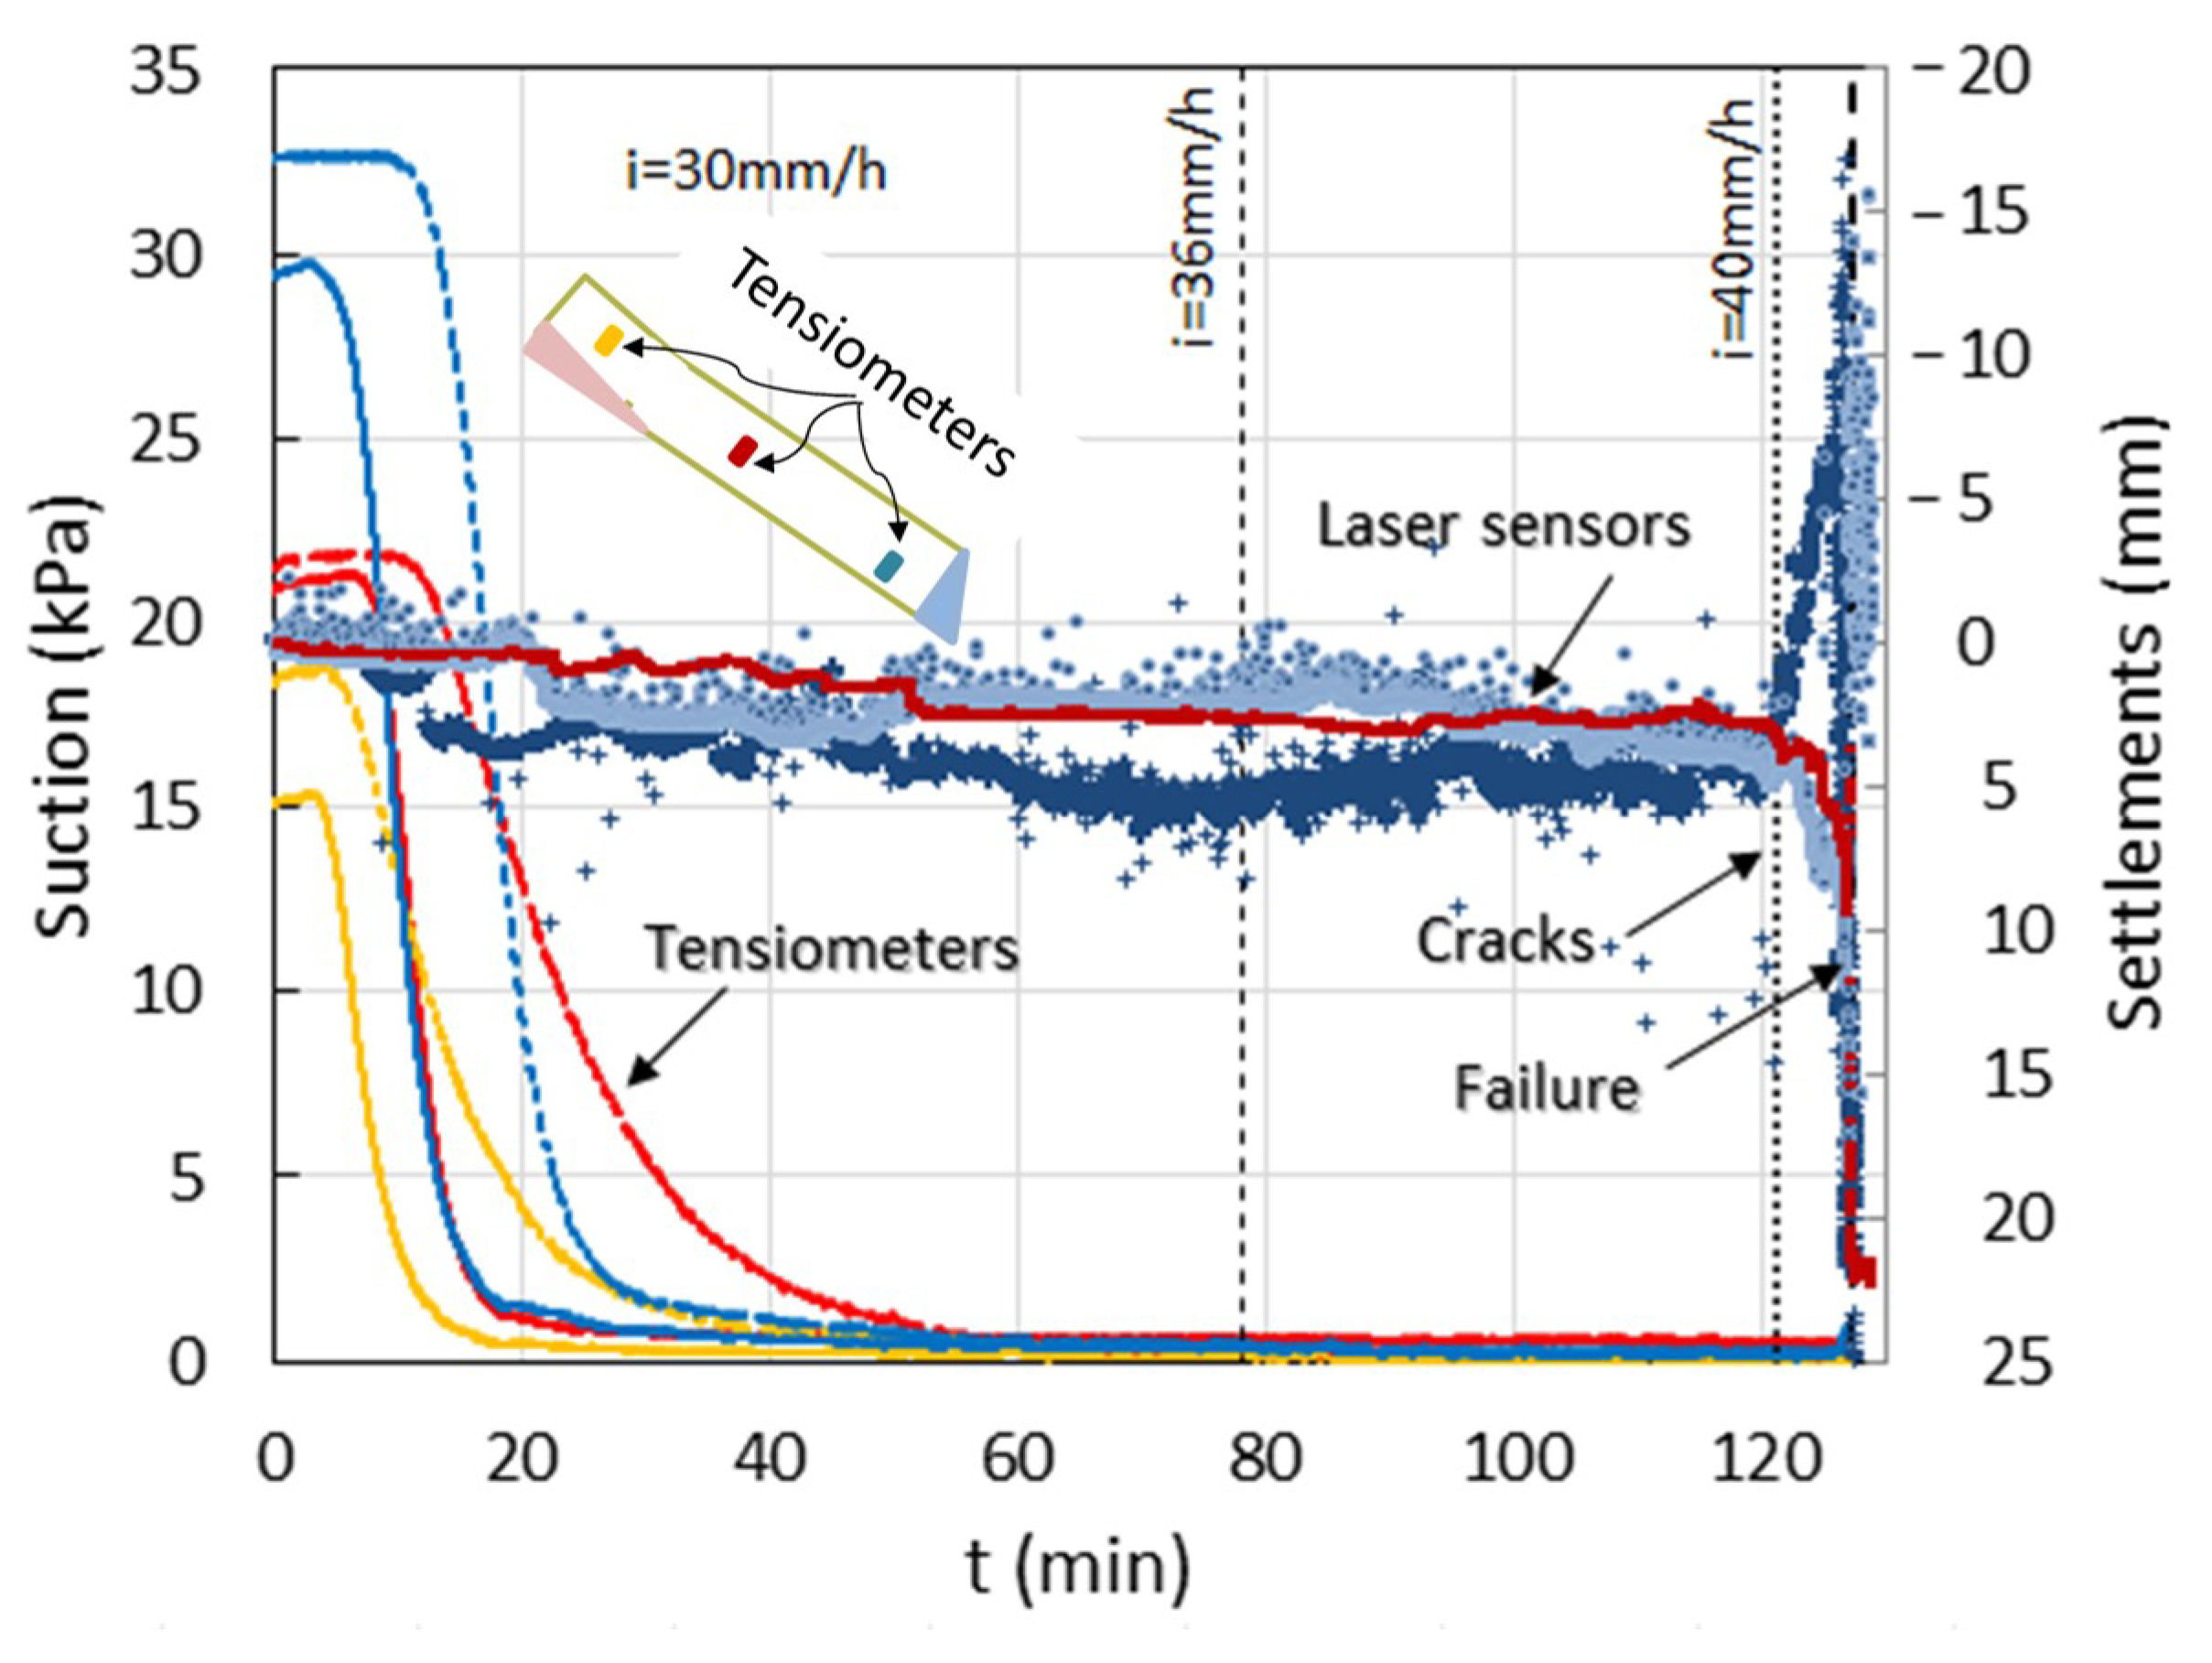
The main results of this test are reported in Figure 9, Figure 10, Figure 11 and Figure 12. In the first phase featured by the same rainfall intensity as in the first experiment, lasting about 80 min, the slope behavior is qualitatively similar to the one exhibited by the slope in that test, although the suction reduction has been faster due to the higher initial degree of saturation of the soil (Table 1). Again, suction decreases first upslope (Figure 9), reaching a value of 0.5 kPa 60’ after the beginning of the experiment. The consequent volumetric strains in this case attain a value of about 5%.
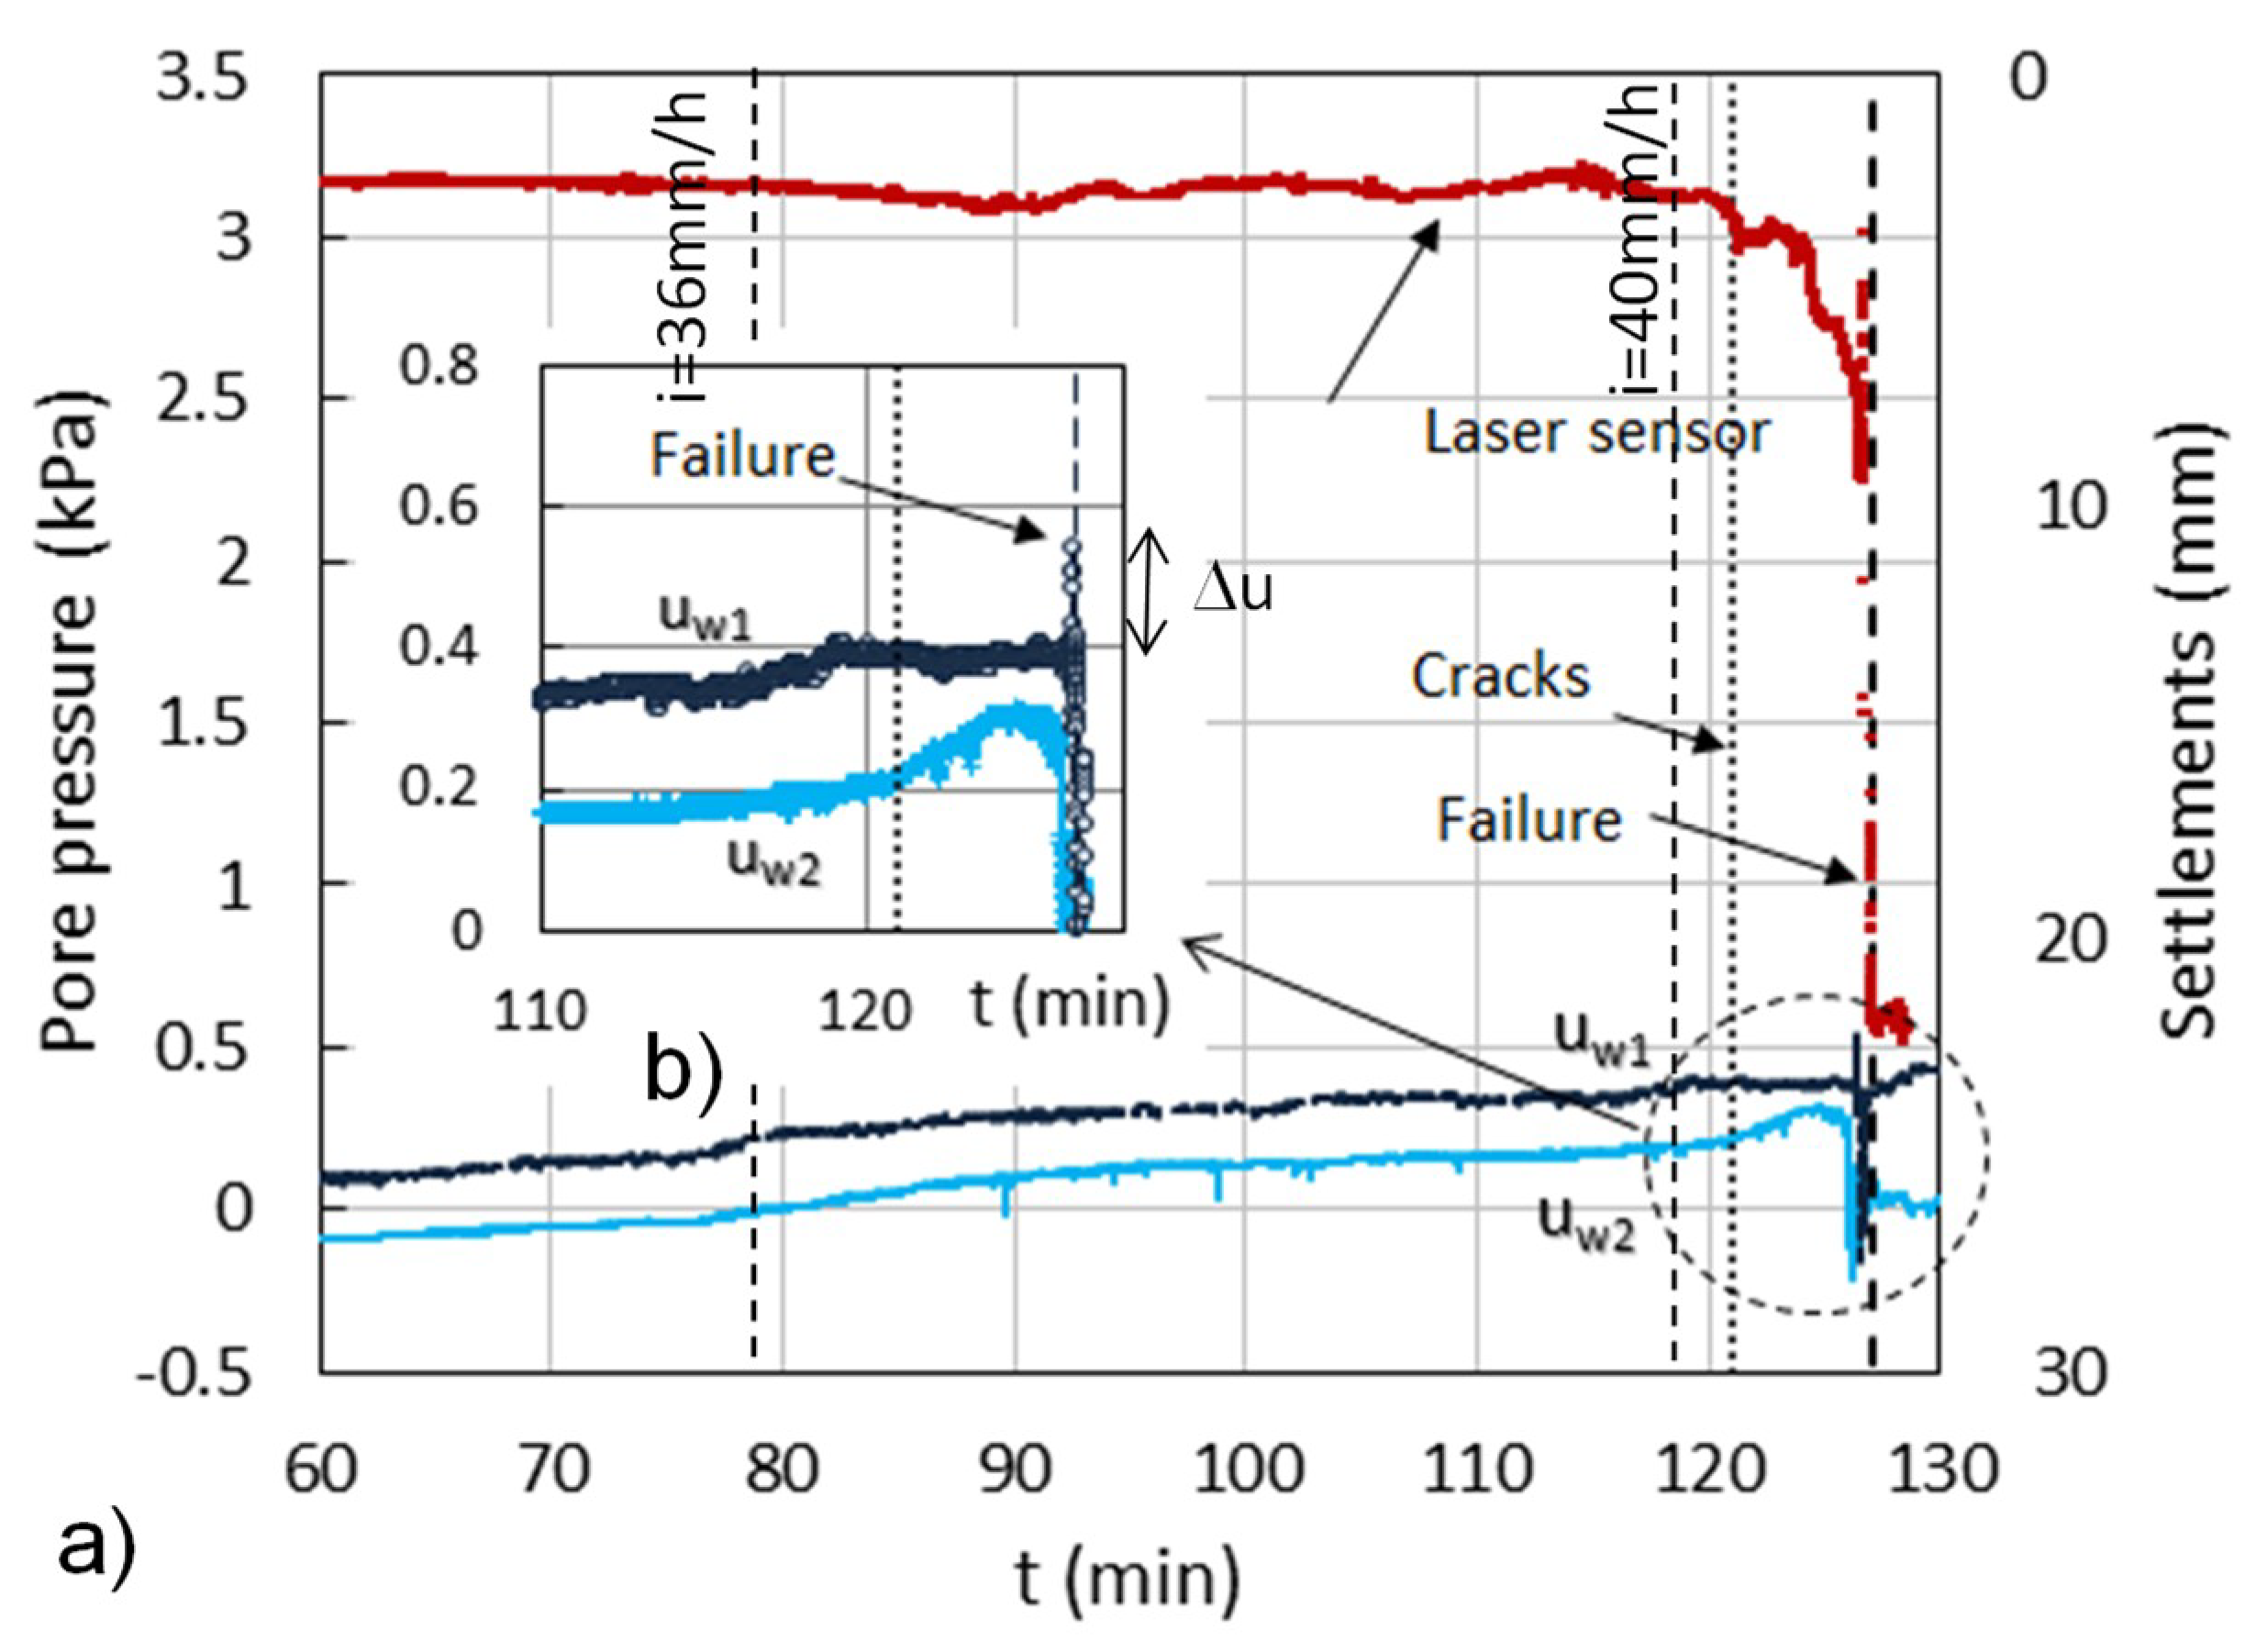
Then, the rainfall intensity has been increased in two steps. As a result, a positive pore pressure is first measured at the base of the steepest section of the slope (uw1 in Figure 1 and Figure 10), then, 20 min later, a positive value is also measured at the downslope transducer (uw2 in Figure 1 and Figure 10). Moreover, a few seconds after slope failure, which occurs for a pore pressure of 0.4 kPa at the upslope transducer, pore pressure undergoes a further rapid and transient increase of about 0.2 kPa (Figure 10b), which seems to testify a condition of undrained instability.
Figure 11 reports the displacement rate measured at different points of the slope. During the first stage lasting about 25’ (i = 30 mm/h), it gradually increases reaching a peak value of about 0.08 mm/s. In this stage the movement is again clearly progressively downslope. However, in the following stage, the displacement rate decreases up to a negligible value, which is attained 60’ after the beginning of the test, because, as in the previous experiment, the slope is reaching a stable configuration. Only the subsequent increase of the rainfall intensity can eventually lead to slope failure, which is now characterized by an essentially block-type downslope movement. Failure takes place 126 min after the beginning of test. Visual surveys indicate that, after failure, the soil moves as a mud and soil particles are no more distinguishable in a practically fluidized mass.
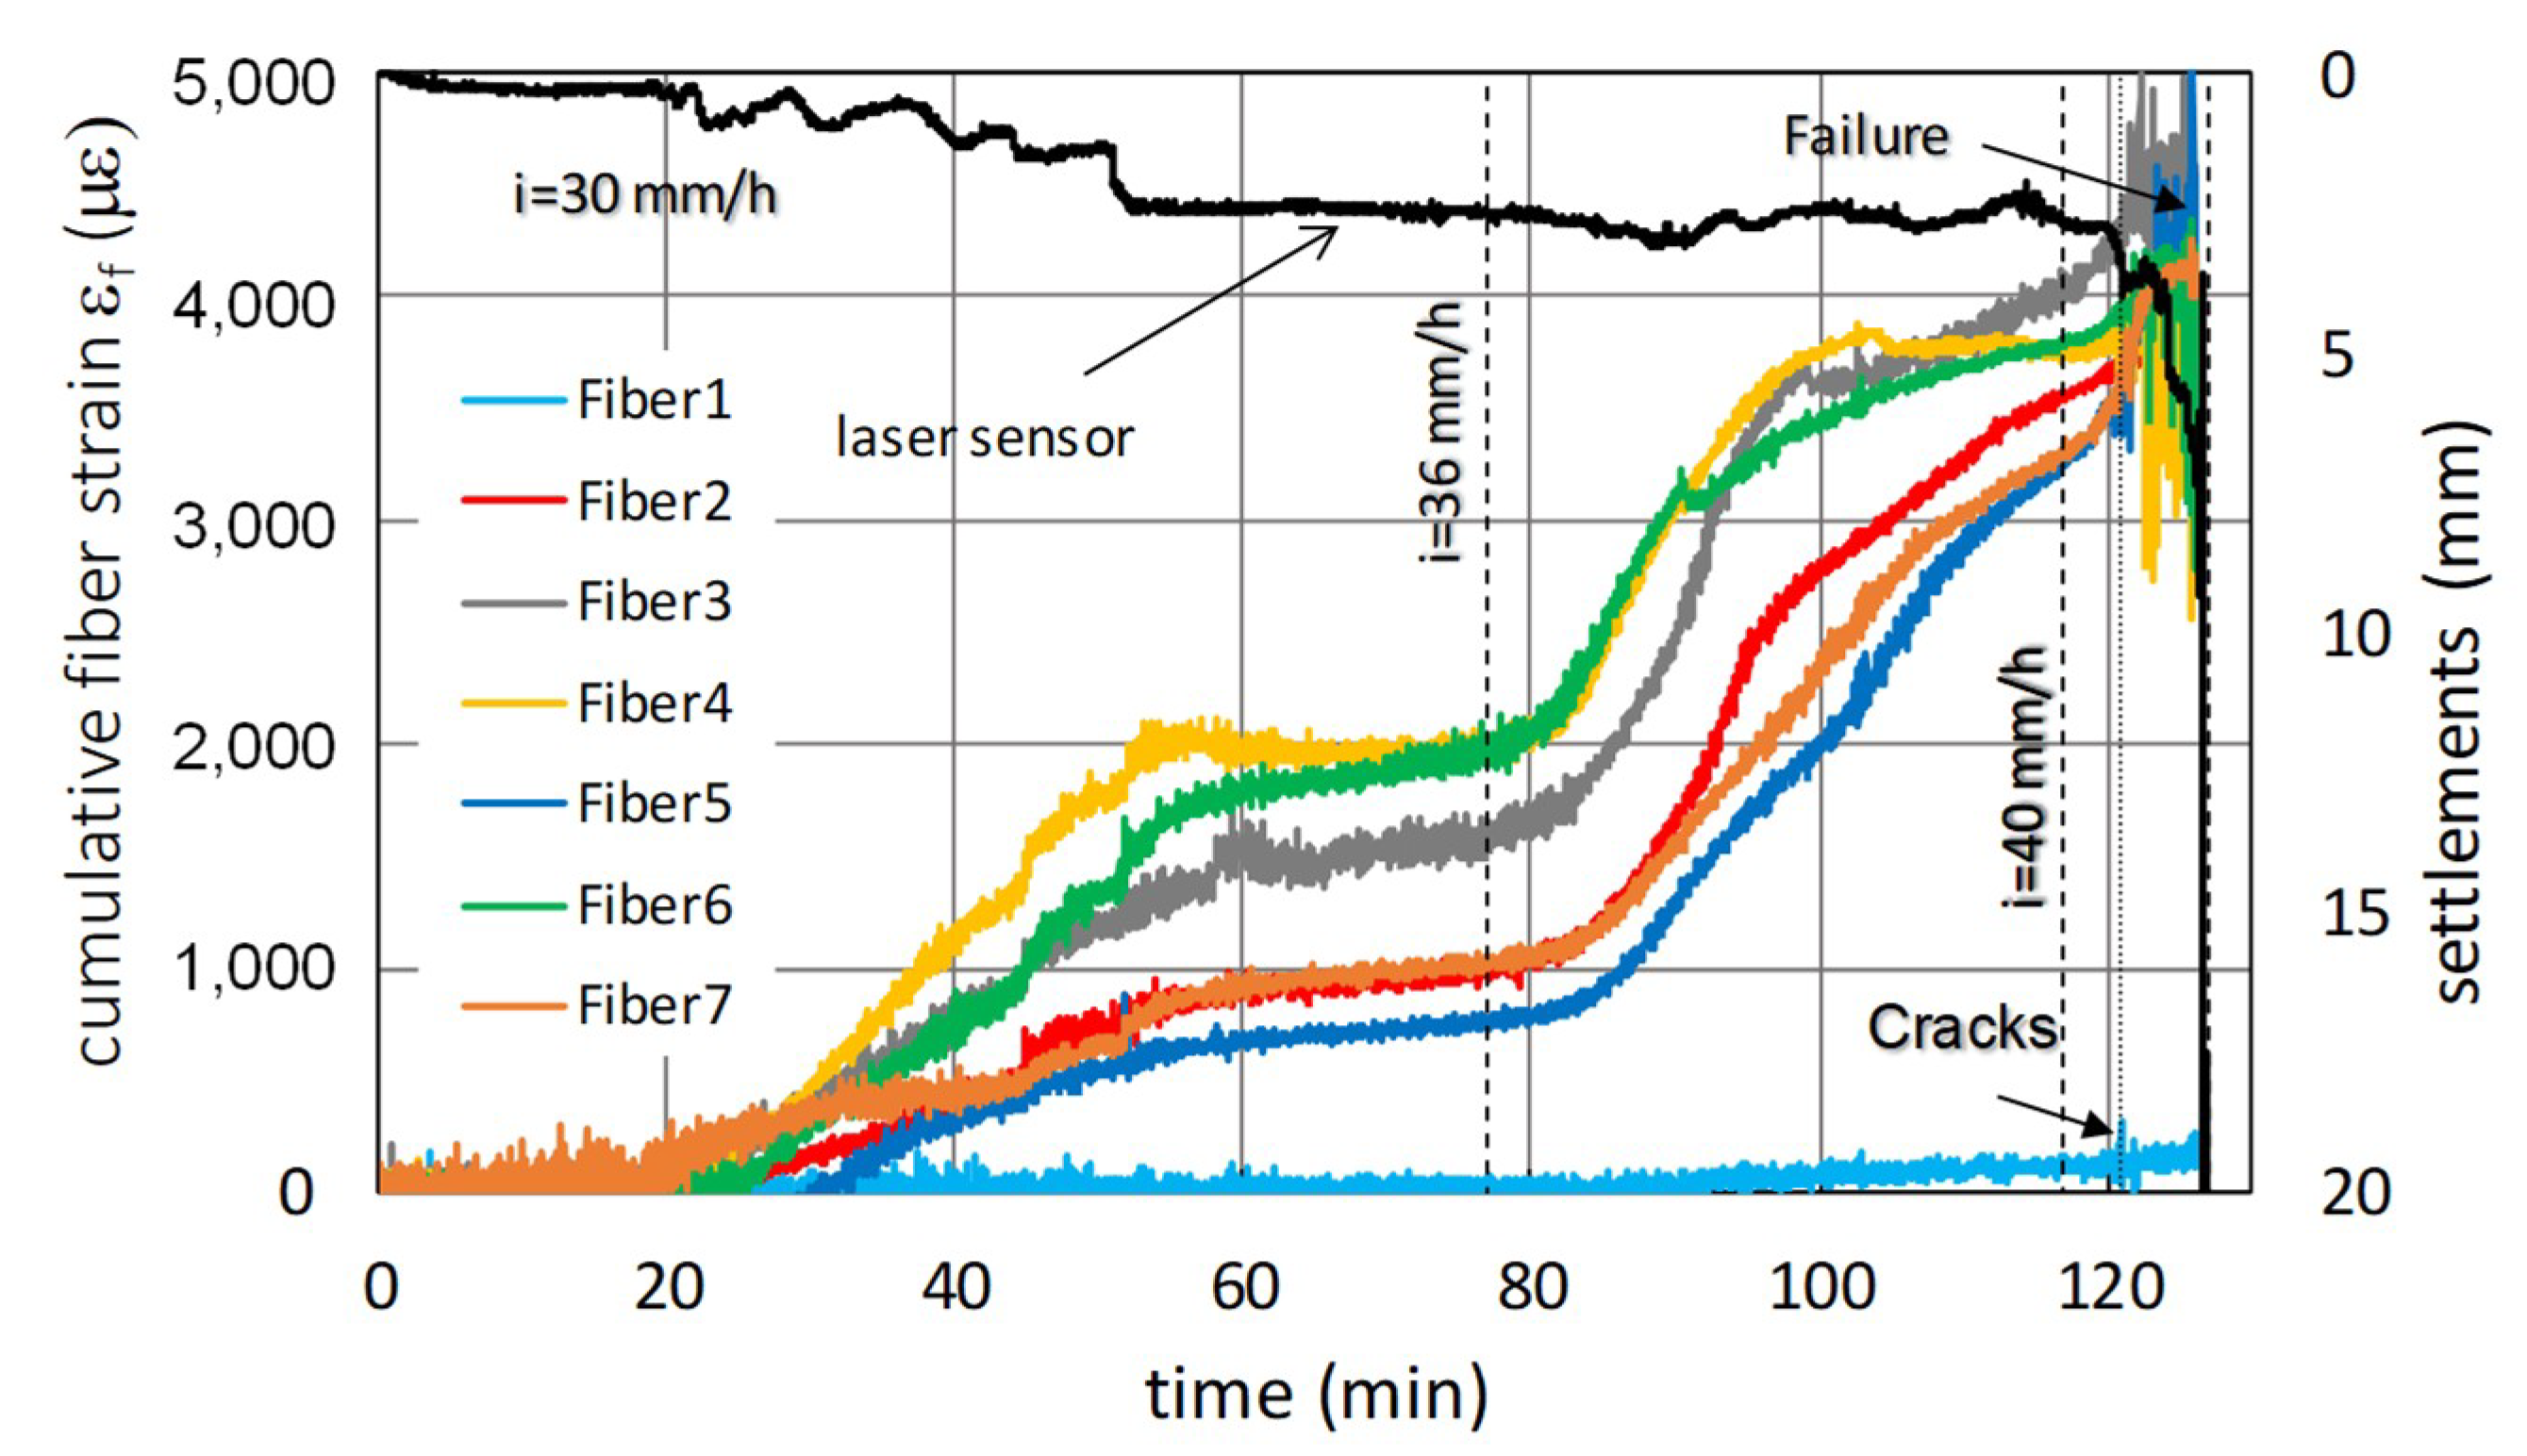
Strain records by seven transversal optical fiber strands using the high temporal-resolution BOTDA analysis (Figure 1c and Figure 2b) are shown in Figure 12. The dashed lines reported in Figure 11a indicate the position of five of them; the other two strands, which are located upslope, are not framed in the image. In this case the readings by the transversal fibers cannot provide the longitudinal strain profile, but can be used to recognize the time at which any instrumented section is experiencing first movements and to provide a qualitative evolution of local effects. With the exception of the strand number 1 (OF1 in Figure 1c and Figure 12a), which is located very close to the constrained toe of the slope, the other ones indicate the temporal sequence of straining. As shown in Figure 11, the mechanism of progressive failure develops in the first 25 min. Unfortunately, in such a time interval measured strains are too small, even though first movements seem to be captured by the fiber strand 7. In the following 35 minutes the strain rate decreases, as indicated by the progressive decay of the slope of the fiber strain trends. In particular, the decrease is faster upslope (Figure 12), as also shown by data provided by the PIV technique (Figure 11). The stop of movement captured by PIV in the time interval comprised between 60 and 80 min is also recorded by the fibers, which show a practically constant strain. The last stage, leading to a block-type slope failure, is captured by the fibers which show a uniform increase of strain.
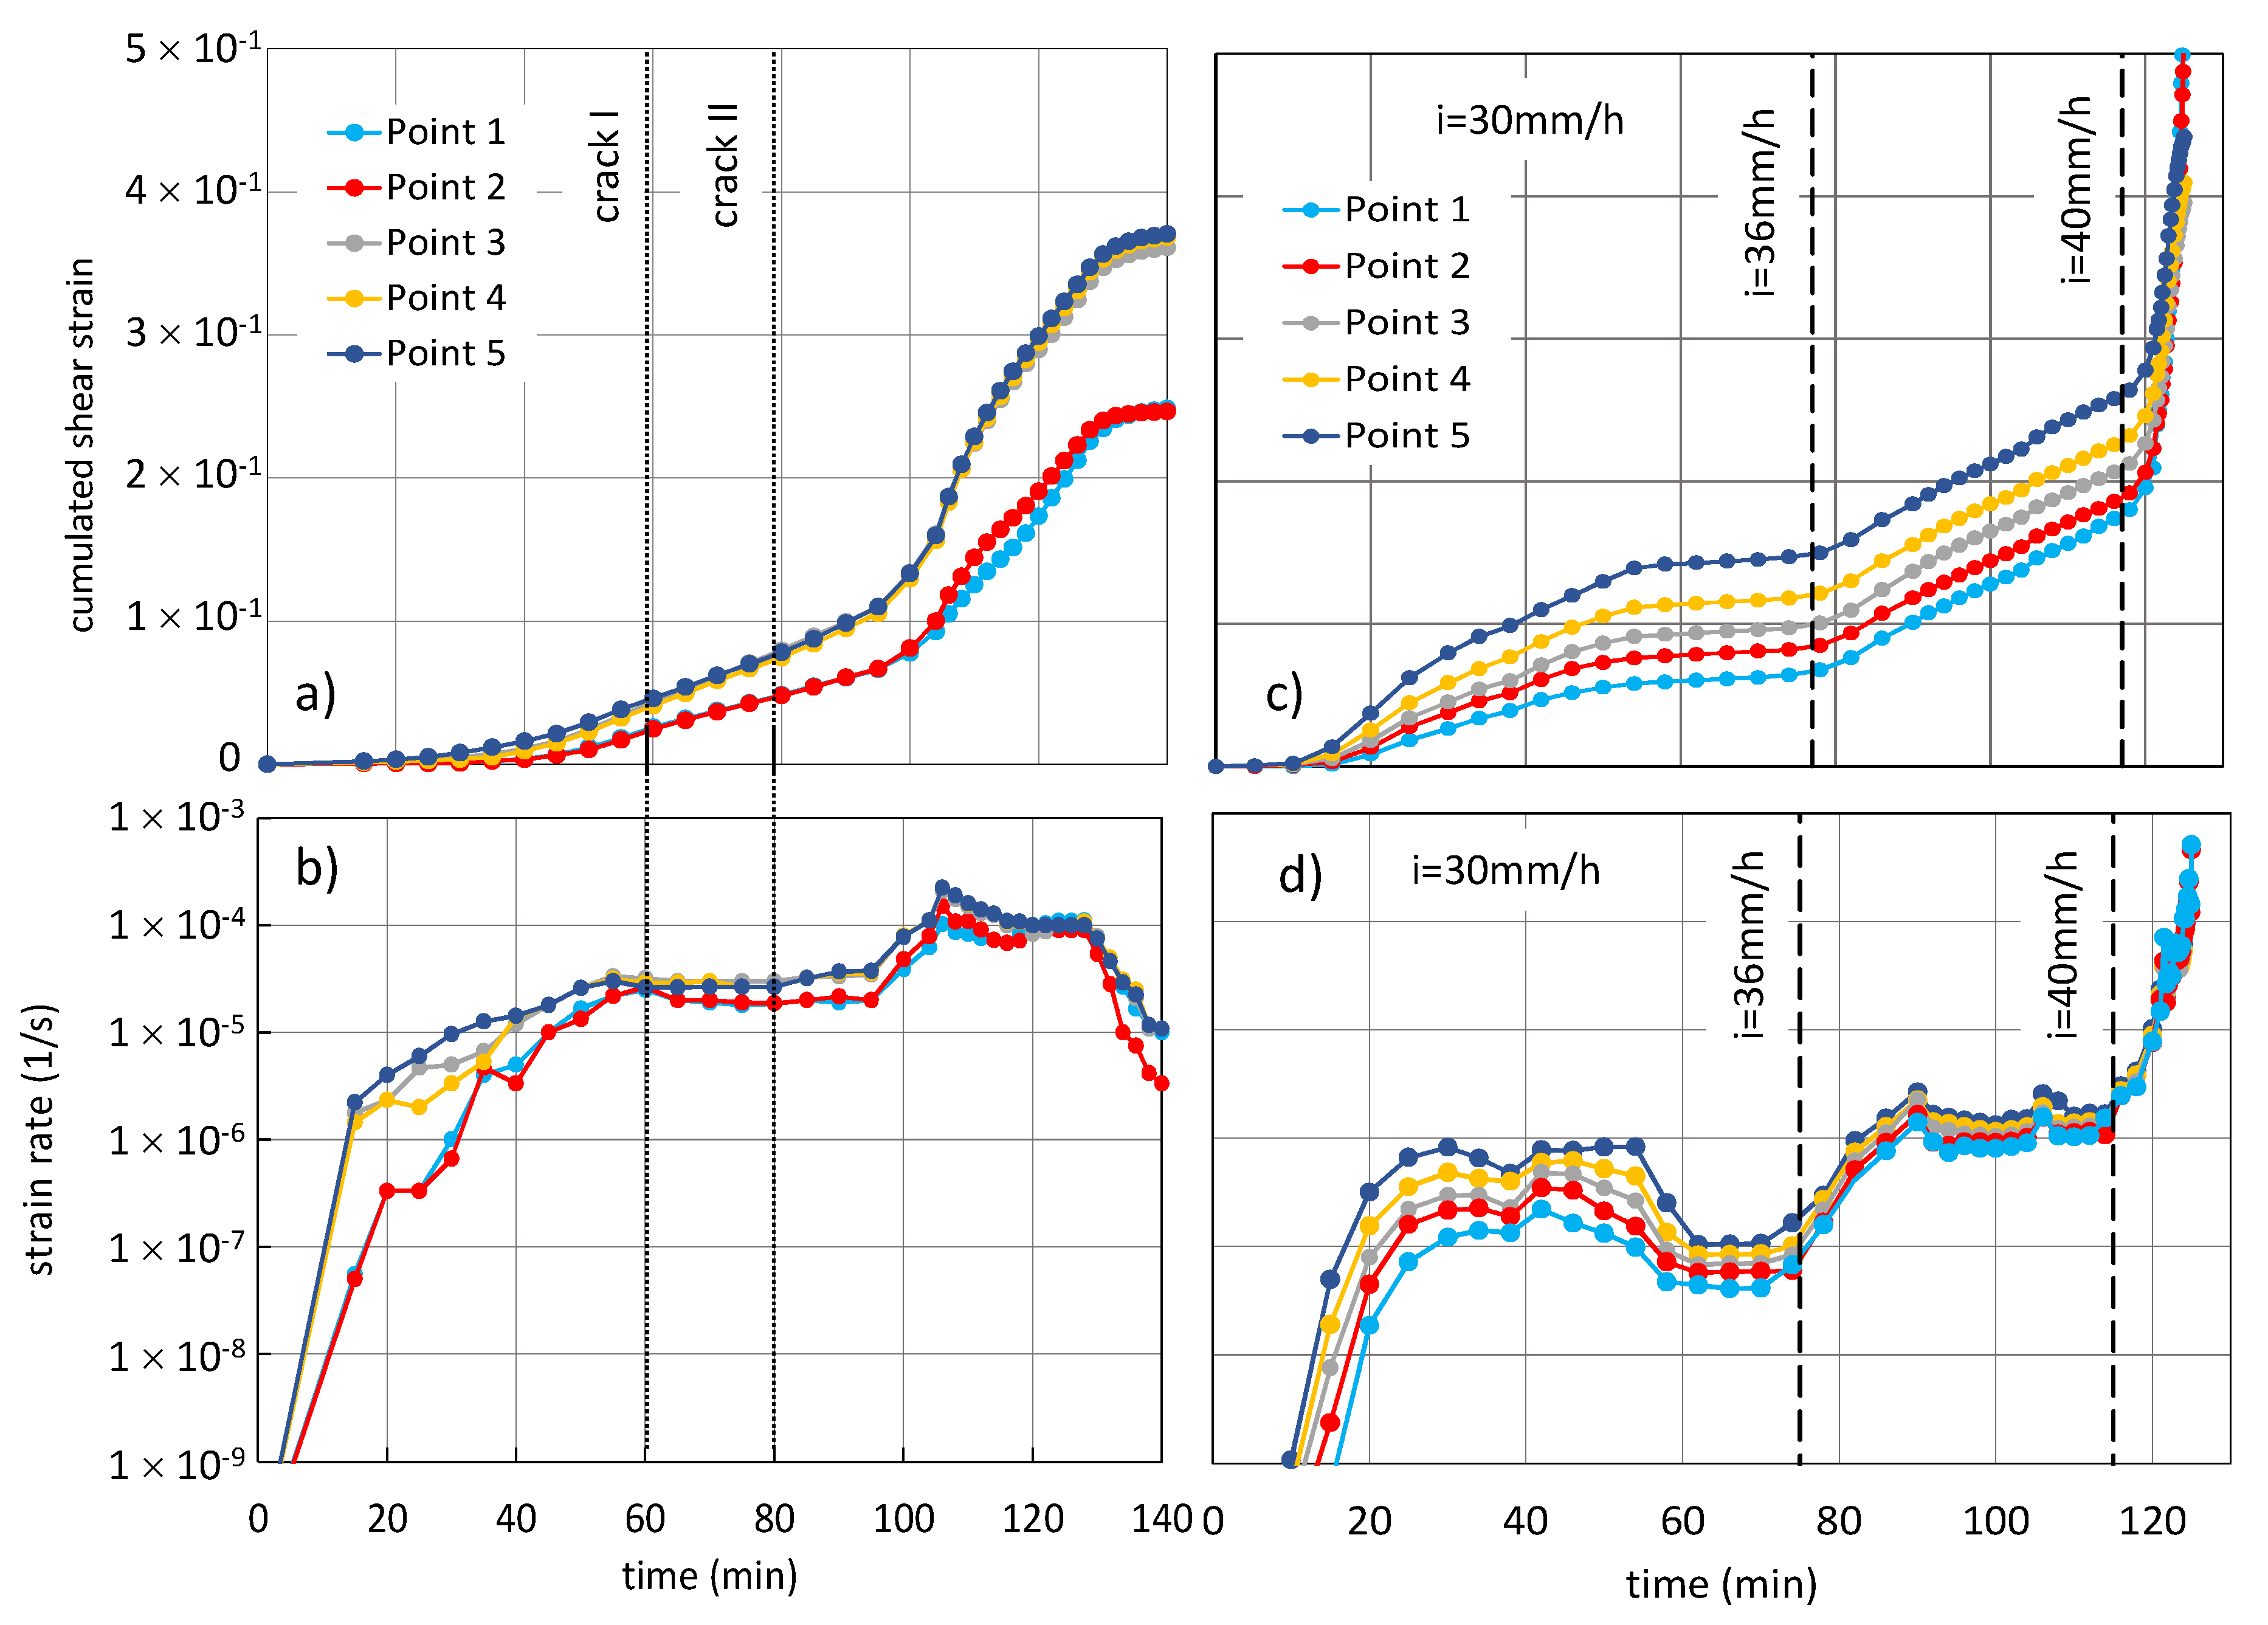
A synthesis of all experimental results is shown in Figure 13, which reports the cumulated shear strains and strain rates during the two experiments. The shear strains have been roughly calculated based on the value of the downslope superficial displacement as measured through digital images, by assuming a linear downward displacement profile characterized by null displacement at the layer bottom. The figure highlights:
-
The progressive downslope movement, with points 4 and 5 moving first and more than the others;
-
The shear strain acceleration, which more or less takes place when the rainwater reaches the base of the layer (RP2 experiment, Figure 5);
-
The ductile soil behavior, which attains a cumulated shear strain of 3.5 × 10⁻¹ and a strain rate of roughly 10−4 s−1 in the upper zone (RP2 experiment, Figure 13a,b).
The increase in rain intensity from 30 to 36 mm/h (experiment RP3) can eventually lead to soil saturation from the bottom and generation of positive pore pressures, which gradually increase, thus suggesting the establishment of drained conditions (Figure 10); while the shear strains accumulate and the mass moves quite uniformly, still displaying a ductile behavior. A change in the slope response occurs only as the rainfall intensity growths to 40 mm/h. In fact, in about 10 min, the shear strain jumps from about 10−6 s−1 to almost 10−3 s−1 (Figure 13c,d), which seems to indicate the transition from a ductile to a brittle behavior, and the slope fails suddenly, in such a way that it reminds to the effects of wetting shown in Figure 4. This seems to indicate the establishment of undrained conditions, which is confirmed by the very rapid, and very clear, increase in pore pressure at transducer uw1 shown in Figure 10.

4. Conclusions

Usually slope failure in unsaturated granular soils is triggered by extreme precipitations and is sudden and very rapid; moreover, there is no reason we cannot believe it is progressive. However, a review of the literature shows that a complete framework on the subject is still lacking. A major reason is the difficulty in developing efficient systems for field monitoring. A step towards a complete knowledge of the slope behavior can be pursued through small-scale physical modeling supported by an adequate monitoring system. To this aim, this paper has provided some preliminary data obtained by two laboratory experiments on steep model slopes, made with unsaturated pyroclastic soils, which have been subjected to artificial rainfall. In order to favor the development of progressive failure, the upper part of the slope had a higher angle than the lower part.
The experiments show that the slope deformation mechanism is characterized by soil “softening” due to suction decrease and by a progressive downslope deformation process. However, in the examined case, only full saturation of the deepest zone of the soil layer can lead to slope collapse, which has been characterized by a likely undrained instability mechanism.
The obtained data represent a first step for further in-depth investigations and analyses of this phenomenon.

Author Contributions

R.D., E.D., L.O., and L.P. contributed to the development of the research idea and to the design and writing of the paper, which was commented on and edited by all the others; A.M. carried out the optical fibers measurements and wrote Section 2.2; R.D., E.D., and L.O. carried out the flume experiments.

Funding

The research has been developed with the support of the project PRIN 2015 ‘‘Innovative monitoring and design strategies for sustainable landslide risk mitigation”, N° 201572YTLA, funded by the Italian Ministry of Education, University, and Research.

Acknowledgments

The authors acknowledge the anonymous reviewers for their useful comments and suggestions.

Conflicts of Interest

The authors declare no conflicts of interest.

References

  1. Bjerrum, L. Progressive failure in slopes in overconsolidated plastic clay and shales. ASCE J. Soil Mech. Found. Div. 1967, 93, 139–190. [Google Scholar]
  2. Leroueil, S.; Locat, A.; Eberhardt, E.; Kovacevic, N. Progressive Failure in Natural and Engineered Slopes. In Proceedings of the 11th International Symposium on Landslides, Banff, AB, Canada, 3–8 June 2012; CRC press: Banff, AB, Canada, 2012; Volume 1, pp. 31–46. [Google Scholar]
  3. Burland, J.B.; Longworth, T.I.; Moore, J.F.A. A study of ground movement and progressive failure caused by a deep excavation in Oxford clay. Géotechnique 1977, 27, 557–591. [Google Scholar] [CrossRef]
  4. Cooper, M.R.; Bromhead, E.N.; Petley, D.J.; Grant, D.I. The Selborne cutting stability experiment. Géotechnique 1998, 48, 83–101. [Google Scholar] [CrossRef]
  5. Alonso, E.E.; Gens, A. Aznalcóllar dam failure. Part 1: Field observations and material properties. Géotechnique 2006, 56, 165–183. [Google Scholar] [Green Version]
  6. Urciuoli, G.; Picarelli, L.; Leroueil, S. Local soil failure before general slope failure. Geotech. Geol. Eng. 2007, 25, 103–122. [Google Scholar] [CrossRef]
  7. Yerro, A.; Alonso, E.E.; Pinyol, N.M. Modeling large deformation problems in unsaturated soils. In Proceedings of the 3rd European Conference on Unsaturated Soils, Frontiers on Unsaturated Soils, Paris, France, 12–14 September 2016. [Google Scholar]
  8. Cascini, L.; Guida, D.; Nocera, N.; Romanzi, G.; Sorbino, G. A Preliminary Model for the Landslides of May 1998 in Campania Region. In Proceedings of the Second International Symposium on Hard Soils–Soft Rocks, Naples, Italy, 12–14 October 1998; Evangelista, A., Picarelli, L., Eds.; Balkema: Naples, Italy, 2000; Volume 3, pp. 1623–1649. [Google Scholar]
  9. Fiorillo, F.; Guadagno, F.M.; Aquino, S.; De Blasio, S. The December 1999 Cervinara landslides: Further debris flows in the pyroclastic deposits of Campania (southern Italy). Bull. Eng. Geol. Environ. 2001, 60, 171–184. [Google Scholar] [CrossRef]
  10. Olivares, L.; Damiano, E. Post-failure mechanics of landslides: A laboratory investigation of flowslides in pyroclastic soils. ASCE J. Geotech. Geoenviron. Eng. 2007, 133, 51–62. [Google Scholar] [CrossRef]
  11. Zhu, Z.-W.; Liu, D.-Y.; Yuan, Q.-Y.; Liu, B.; Liu, J.-C. A novel distributed optic fiber transducer for landslides monitoring. Opt. Lasers Eng. 2011, 49, 1019–1024. [Google Scholar] [CrossRef]
  12. Schenato, L. A review of distributed fibre optic sensors for geo-hydrological applications. Appl. Sci. 2017, 7, 896. [Google Scholar] [CrossRef]
  13. Coscetta, A.; Minardo, A.; Olivares, L.; Mirabile, M.; Longo, M.; Damiano, M.; Zeni, L. Wind turbine blade monitoring with brillouin-based Fiber-Optic Sensors. J. Sens. 2017, 9175342. [Google Scholar] [CrossRef]
  14. Damiano, E.; Mercogliano, P.; Netti, N.; Olivares, L. A “simulation chain” to define a multidisciplinary Decision Support System for landslide risk management in pyroclastic soils. Nat. Hazards Earth Syst. Sci. 2012, 12, 989–1008. [Google Scholar] [CrossRef]
  15. Intrieri, E.; Gigli, G.; Mugnai, F.; Fanti, R.; Casagli, N. Design and implementation of a landslide early warning system. Eng. Geol. 2012, 147, 124–136. [Google Scholar] [CrossRef] [Green Version]
  16. Olivares, L.; Damiano, E.; Mercogliano, P.; Picarelli, L.; Netti, N.; Schiano, P.; Savastano, V.; Cotroneo, F.; Manzi, M. A simulation chain for early prediction of rainfall-induced landslides. Landslides 2014, 11, 765–777. [Google Scholar] [CrossRef]
  17. Olivares, L.; Damiano, E.; Greco, R.; Zeni, L.; Picarelli, L.; Minardo, A.; Guida, A.; Bernini, R. An instrumented flume to investigate the mechanics of rainfall-induced landslides in unsaturated granular soils. Geotech. Test. J. 2009, 32, 108–118. [Google Scholar]
  18. Damiano, E.; Avolio, B.; Minardo, A.; Olivares, L.; Picarelli, L.; Zeni, L. A laboratory study on the use of optical fibers for early detection of pre-failure slope movements in shallow granular soil deposits. Geotech. Test. J. 2017, 40, 529–541. [Google Scholar] [CrossRef]
  19. Damiano, E.; Olivares, L.; Picarelli, L. Steep-slope monitoring in unsaturated pyroclastic soils. Eng. Geol. 2012, 137, 1–12. [Google Scholar] [CrossRef]
  20. Olivares, L.; Picarelli, L. Shallow flowslides triggered by intense rainfalls on natural slopes covered by loose unsaturated pyroclastic soils. Géotechnique 2003, 53, 283–288. [Google Scholar] [CrossRef]
  21. Hunter, G.; Fell, R. Mechanics of failure of soil slopes leading to “rapid” failure. In Proceedings of the International Conference on Fast Slope Movements: Prediction and Prevention for Risk Mitigation, Napoli, Italy, 11–13 May 2003; pp. 283–290. [Google Scholar]
  22. Damiano, E.; Greco, R.; Guida, A.; Olivares, L.; Picarelli, L. Investigation on rainfall infiltration into layered shallow covers in pyroclastic soils and its effect on slope stability. Eng. Geol. 2017, 220, 208–218. [Google Scholar] [CrossRef]
  23. Tatsuoka, F. Compaction Characteristics and Physical Properties of Compacted Soils Controlled by the Degree of Saturation. In Proceedings of the Sixth International Symposium on Deformation Characteristics of Geomaterials. IS-Buenos Aires, Buenos Aires, Argentina, 15–18 November 2015. [Google Scholar]
  24. Scarcella, G.E.; Giusti, I.; Giusti, S.; Lo Presti, D.C.; Squeglia, N. Strength and Permeability Parameters of Compacted, Partially Saturated Silty and Sandy Soils. Riv. Ital. Geotec. 2018, 2, 58–69. [Google Scholar]
  25. Damiano, E.; Olivares, L. The role of infiltration processes in steep slopes stability of pyroclastic granular soils: laboratory and numerical investigation. Nat. Hazards 2010, 52, 329–350. [Google Scholar] [CrossRef]
  26. Picarelli, L.; Evangelista, A.; Rolandi, G.; Paone, A.; Nicotera, M.V.; Olivares, L.; Scotto di Santolo, A.; Lampitiello, S.; Rolandi, M. Mechanical Properties of Pyroclastic Soils in Campania Region. In Proceedings of the 2nd International Workshop on Characterisation and Engineering Properties of Natural Soils, Singapore, 29 November–1 December 2006; Volume 4, pp. 2331–2384. [Google Scholar]
  27. Olivares, L.; Picarelli, L. Modelling of flowslides behaviour for risk mitigation. In Proceedings of the 6th ICPMG ’06, International Conference on Physical Modelling in Geotechnics, Ng, Hong Kong, China, 2–4 August 2006; Volume 1, pp. 99–113. [Google Scholar]
  28. Olivares, L. Static liquefaction: An hypothesis for explaining transition from slide to flow in pyroclastic soils. In Proceedings of the Conference TC-11 ISSMGE Transition from Slide to Flow: Mechanisms and Remedial Measure, Trabzon, Turkey, 25–26 August 2001. [Google Scholar]
  29. Olivares, L.; Damiano, E.; Netti, N.; De Cristofaro, M. Geotechnical Properties of Two Pyroclastic Deposits Involved in Catastrophic Flowslides for Implementation in Early Warning Systems. Geosciences 2019, 9, 24. [Google Scholar] [CrossRef]
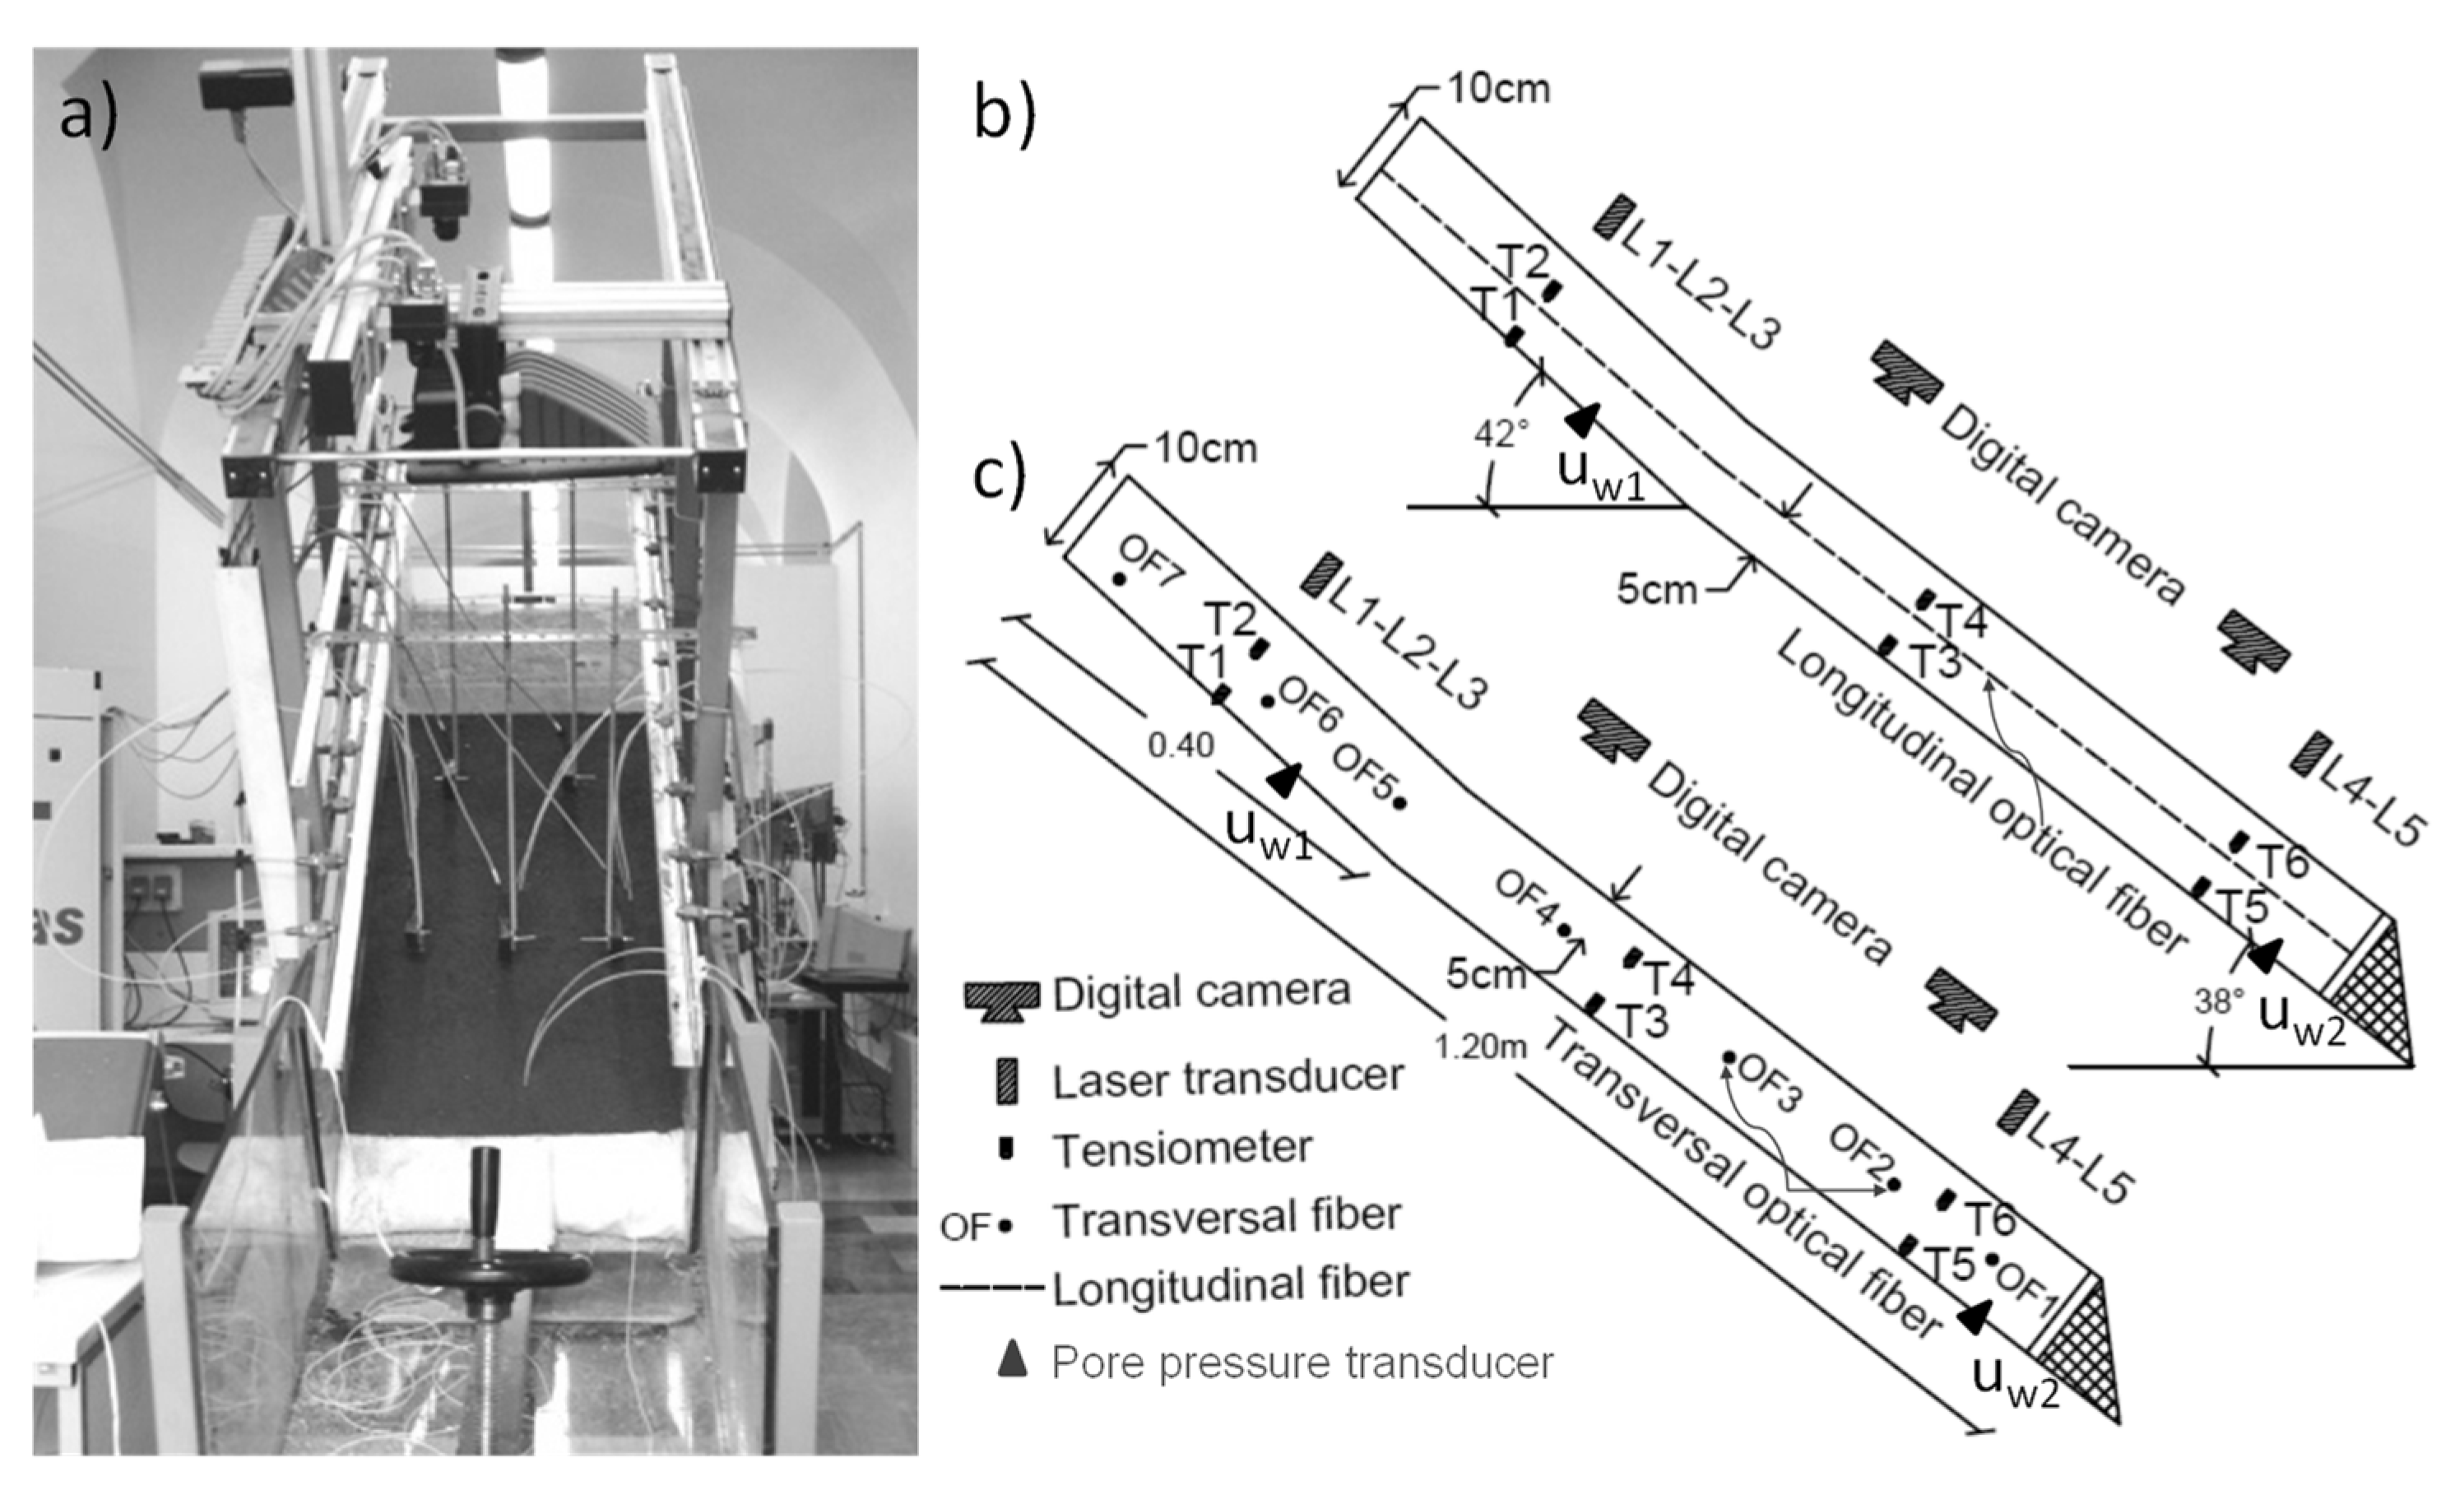
Figure 1. The flume (a) and schematic cross sections of the model slopes, with location of the sensors during the RP2 (b) and RP3 (c) experiments.
Geosciences 09 00063 g001
Figure 2. Fiber installation in experiments RP2 (a) and RP3 (b).
Geosciences 09 00063 g002
Figure 3. Grain size distribution of the Cervinara ash and range of soils which are susceptible to liquefaction.
Geosciences 09 00063 g003
Figure 4. Results of a wetting test characterized by an initial suction of 82 kPa in terms of: (a) axial, radial, volumetric strains, and degree of saturation evolution; (b) deviatoric strain rate evolution.
Geosciences 09 00063 g004
Figure 5. RP2 experiment: Suction and settlement evolution.
Geosciences 09 00063 g005
Figure 6. Particle Image Velocimetry (PIV) data: (a) Slope surface and section A–A′; (b) displacement rate at five points along section A–A′.
Geosciences 09 00063 g006
Figure 7. Evolution of fiber strain at six different points.
Geosciences 09 00063 g007
Figure 8. (a) Strain field retrieved 80 min after rainfall initiation; (b) longitudinal strain profiles at 80, 110, and 140 min after the beginning of the experiment.
Geosciences 09 00063 g008
Figure 9. Suction and settlements measured in the RP3 experiment.
Geosciences 09 00063 g009
Figure 10. Pore pressures and settlements during test RP3 (a) and an enlargement of pore pressure measurements at failure (b).
Geosciences 09 00063 g010
Figure 11. PIV data: (a) ground surface and monitored points; (b) displacement rate.
Geosciences 09 00063 g011
Figure 12. Cumulated strain evolution measured by the seven transversal optical fibers.
Geosciences 09 00063 g012
Figure 13. Cumulated shear strains (a,c) and strain rates (b,d) in the experiments RP2 (a,b) and RP3 (c,d).
Geosciences 09 00063 g013
Table 1. Initial soil conditions and slope and rainfall characteristics.
Test.Slope Length (m)Slope Width (m)Slope Thickness (m)Slope Angle (°)w (%)n (%)Sr (%)i (mm/h)Δt (min)
RP21.20.500.1038–4240–437241–4330158
RP31.20.500.1038–4239–427044–4730–36–40126
(w) water content; (n) porosity; (Sr) degree of saturation; (i) rainfall intensity; (Δt) duration of rainfall.