1. Introduction
The present-day market requirements address application development in the cases of inventories and reverse engineering. Attention is paid to autonomous, fast, and accurate measurements covering a broad goal domain, e.g., the human body studies [
1,
2], coastal monitoring [
3,
4,
5], or civil engineering [
6,
7,
8]. The measurements involving a single technique only may lead to unacceptable results in terms of complex services in variable conditions (e.g., various weather conditions). Moreover, limitation to a single method may yield lower accuracy or neglect an entire spatial information in the course of data acquisition. Let us revise the case of a building inventory with the use of a laser scanner. The building side walls will be reproduced in contrast to a roof [
9]. In order to solve this problem, it is reasonable to use another measurement method to collect spatial information on the object (e.g., with the additional use of aerial photos from the aircraft or UAV (Unmanned Aerial Vehicle)) [
10,
11]. Generally speaking, as stated in Reference [
12], no single modelling technique meets all requirements of high geometric accuracy, portability, full automation, photo-realism, and low cost as well as flexibility and efficiency.
The article addresses the ship hull as-build modelling and reverse engineering of a submarine by means of photogrammetry and terrestrial laser scanning. A hull manufacturing precision regarding the 3D model and the real manufactured object may be assessed by random measurement of a ship hull element. It is worth mentioning that, due to the final results, a single technique does not deliver a full range of data to cover the modelled object. In the presented case, each 3D measurement technique was affected by its typical problems. However, each case was a distinct one. Hence, we proposed to aggregate the methods of close range photogrammetry and terrestrial laser scanning to obtain spatial information about the submarine with high precision and accuracy, which reduces the disadvantages of both approaches.
The ICP (Iterative Closest Points) algorithm was employed to connect scan positions originating from an active sensor in the form of a laser scanner. It is one of the most popular algorithms used to connect two sets of data, which iteratively matches the transformation by means of the matching points and minimization of the error. The algorithm has been widely presented in the literature. The initial variant of the algorithm was presented in Reference [
13]. However, the methods have been relevantly shown and compared in Reference [
14]. Based on this reference, the ICP algorithm may be insufficient in either the cases of large distance, rotation, or coverage between datasets. The simplest solution is to initially establish the sets indicating the corresponding points in both sets, and to apply the ICP algorithm. In some cases, despite a correct reference, the algorithm is unable to find adequate coverage. Such a situation makes the solutions in the articles suitable for use [
15,
16].
In order to recover a complete and accurate 3D model from the images, the state-of-the-art commercial software (Bentley Context Capture) was employed. The photogrammetry process of the presented case includes geodetic control point measurements, image data acquisition, and data processing. In the course of data processing, the phase camera was calibrated by means of the Bentley’s Company intrinsic camera parameters. Next, automatic tie points were detected, an additional manual user defined the tie points, and the bundle adjustment was carried out. Those operations led to conducting additional camera autocalibration and the computation of the camera exterior orientation parameters. Lastly, coordinates of the image-based 3D object point coordinates were stated (dense point cloud). Subsequently, mesh and texture generation was carried out.
The marine industry successfully applies photogrammetric and laser scanning techniques for as-build modelling and quality check. An interesting combination of laser scanning and close range photogrammetry is proposed in Reference [
17]. The research is based on laboratory models, which do not incorporate real objects and only real hulls. In this case, the photogrammetric technique is applied for control points measurements, not performing a 3D point cloud hull modelling.
The photogrammetric technique is applied in the research [
18]. In this case, the authors implemented a single measurement technique and the laboratory model cased showed the same results. This approach distinguishes the signalized targets to measure. The results showed noticeable differences between the predicted and the real data. The main differences provided a need to use more retro reflective targets with more illumination in the survey location instead of using a camera flash. The study is a step forward in the ship and boat survey using the close-range photogrammetry method. In this research [
18], combined laser scanning and multi-image photogrammetry measurements have been employed to document a wooden ancient shipwreck. During the survey, the 3D data have been integrated and compared after the excavation of the ship wreck. Additionally, a documentation including a virtual three-dimensional model was created from the point clouds, and a texture was applied herein. In this approach, two distinct point clouds have been integrated to provide the model of the ancient shipwreck.
An innovative work is presented in Reference [
19]. The authors combine above and under water photogrammetry for ship hull modelling. The paper provides an innovative procedure for the alignment of two photogrammetric models, deriving from two separate and independent photogrammetric surveys above and below the water level. It also shows a possibility to model and control ship hulls without docking. Similar studies involving an underwater photogrammetry experiment were shown on the example of the Costa Concordia wreck, where the worldwide shock catastrophe includes fatalities [
20].
The research [
21] suggested photogrammetry as a suitable method for coordinate measurement of decks in recreational ships. The research involves the photogrammetry modelling process, noting that, in the cases of wide corridors for the ships, with few obstacles, the direct method is relevant, when compared to the photogrammetric method. The maritime and shipyard industries clearly demand the new 3D modelling technique for the construction process control of ships, control during operation, and model deformation in the rebuilding process. The research [
21] shows that, in selected cases, the photogrammetry technique is sufficient for ship modelling, which sometimes needs additional, supportive measurements.
A number of researchers [
22] uses photogrammetric techniques to support reengineering of ship hulls and ship parts. This research discusses market demand for measurement and modelling of a variety of objects encountered in shipbuilding and repair businesses. This addresses partial or complete ship hulls to planar (2D) structural parts. The research was focused on evaluation of laser scanning and photogrammetry. To summarize, laser scanning is a powerful tool due to its high resolution, while photogrammetry is bound to recognize specific parts and features of the object, and photogrammetry was chosen as a preferred measurement method. The research clearly shows that both techniques are complementary 3D measurement techniques for ship hull modelling. Thus, in order to provide comprehensive results, these are intended to act simultaneously. The measurement methods [
23] used in ship hull inventory are covered in Reference [
24], but there are still problems to integrate the data from various sensors in the light of proper use and interpretation. Such procedures are aimed at the entire spatial information of the measured object.
2. Materials and Methods
The submarine hull was modelled with the help of close-range photogrammetry and terrestrial laser scanning techniques. The research object is a decommissioned Polish Navy Ship Jastrzab (PNS Jastrzab), ex-HNoMS “Kobben” (S-318) (presented in
Figure 1). The submarine represents the Kobben class (also known as Type 207), which is a customized version of the German Type 205 submarine. Fifteen vessels of this class were built for the Royal Norwegian Navy in the 1960s. Later on, the class has been withdrawn from service in the Norwegian and Danish Navy. Some of them was transferred to Poland and The Polish Navy still operates Kobben-class submarines. The PNS Jastrzab submarine was commissioned on 15, August 1964, which was transferred to Poland in 2002 for spare parts on 17, December 2011, which moved to the Polish Naval Academy in Gdynia as a base for the crew training laboratory.
The presented ship hull is a challenging object due to remote sensing modelling techniques. Thus, it was intentionally chosen to stress the applied modelling methods and to highlight their pros and cons. The hull is painted with black paint, which highly absorbs the laser light beam. In addition, a rainy measurement day was chosen in order to point out the methods greater and to simulate real industrial measurement environment, where the freshly docked hulls are wet. The absence of texture and tie points makes this object hard to model by means of photogrammetric methods. In the case of object measurement, the hull was wet and it triggered an additional measurement demand for the sensors. Highly demanding object size, shape, and surface, complemented by challenges faced during the research, made a clear explicit display of the presented techniques in highly unfavorable conditions due to sensors and algorithms. The measurement conditions were prescribed in order to simulate and consequently assess the efficiency and accuracy of the applied sensors. The accuracy of sensors in unfavorable measurement conditions was assessed separately in the case of each applied technique. In order to eliminate the weakness of each separate technique with regard to the final object, multiple spatial data combining techniques were applied in the post processing phase of the research. The diagram (
Figure 2) shows the sequence of activities leading to the 3D model of the hull. First of all, the measurements were made using a laser scanner (in order to detect the edge and shape of the hull) and the cloud of points obtained from the photographs. After combining, the photograph based data was supposed to fill the spaces between the edges, registered by the laser scanner impulse. The object modelling means fitting the shape of the hull to the obtained point cloud. In connection with market expectations and previously conducted tests described in the introduction, accuracy analysis of the model was made, assuming a boundary value equal to 1 cm.
2.1. Photogrammetry
The photogrammetry technique encompasses methods of image measurement and interpretation in order to derive the shape and location of an object based on a single number up to several photographs. The photogrammetric methods can be applied in the case the object can be photographically recorded. The purpose of the photogrammetric measurement is the three-dimensional reconstruction in digital or graphical form [
23]. The measurements (photos of the modelled object) and a mathematical transformation between the image and the object space have the means to model the object. The presented case showed a structure from motion (SfM) applied for hull modelling (
Figure 3a). A structure from motion is the process of estimating a 3-D structure of a scene from a set of 2-D images. In the considered case, the image series was taken by means of a single calibrated Digital Single Lens Reflex Camera (DSLR). The initial camera calibration parameters compared with the optimized ones are shown in
Table 1. The initial calibration parameters were taken from Bentley’s database. Further on, these values were optimized in the autocalibration process.
The 3-D structure and camera exterior orientation parameters were only recovered up to the scale, i.e., observing the structure and the magnitude of the camera motion in some units, which do not correspond to the world dimensions. In order to compute the actual scale of the structure of modelled objects and the camera motion in world units, additional information is required, e.g., the object size in the scene or distance between some known points (constrains). The object true size can be computed while the camera Exterior Orientation Parameters (EOP) are acquired by other means. This process is referred to as direct georeferencing. In traditional photogrammetry, the EOP are derived from Aerial Triangulation (AT), where the Control Points (CP) are required. Generally speaking, when the camera is able to record EOP directly from a navigation and orientation system, GCP (Ground Control Points) are not required to compute the object scale. In the presented case, in order to achieve real-world units and dimensions, photogrammetric control points are introduced to the modelled object and measured by traditional high accuracy geodetic techniques incorporating tachymeter (
Figure 3b). All control points are applied in order to align the model scale and to determine its real dimensions.
The object has been modelled by means of 159 photos, acquired by Canon EOS 550D (Canon Inc., Tokyo, Japan), with the image dimensions of 5184 × 3456 pixels recorded in the JPEG format. In the data acquisition process, more than 600 photos have been taken according to the presented object size. The dark color of the object, and highly light absorbing paint with a relatively vivid background made the acquisition a high demand. The photos rejected from the final calculation were either too dark or overexposed top parts of the hull. In that case, the surplus images acquired allowed us to select the ones with correct exposition. On the incorrectly exposed photos, the algorithm are not able to detect a sufficient number of automatic tie points. The overall number of tie points detected in the object is 15314 (
Figure 3a), with a median number of 330 points per photo and with the median 0.44 pixels reprojection error. The median number of photos per point was equal to 4.
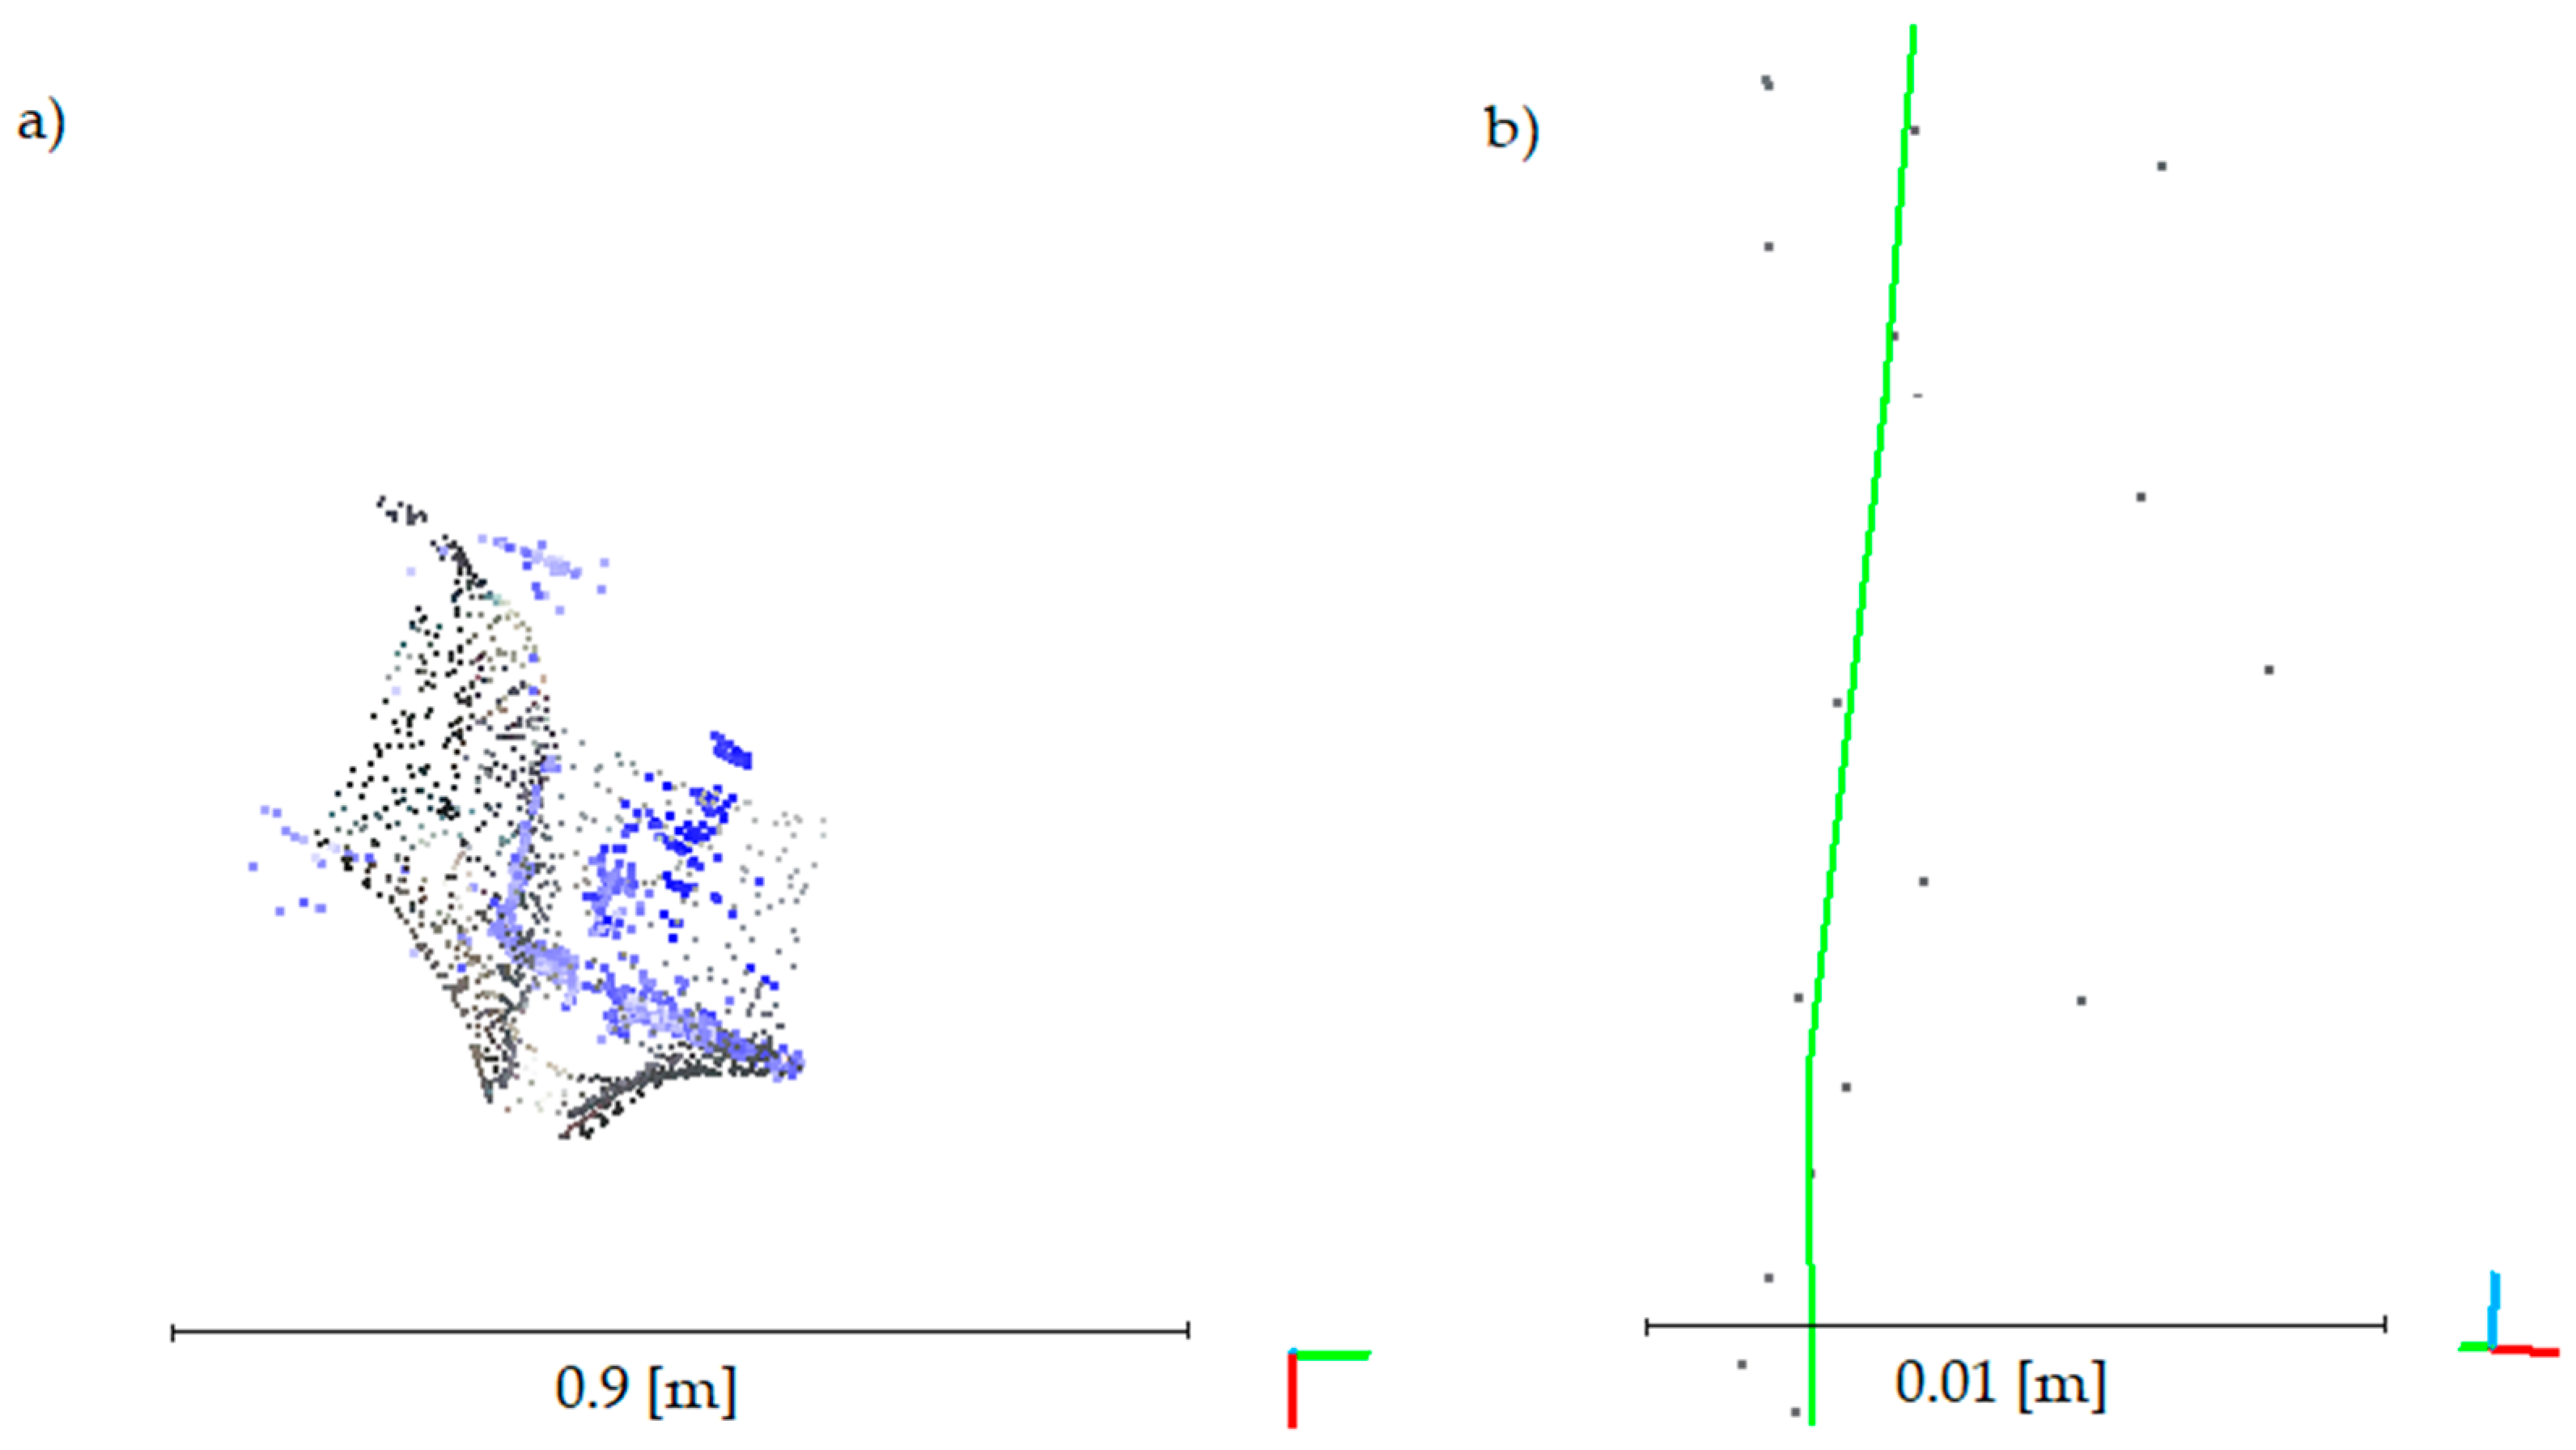
Figure 4a shows the scene with marked camera positions and position uncertainties and
Figure 4b presents the set of photos to potentially cover each area. The object in green denotes the amount of information on the object, taken from approximately 43 photos, due to the respective parts of the hull. The minimum reprojection error is 0.01 pixels and the maximum is 1.85 pixels due to the automatic tie point (
Figure 4c). The automatic tie points have not been stated in selected parts of the object (top and bottom part of the hull). It is the result of insufficiency of textures. Nevertheless, exploring the automatic tie points done, the SfM algorithm unable to recover the ego motion (external orientation parameters - camera position and orientation), so the object could not be reconstructed correctly. The problem of wrongly matched images is bound to appear at the bow and stern parts of the object. In this case, the 33 manual (user-defined) tie points have been stated in the entire object, most of them situated within the problematic areas. The manual tie points are defined by the user. Their position on the images is pointed manually, theoretically on a minimum of three consecutive images. In the presented case, all 33 user-defined tie points have been pointed on all images to achieve sufficient visibility. It was a necessary step to start the reconstruction stage.
2.2. Terrestrial Laser Scanning
The second measurement method was applied for ship hull as-build modelling and reverse engineering is the Terrestrial Laser Scanning (TLS). The laser scanning technology is based on measurements with the laser application. This technique is also called LiDAR (Light Detection and Ranging). Involving automatic data acquisition TLS is able to register huge amounts of data to be widely explored in many applications. A possible application range covers a method to assess suspensions of harmful dust [
25], deformation monitoring [
26], or concrete diagnosis [
27]. However, due to the development of techniques and striving to achieve maximum effects in the shortest possible time, significant progress has been made in the use of a vast domain of mobile systems, where the measuring device can be located on a moving unit (for example, aircraft, car, or boat). Calibration of the scanner on a mobile unit has been widely described in Reference [
28]. This solution is applied for popular navigation and measurements in buildings [
29] or in tunnels [
30].
In order to provide data acquisition, the Riegl VZ-400 Terrestrial Laser Scanner (RIEGL Laser Measurement Systems GmbH, Horn, Austria) was used in courtesy of the Apeks Company, which rented the equipment for research. The instrument specification denotes that the VZ-400 is able to register 122,000 thousands of points per second on a distance not exceeding 350 meters in a High Speed mode. The accuracy of the scanner equals 5 mm. Its precision is 3 mm. Thus, the accuracy of the ship-hull model, to be post-processed in the next steps, should be equivalent to 1 cm accuracy value.
In order to provide spatial data acquisition, a number of 20 scan positions was conducted in different scan patterns. The scan positions are presented in
Figure 5. Bad weather including rain and insolation appeared to negatively act upon the results. Although Terrestrial Laser Scanning shows many applications, it can be hard to assess the geometry of the submarine based only on this method due to bad weather conditions. In the article, we present the combination possibility between point clouds from TLS and terrestrial photographs.
It is worth mentioning that the black nature covering the submarine upon the results of laser scanning is due to light absorption of black material. Thus, the results were not straightforward.
The data post-processing was performed in two steps. The first step concerned manual alignment of scan positions by means of indicating four corresponding pairs of points. The second step applied the ICP (Iterative Closest Points) algorithm for accurate and precise scan alignment. In order to minimize the error, the parameters of rotation and translation matrices were appropriately computed. The least square fitting method was used to automatically match corresponding pairs of points.
The results of scan alignment are shown in
Figure 6 in the form of the histogram of residues where the distances between the aligned pairs of points are displayed.
According to
Figure 6, it may be clear that the maximum distance between the alignment planes is equal to 6 mm. Most of the planes belong to the group between 1 mm and −1 mm, according to their spatial position. Based on the values of residues, the standard deviation may be estimated where the accuracy of the scan alignment can be approximated. The standard deviation equals 2 mm. Based on that information, the accuracy of the point cloud can be less than 1 cm, according to the possibilities of spatial data acquisition by the Riegl VZ-400. The accuracy of the measured points equal 5 mm.
The assessment of acquired data was performed by a visual evaluation. First, cross sections of the buildings and ground were created where the noise was estimated.
Figure 7 presents the results of the noise evaluation.
Figure 7 points it out that the deviation from various scan positions does not exceed 8 mm.
4. Discussion
At the very beginning of the discussion, there is a need to focus on the measurement conditions. They were marked by high insolation and rain, to possibly prevent the inventory from being carried out. The main purpose of choosing such difficult weather conditions was to assess the limitations of combining methods such as laser scanning and photogrammetry. It is shown in
Figure 6,
Figure 7 and
Figure 9 that the cloud of points was obtained with a precision of 5 mm, losing some information about the upper part of the ship’s hull, but, considering the edges, necessary to register in order to properly create the model. In the case of a cloud of points obtained from photographs, the edges were not represented well. Therefore, the standard deviation of connections between particular measurements has increased. It should also be noted that the distances in
Figure 13 result from variations in density and completeness of information between clouds. Based on these results, the estimated standard deviation at the level of 3 cm is high. However, limiting a single method, other authors may attempt to model the hull with much greater accuracy. The results, presented in
Figure 17, are extended in
Figure 18, of the following features: a) registration differences on the edge between the point cloud and the cloud obtained from the pictures are shown, b) the average deviation of the section of the created model to the resulting point cloud is presented, and, at the same time, attempting to apply the model with an accuracy greater than 3 cm. A black color in
Figure 18a presents the point cloud obtained from photographs purple from the laser scanner and, in
Figure 18b, presents the points applied for modelling.
Overall, the review of point cloud registration methods provides wide opportunities to apply them during data processing to achieve greater accuracy of data combining. Currently, hundreds of publications are related to this topic. One of the simplest and widely applied algorithm is the ICP algorithm. The algorithm itself is based on coverage between two sets of data. However, applying filtration and optimization methods, it is possible to increase their reliability as a merged set of data. Such examples are shown in Reference [
31] where, showing the use of the ICP algorithm in robotics, without any general comparison of this method depending on the field of science. This is reasonable, mentioning a variety of applications, sensor characteristics, and the characteristics of environments that make it difficult to choose an appropriate algorithm. Thus, it provides multiplication of this simple solution. It is worth mentioning that another, common algorithm used to connect data sets is the RANSAC algorithm. This algorithm can be described as a method of dataset merging with a large number of outliers and noise. In our future research, we will focus on automation of data aggregation in the case of ship hulls inventories analyzing the method’s possibilities published in literature. The featured publication [
32] shows the use of the 4PCS. This algorithm makes it possible to register raw point cloud data characterized by a high level of noise and outliers. In addition, this method reduces the number of attempts required to obtain reliable accuracy while making registrations. The publications [
33,
34] address novel methods of combining subsets of data. The authors showed that their method makes the multimodal models automatically merged, regardless of differences in noise, detail, scale, and unknown relative coverage. In order to increase the accuracy of merging, adequate filtration has to be made in the data preparation course for further processing.
5. Conclusions
Concluding the article, we focused on the proposed method of combining two measurements: photogrammetry and laser scanning suitable for modelling ship hulls in unfavorable conditions. Based on interviews with shipbuilding companies, the maximum value of the analyzed model should be about 1 cm. Statistical analyses showed that this value is difficult to obtain based on the accuracy of model generation and their subsequent merger. In the case of hull modelling, it is possible to achieve the accuracy of 1 cm when laser scanning provides edge information, while photogrammetry achieves spatial data between these edges.
The idea for this task was to take pictures with a camera to connect them, generate a point cloud, appy laser scanning technology, and then scan around the hull of the ship. The limitations noted by the authors during the development of the results are significant on the generated edges. A problem is shown in
Figure 18a where the edge registered by the laser scanner is not represented in the cloud, but is represented from photos.
Noting this dependence and knowing that the accuracy of edge logging by the laser scanner is not greater than 1 cm, the edges recorded by the scanner and their filling registered by the camera were applied to fit appropriate cross-sections from the exact 3D model that was generated. Such a fitted section is located within a 1-cm accuracy. It was the main purpose of the article.
Concluding, we suggest that the use of combined data from laser scanning and photogrammetry make it reasonable to provide engineering measurements requiring high accuracy (less than 1 cm). When using these methods, there is some awareness of their advantages and disadvantages.


