Article

A Multidisciplinary Approach to the Study of the Temple of Athena in Poseidonia-Paestum (Southern Italy): New Geomorphological, Geophysical and Archaeological Data

1
Department of Social, Human and Educational Science, University of Molise, Via De Sanctis, 86100 Campobasso, Italy
2
Industry Training Authority of British Columbia, Institute of Technologies Applied to Cultural Heritage, CNR, Area Della Ricerca Roma 1, Via Salaria Km. 29,300, 00016 Montelibretti, Italy
3
Department of Cultural Heritage (Dispac), University of Salerno, Via Giovanni Paolo II, 132-84084 Fisciano (Salerno), Italy
4
Independent Researcher, Mercogliano, 83013 Avellino, Italy
5
Department of Bioscience and Territory, University of Molise, Fonte Lappone, 86090 Pesche, Italy
*
Author to whom correspondence should be addressed.
Geosciences 2019, 9(8), 324; https://doi.org/10.3390/geosciences9080324
Submission received: 11 June 2019 / Revised: 13 July 2019 / Accepted: 16 July 2019 / Published: 24 July 2019
(This article belongs to the Special Issue Geoarchaeology: A Review of Case Studies in the Mediterranean Sea)

Abstract

:
The Temple of Athena is one of the main sacred areas of the Greek–Roman settlement of Poseidonia-Paestum (southern Italy). Several archaeological excavations were carried out here between the late nineteenth and early twentieth century. Unfortunately, the locations of these excavations are only approximately known, as are the geomorphology and stratigraphy of the temple area. A multidisciplinary study, including stratigraphic, geomorphological, archaeological, and sedimentological investigations, remote sensing, and electromagnetic and geoelectrical tests, was therefore carried out, shedding new light on the geomorphology and stratigraphy of the SW and W temple sectors. The geophysical data obtained revealed anomalies in the subsoil that probably correspond to ancient structures and the cutting of the travertine deposits around the temple. The position and extension of the trenches of the early archaeological excavations were also established.

1. Introduction

The Greek–Roman settlement of Poseidonia-Paestum is one of the most important archaeological sites of southern Italy. It was founded by Greek settlers at the end of the seventh century BCE along the Tyrrhenian seacoast, in the southern part of the alluvial-coastal plain of the Sele river (Figure 1a). The settlement was strategically located close to the sea and on a travertine platform rising slightly above the coastal plain. It was enclosed by a wall circuit, rectangular-trapezoid in plan (Figure 1b). The Greek city prospered from its foundation until the second half of the fifth century BCE, when it was taken over by the Lucani. Later, in 273 BCE, a Roman colony was established at Lucanian Poseidonia, which was thence forward known as Paestum. In the sixth-seventh century CE, the city was abandoned. During the Roman period (post 273 BCE), the city underwent a major transformation, which drastically altered the Greek built landscape, especially in the forum area.
The history of the city and of its urban and social transformations have been the object of a long series of investigations and excavations within the city limits of Poseidonia and in its territory [1,2,3,4,5,6,7,8,9].
The ruins of Paestum are mostly famous for their three exceptionally preserved ancient Greek temples built in the Doric order, with dates between ca. 600 and ca. 470/450 BCE. One of these three temples, known as the Temple of Athena or Temple of Ceres (c. 500 BCE) (Figure 1c), built of large blocks of travertine, is thought to have been dedicated to Athena on the basis of the numerous terracotta statuettes depicting this deity recovered here, along with some inscriptions naming her. The temple must have replaced an earlier one whose existence is evidenced by architectural decoration dated to 580–560 BCE [10].
Several archaeological excavations were carried out between the late nineteenth and early twentieth century, but unfortunately their locations are only approximately known, as are the landform and stratigraphical features of the area where the temple lies. Recently, several research teams have studied the archaeological materials from old excavation trenches in the area of the Temple of Athena [9,11,12,13,14,15]. Their studies led to the hypothesis that an archaic predecessor of the current temple stood here.
From 2018 until the present day, our research team, composed of archaeologists, topographers, geologists and geophysicists, performed additional multidisciplinary analyses, including stratigraphic, geomorphological, archaeological and sedimentological tests, as well as remote sensing and electromagnetic and geoelectrical testing. The focus of these new studies was the ancient morphology of the temple site, the location and architecture of the archaic predecessor of the current temple, and the major transformations the area surrounding the temple has gone through as a result of archaeological digging and other human actions. Our investigations have led to new hypotheses about the history of the temple, especially as regards the history of the first generations of colonists in the sixth century BCE and the layout of the city at that time. Starting from the new acquired data, especially those from geomorphological, archaeo-stratigraphical and geophysical investigations, new hypotheses about the building of the temple and its subsequent modifications have been put forward. In particular, the local landform appears to be the key to understanding the choice of the location of the sacred area. In addition, the new data allowed us to accurately determine where to dig new trials, both those already dug in 2018 and those planned for the coming years.

2. Previous Knowledge

2.1. Historical and Archaeological Background

The Temple of Athena is located in the northern part of Poseidonia-Paestum (Figure 1b), in the sector between the north-south and east-west plateiai (main roads with larger size) (Figure 2). Its area was excavated during the last century [16], while the eastward extension of the sacred area has not been investigated because it is covered by the modern road running through the site (Strada Statale or S.S. 18, Figure 2), built in 1827–1828 [17]. The first excavations near the temple were carried out in the early nineteenth century [18]. They were followed by extensive digging in the early 1900s [19]. These investigations yielded objects and inscriptions that allowed the temple to be attributed to Athena [16]. The exact location of the archaeological trenches by these early diggers is not known. A study of available old photos and documents allowed us to preliminary trace their original position (Figure 2). The north trench ran parallel to the crepidoma, the stepped platform on which of the temple was built. The western trench was dug in the central intercolumnium (space between column axes), trench A between the first and third intercolumnia starting from the SE side, trench B between the fourth and the sixth, trench C between the sixth (or seventh) and the thirteenth, and a trench was dug into the foundations between the third and fourth intercolumnia [12,19]. It is hard to estimate the depth attained by these trenches, but some preliminary considerations suggest a range between 2.5 and 4.5 m. From the old photographs, it appears that the trenches were deeper near the crepidoma of the temple.
An important feature of the stratigraphy of the trenches dug by Maiuri [19] was the presence of a thin-burnt layer containing several metal objects and other materials damaged by a fire [12]. In particular, Maiuri reports the presence of a grayish soil layer at a depth of ca. 2.20 m containing stones and bronze objects. Underneath this layer some antefixes, sherds of Corinthian vases (sixth century BCE) and a female statuette of Archaic age (sixth century BCE) [19] were found. These data were recently confirmed by a study of the metal objects from the temple, nowadays held at the Paestum Museum [12,13,14,15,19,20], which shows evident traces of fire. These burnt archaeological materials suggest that a destructive event affected the temple between the sixth and the fifth century BCE [10,11,12,13,14,20].
During the 1930s, further excavations were carried out in the southeastern part of the temple and between the east front of the building and the modern boundary fence running along the road (S.S. 18). They brought to light a large altar, coeval with the preserved temple, and other structures whose function remains uncertain to this day [21].
Not long thereafter, in the 1940s, the German architect Krauss reopened one of Maiuri’s trenches to study the foundations of the temple. He exposed the stereobate of the temple, which consists of seven rows of travertine blocks [22].
From the 1950s onwards, no more excavations were undertaken inside the temple area. All the more recent structures had already been demolished during the nineteenth century [16,20].

2.2. Geological and Geomorphological Context

The archaeological area of Poseidonia-Paestum is located in the southern sector of the alluvial-coastal plain of the Sele River, ca. 1 km from the current shoreline, between the Capodifiume and Fiumarello rivers, on pluri-lobate and terraced deposits forming a travertine platform, known as “Paestum Travertine” (Figure 3) [23,24,25]. These terraces are composed of several multiphasic generations of travertine deposits derived from in situ carbonate encrustation of vegetables and/or by the action of river water on the lithified phytoclasts. They were generated by waters with a high content of calcium carbonate coming from the springs located at the base of Mount Soprano and Mount Sottano, and by fluvial incrustations of the Capodifiume River. The lithofacies associations (stromatolitic, microhermal, phytohermal, phytoclastic and calcareous tufa) of the Paestum Travertine depositional system was the result of fluvial-marshy and marshy conditions, which favored the emergence of an extensive plateau of travertine rising above the surrounding plain [26]. Recently, Amatoet al. [23,24] provided a detailed chronological reconstruction of the various stages of the Paestum depositional system, based on radiometric dating, archeo-tephro-stratigraphic data, and geomorphological constraints (Figure 3). They have thus been able to distinguish between Lower Paestum Travertine units (LPT) and Upper Paestum Travertine units (UPT). In summary, the deposition was active during the Middle-Late Pleistocene (Cafasso and Gaudo travertine units), during the Late Pleistocene–Early Holocene (Paestum travertine unit), and in historical times, near and around the Paestum archaeological area (Linora, Fossa Lupata and Licinella Unit), covering much of the ancient city under sediments. The LPT was thus formed for the foundations of the public and private buildings and also provided the main building material for their construction.
The travertine deposits (LPT and UPT), maximum thickness of ca. 20 m, can be divided in two main groups of lithofacies following D’Argenio and Ferreri’s textural classification [27]: (a) in situ carbonate incrustations made up of undulating, millimeter-thick layers, mostly due to cyanobacterial activity (stromatolitic travertines), centimeter-size dome-shaped structures derived from carbonate precipitation on small size vegetation, mainly mosses and algae (microhermal travertines), centimeter to meter-size ‘‘biostromal’’ and ‘‘biohermal’’ structures derived from carbonate precipitation on large plants, mainly reeds and rushes (phytohermal travertines); (b) carbonate grains formed by the accumulation of fragments of incrustations (phytoclastic travertines and phytoclastic sands). These deposits are characterized by a clastic texture with a grain size ranging from a few millimeters to a couple of centimeters. It is worth noting that this lithofacies has generated several depositional features (lamination, grain orientation, clino-stratification, etc.) and geometries (mounds, ramps, scarps), which provide evidence for the hydrodynamics (direction and flow power) of the original sedimentary environments.
The bottom of the travertines the ancient town of Paestum is built upon lies between 7 and 4 m below the present sea level, and overlies sandy levels most likely ascribable to the Gromola dune ridge of the Last Interglacial Period (MIS 5) [28,29].
In the coastal sector in front of the Paestum archaeological area, at the toe of the raised travertine plateau, a continuous sandy dune ridge (max 6 m a.s.l.) runs close to the modern beach. This belt stands behind a depressed area (max 3 m a.s.l.) (the Fossa Lupata back-ridge depression identified by Amato et al. [25]), only recently reclaimed by a complex manmade drainage system. Amato et al. [25] proposed that a coastal lagoon had already been established after the maximum sea transgression occurred at ca. 6.8 ka. During the Classical period (2.5 ka BP) there was only a small lagoon here (a natural pond or an artificially preserved one), open to the sea, which evolved progressively during historical times as palustrine and marshy environments and finally as reclaimed earth.

3. Material and Methods

Our work was based on a multidisciplinary approach involving five distinct steps: (1) acquisition and processing of previous archaeological and geological knowledge; (2) geomorphological study of preexisting topographic maps and aerial photos, supported by new topographical surveys and field geomorphology; (3) stratigraphic analysis by means of boreholes, archaeo-stratigraphical excavations and field geology; (4) ground penetrating radar (GPR) and geoelectrical testing; and, (5) archaeological excavation to verify the acquired data. The first three steps encompassed the entire archaeological area of Poseidonia-Paestum within the walls, while the last two regarded the southern and western sectors of the area of the Temple of Athena.

3.1. Geomorphological Approach

A detailed geomorphological survey of the area within the walls of Paestum was carried out using a topographic map with contour lines spaced 1 m apart. The contour lines were derived from interpolation and digitalization techniques in a Geographic Information System (GIS) (by means of the 3D Analyst tool of the software Arcgis 9.3) of the altimetric points (above sea level) indicated in the available topographic maps (Carta Tecnica Regionale (CTR) 1:5000 of the Campania Region, 2004; map 1:5000 of the Cassa per il Mezzogiorno (CASMEZ), 1984; Capaccio Plan 1:2000 of the municipality of Capaccio, 2000). For the sector surrounding the Temple of Athena, new topographical measurements were collected directly in the field using an optical level. The contour line map thus obtained was then analyzed in order to distinguish the main features of the landforms and landscape of the archaeological area. Simultaneously, aerial photo interpretation (1:18,000, 1944 and 1:39,000, 1954) was carried out, mainly in order to identify water and moisture traces, useful for the mapping of the more depressed areas within and around the archaeological area. A detailed geological field survey was also carried out in order to identify the travertine outcrops still visible within the archaeological area. In addition to this, and in order to produce a detailed geological model, various stratigraphic data from archaeological excavations and boreholes were acquired and interpreted.

3.2. Geophysical Approach

The probable type, dimensions and depth of the buried structures, the logistics of the investigated area, and the geological and geomorphological features were taken into account in carrying out GPR and electrical resistivity tomography (ERT) tests. The main objectives of the geophysical investigations were obtaining a description of the profile of the top of the travertine in proximity of the temple and determining the location of the old excavation trenches in order to recover still-intact archaeological levels. For these purposes, a superficial high-resolution GPR investigation was carried out in June 2018, followed by two campaigns of ERT investigations (August 2018 and April 2019) aimed at acquiring information relative to the deeper strata of the temple area.

3.2.1. Ground Penetrating Radar (GPR)

An IDS RIS K2 Georadar (IDS GeoRadar s.r.l., Pisa, Italy), equipped with a multi-frequency TRMF (Time-Reversal Matched Filter) antenna (600-200 MHz), was used for data acquisition. A total of 61 profiles were acquired in the survey grid as shown in Figure 4a. Radar reflections on each line were recorded at 25 scan s−1 (1 scan approximately corresponds to 0.025 m) as 16-bit data and 512 samples per radar scan.
Bi-dimensional radargrams relative to single lines were processed through the IdsGred [30] and the GPR-SLICE7.0 software [31]. The raw GPR data files were filtered by applying a band-pass filter (low cutoff: 99 MHz; upper cutoff: 992 MHz), background removal, wobble removal and manual gain in order to remove the high- and low-frequency anomalies that occurred during data acquisition, normalize amplification, and remove reflections generated by noise due to different signal attenuation [32,33]. In the examined context, assuming a soil in which the wave spreads with a mean velocity v of 0.1 m/ns, the depth h of the reflectors could be approximately derived from the equation h = vt/2 (where t is the time in which the electromagnetic wave completes its passage from the transmitter antenna through the discontinuity to the receiver antenna).
Four radargrams are shown in Figure 5 in order to give an idea of the detected bi-dimensional anomalies, which are highlighted by means of arrows. Thus, the whole dataset, composed of a three-dimensional matrix of averaged square wave amplitudes of the return reflection, was used to extract time slices for various time windows. The time slices were overlapped by 0.2 m. The data were gridded using the inverse distance algorithm, which includes a search for all data within a fixed radius of 0.75 m of the desired point to be interpolated on the grid, and a smoothing factor of two. Grid cell size was set to 0.01 m to produce high-resolution images.

3.2.2. Electrical Resistivity Tomography (ERT)

To collect an apparent resistivity dataset along a profile, we used a four-electrode device, the ElmesADD-01 Resistivimeter. It consists of two separated portable boxes—the measuring/control unit and the current generator—interconnected via a wireless radio frequency device. Designed primarily for archaeological investigation, it is characterized by a 50 W low power generator. A current sine wave was generated using a frequency equal to 33 Hz and an intensity of the exciting current of 20 mA. The acquisition board is equipped with a bandpass filter in order to eliminate unwanted noise.
The ERT survey was conducted over two large areas located at the southern and the western sides of the Temple of Athena, respectively named Area 1 and Area 2. A total of 24 dipole–dipole (DD) profiles was acquired (Figure 4b). In both of the investigated areas, the distance between the profiles was fixed at 2 m. Profiles 01 and 02 (in red in Figure 4b) were acquired in August 2018 and were followed by archaeological excavation. The remaining ones were acquired in April 2019.
In Figure 6 only four apparent resistivity pseudosections are shown, two for each zone, in order to give an idea of the nature of the input data. The sections are contoured at constant (logarithmic) intervals and are simply a graphical representation of the ρa dataset, where the vertical scale is a function of the array spacing and not of the depth. Although distorted by some repeated dragging effects that are typical of the DD array, due to the presence of strong resistivity inhomogeneities close to the current or potential dipole, a transition from lower to higher ρa values characterizes the pseudosections. In complex geological models, and in cases of even a single vertical contact between dissimilar resistivities like the present one, the pseudosections do not have an intuitive relationship with the actual model. Thus, in order to remove corrupting effects and model the survey targets as accurately as possible, a numerical inversion is needed to convert the apparent resistivity distributed along a pseudosection to real electrical resistivity values displayed as a function of depth below surface. In our case, we applied the probability-based ERT inversion (PERTI) method [34], derived directly from the principles of probability tomography [35,36]. As outlined in previous applications [37,38,39,40,41], the PERTI method can be considered a self-sufficient procedure, useful as a means of determining the location and shape of the most probable sources of the anomalies detected on the ground surface.

3.3. Archaeo-Stratigraphical Surveys

Two archaeo–stratigraphical excavations were dug during the 2018 and 2019 surveys. In the framework of a 3-year research program (2018–2020), their purpose was to reconstruct the ancient landscape features of the northern sacred area in different periods, especially at the beginning of the history of the ancient city. In particular, since the area was strongly affected by old archaeological excavations and other anthropogenic changes (as briefly illustrated in the above sections), the aim of the new archaeological excavations was to identify the traces and edges of the old trenches (A, B, C and between A and B), mainly in the southern sector of the temple (Figure 2). In addition, stratigraphic studies were carried out of the new archaeological excavations, in order to identify archaeological layers that had not been disturbed by previous excavations and could thus yield information about the archaeological stratigraphy of the sacred area in the sixth century BCE (ca. 600–510 BCE). The location of the two stratigraphical excavations, designated as 242 and 243, was chosen on the basis of the preliminary results of the geophysical surveys, particularly taking into account the anomalies inferred by the GPR and ERT profile surveys. The first archeo-stratigraphical excavation (survey 242), oriented N–S and measuring 2 × 5 m, was located ca. 24 m south of the temple, exactly above a geophysical anomaly corresponding to Maiuri’s Trench C [19], between the sixth and eighth column. The second archaeo-stratigraphical excavation (survey 243), oriented N–S and measuring 3 × 6 m, was located above the square GPR anomaly.
All the layers identified during the excavations were recorded as distinct SUs (stratigraphic snits), numbered from top to bottom, down to the travertine bedrock. Only part of stratigraphical survey number 242 reached down to the bedrock, differently from the 243 survey, which attained the bedrock a few decimeters from the surface. Each stratigraphic unit was described from a geological and sedimentological point of view, and its chronology was established on the basis of its archaeological contents (pottery classes, potsherds, metal objects, etc.).

4. Results and Discussion

4.1. Geomorphological and Geological Features of the Site

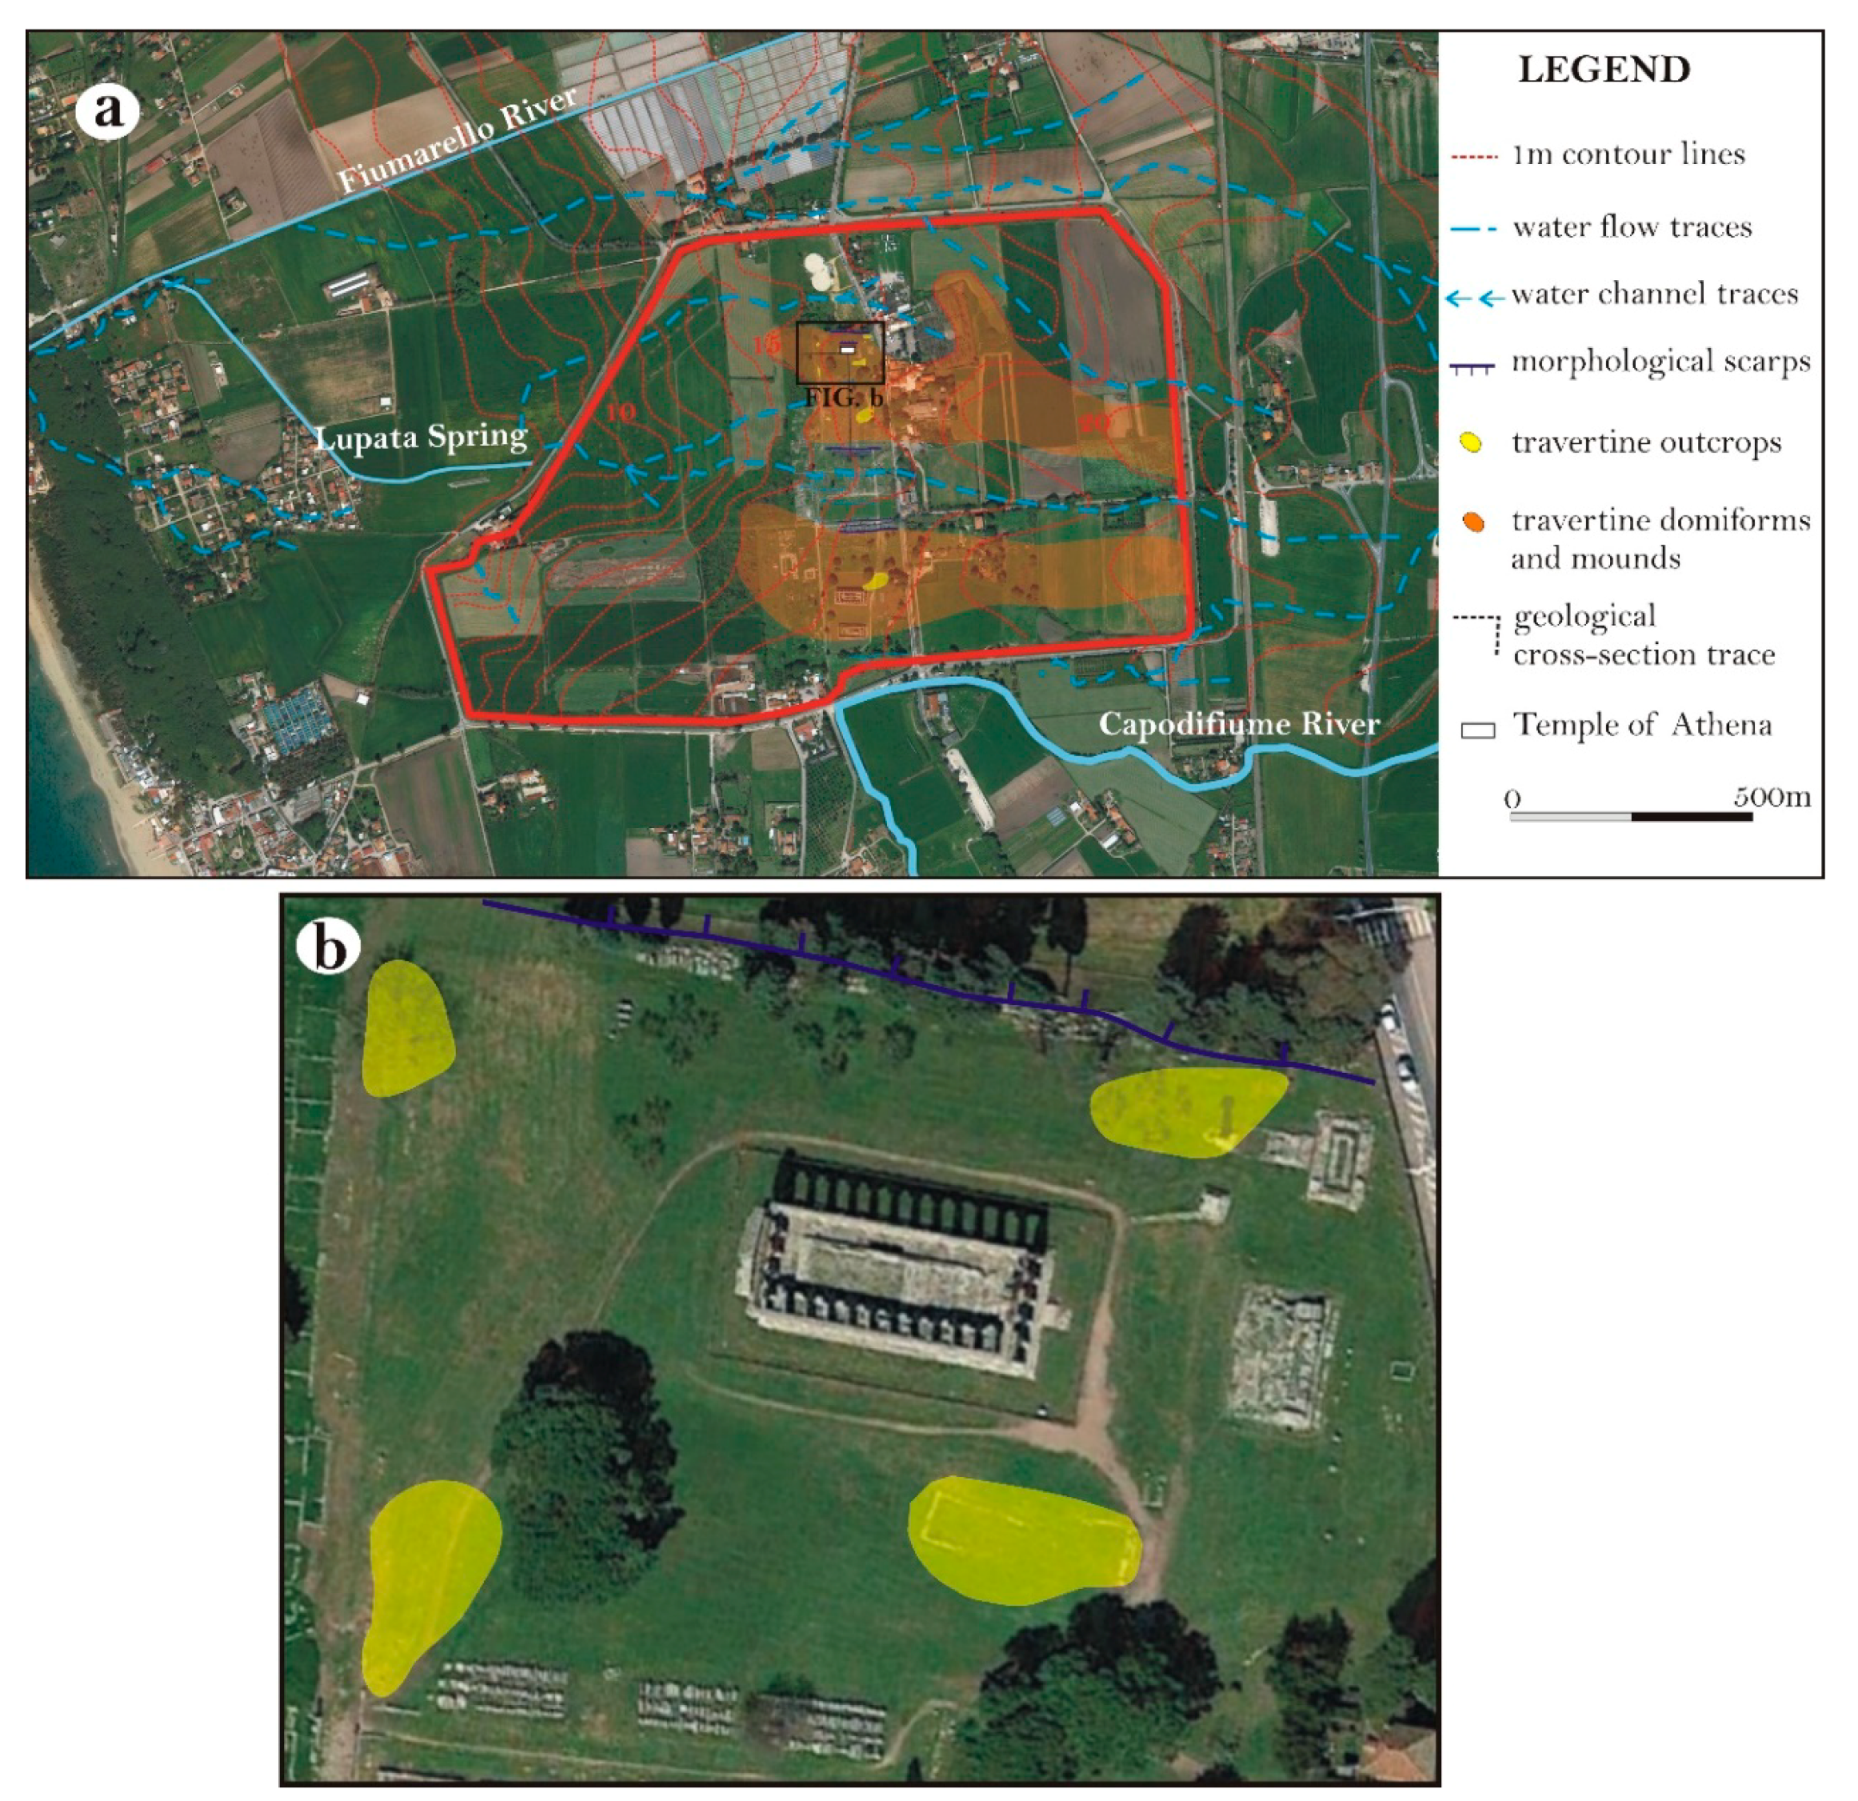
The contour line map shows that the archaeological area of Poseidonia-Paestum within the city walls lies between 20 and 10 m above sea level (Figure 7a). In the northern and southern sectors of the city are two elongated dome-shaped mounds, approximately oriented E–W and sloping down from ca. 20 to ca. 15 m a.s.l. The northern mound has an elaborate morphology, featuring at least two elongated lobes of travertine. The first, extending SSE–NNW, lies in the NE sector of the city and is bordered to the NE by a deep incision, probably the bed of an ancient watercourse, that was part of an articulated network of rivers (the paleocourses of the Fiumarello river) extending across the area just outside the N walls. On the SW side of this lobe, there are traces of a surface water flow that seems to originate from it. The second lobe, higher and broader, oriented approximately E–W (precisely, N105°), extends from the E city wall (20 m a.s.l.) to the central part of the city (15 m a.s.l.). It is bordered to the N by the same trace of surface water flow detected in the previous lobe, and to the S by a deep and extensive depressed area interpretable as a paleoriver course, where the Roman Forum and several pools lie. Both watercourses flow within the present-day Lupata spring and converge in what is believed to be a workshop quarter [42]. Both to the N and to S, the lobe shows 1.5 m steep scarps, while to the W the mound slopes slightly away. The Temple of Athena lies on the northernmost part of this lobe.
The southern mound, like the northern one, extends from the E city wall (20 m a.s.l.) to the central part of the city (15 m a.s.l.), with 1.5 m steep scarps to the N, and southward to the S city wall and the Capodifiume river. On this mound are the ruins of the other two major temples of the city, which stand in the area known as the “southern sanctuary”.
Both the mounds are constituted by travertine deposits (Paestum Travertine Unit, Figure 3), some outcrops of which are still visible (indicated by yellow polygons in Figure 7b). Some of these outcrops show signs of quarrying. Outcrops of historical travertine deposition (Upper Paestum Travertine) can also be seen in the depressed areas between the mounds and the W sectors of the city, both in archaeological trenches and at ground level. The largest outcrops of this historical deposition are visible at Porta Marina, along the southern walls and the streets. The mounds where the temples lie are the most elevated areas in the city, the one of the Temple of Athena being higher than the southern one.
The landform of the top of the travertine bed is neither uniform nor planar, presenting mounds and dome-shaped structures interspersed with numerous depressed areas of different widths and extensions, and by fluvial incisions of different depth and width (Figure 7a).
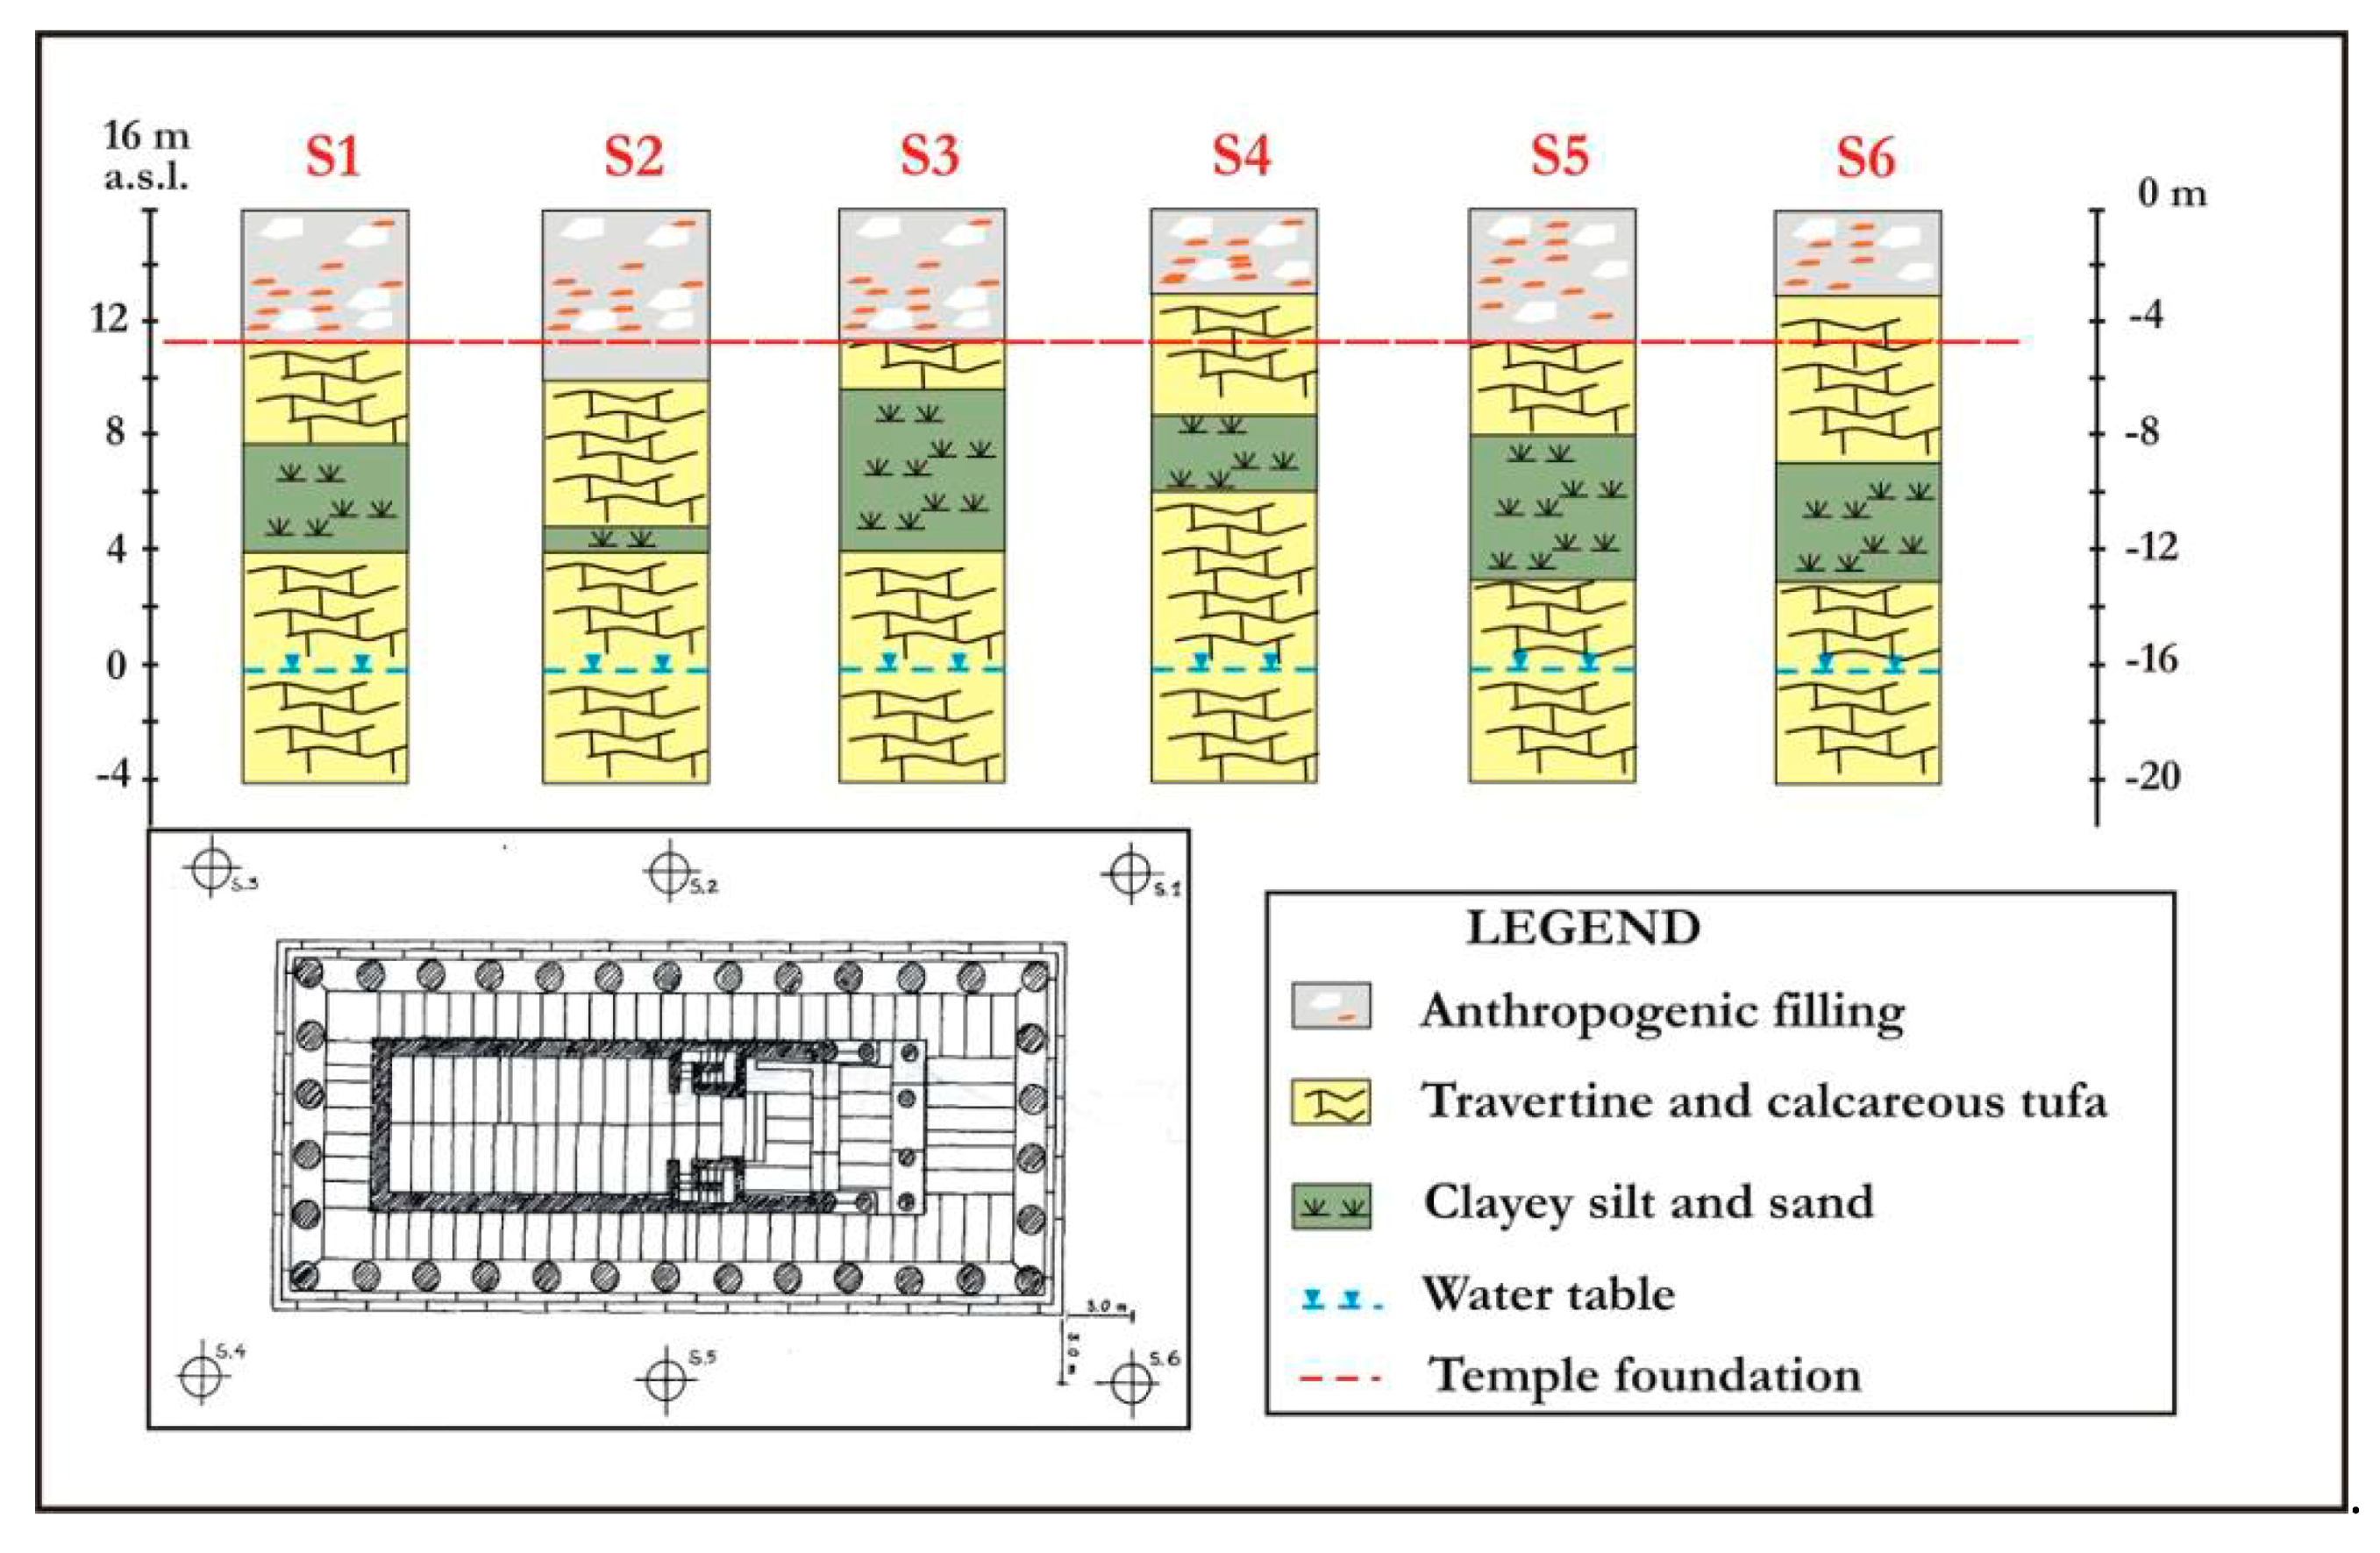
Also in the sector of the Temple of Athena, the top of the travertine surface is not uniform, as borne out by core samples from six boreholes dug in 1988 to investigate the geotechnical features of the foundations layers of the temple (Figure 8) [43]. The boreholes were dug around the temple, about 3 m from the stylobate. They revealed stratigraphies composed of (from top to bottom) (Figure 4): (a) 2.50–4.50 m of anthropogenic deposits; (b) travertine deposits, ca. 6–7 m thick; (c) silt and sand layers, 1–5 m thick; and, (d) travertine and calcareous sand layers. This hypothesis is confirmed by field data indicating the presence of travertine only a few cm below the present ground level (Figure 7b). In conclusion, Maiuri’s [19] data relative to the foundations of the temple (made of at least six courses of travertine blocks, one block being ca. 70 cm high) seems to indicate that the travertine bedrock was cut all around the temple.

4.2. Geophysical Results

4.2.1. GPR

As mentioned above (see Section 3.2.1), there is evidence of layers in the investigated soil portion (Figure 5). A shallow sub-horizontal layer, indicated with green arrows, is recorded at the origin of lines 03 and 09. All four radargrams show a level, indicated by pink arrows, that is visible at depths decreasing from 2 m (the origin of the lines is about 6 m from the temple) to the surface on the southern side, and probably corresponds to the top of the travertine bedrock.
Figure 9 shows the horizontal slices relative to the depth ranges of 0.2–0.4 m (a), 1–1.2 m (b), and 2–2.20 m (c).
In the images, low variations in amplitude express small reflections indicating the presence of fairly homogeneous sediments. High amplitudes instead denote relevant discontinuities in the investigated surface. In the most superficial portion (0.2–0.4 m), we note some high-amplitude anomalies indicating the probable presence of buried modern utilities (indicated with arrows 1–3). Worthy of note is the superficial rectangular anomaly (4 m × 2 m), whose center is located 15 m south of the crepidoma of the temple and 16 m from its west corner (A in Figure 9a). Elsewhere, low-amplitude anomalies indicate the presence of humus and high amplitudes attest to the presence of travertine. The rock outcrop around the archaic temple confirms this (see Figure 7b). At greater depths, the medium-high amplitudes are presumably attributable to the presence of travertine in the subsoil. The mostly irregular and undulating shape of the anomalies suggests that most of the detected bodies are not manmade.
In the immediate vicinity of the temple, there is an area with very low values, about 15 m wide; this is where the filling of old trenches is hypothesized to lie (in Figure 9a they are indicated with the letters A, B and C). Anomaly D could indicate the southern limit of the excavation, which presumably did not extend beyond this point, both because of the hardness of the bedrock and because there would have been no interest in expanding the dig in that direction. All these readings are relative to the soil down to a depth of about 2 m.

4.2.2. ERT

Table 1 lists the minimum, maximum, and average apparent resistivity along each profile acquired as reported in Figure 4b. Profiles 1–17 (Area 1) are very heterogeneous and show values of resistivity in the 55–4448 Ωm range, with a mean resistivity of 665Ωm. It is worthy of note that apparent resistivities increase as the measurements move away from the temple toward the south, where the highest values are detected. Profiles 18–24 (Area 2), instead, appear to be quite homogeneous, showing values of resistivity in the 100–978 Ωm range, with a mean resistivity of about 400 Ωm.
Figure 10 shows the results of ERT 01 and ERT 02, acquired in August 2018. The images confirm the results of the GPR surveys. The zones with values above the measured mean resistivity are attributable to the presence of hard rocks (ERT 02) and travertine blocks mixed with sands (ERT 01).
The conductive zone with values lower than the measured mean resistivity most likely corresponds to fillings and soil. In particular, in the eastern part of ERT 01 and in the central part of ERT 02, it could correspond to the backfills of past excavations. The shallow highly resistive anomaly visible at the crossing point of the sections coincides with the rectangular anomaly detected in the GPR depth-slice (Figure 9a), indicated with the letter A. Because of these results, an excavation was suggested at the point indicated with a red arrow in order to verify the presence of travertine and the probable southern limits of trench C.
Figure 11 shows the results of the three-dimensional probability tomography applied to the whole resistivity dataset from all of the profiles acquired in April 2019 in the southern and western sector of the temple. A perspective view of the tomospace from 1 m to 5 m in depth is given, using three different drawing styles of calculated resistivity. In Figure 11a, the whole volumes are imaged, whereas in Figure 11b,c the representation is limited to anomalies including values greater or lower than 398 Ωm, respectively. In Figure 12 and Figure 13, the location and shape of the anomaly sources are rendered as a sequence of vertical tomographic sections oriented, respectively, E–W and N–S. Finally, two high-resolution horizontal maps relative to depths of 1 m and 2 m have been extracted from the tomospace (Figure 14).
Two distinct resistivity environments can be assumed. The one with high resistivity values is relative to the travertine bank, while the one with low resistivity values, close to the temple, is relative to the fillings. While the southern portion of the temple area was already expected to be altered by previous excavation work (the anomalies A, B, C and D in Figure 14a do indeed correspond to trenches visible in pictures published by Maiuri [19]; Figure 15a,c), the measurements made to the west reveal a hitherto unknown aspect of the ancient landscape that could be related to the construction of the sacred building and with the ancient street grid. With the exception of a very low resistivity anomaly attributable to a modern path, a 15-m wide area (designated as G and H) with low resistivity values is highlighted at a depth of 1m. Since it is parallel to the western side of the temple and lies along the axis extending between the northern and southern entrances to the city, it could be tentatively identified as a road. In the southern area, between the fourth and sixth intercolumnia, two high resistivity anomalies bound the filling of Trench B of Maiuri at a depth of 1 m (E and F anomalies in Figure 14). Traces of a structure can be seen here in an old sketch of the temple area (E and F in Figure 15b) [19], but no description of it is given.
As to the results of the deeper measurements (Figure 11, Figure 12, Figure 13 and Figure 14b), a viable hypothesis is that, to build the temple at the top of the mound, a large pit was dug in the travertine outcrop, quarrying the building blocks of the temple in the process; once the foundations had been built, the pit was then backfilled with other material. The presence of travertine outcrops, the results of core drilling, and the results of the geophysical tests performed around the temple support the hypothesis that the hill was naturally formed and not artificially built.

4.3. Archaeological Data from New Trenches

4.3.1. Stratigraphic Survey No. 242

As mentioned above, stratigraphic excavation revealed Maiuri’s Trench C [19] about 30–40 cm from the surface, under a thin layer of modern soil and two thin disturbed layers, SUs 2 and 3 in Figure 16). In this old trench, three main layers (SUs 7, 9 and 10) were identified (Figure 16b,c). SU 7 consisted of calcareous sands and silts containing heterometric and loose travertine stones and pottery sherds. It covered a second layer (SU 9) made exclusively of large travertine blocks, not well lithified, probably chipped and piled on each other, interpretable as scraps from the processing of building blocks (Figure 16c). The lower part of the fill (SU 10) consisted of non-lithified, dusty travertine sands, probably also from the processing of the travertine blocks. All three layers contained archaeological remains chronologically related to archaic and Roman age; these were mixed with modern material such as glass and rubber, which allowed the layers to be interpreted as the backfill of Maiuri’s trenches [19]. South of the edge of the old trench, the new archaeological excavation was deepened by opening a pit measuring ca. 1 × 2 m. Here, under the same layers described above, was a thick layer (SU 8, 0.7 m) of travertine sands containing travertine sherds and blocks, as well as archaeological remains dating to the archaic period (late sixth–early fifth century BCE). The more recent levels, from the late sixth century BCE, had evidently already been removed by the excavations of the 1930s. SU 8 covered a thin layer (SU 12) of dark gray loose sand and sandy silts, rich in burnt woods and ashes, also containing potsherds of the sixth century BCE, Corinthian and Attic artifacts, miniature pots, and bronze fragments showing traces of burning. SU 12 covered a thin layer (SU 15), extending over the whole surface, consisting of an accumulation of archaic materials probably relative to a collapsed roof, which was disturbed by later digging (Figure 16c). This layer also contained also an antefix of the a corna(horned) type, with red-painted edges, from the same set of roof tiles found in Maiuri’s excavations [19] and presently on display in the Paestum Museum [11].
These archaeological materials were scattered across a beaten-earth floor (SU 17), which sloped slightly towards the south-west (Figure 16d). This is probably the original floor level of the archaic sanctuary, since it is here that the remains were found of the roof of the sixth century BCE building recently identified by Rescigno [11] as the oldest temple of Athena. The thick layers that cover these remains seems to be the result of the demolishing of this early temple to make way for the new temple of Athena between the late sixth and early fifth century BCE.

4.3.2. Stratigraphic Survey No. 243

As mentioned above, the aim of stratigraphic excavation number 243 was to investigate the meaning of the GPR anomaly and, more in general, to detect the southern limit of the temple area and the northern sector of the plateia (ancient street) dividing the sacred area from the ancient agora (main square). This important axis crossing the ancient city from east to west had already been identified during archaeological excavations conducted by an Italian-French team [44,45].
The stratigraphic data from stratigraphical excavation number 243 were unsatisfactory, because the layers were disturbed in several places by the planting and subsequent removal of a row of cypresses planted around the temple in 1950 [20]. The hollow left by the roots of a cypress was recognized in the excavation, as well as traces of a furrow housing an electric cable (Figure 17). Despite this, the pit yielded two important items of information: (1) the GPR anomaly was due to the presence of the electric cable; (2) the travertine bedrock in this sector is very high, lying only a few decimeters below the present-day surface. This last datum confirms the non-uniformity of the top of the travertine bedrock in the area of the temple of Athena, already suggested by our geomorphological tests.
In spite of the later disturbances, some in situ archaeological remains were detected along the southern sector of the trench. They consisted of Roman-period pottery, mainly amphorae and bricks, evidence of some kind of activity that today we can only guess at.

5. Conclusions and Implications for Future Studies

Although the archaeological data collected so far only allow for preliminary hypotheses and indications for future research to be put forward, the geophysical and geological investigations have highlighted specific features of the local bedrock and landforms that certainly must be taken into consideration for the detection of the ancient topographical surfaces.
Our geomorphological study highlighted the presence of two travertine mounds precisely where the sacred areas lie (Figure 18a). Between them, there is a depressed area where the southern sector of the agora of the late archaic, classical and proto-Hellenistic ages (510–273 BCE) was located. It thus appears likely that both sacred areas were established on the higher reaches of the city. It is interesting to note that the two mounds of travertine are oriented approximately SSE–NNW and dip towards the NNW; this matches the orientation of the temples and of the hypothetical N–S road east of the temple of Athena, suggesting that the plan of the archaic city (ca. 600–510 BCE) may have been aligned with the preexisting landforms.
The combined results of the geophysical (GPR and ERT) and morpho-stratigraphic studies indicate that the top of the travertine bedrock is not uniform in the southern and western sectors of the area of the Temple of Athena (Figure 18), where the travertine forms a dome-shaped mound. All around the temple, at least in its southern and western sectors, the travertine surface shows sudden drops that are not explainable as natural landforms (Figure 18b). These sheer scarps must be due to anthropogenic cutting, probably to quarry the blocks used for the construction of the temple, as is also documented from the occurrence of scraps and crushed travertine fragments in the layers of stratigraphical excavation No. 242. This suggests that the area around the temple was excavated to quarry the blocks for the temple foundations and subsequently backfilled. Further archeological excavations will hopefully yield chrono-stratigraphic data that will help to determine when this cutting and filling was carried out.
The GPR and ERT data were also very useful for the identification of the pits of archaeological excavation carried out several decades ago, and for deciding where exactly to dig the new archaeo-stratigraphical excavations. They will also be useful for future archaeological excavations of the sectors that potentially still preserve undisturbed stratigraphies. In addition, the ERT tests in the western sector of the temple suggest the presence of a 15 m wide area characterized by low resistivity values at ca. 1 m of depth. This anomaly runs parallel to the west side of the temple and is located along the axis joining the north and south gates of the city (Porta Aurea and Porta della Giustizia). In the southern area, between the fourth and sixth intercolumnia, two high resistivity anomalies bound the filling of trench B at a depth of 1 m. They are interpretable as trace of a building, perhaps the same one recognizable in a sketch made during the excavations carried out in the 1930s. In both cases, only archaeological excavation can confirm these hypotheses.
The results obtained allow some preliminary considerations, which future research may help to flesh out. The most important data comes from stratigraphical excavation number 242. The results of this excavation suggest that strata pertaining to the archaic sacred area of the Temple of Athena may still be preserved in the subsoil, despite the digging work carried out in the southern sector of the temple area during the last centuries. These stratigraphies will be further explored in archaeological excavations scheduled in 2019 and 2020 in order to reconstruct the early history of the sanctuary. The discovery of the architectural antefix of the big temple of 580–560 BCE within the layer of destruction and rearrangement of the temenos (sacred area) at the end of the sixth century BCE may be regarded as evidence of a sudden and traumatic event that affected the sanctuary, such as a fire. It is likely that after this event the sanctuary was rebuilt and reorganized, along with a large part of the archaic city. This is the only possible explanation for the absence of remains of the city predating the refurbishment of this area at the end of the sixth century BC, whose surviving relics include the streets, the residential blocks with a house, the heroon (place of heroic worship), and the “new” temple of Athena.
The available data provide no evidence for the appearance of the city during the first century of its life, but the finding of early votive materials (ca. 600–510 BCE) confirms that the sacred areas of the two archaic temples were located in the same position as the later temples. The buildings of the archaic agora probably stood in the same area as those of the agora of the fifth century, between the two sacred areas. No data are available about the urban plan of the early sixth century BCE. The assumption that the orientation of the streets and houses was the same as that of the still-standing temples is intriguing, but so far unconfirmed. Likewise, the hypothesis that an archaic street ran from north to south in the western sector of the temple area, with the same orientation as the temple building (Figure 14a), as suggested by the ERT surveys, will need further archaeological investigation to be confirmed.

Author Contributions

Conceptualization, F.L., V.A. and M.C.; Methodology; F.L., V.A. and M.C.; Software, V.A. and M.C.; Validation, F.L., V.A. and M.C.; Formal analysis, F.L., V.A. and M.C.; Investigation, M.C., F.L., N.P., M.L.R., O.V. and V.A.; Resources, F.L.; Data curation, M.C., F.L., N.P., M.L.R., O.V. and V.A.; Writing—original draft preparation, F.L., V.A. and M.C.; Writing, revising and editing, F.L., V.A. and M.C.; Visualization, F.L., V.A. and M.C.; Supervision, F.L., V.A. and M.C.; Project administration, F.L.; Funding acquisition, F.L.

Funding

The archaeological researches were financed by the School of Specialization in Archaeological Heritage of the University of Salerno. Publication costs were incurred through external financing.

Acknowledgments

Special thanks to the director Gabriel Zuchtriegel and Dott. Gianni Avagliano of the Archaeological Park of Paestum for assisting us in our research. The authors wish also to express their gratitude to the two anonymous referees for their valuable suggestions, which have helped to improve the manuscript.

Conflicts of Interest

The authors declare no conflict of interest.

References

  1. Greco, E.; Theodorescou, D. Poseidonia-Paestum I. La Curia; École française de Rome: Rome, Italy, 1980; p. (a)86, (In Italian and French). [Google Scholar]
  2. Greco, E.; Theodorescou, D. Poseidonia-Paestum II. L’Agorà; École française de Rome: Rome, Italy, 1983; pp. 1–256, (In Italian and French). [Google Scholar]
  3. Greco, E.; Theodorescou, D. Poseidonia-Paestum III. Forum Nord; École française de Rome: Rome, Italy, 1987; pp. 1–294, (In Italian and French). [Google Scholar]
  4. Greco, E.; Theodorescou, D. Poseidonia-Paestum IV. Forum Ovest-sudest; École française de Rome: Rome, Italy, 1999; pp. 1–237, (In Italian and French). [Google Scholar]
  5. Bragantini, I.V.; Fe Bonis, R.; Lemaire, A.; Robert, R. Poseidonia-Paestum V. Le Maisons Romaines De L’ilot Nord; École française de Rome: Rome, Italy, 2008; (In Italian and French). [Google Scholar]
  6. Greco, E.; Longo, F. (Eds.) Paestum. Studi, Scavi E Ricerche. Bilancio Di Un Decennio. 1988–1998; Pandemos: Paestum, Italy, 2000; (In Italian and French). [Google Scholar]
  7. Guy, M. Le Rivage Marittime et la «Lagune» de Poseidonia-Paestum. In Volcanologie et Archeologie; Albore Livadie, C., Widemann, F., Eds.; PACT 25 Volcanologie et Archeologie: Ravello, Italy, 1990; pp. 257–270. (In Italian) [Google Scholar]
  8. Longo, F. Poseidonia. Istituzioni, Società e Forme Urbane. In La Città; Greco, E., Ed.; Donzelli: Roma, Italy, 1999; pp. 365–384. (In French) [Google Scholar]
  9. Longo, F. Poseidonia. La CittàLucana e Romana: Continuità e Trasformazioni. In Immaginando Città. Racconti di Fondazione Mitiche, Forma e Funzioni Delle Città Campane; Rescigno, C., Sirano, F., Eds.; Soprintendenza per i Beni Archeologici di Salerno, Avellino, Benevento e Caserta prismi editrice politecnica srl: Napoli, Italy, 2014; pp. 254–257. (In Italian) [Google Scholar]
  10. Longo, F. Alcune riflessioni su Poseidonia in Età Arcaica: Il Teichos dei sibariti e l’apoikia Trafondazioni e rifondazioni. In Percorsi. Scritti di e per Angela Pontrandolfo; De Caro, S., Longo, F., Scafuro, M., Serritella, A., Eds.; Pandemos: Paestum, Italy, 2017; pp. 199–214. (In Italian) [Google Scholar]
  11. Rescigno, C. Il Santuario Di Athena: Il tempio e Le Sue Fasidi Vita. In Learmi di Athena, Graellsi; Fabregat, R., Longo, F., Zuchtriegel, G., Eds.; Arte’m: Napoli, Italy, 2017; pp. 45–51. (In Italian) [Google Scholar]
  12. Graells, R.; Longo, F.; Zuchtriegel, G. Le armi di Athena. Il SantuarioSettentrionale di Paestum; Arte’m: Napoli, Italy, 2017. (In Italian) [Google Scholar]
  13. Longo, F. Le Armi di ATena. I dati Dall’athenaion Di Poseidonia tra Greci e Lucani. In ArmivotIVeiN Magna Grecia; GRaellS, R., Longo, F., Eds.; RGZM: Mainz, Italy, 2018; pp. 25–42. (In Italian) [Google Scholar]
  14. Longo, F. From Poseidonia to Poseidonia. Reflections on the Origins and Early Decades in the Life of the Achaean Apoikia. In Gli Achei in Grecia e in Magna Grecia: Nuove Scoperte e Nuove Prospettive; Greco, E., Rizakis, A.D., Eds.; Annuario della Scuola di Atene, Monografie; All’insegna del Giglio: Firenze, Italy, 2019. [Google Scholar]
  15. Longo, F.; D’Antonio, A. I Materiali in Metallo Dell’athenaion di Paestum: Un Quadro di SintesiPreliminare. In Atti del II Convegno Internazionale di Studi—Dialoghi sull’Archeologia Della Magna Grecia e del Mediterraneo; Pandemos: Paestum, Italy, 2018; pp. 755–765. (In Italian) [Google Scholar]
  16. Longo, F.; Pontrandolfo, A. Da Cerere ad Athena: Per Una Storia Della Ricerca del Santuario Settentrionale. In Le armi di Athena. Il santuariosettentrionale di Paestum, GraellsiFabregat, Longo, Zuchtriegel; Arte’m: Napoli, Italy, 2017; pp. 31–44. (In Italian) [Google Scholar]
  17. Longo, F. Le Mura di Paestum.Antologia di Testi, Dipinti, Stampe grafiche e Fotografiche dal Cinquecento Agli Anni Trenta del Novecento, (Tekmeria 12); Pandemos: Paestum, Italy, 2012. (In Italian) [Google Scholar]
  18. Bamonte, G. Le Antichità Pestane; Stamperia della Biblioteca Analitica: Napoli, Italy, 1819. (In Italian) [Google Scholar]
  19. Maiuri, A. Dieci Anni di Scavo a Paestum (1929–1939). In I PrimiScavi di Paestum; Aurigemma, S., Spinazzola, V., Maiuri, A., Eds.; Ente alle Antichità e ai Monumenti della Provincia di Salerno: Salerno, Italy, 1986; pp. 35–80. (In Italian) [Google Scholar]
  20. Longo, F.; D’Antonio, A. I Metalli del Santuario Urbano Settentrionale di Poseidonia; Pandemos: Paestum, Italy, 2019. (In Italian) [Google Scholar]
  21. Brandonisio, M. Il Santuario Settentrionale di Poseidonia-Paestum: I monumenti. In Le Armi di Athena Greciai; GraellsiFabregat, R., Longo, F., Zuchtriegel, G., Eds.; Arte’m: Napoli, Italy, 2017; pp. 23–30. (In Italian) [Google Scholar]
  22. Krauss, F. Die Tempel von Paestum. I. der Athena Tempel und di Sogenante Basilika. 1Lieferung; Der Athena tempel: Berlin, Germany, 1959. (In German) [Google Scholar]
  23. Amato, V.; Aucelli, P.P.C.; Ciampo, G.; Cinque, A.; Di Donato, V.; Pappone, G.; Petrosino, P.; Romano, P.; Rosskopf, C.; Russo Ermolli, E. Relative sea level changes and paleogeographical evolution of the southern Sele plain (Italy) during the Holocene. Quat. Int. 2013, 288, 112–128. [Google Scholar] [CrossRef]
  24. Amato, V.; Anzalone, E.; Aucelli, P.P.C.; D’argenio, B.; Ferreri, V.; Rosskopf, C.M. Sedimentology and depositional history of the travertine outcropping in the Poseidonia-Paestum archaeological area. Rend. LinceiSci. Fis. 2012, 23, 61–68. [Google Scholar] [CrossRef]
  25. Amato, V.; Aucelli, P.P.C.; D’Argenio, B.; Daprato, S.; Ferraro, L.; Pappone, G.; Petrosino, P.; Rosskopf, C.M.; Russo Ermolli, E. Holocene environmental evolution of the coastal sector in front of the Poseidonia-Paestum archaeological area (Sele plain, Southern Italy). Rend. Lincei Sci. Fis. 2012, 23, 45–60. [Google Scholar] [CrossRef]
  26. Guy, M. La Costa, La Laguna e L’insediamento di Poseidonia-Paestum. In Paestum e La città e Il Territorio; Quaderno di Documentazione Dell’istituto Della Enciclopedia Italiana Treccani: Roma, Italy, 1990; pp. 67–77. (In Italian) [Google Scholar]
  27. D’Argenio, B.; Ferreri, V. Travertines as self regulating carbonate systems. Evolutionary trends and classification. FoldtaniKozlony 2004, 1343, 209–218. [Google Scholar]
  28. Budillon, F.; Pescatore, T.; Senatore, M.R. Cicli deposizionali del Pleistocene superiore-Olocene sulla piattaforma continentale del Golfo di Salerno (Tirreno meridionale). Boll. Soc. Geol. Ital. 1994, 113, 303–316. (In Italian) [Google Scholar]
  29. Aiello, G.; Barra, D.; De Pippo, T.; Donadio, C. Pleistocene Foraminiferida and Ostracoda from the Island of Procida (Bay of Naples, Italy). Boll. Soc. Geol. Ital. 2012, 51, 49–62. [Google Scholar]
  30. IdsGred Software. Available online: https://idsgeoradar.com/products/ground-penetrating-radar (accessed on 21 July 2019).
  31. GPR-SLICE7.0 Software. Available online: https://gpr-survey.com/ (accessed on 21 July 2019).
  32. Conyers, L.B.; Goodman, D. Ground Penetrating Radar: An Introduction for Archaeologists; AltaMira Press: Walnut Creek, CA, USA, 1997. [Google Scholar]
  33. Goodman, D.; Piro, S. GPR Remote Sensing in Archaeology; Geotechnologies and the Environment; Springer: Berlin, Germany, 2013. [Google Scholar]
  34. Mauriello, P.; Patella, D. A data-adaptive probability based fast ERT inversion method. Prog. Electromagn. Res. 2009, 97, 275–290. [Google Scholar] [CrossRef]
  35. Patella, D. Introduction to ground surface selfpotential tomography. Geophys. Prospect. 1997, 45, 653–681. [Google Scholar] [CrossRef]
  36. Mauriello, P.; Patella, D. Resistivity anomaly imaging by probability tomography. Geophys. Prospect. 1999, 47, 411–429. [Google Scholar] [CrossRef]
  37. Amato, V.; Cozzolino, M.; De Benedittis, G.; Di Paola, G.; Gentile, V.; Giordano, C.; Marino, P.; Rosskopf, C.M.; Valente, E. An integrated quantitative approach to assess the archaeological heritage in highly anthropized areas: the case study of Aesernia (southern Italy). ACTA IMECO 2016, 5, 33–43. [Google Scholar] [CrossRef]
  38. Compare, V.; Cozzolino, M.; Mauriello, P.; Patella, D. Resistivity probability tomography at the Castle of Zena (Italy). EURASIP J. Image Video 2009, 2009, 693274. [Google Scholar] [CrossRef]
  39. Cozzolino, M.; Di Giovanni, E.; Mauriello, P.; Vanni Desideri, A.; Patella, D. Resistivity tomography in the Park of Pratolino at Vaglia (Florence, Italy). Archaeol. Prospect. 2012, 19, 253–260. [Google Scholar] [CrossRef]
  40. Cozzolino, M.; Mauriello, P.; Patella, D. Resistivity Tomography Imaging of the substratum of the Bedestan Monumental Complex at Nicosia, Cyprus. Archaeometry 2014, 56, 331–350. [Google Scholar] [CrossRef]
  41. Rose, D.; Cozzolino, M.; Mauriello, P. Preliminary notes of the research on the Roman aqueduct of Alba Fucens (AQ) in Italy. The geophysical prospecting in the study of the free-flowing channel and the inverted siphon. Babesch 2015, 27, 107–112. [Google Scholar]
  42. Rizzo, M. Aree e Quartieri Artigianali in Magna Grecia; Pandemos: Paestum, Italy, forthcoming 2020. (In Italian)
  43. Pescatore, T.S.; Viggiani, C. La geologia della Piana dei Sele e caratteri del sottosuolo dell’area di Paestum. PACT 1989, 32, 29–42. (In Italian) [Google Scholar]
  44. Carando, E.; De Bonis, R.; Ficuciello, L. IndaginiStratigrafiche Sulla Plateia B: Il LatoOvest. In Paestum. Scavi, Studi, Ricerche. Bilancio di un Decennio (1988–1998); Greco, E., Longo, F., Eds.; Pandemos: Paestum, Italy, 2000; pp. 177–180. (In Italian) [Google Scholar]
  45. Jannelli, L. Il Settore Nord-Orientale. In Paestum Scavi, Studi, Ricerche. Bilancio di un Decennio (1988–1998); Greco, E., Longo, F., Eds.; Pandemos: Paestum, Italy, 2000; pp. 91–96. (In Italian) [Google Scholar]
Figure 1. (a) Location of Greek–Roman Poseidonia-Paestum; (b) location of the Temple of Athena within the perimeter of the city walls; (c) view of the Temple of Athena from the southwest.
Geosciences 09 00324 g001
Figure 2. Location of archaeological trenches and boreholes dug during the last century around the Temple of Athena, superimposed on a GoogleEarthTM satellite image.
Geosciences 09 00324 g002
Figure 3. Schematic geological map of the southern sector of the Sele river alluvial-coastal plain (from Amato et al., 2013, modified). A: modern beach; B: fluvial deposits (Holocene); C: Sandy dunal ridge (Late Holocene); D: Sandy dunal ridge (Early Holocene); E: Sandy dunal ridge (Upper Pleistocene, MIS5); F: Clay and silt of retro-dunal depression (Upper Pleistocene–Holocene); G: Marshy deposits (Holocene); H: Lower Paestum Travertine (Upper Pleistocene–Early Holocene), (1) Cafasso Unit (Middle-Late Pleistocene, before 50 ka BP), (2) Gaudo Unit (late Middle Pleistocene–Late Pleistocene), (3) Paestum Unit (Late Pleistocene–Early Holocene), (4) Mancone Unit (Middle Holocene), (5) Arcione Unit (Middle Holocene: before 2.5 ka BP), (6) Spinazzo Unit (Holocene: 2.5–1.7 ka BP); I: Upper Paestum Travertine (Late Holocene), (7) Linora and Fossa Lupata Unit (Holocene: after 1.7 ka BP), (8) Licinella Unit (Holocene: Middle Age-Present); J: Porta Marina palaeocliff (Early Holocene); K: Paestum city walls; L: Athena temple.
Geosciences 09 00324 g003
Figure 4. The location of the ground penetrating radar (GPR) (a) and electrical resistivity tomography (ERT) surveys (b).
Geosciences 09 00324 g004
Figure 5. GPR radargrams across lines 03, 09, 15 and 23, drawn in Figure 4a, showing shallow sub-horizontal layers (green arrows) and deep steeper layers (pink arrows).
Geosciences 09 00324 g005
Figure 6. Geoelectrical pseudosections across profiles 07, 17, 18 and 24, drawn in Figure 4a.
Geosciences 09 00324 g006
Figure 7. Geomorphological map of the Paestum archaeological area with 1 m contour lines (a), showing the main landforms, superimposed on a Google EarthTM satellite image, and travertine outcrops map close the Athena temple (b).
Geosciences 09 00324 g007
Figure 8. Schematic stratigraphic logs of the boreholes carried out close to the Temple of Athena, modified and redrawn by Pescatore and Viggiani [43].
Geosciences 09 00324 g008
Figure 9. GPR horizontal slices superimposed on a Google EarthTM satellite image; the slices are relative to the depth ranges 0.2–0.4 m (a), 1–1.2 m (b) and 2–2.20 m (c).
Geosciences 09 00324 g009
Figure 10. Three-dimensional view of ERT 01 and 02 and their spatial relationship with the temple.
Geosciences 09 00324 g010
Figure 11. Three-dimensional view of the probability-based ERT (a) and representations limited to the anomalies including values greater (b) or lower (c) than 398 Ωm.
Geosciences 09 00324 g011
Figure 12. Sequence of vertical tomography sections oriented in the N–S direction.
Geosciences 09 00324 g012
Figure 13. Sequence of vertical tomography sections oriented in the W–E direction.
Geosciences 09 00324 g013
Figure 14. Horizontal tomography sections relative to the depths of 1 m (a) and 2 m (b), superimposed on a Google EarthTM satellite image.
Geosciences 09 00324 g014
Figure 15. The southeast side of the temple with the trench between the first and third columns (Trench A) ((a): photo E. Samaritani, 1937), dug during the excavations carried out between 1928 and 1939 ((b): a sketch of Maiuri’s excavations), and excavation along the foundations of the south side (Trench C) ((c): photo E. Samaritani, 1937).
Geosciences 09 00324 g015
Figure 16. Photos of stratigraphical survey No. 242. (a) The southern border of Maiuri’s trench C (1986), which came to light only a few decimeters from the surface; (b) the cut of trench C and its subsequent backfill with travertine chips and blocks; (c) the stratigraphy of the east part of trench 242; (d) the beaten-earth floor strewn with remains of the collapsed roof.
Geosciences 09 00324 g016
Figure 17. Photo of the stratigraphical survey No. 243 trench excavation.
Geosciences 09 00324 g017
Figure 18. (a) Conceptual geomorphological and geological models of Paestum travertine mounds and (b) ERT data.
Geosciences 09 00324 g018
Table 1. Maximum and mean apparent resistivities in Ωm along the profiles.
AreaProfileρa, Minρa, Maxρa, Mean
10189.721246.45583.35
10255.842886.831296.42
103215.091342.13525.23
104116.23774.08386.52
10585.76604.75343.01
10658.05718.79332.50
107123.75671.18364.03
10882.10856.77434.46
10989.841023.57516.03
110213.001837.72691.69
111188.912603.75708.92
112296.773421.57747.52
113200.554448.58747.27
114345.072094.18841.12
115346.031683.64860.03
116406.331749.84946.32
117333.612186.82995.31
218203.78840.94407.26
219200.43829.80396.37
220200.56743.30414.36
221191.32810.94418.76
222181.20760.47407.63
223182.52773.87393.24
224100.21977.64373.25