Abstract
We measured the ultrasonic properties and microstructure of two-phase binary mixtures of the ice–ammonia partial melt system, which was selected based on its importance for numerous planetary bodies. The equilibrium microstructure of ice–ammonia melt was examined using a light microscope within a cold room. The measured median dihedral angle between the solid and melt at 256 K is approximately 63°, with a broad distribution of observed angles between 10° and 130°. P-wave velocities in the partially molten samples were measured as a function of temperature (177 < T(K) < 268) and composition (1–6.4 wt % NH3). Vp decreases approximately linearly with increasing temperature and melt fraction. We compare the results of this study to those of other potential binary systems by normalizing the datasets using a vertical lever (TL–TE) and articulating the potential effects on the mechanical behavior and transport capabilities of partially molten ice in icy satellites.
1. Introduction
Although the surfaces of icy bodies of the outer solar system are dominated by water ice, near-infrared spectrometry has identified non-ice phases on many satellites. In particular, hydrated ammonia has been suggested as a possible component on the surfaces of Enceladus [1,2,3,4,5], Titan [6], Triton [7], Charon [8,9], Miranda [10], and various Kuiper Belt objects [11]. The seemingly ubiquitous presence of this impurity phase in proximity to ice, and its probable role in cryovolcanism [12,13,14] requires that we consider the effect of ammonia on the microstructural and mechanical properties of ice.
One of the most interesting properties of ammonia for a planetary context is its profound anti-freezing effect. As shown in the equilibrium phase diagram (Figure 1), the liquidus on the H2O–NH3 phase diagram is the temperature-versus-composition curve above which the solution is entirely liquid. The solidus is, in the case of this simple binary system, the horizontal line, or isotherm, below which the phases are entirely solid. For this system, at 1 atm, the eutectic melting temperature is 175.4 K (at 35.4 wt % NH3) [after [2]; and references therein], which is relatively “deep” compared to many other ice + salt systems [15]. There is also a peritectic point at 176.2 K (at 32.16 wt % NH3), such that melting of the solid phase at this composition (ammonia dihydrate, D in Figure 1) occurs incongruently to form a more concentrated liquid and some additional water ice [2]. As seen in Figure 1, there is a broad region of liquid + ice phase space in which, even at very dilute bulk compositions, a melt phase is thermodynamically stable with ice. This would equate to a significant range of temperatures/depths of partial melt stability within an icy body’s crust.
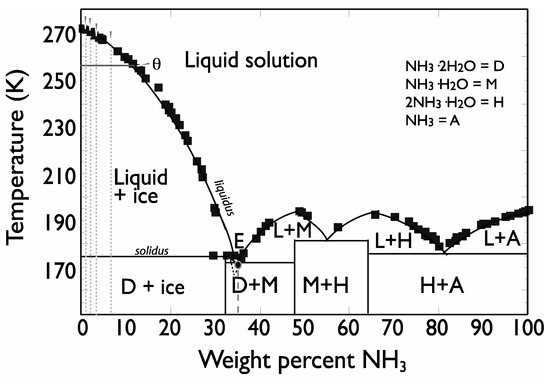
Figure 1.
Annotated equilibrium phase diagram for H2O–NH3 at P = 1 atm. Data comes from [2] and references therein. Dashed vertical lines represent bulk compositions of samples used for P-wave velocity measurements in this study. Horizontal line represents isotherm at which dihedral angle was measured in this study.
The mechanical and transport properties of partially molten material are heavily dependent on the distribution of melt within the aggregate. For a two-phase system, the position of the melt with respect to the grains is described by the wetting angle, also called the dihedral angle, which is the angle subtended at the corner of fluid-filled pores. The dihedral angle θ is governed by the relative surface energies γ of the solid/solid (subscript SS) and solid/liquid (subscript SL) interfaces by a simple force balance
as illustrated in Figure 2 [16,17,18,19]. The dihedral angle for a given system directly translates to the mobility of the melt. It is generally considered that when θ < 60° the liquid phase at any melt fraction can extend beyond triple junctions into tubes that form an interconnected system of fine channels within the solid, but when θ > 60°, a minimum melt fraction is required before interconnectivity is established and the liquid may become trapped in isolated pockets, or pores [18].
cos(θ/2) = (γSS/2γSL)
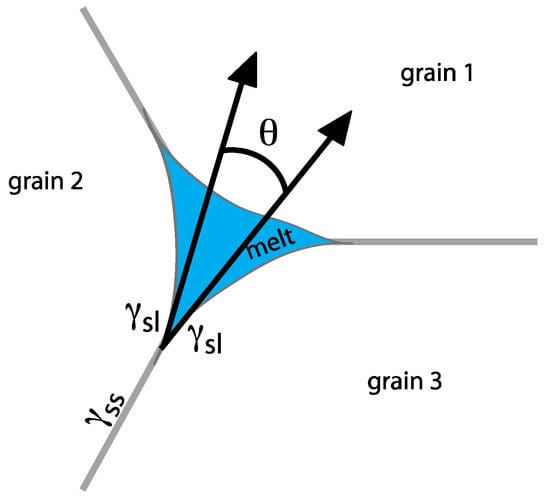
Figure 2.
Schematic diagram of a triple junction containing melt between three ice grains. The morphology of the melt phase is characterized by the dihedral angle θ, which is a function of the relative solid–solid and solid–liquid interfacial energies.
The reduction of wave speed velocities and related elastic properties as a result of partial melt has significance for a variety of Earth and planetary contexts. For instance, seismic studies have determined a sharp transition in seismic velocities at Earth’s lithosphere–asthenosphere boundary that has been suggested to be due to the onset of melting [20,21]. Partial melt has also been linked to observations of low velocities and strong scattering at the core mantle boundary [22] and the inner core boundary [23,24]. Laboratory studies of shear wave velocities in texturally equilibrated silicate melt systems indicate significant drops in velocity compared to melt-free systems [25,26]. Theoretical treatments posit that the magnitude of the drop is a function of the melt fraction and the geometry of the melt. The olivine + basalt melt system is one of those systems known to have θ < 60°, making that geometry the subject of much inquiry. Both theoretical and experimental studies have found that when θ < 60°, melt significantly affects not only the elastic properties, but also permeability, electrical conductivity, and rheology. For instance, it has been observed that even a small amount of melt can lower viscosity by an order of magnitude or more in silicates [27], organic analog systems [28,29], and ice [30,31,32,33]. In a study of ice doped with only trace amount (1–15 ppm) of sulfuric acid, researchers found a pronounced reduction in viscosity compared to undoped ice, suggesting that in the case of ice, the critical melt fraction may be vanishingly small [34]. Even when θ > 60°, studies have shown that interconnectivity can occur at high enough melt fractions or in irregular media [35,36].
Since there is no a priori method of estimating a system’s dihedral angle without knowing surface and grain boundary energies, which are sparse in the literature, it must be measured directly [37,38], usually by creating and imaging polished sections of partial melt samples that are believed to be at textural equilibrium and analyzing the 2-D image [39]. Although modern methods involving 3-D X-ray tomography provide exciting means of accurately capturing the interconnectivity of melt networks [40,41], the 2-D method still provides a reliable characterization of partial melt samples, particularly if done with a significant number of measurements. Dihedral angles have been measured by this method for several Earth and planetary systems, including basalt + melt [38,42,43], silicate + iron alloy [44,45], water ice [46,47,48,49], and several ice-rich binary systems [50,51,52]. Here we will collate previously published dihedral angles for several systems of significance to icy satellites. In addition, we have measured the dihedral angle for the ice–ammonia system, which, to the best of our knowledge has not been published previously.
The mechanical behavior (elasticity, viscosity, and anelasticity) of a partially molten system is known to depend not only on the dihedral angle, but also on melt fraction, which is controlled by temperature and/or bulk composition. Viscosity and anelasticity of ice–ammonia is beyond the scope of this paper, but viscosity of the system has been studied previously [31,32]. In this study, we measured P-wave speeds within partial melt samples of the H2O–NH3 system. We will compare our measured P-wave velocities to previous measurements on other partial melt systems and to theoretical treatments.
2. Materials and Methods
2.1. Sample Preparation
In order to characterize the effect of a partial melt phase on the mechanical and microstructural properties of ice, samples with varying bulk composition were created. The two-phase samples were fabricated following an adaptation of the “standard ice” method that controls grain size and porosity in polycrystalline ice samples [53]. The method utilized seed ice made from degassed, distilled water. The seed ice was ground and sieved to a desired size range (105–250 μm). The grains were pressed into rectangular molds, the air was evacuated, and, for this study, were flooded with cold liquid solution at a temperature consistent with the liquidus temperature at the applicable bulk composition (down arrows in Figure 1). Once flooded completely, samples were directionally frozen within a chest freezer (~245 K). The liquid solution was made from dilute reagent grade ammonium hydroxide (RICCA Chemical Company) used either as is or diluted further, depending on the desired final composition (Table 1). The method created samples with uniform grain size that, with melt present, were relatively large (~2 mm). After solidification was complete, samples were removed from the mold by briefly warming the outside, removing the sample and then immediately returning them to the storage temperature (256 K). For ultrasonic testing, a 50 mm diameter hole saw was used to core out cylinders from the rectangular samples. The ends of the cored cylinders were ground flat with 100-grit sandpaper and lengths were ~50 mm (Table 1). Four samples, each with different bulk composition, were made for ultrasonic testing and three separate samples were created for microstructural characterization. Bulk compositions of ultrasonic testing samples (as determined by refractive index, described in the Appendix) are denoted by vertical dashed gray lines in Figure 1 and provided in Table 1.

Table 1.
Sample characterization for ultrasonic tests.
2.2. Ultrasonic Testing
Acoustic measurements were made by determining the travel time of a compressional pulse (a P-wave) through a short, cylindrical sample [54]. A double-walled cryostat was fabricated to measure P-wave velocities under controlled temperature (Figure 3). The cryostat inner-wall creates the sample chamber and is made of 50 mm ID aluminum tubing with a wall thickness of 6 mm. The outer-wall was made of 76 mm ID polyvinyl chloride tubing. A circulating fluid chiller pumped a methanol-water mixture between the two walls. A pair of flow-control baffles placed between the two walls and at either end of the sample created fluid circulation around the sample chamber. This circulation and the chamber wall thickness act to minimize temperature variations within the sample chamber. The cryostat endplates are two-piece, consisting of a 13 mm thick ultra-high-molecular-weight polyethylene (UHMW) plate for insulation and a 9.5 mm thick aluminum plate for stiffness. The ends are attached to the double-walls via four external tie-rods and sealed with silicone gaskets. The cryostat has an additional aluminum plate at the top that acts as a lid. An air–foil insulation jacket encases the sample chamber assembly. A pair of Type T thermocouples monitored sample surface temperature during the tests. Samples were placed in the pre-chilled cryostat (< 250 K) and allowed to come to equilibrium for 1 hour at a minimum, until thermocouple readings were stable. The P-wave velocities were measured using an ultrasonic measurement system (Pundit PL-200, Proceq SA, Schwerzenbach, Switzerland), which employs a transducer on either side of a sample and a touchscreen controller. Vacuum grease was used as a couplant between the sample and transducers to help fill any irregularities on the ends of the sample and improve the contact. The system transmits a pulse at 54 kHz and measures the first-arrival times. Velocity VP was then determined by dividing the length of the sample by the travel time. The method depends on the accuracy of choosing the pulse arrival times, which is subject to signal noise and is affected by the gain settings, as described below. The measurement uncertainty is provided in the next section. When a new temperature was set, the system was allowed to come to equilibrium temperature before new measurements of travel time were taken. A reading was taken once the sample was at a stable temperature, and the VP calculated based on sample dimensions.
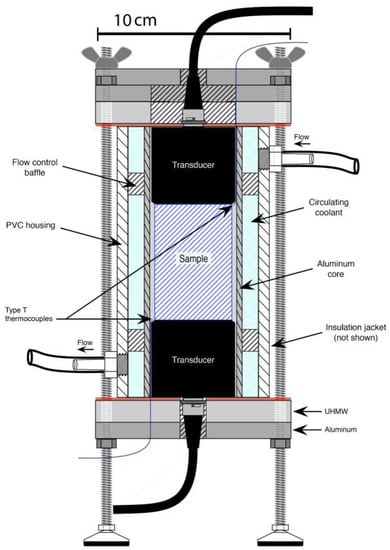
Figure 3.
Schematic of the ultrasonic tester within its cryostat. Transducers are held on either side of the cylindrical sample and connect to a touchscreen controller. Circulating fluid controls the temperature, which is monitored by thermocouples.
2.3. Microstructural Characterization
Cross-sectional imaging of samples was accomplished using a light microscope (DM2700 Leica Microsystems, Wetzlar, Germany) located within a cold room (T = 256 K). Samples were first microtomed to a mirror finish [55], and imaged in reflected light at ×2.5 magnification and recorded with a digital camera (Dino-Eye, 5 megapixel, 2592 × 1942). Samples of various water-rich bulk compositions were imaged and analyzed, as described in Table 2. Samples were stored between 120 and 550 hours to achieve textural equilibrium and were imaged within the same cold room, so the measurements represent the equilibrium structure at this temperature.
Table 2.
Sample characterization for dihedral measurements.
The 2-D method for measuring dihedral angles in partial melt systems has been utilized for several decades. Since crystalline anisotropy with respect to surface energy and grain boundary orientations can influence the wetting angle, it is considered that a single or median dihedral angle measurement does not adequately describe the system [56]. Rather, a statistically significant number of images need to be taken of each sample so as to determine the distribution function of the dihedral angle [57]. Two forms of measuring dihedral angle from the images were used in this study. The first was to measure all angles digitally using the imaging software ImageJ, in which two lines were scribed onto the image and the program calculated the angle between them. Additionally, a subset of the microstructural images was analyzed by hand from printed images. A significant total number of angles (approximately 1050) were measured to calculate the mean and median dihedral angle, distribution of measurements, and 95% confidence intervals, as determined by the nonparametric technique of [56]. Certain errors are inherent in the measurement of apparent dihedral angles, including the individual’s interpretation of the angle placement in the case of shadows or irregularly shaped grains. A distribution of measured angles represents a combination of measurement error and, more importantly, real differences in anisotropic surface energy and grain orientations, which will be discussed further in Section 4.
2.4. Calculation of Melt Fraction
Mass fraction of the melt phase can be calculated using the lever rule and the phase diagram (Figure 1), according to
Since there is little to no solid solution in system H2O–NH3, ws is essentially zero, so that the right-hand side of Equation (2) becomes wC/wl, the bulk composition divided by the composition of the liquidus at the temperature of interest.
wl = (ws − wC)/ws − wl.
3. Results
3.1. Ultrasonic Measurements
P-wave velocity measurements for ice–ammonia as a function of temperature and bulk composition are shown in Figure 4. Data from the three samples are compared to that of pure bubble-free ice from [58]. In all cases, velocities decrease with increasing temperature, by −6.1 m/s per degree (R2 = 0.761) for sample 1 (2.7 wt % NH3); −4.3 m/s per degree (R2 = 0.586) for sample 2 (2.1 wt % NH3); −1.1 m/s per degree (R2 = 0.852) for sample 3 (6.8 wt % NH3); and −6.3 m/s per degree (R2 = 0.737) for sample 4 (1.7 wt % NH3). That these linear fits to the data vary is likely due to the fact that they span different temperature ranges and that the dV/dT relationship is likely not linear over all temperatures. There is a significant reduction in the wave speed velocity as wt% NH3 increases in the samples. Error for P-wave velocity measurements comes from simple theory of error propagation [59]. Since VP = d/t, where d is distance or length of sample and t is travel time,
or
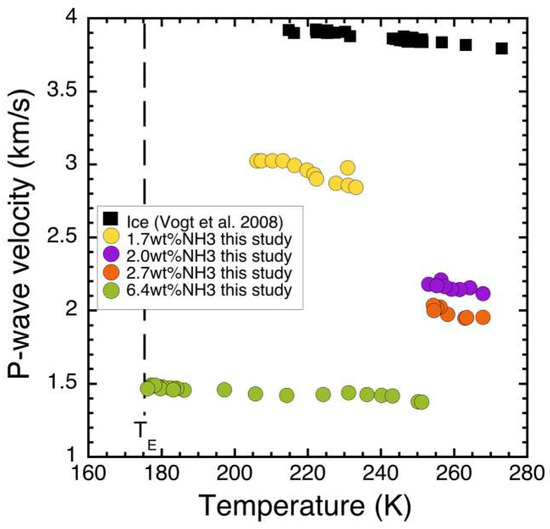
Figure 4.
P-wave velocities (at 54 KHz) in ice containing 1.7–6.4 wt % NH3 as a function of temperature, compared to pure ice [58].
The values of Δt and Δd are ±1 × 10⁻⁷ and ±2.54 × 10⁻⁵, respectively, as determined by the precision of the ultrasonic tester.
The effect of gain settings on the ultrasonic measurements is shown in Figure 5. Gain is used to amplify the wave signal. We observed that at higher melt fractions, a higher gain setting compensated for the damping of wave energy due to dispersion in the less elastic medium, allowing us to ‘pick’ the P-wave arrival times. For our samples, we employed 20× and 50× gain to produce a stable reading. Generally, for a given wave, a higher gain setting (50×) showed a P-wave travel time that was between 10 and 20 m/s faster than the lower gain setting (20×), as determined by the measurement system selecting an earlier time for the wave break with greater amplification.
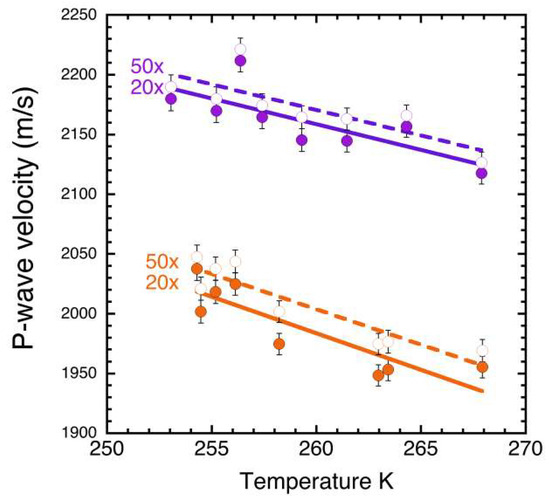
Figure 5.
P-wave velocities (at 54 kHz) at two compositions (2.0 and 2.7 wt%NH3, as in Figure 4), demonstrating the systematic effect of gain setting on the measurements. The error bars are shown here and described in Section 3.1.
3.2. Microstructural Characteristics
Representative microstructures of partially molten ice–ammonia samples are shown in Figure 6. Although concave, pseudotriangular-shaped melt pockets, or nodes, at junctions of three grains were the predominant morphology, a variety of melt configurations were observed. In some cases, the melt tubules connecting between nodes can be seen (arrow in Figure 6c).
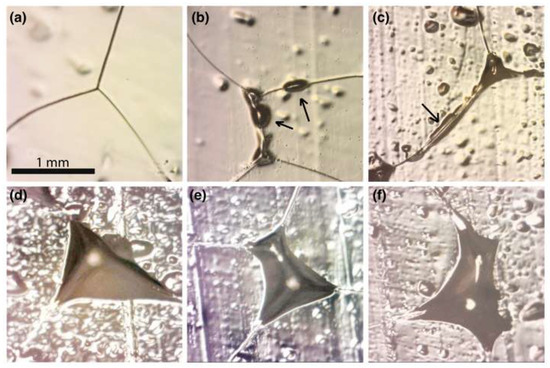
Figure 6.
Representative micrograph images from ice–ammonia system at −17 °C, showing: (a) dry boundaries; (b) melt blebs between two grains; (c) melt between three grains, including a channel connecting the triple junctions; (d) melt between three grains (by far the most common morphology); (e) four grains; and (f) five grains.
Details for digital and hand analyses of the three samples measured are provided in Table 2. These are a different set of samples than those used for acoustic measurements described in Section 3.1. The hand measurements are a subset of the digital measurements and alone are not statistically significant. Though generally similar, the hand measurements have a smaller mean value than the digitally measured. This is because, for the former, only clear melt pockets between three or more grains were chosen. For instance, none of the blebs in Figure 6b were measured by the more selective hand measurement. Whereas the digital analysis included every possible melt feature. The inclusivity resulted in a wider distribution and larger mean value. Figure 7a–c are histograms of the measured results for 1.4 wt%, 2.7 wt% and 3.4 wt% NH3. The average angle for the entire set of 1052 measurements was 64.5°. However, measured angles ranged from 10° to 130°. The distribution does not represent an error in measurement, but rather the distribution of angles related to geometry and orientation. Since a cross section represents a 2-D sampling of a 3-D feature, grain edge intersections will be at random orientations to any planar cut through the sample [37]. Following the method put forth by [56], in which confidence intervals are established as a function of different samples sizes, we provide, in addition to mean and median values, the 95% confidence values in Table 2. Using the median value of 63° (± 5° from 95% confidence) the well-known solid–solid interfacial energy γSS of ice (65 mJ m−2; [46,60], and Equation (1), we estimate that the solid–liquid interfacial energy γSL for this system, at 256 K, is 38 ± 1.1 mJ m−2, which is higher than that reported in the literature for pure H2O in contact with ice (33.0 ± 0.6 mJ m−2 [46]; 34.0 ± 0.07 mJ m−2 [47] and sulfuric acid in contact with ice (33.4 ± 0.1 and 33.8 ± 0.3 mJ m−2 at T = 238 and T = 218, respectively [52].
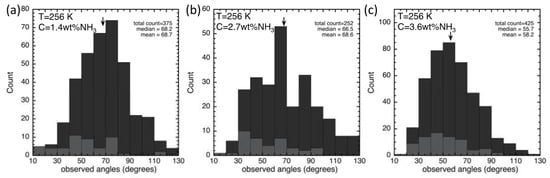
Figure 7.
Histograms of dihedral angles measured in the H2O–NH3 partial melt system. Samples with bulk composition of (a) 1 wt % NH3, (b) 2.7 wt % NH3, and (c) 3.6 wt % NH3 (as determined by refractive index) were held at T = 256 K for 121–552 h and imaged in a cold room at the same temperature. Images were analyzed digitally (dark gray) and by hand (light gray) as provided individually in Table 2, whereas the arrow and results in the right upper corner of each distribution are for the combined total.
Compositions of all samples used in acoustic measurements and microstructural analyses were determined by refractive index measurement and are plotted on the calibration curve provided in the Appendix.
4. Discussion
4.1. Effect of Partial Melt on Microstructure
The equilibrium microstructures of several ice-rich systems have been previously measured (Table 3). Most reported dihedral angle values are in the range of 20–30° [46,47,52]. Although no systematic study of dihedral angle in the ice–ammonia system has been published, a meeting abstract noted that in compositions below 1 wt% NH3, dihedral angle was ≤20° [61]. That study utilized a cryo-SEM to image sample structure, which is likely superior to our use of a light microscope; however, they did not provide a distribution or quantitative analysis of the measurements. That our median value is higher than previous observation likely reflects several main points. One is that in imaging samples at suprasolidus conditions (here, the cold room temperature, 256 K) the melt phase is mobile and can potentially move during transport from microtome to microscope, creating shadows and voids that make it difficult in some cases to measure the true angle. In a cryo-SEM, the melt is quenched, usually at liquid nitrogen temperatures (T = 77 K), and thus as a solid, can be imaged at any angle [50,52]. In future studies, we will evaluate the melt microstructure of this system at quenched temperatures.
Table 3.
Reported dihedral angles for several ice binary systems.
Another potential source for the discrepancy between this study and the previous observation is temperature. Our study was conducted at 256 K, with samples annealing at this temperature for very long periods of time. It is not clear what the equilibrium temperature was prior to quenching in the previous study, but it is likely that it was within the range of mechanical testing (160–220 K), therefore, significantly lower. Since liquid compositions vary according to temperature (along the liquidus; Figure 1), it is to be expected that solid–liquid interfacial energies, and thus dihedral angle, would change as a function of temperature. In a study of dihedral angle in the borneol-diphenylamine binary system, a linear decrease in θ with increasing temperature was measured [38]. A slight decrease in θ with increasing temperature was also observed in the ice + sulfuric acid system, albeit over a short range and only determined by two values [52]. In this study, we have only measured dihedral angles at one temperature, so we cannot draw conclusions about this system’s temperature dependence. However, if it bears resemblance to these other studies, then for this system, at lower temperatures (such as those in [61]), we might expect the median angle to be higher still, not lower, and thus also have higher γSL.
Rather, the most likely reason for the discrepancy is in the distribution of angles measured and number of measurements. As seen in Figure 7, the range of observed dihedral angles in our study varies from 10° to 130°. If one were to only take one or two images, it would be highly unlikely to observe the same θ as the median value determined over 1050 measurements. More importantly, the wide distribution reflects real differences in surface energies for different faces of the ice crystalline structure. A recent study using a capillary wave method measured the solid–liquid interfacial free energy of water and various ice Ih surfaces and found a range from γSL = 33 mJ m−2 on the basal plane up to γSL = 36.9 mJ m−2 for the () surface [62]. These values would translate to a dihedral angle spread between 20° and 56.5° for an ice + water system (following Equation (1)). Although it is beyond the scope of this present study to determine which crystallographic planes might correspond to the highest (130°) and lowest (10°) measured angles, the fact that the spread includes both connected (θ < 60°) and trapped (θ > 60°) angles suggests that both morphologies exist and are determined by local orientation of grains.
4.2. Effect of Partial Melt on P-Wave Velocities
Figure 4 and Figure 5 demonstrate that melt has a large effect on P-wave velocities, which corresponds to seismic wave velocities and is proportional to elastic moduli. Previous studies on P-wave velocities in ice + salt and ice + KCl systems demonstrate similar reductions of velocities with increasing solute concentration [51,63]. Those studies on ice binary systems captured the distinct reduction in velocity right at the onset of melting, that is, at the eutectic temperature TE. This characteristic drop has also been seen in a variety of other partial melt systems, including basalt + melt [25,64], and borneol + diphenylamine [38].
Normalization with Eutectic Temperatures
Considering the similarities in form, we can compare the P-wave velocity vs. temperature plots of the three ice binary systems (ice–ammonia from this study; ice–salt from Spetzer and Anderson, 1968; and ice–KCl from [51]. However, since each of those three systems has a different TE and thus a different ‘depth’ of the ice + liquid field (Figure 1), the data need to be normalized accordingly. Using an adaptation of Equation (2), we normalize the three datasets by a ‘vertical lever’ defined by TL–TE, the temperature span between the liquidus and the solidus at the bulk composition of interest. Additionally, studies often vary in their magnitudes of ultrasonic measurements [58]. To remove lab to lab variations and focus on relative values due to temperature and composition, the measured VP values are normalized by the VP value taken just before melting, VPTE, which in [63] and [51] is a VP value nearly identical to pure ice at that temperature.
Incorporating both the vertical lever rule for temperatures, and the normalized P-wave velocities, Figure 8 shows the result of the normalization, according to
VP/VPTE vs. (TL − T)/(TL − TE)
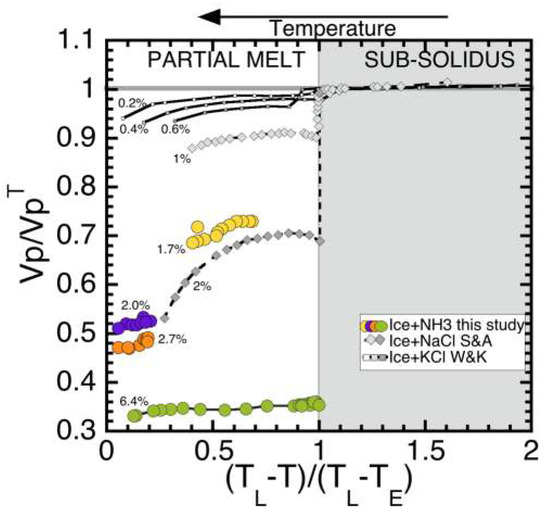
Figure 8.
Normalized P-wave velocities versus normalized temperature for three different ice binary systems. TE for ice + KCl is 262.45 K; TL was estimated at 273, since reductions were only 0.1, 0.2, and 0.3 of a degree below Tm [51]. TE for the ice + salt system is 251.85 K and TL was estimated as 272 and 271 at 1 wt % and 2 wt %, respectively [63]. TE for ice–ammonia is 175.4 K; TL was estimated at 272, 271, 270, and 262, for 1.7 wt %, 2.0 wt %, 2.7 wt %, and 6.4 wt %.
The right side of the plot is for temperatures below the solidus, where VP values are essentially the same as pure ice (gray line at VP/VPTE = 1). The left side of the plot shows the reduction of velocity with increasing wt% of the secondary phase. Although our study did not capture the subsolidus values, based on the results of the previous studies (and extrapolation of [58] pure ice data down to 176 K, where VP ≈ 4.146 km/s), we predict VPTE and normalize our data. As shown in Figure 8, values for 2.0 wt% from our study are consistent with the 2 wt% data for the ice + NaCl system [63]. This plot shows the distinct effect that increasing amounts of melt can cause on wave speed velocities, which are analogous to elastic properties. Although we were not able to measure the S-wave velocities at this time, future work will focus on this and calculate related moduli.
In their study of P- and S- wave velocities in ice + saline, researchers observed a distinct hysteresis in the wave speed singularity depending on whether they were increasing or decreasing in temperature [63]. When warming from subsolidus conditions (colder than the eutectic temperature), they observed a sharp dip in VP right at the eutectic temperature. However, when cooling from suprasolidus conditions, there is a delay in the onset of the increased speeds (their Figure 4), such that the system was able to supercool by 1.5 to 2.5 degrees. This is because there is an energy barrier to nucleation, but no such barrier to melting. Although not a part of this project, we anticipate that all ice binary systems would display a similar hysteresis, and this is likely the reason we were not able to measure subsolidus values in our study (specifically sample 3), which was conducted in a decreasing temperature excursion.
4.3. Applications to Icy Satellites
In this study, samples were not strained or pre-deformed. All measurements reflect isotopic ice grains in samples, as fabricated. When considering application to icy satellites, where significant accumulated strain may exist, one must consider that a fabric or crystallographic orientation may have formed. The results from this study suggest that this orientation may limit/enhance the direction of melt mobility in a partial melt system. Such heterogeneous melt distribution on the microscale could contribute to macroscopic melt structures [65]. Considering that rheological and transport properties are greatly affected by melt content and permeability, this suggests that significant mechanical and compositional localization could occur in an icy shell.
In icy satellite applications, the rate of oxidant supply from surface ice to a global ocean to enable the redox reactions necessary for life [66] depends critically on the availability and transport capabilities of a melt phase through ice [67]. The range of dihedral angles reported here indicates a path may exist for communication between the surface and the deep crust through the mobility of the melt in the system [68,69]. Such communication would of course depend on the availability of melt at shallow conditions, which would in turn depend on heat generation and salt/ammonia concentrations. Localized frictional heating of ice + ammonia, which could occur at tidally loaded fault systems, is currently being studied in our lab [70].
Based on the growing count of planetary bodies containing some quantity of ammonia in contact with ice, additional efforts should be devoted to understanding the full range of rheological properties of the ice–ammonia system. For instance, ammonia at the grain scale could affect fatigue and failure stress within a relentlessly stressed icy moon [71]. Additional studies to characterize S-wave velocities and attenuation in this system are recommended.
5. Conclusions
The acoustic and equilibrium microstructure of samples of ice–ammonia solution have been measured. The median dihedral angle at 256 K is 63°, with a broad distribution of values reflecting anisotropic ice surface energies. The P-wave velocities of the partial melt system are significantly lower than those of pure ice at similar conditions: the velocities decrease with increasing temperature, and decrease with increasing ammonia content. Results are consistent with other ice binary systems and can be normalized to create a master plot of VP/VPTE versus normalized temperature by a vertical lever rule formulation.
Author Contributions
Conceptualization, writing, and supervision, C.M.; Fabrication, testing, and supervision, M.A.N.; Ultrasonic testing and error analysis, A.N.C. and J.S.M.; Sample characterization and statistics, A.A.D.
Funding
This work was partially supported by NASA #NNX13AL01G (to CM). Lamont–Doherty contribution number 8637.
Acknowledgments
Authors thank Vishaal Singh and three anonymous reviewers for helpful comments. Authors thank Maheenuz Zaman for technical assistance with ultrasonic testing. Micrographs used for this paper are available upon request.
Conflicts of Interest
The authors declare no conflict of interest.
Appendix A. Refractive Index
Bulk compositions of samples in this study were determined by refractive index. Small sections of solidified samples were melted and a drop of liquid was used to measure refractive index nD using a Palm Abbe Digital Refractometer, which has an accuracy of ±0.0001. All measurements were repeated at least three times for each sample and were found to be reproducible to within ±0.001. Results were compared to the calibration standard for H2O–NH3 that was made with prepared solutions of known bulk composition C with the relationship
in which m is the experimental slope (here, 1.53 × 10⁻⁴ ± 3.3 × 10⁻⁵) and nD0 is the infinite dilution (i.e., the value for pure water, 1.3329 ± 0.0001). Figure A1 shows the calibration curve as well as the sample compositions for the three samples used to measure dihedral angles (circles) and the four used to measure ultrasonic properties (triangles). Composition errors reported in Table 2 and Table 3 represent the error associated with the spread in nD measurements in the calibration curve, which provide the errors for m and nD0. Since m has a larger error than nD0, this means that the size of error bars in composition increase with increasing composition.
y = mC + nD0

Figure A1.
Refractive index vs. composition in the ammonia-water system. Measurements made on melted liquid from samples.
References
- Squyres, S.W.; Reynolds, R.T.; Cassen, P.M.; Peale, S.J. The Evolution of Enceladus. Icarus 1983, 53, 319–331. [Google Scholar] [CrossRef]
- Kargel, J.S. Ammonia-Water Volcanism on Icy Satellites: Phase Relations at 1 Atmosphere. Icarus 1992, 100, 556–574. [Google Scholar] [CrossRef]
- Kargel, J.S.; Pozio, S. The Volcanic and Tectonic History of Enceladus. Icarus 1996, 119, 385–404. [Google Scholar] [CrossRef]
- Emery, J.P.; Burr, D.M.; Cruikshank, D.P.; R. Brown, H.; Dalton, J.B. Near-Infrared (0.8–4.0 m) Spectroscopy of Mimas, Enceladus, Tethys, and Rhea. Astron. Astrophys. 2005, 435, 353–362. [Google Scholar] [CrossRef]
- Waite, J.H., Jr.; Lewis, W.S.; Magee, B.A.; Lunine, J.I.; McKinnon, W.B.; Glein, C.R.; Mousis, O.; Young, D.T.; Brockwell, T.; Westlake, J.; et al. Liquid water on Enceladus from observations of ammonia and 40Ar in the plume. Nature 2009, 460, 487–490. [Google Scholar] [CrossRef]
- Fortes, A.D.; Grindrod, P.M.; Trickett, S.K.; Vocadlo, L. Ammonium Sulfate on Titan: Possible Origin and Role in Cryovolcanism. Icarus 2007, 188, 139–153. [Google Scholar] [CrossRef]
- Hogenboom, D.L.; Kargel, J.S.; Consalmagno, G.J.; Holden, T.C.; Lee, L.; Buyounouski, M. The Ammonia-Water System and the Chemical Differentiation of Icy Satellites. Icarus 1997, 128, 171–180. [Google Scholar] [CrossRef]
- Brown, M.E.; Calvin, W.M. Evidence for Crystalline Water and Ammonia Ices on Pluto’s Satellite Charon. Science 2000, 287, 107–109. [Google Scholar] [CrossRef]
- Cruikshank, D.P.; Grundy, W.M.; DeMeo, F.E.; Buie, M.W.; Binzel, R.P.; Jennings, D.E.; Olkin, C.B.; Parker, J.W.; Reuter, D.C.; Spencer, J.R.; et al. The Surface Compositions of Pluto and Charon. Icarus 2015, 246, 82–92. [Google Scholar] [CrossRef]
- Bauer, J.M.; Roush, T.L.; Geballe, T.R.; Meech, K.J.; Owen, T.C.; Vacca, W.; Jim, K.T.; Rayner, J.T.; Jim, K.T.C. The Near Infrared Spectrum of Miranda: Evidence of Crystalline Water Ice. Icarus 2002, 158, 178–190. [Google Scholar] [CrossRef]
- Moore, M.H.; Ferrante, R.F.; Hudson, R.L.; Stone, J.N. Ammonia-Water Ice Laboratory Studies Relevant to Outer Solar System Surfaces. Icarus 2007, 190, 260–273. [Google Scholar] [CrossRef]
- Croft, S.K.; Lunine, J.I.; Kargel, J. Equation of State of Ammonia-Water Liquid: Derivation and Planetological Applications. Icarus 1988, 73, 279–293. [Google Scholar] [CrossRef]
- Jankowski, D.G.; Squyres, S.W. Solid-state ice volcanism on the satellites of Uranus. Science 1988, 241, 1322–1325. [Google Scholar] [CrossRef] [PubMed]
- Kargel, J.S.; Croft, S.K.; Lunnie, J.I.; Lewis, J.S. Rheological Properties of Ammonia-Water Liquids and Crystal-Liquid Slurries: Planetological Applications. Icarus 1991, 89, 93–112. [Google Scholar] [CrossRef]
- McCarthy, C.; Cooper, R.F.; Kirby, S.H.; Rieck, S.H.; Stern, L.A. Solidification and microstructures of binary ice I/hydrate eutectic aggregates. Am. Mineral. 2007, 92, 1550–1560. [Google Scholar] [CrossRef]
- Smith, C.; Grains, S. Phases and Interfaces—An Interpretation of Microstructure. Trans. Metall. Soc. AIME 1948, 175, 15–51. [Google Scholar]
- Bulau, J.R.; Waff, H.S. Mechanical and Thermodynamic Constraints on Fluid Distribution in Partial Melts. J. Geophys. Res. 1979, 84, 6102–6108. [Google Scholar] [CrossRef]
- Nye, J.F.; Frank, F.C. Hydrology of the Intergranular Veins in a Temperate Glacier. Assoc. Sci. Hydrol. Publ. 1973, 95, 157–161. [Google Scholar]
- Von Bargen, N.; Waff, H.S. Permeabilities, Interfacial Areas and Curvatures of Partially Molten Systems: Results of Numerical Computations of Equilibrium Microstructures. J. Geophys. Res. 1986, 91, 9261–9276. [Google Scholar] [CrossRef]
- Kawakatsu, H.; Kumar, P.; Takei, Y.; Shinohara, M.; Kanazawa, T.; Araki, E.; Suyehiro, K. Seismic Evidence for Sharp Lithosphere-Asthenosphere Boundaries of Oceanic Plates. Science 2009, 324, 499–502. [Google Scholar] [CrossRef]
- Rychert, C.A.; Shearer, P.M. A Global View of the Lithosphere-Asthenosphere Boundary. Science 2009, 324, 495–498. [Google Scholar] [CrossRef] [PubMed]
- Vidale, J.E.; Hedlin, M.A.H. Evidence for Partial Melt at the Core-Mantle Boundary North of Tonga from the Strong Scattering of Seismic Waves. Nature 1998, 391, 682–684. [Google Scholar] [CrossRef]
- Loper, D.E.; Fearn, D.R. A Seismic Model of a Partially Molten Inner Core. J. Geophys. Res. 1983, 88, 1235–1242. [Google Scholar] [CrossRef]
- Huguet, L.; Alboussiere, T.; Bergman, M.I.; Deguen, R.; Labrosse, S.; Lesoeur, G. Structure of a Mushy Layer under Hypergravity with Implications for Earth’s Inner Core. Geophys. J. Int. 2016, 204, 1729–1755. [Google Scholar] [CrossRef]
- Chantel, J.; Manthilake, G.; Andrault, D.; Novella, D.; Yu, T.; Wang, Y. Experimental evidence supports mantle partial melting in the asthenosphere. Sci. Adv. 2016, 2, e1600246. [Google Scholar] [CrossRef]
- Weidner, D.J.; Li, L.; Whitaker, M.L.; Triplett, R. Ultrasonic Acoustic Velocities during Partial Melting of a Mantle Peridotites KLB-1. J. Geophys. Res. Solid Earth 2018, 123, 1252–1261. [Google Scholar]
- Faul, U.H.; Jackson, I. Diffusion Creep of Dry, Melt-Free Olivine. J. Geophys. Res. 2007, 112, B04204. [Google Scholar] [CrossRef]
- Pharr, G.M.; Ashby, M.F. On Creep Enhanced by a Liquid Phase. Acta Metall. 1983, 31, 129–138. [Google Scholar] [CrossRef]
- McCarthy, C.; Takei, Y. Anelasticity and Viscosity of Partially Molten Rock Analogue: Toward Seismic Detection of Small Quantities of Melt. Geophys. Res. Lett. 2011, 38, L18306. [Google Scholar] [CrossRef]
- Duval, P. The Role of Water Content on the Creep of Polycrystalline Ice. IAHS-AISH 1977, 118, 29–33. [Google Scholar]
- Durham, W.B.; Kirby, S.H.; Stern, L.A. Flow of Ices in the Ammonia-Water System. J. Geophys. Res. 1993, 98, 17667–17682. [Google Scholar] [CrossRef]
- Arakawa, M.; Maeno, N. Effective viscosity of Partially Melted Ice in the Ammonia-Water System. Geophys. Res. Lett. 1994, 21, 1515–1518. [Google Scholar] [CrossRef]
- De La Chapelle, S.; Duval, P.; Baudelet, B. Compressive Creep of Polycrystalline Ice Containing a Liquid Phase. Scr. Met. Mater. 1995, 33, 447–450. [Google Scholar] [CrossRef]
- Hammonds, K.; Baker, I. The Effects of H2SO4 on the Mechanical Behavior and Microstructural Evolution of Polycrystalline Ice. J. Geophys. Res. Earth Surf. 2018, 123, 535–556. [Google Scholar] [CrossRef]
- Ghanbarzadeh, S.; Prodanovic, M.; Hesse, M.A. Percolation and Grain Boundary Wetting in Anisotropic Texturally Equilibrated Pore Networks. Phys. Rev. Lett. 2014, 113, 1–5. [Google Scholar] [CrossRef] [PubMed]
- Ghanbarzadeh, S.; Hesse, M.A.; Prodanovic, M. Percolative Core Formation in Planetesimals Enabled by Hysteresis in Metal Connectivity. Proc. Natl. Acad. Sci. USA 2017, 114, 13406–13411. [Google Scholar] [CrossRef] [PubMed]
- Jurewicz, S.R.; Jurewicz, A.J.G. Distribution of Apparent Angles on Random Sections With Emphasis on Dihedral Angle Measurements. J. Geophys. Res. 1986, 91, 9277–9282. [Google Scholar] [CrossRef]
- Takei, Y. Acoustic properties of partially molten media studied on a simple binary system with a controllable dihedral angle. J. Geophys. Res. 2000, 105, 16665–16682. [Google Scholar] [CrossRef]
- Waff, H.S.; Bulau, J.R. Equilibrium Fluid Distribution in an Ultramafic Partial Melt under Hydrostatic Conditions. J. Geophys. Res. 1979, 84, 6109–6114. [Google Scholar] [CrossRef]
- Zhu, W.; Gaetani, G.A.; Fusseis, F.; Montesi, L.G.J.; De Carlo, F. Microtomography of Partially Molten Rocks: Three-Dimensional Melt Distribution in Mantle Peridotite. Science 2011, 332, 88–91. [Google Scholar] [CrossRef]
- Skemer, P.; Chaney, M.M.; Emmerich, A.L.; Miller, K.J.; Zhu, W. Network Topology of Olivine-Basalt Partial Melts. Geophys. J. Int. 2017, 210, 284–290. [Google Scholar] [CrossRef]
- Vaughan, P.J.; Kohlstedt, D.L. Distribution of the glass phase in hot-pressed, olivine-basalt aggregates: An electron microscopy study. Contrib. Miner. Petrol. 1982, 81, 253–261. [Google Scholar] [CrossRef]
- Cooper, R.F.; Kohlstedt, D.L. Interfacial energies in the olivine-basalt system. In Advances in Earth and Planetary Sciences, Vol. 12: High Pressure Research in Geophysics; Akimoto, S., Manghnani, M.H., Eds.; Center for Academic Publications: Tokyo, Japan, 1982; pp. 217–228. [Google Scholar]
- Takafuji, N.; Hirose, K.; Ono, S.; Xu, F.; Mitome, M.; Bando, Y. Segregation of Core Melts by Permeable Flow in the Lower Mantle. Earth Planet. Sci. Lett. 2004, 224, 249–257. [Google Scholar] [CrossRef]
- Terasaki, H.; Frost, D.J.; Rubie, D.C.; Langenhorst, F. The effect of oxygen and sulphur on the dihedral angle between Fe-O-S melt and silicate minerals at high pressure: Implications for Martian core formation. Earth Planet. Sci. Lett. 2005, 232, 379–392. [Google Scholar] [CrossRef]
- Ketcham, W.M.; Hobbs, P.V. An experimental determination of surface energies of ice. Philos. Mag. 1969, 19, 1161–1173. [Google Scholar] [CrossRef]
- Walford, M.E.R.; Roberts, D.W.; Hill, I. Optical Measurements of Water Lenses in Ice. J. Glaciol. 1987, 33, 159–161. [Google Scholar] [CrossRef][Green Version]
- Walford, M.E.R.; Nye, J.F. Measuring the Dihedral Angle of Water at a Grain Boundary in Ice by an Optical Diffraction Method. J. Glaciol. 1991, 37, 107–112. [Google Scholar] [CrossRef]
- Mader, H.M. The Thermal Behaviour of the Water-Vein System in Polycrystalline Ice. J. Glaciol. 1992, 38, 379–394. [Google Scholar] [CrossRef]
- Blackford, J.R.; Jeffree, C.E.; Noake, D.F.J.; Marmo, B.A. Microstructural Evolution in Sintered Ice Particles Containing NaCl Observed by Low-Temperature Scanning Electron Microscope. Proc. Inst. Mech. Eng. Part L J. Mater. Des. Appl. 2007, 221, 151–156. [Google Scholar] [CrossRef]
- Watanabe, T.; Kurita, K. Simultaneous Measurements of the Compressional-Wave Velocity and the Electrical Conductivity in a Partially Molten Material. J. Phys. Earth 1994, 42, 69–87. [Google Scholar] [CrossRef]
- McCarthy, C.; Blackford, J.R.; Jeffree, C.E. Low-Temperature-SEM Study of Dihedral Angles in the Ice-I/sulfuric Acid Partially Molten System. J. Microsc. 2013, 249, 150–157. [Google Scholar] [CrossRef]
- Cole, D.M. Preparation of Polycrystalline Ice Specimens for Laboratory Experiments. Cold Reg. Sci. Technol. 1979, 1, 153–159. [Google Scholar] [CrossRef]
- Birch, F. The Velocity of Compressional Waves in Rocks to 10 Kilobars, Part 1. J. Geophys. Res. 1960, 65, 1083–1102. [Google Scholar] [CrossRef]
- McCarthy, C.; Savage, H.; Nettles, M. Temperature Dependence of Ice-on-Rock Friction at Realistic Glacier Conditions. Philoso. Trans. R. Soc. A 2017, 375, 20150348. [Google Scholar] [CrossRef] [PubMed]
- Stickels, C.A.; Hucke, E.E. Measurement of Dihedral Angles. Trans. Metal. Soc. AIME 1964, 230, 795. [Google Scholar]
- Harker, D.; Parker, E.R. Grain Shape and Grain Growth. Trans. Am. Soc. Met. 1945, 34, 156–195. [Google Scholar]
- Vogt, C.; Laihem, K.; Wiebusch, C. Speed of Sound in Bubble-Free Ice. J. Acoust. Soc. Am. 2008, 124, 1–6. [Google Scholar] [CrossRef] [PubMed]
- Ku, H.H. Notes on the Use of Propagation of Error Formulas. J. Res. Natl. Bur. Stand. 1966, 70, 263–273. [Google Scholar] [CrossRef]
- Nasello, O.B.; Di Prinzio, C.L.; Guzman, P.G. Temperature dependence of “pure” ice grain boundary mobility. Acta Materialia 2005, 53, 4863–4869. [Google Scholar] [CrossRef]
- Goldsby, D.L.; Kohlstedt, D.L. Structure and Rheology of Partially Molten Ammonia-Water Ices. In Proceedings of the 25th Lunar and Planetary Science Conference, Houston, TX, USA, 14–18 March 1994. [Google Scholar]
- Ambler, M.; Vorselaars, B.; Allen, M.P.; Quigley, D. Solid-liquid interfacial free energy of ice Ih, ice Ic, and ice 0 within a mono-atomic model of water via the capillary wave method. J. Chem. Phys. 2017, 146, 074701. [Google Scholar] [CrossRef]
- Spetzler, H.; Anderson, D.L. The Effect of Temperature and Partial Melting on Velocity and Attenuation in a Simple Binary System. J. Geophys. Res. 1968, 73, 6051–6060. [Google Scholar] [CrossRef]
- Freitas, D.; Manthilake, G.; Chantel, J.; Bouhifd, M.A.; Andrault, D. Simultaneous Measurements of Electrical Conductivity and Seismic Wave Velocity of Partially Molten Geological Materials: Effect of Evolving Melt Texture. Phys. Chem. Miner. 2019, 46, 535–551. [Google Scholar] [CrossRef]
- Holtzman, B.K.; Groebner, N.J.; Zimmerman, M.E.; Ginsberg, S.B.; Kohlstedt, D.L. Stress-Driven Melt Segreations in Partially Molten Rocks. Geochem. Geophys. Geosyst. 2003, 4, 8607. [Google Scholar] [CrossRef]
- Russell, M.J.; Murray, A.E.; Hand, K.P. The Possible Emergence of Life and Differentiation of a Shallow Biosphere on Irradiated Icy Worlds: The Example of Europa. Astrobiology 2017, 17, 1265–1273. [Google Scholar] [CrossRef] [PubMed]
- Zhu, J.; Jabini, A.; Golden, K.M.; Eicken, H.; Morris, M. A Network Model for Fluid Transport through Sea Ice. Ann. Glaciol. 2006, 44, 129–133. [Google Scholar] [CrossRef][Green Version]
- Grasset, O.; Sotin, C.; Deschamps, F. On the internal structure and dynamics of Titan. Planet. Space Sci. 2000, 48, 617–636. [Google Scholar] [CrossRef]
- Hesse, M.A.; Castillo-Rogez, J.C. Thermal Evolution of the Impact-Induced Cryomagma Chamber beneath Occator Crater on Ceres. Geophys. Res. Lett. 2018, 46, 1213–1221. [Google Scholar] [CrossRef]
- McCarthy, C.; Caswell, T.; Domingos, A.; Katz, A.O.; Newtown, D.C.; Zhang, D.; Savage, H.M. Friction of Ice Partial Melt Systems: A Possible Source of Seismicity on Icy Satellite Faults. In Proceedings of the 49th Lunar and Planetary Science Conference, The Woodlands, TX, USA, 19–23 March 2018. [Google Scholar]
- Hammond, N.P.; Barr, A.C.; Cooper, R.F.; Caswell, T.E.; Hirth, G. Experimental Constraints on the Fatigue of Icy Satellites Lithospheres by Tidal Forces. J. Geophys. Res. Planets 2018, 123, 390–404. [Google Scholar] [CrossRef]
© 2019 by the authors. Licensee MDPI, Basel, Switzerland. This article is an open access article distributed under the terms and conditions of the Creative Commons Attribution (CC BY) license (http://creativecommons.org/licenses/by/4.0/).