Article

Marine Sediments from a Contaminated Site: Geotechnical Properties and Chemo-Mechanical Coupling Processes

by
Francesca Sollecito
1,2,*,
Claudia Vitone
1,
Daniela Miccoli
1,
Michael Plötze
2,
Alexander M. Puzrin
2 and
Federica Cotecchia
1
1
Department of Civil, Environmental, Land, Building Engineering and Chemistry, Politecnico di Bari, 70126 Bari, Italy
2
Institute for Geotechnical Engineering, ETH Zürich, 8049 Zürich, Switzerland
*
Author to whom correspondence should be addressed.
Geosciences 2019, 9(8), 333; https://doi.org/10.3390/geosciences9080333
Submission received: 5 May 2019 / Revised: 19 July 2019 / Accepted: 24 July 2019 / Published: 29 July 2019
(This article belongs to the Special Issue Marine Sediments and Marine Environments)

Abstract

:
The city of Taranto in the south of Italy is one of the areas declared as “at high risk of environmental crisis” by the Italian government because it represents one of the most complex industrial sites in Europe, located near urban areas of high population density. The rich ecosystem of the Mar Piccolo basin, located at north of Taranto, started exhibiting unconfutable signs of environmental pollution, confirmed by the high concentrations of organic and inorganic contaminants. Among the different aspects involved in the environmental studies aiming at the basin remediation, this paper focuses on submarine sediments and reports some results of the geotechnical laboratory investigations which made also use of non-standard equipment and revised procedures for data interpretation in order to take account of the sediments’ contamination and heterogeneities. The geotechnical laboratory tests show that, despite the Mar Piccolo recent Holocene sediments having similar origin and composition to those of the Sub-Apennine clay basic formation, their behavioral facets appear to be altered by the presence of contaminants of both natural and anthropogenic origin. Results of washing tests are also presented as a first attempt to quantify the effects of chemo-mechanical coupling processes on the plasticity properties of the shallow sediments.

1. Introduction

Coastal marine environments located in areas which suffer from severe pollution due to industrial and urban development, are usually exposed to both natural and anthropogenic sources of contamination, which reflect into the alteration of properties of marine sediments. If marine pollution is defined as the introduction of substances by man into the environment, resulting in deleterious effects for humans, more in general, marine contamination is the presence of elevated concentrations of substances in the environment above the natural background level for the area [1]. Therefore contaminants, even without “deleterious effects,” may be responsible for the activation of chemo-mechanical coupling processes within the soils when occurring in significant concentrations [2]. Typically, contaminants may have different origins and are classified into three categories: inorganic compounds, acid and bases, and organic compounds, with both natural and anthropic origin. Particularly in the case of fine-grained soils, the presence of several types of contaminants, and their interaction with soil properties must be determined in order to understand and to predict the fate and transport of contaminants over space and time, and both the short-term and long-term performance of the remediation strategies.
The effects on the geotechnical soil properties of physical-chemical factors, such as salinity, organic and inorganic contaminants, are widely investigated in the literature. Specifically, evidence of chemo-mechanical coupling processes on the index properties of kaolinite, smectite, and mixed clay samples, observed after mixing the clay with solutions of different chemical compositions were discussed by several authors [3,4,5,6,7,8]. The potential of chemical-mechanical coupling is greatest in fine-grained soils at low confinement and such coupling may prompt highly variable effects for different clay fabric conditions [9]. In this context, the research on Mar Piccolo (MP) sediments aims to add an original contribution on the behavior of fine-grained sediments affected by a real pattern of contamination.
The MP basin in the South of Italy represents a natural site characterized by the presence of contaminants of different sources and composition. The basin is located just behind the coast of the city of Taranto (Figure 1a), one of the most important industrial sites in Europe and represents, at the same time, an unusual ecosystem from a naturalistic point of view, with several animal and plant protected species and wide areas for mussel cultivation and fishing activity. Due to these peculiar conditions, the MP basin has been declared ‘at high risk of environmental crisis’ [10] and included in the list of the Sites of National Interest (SIN; [11]), to be subjected to comprehensive investigation for a preliminary selection of sustainable strategies for both its remediation and management. The paper shows the environmental boundary conditions of the MP and focuses on the results of geotechnical characterisation of marine sediments, that has been carried out to derive a geotechnical model of the area up to depths of engineering interest. The data of soil composition, index properties, and mechanical behavior from a long submarine core have been newly interpreted and illustrated together with original results of both shearing tests and washing tests. Innovatively, the discussion will entail the variability of the geo-mechanical properties along a vertical profile, considering the geological sequence of the basin and the presence of contaminants, in order to provide evidence of chemo-mechanical alteration. Based on data from previous chemical and geotechnical investigations and the results of new tests, the paper represents an attempt to highlight some of the geo-mechanical peculiarities of the sediments and their sensitivity to some chemical changes.

2. Materials and Methods

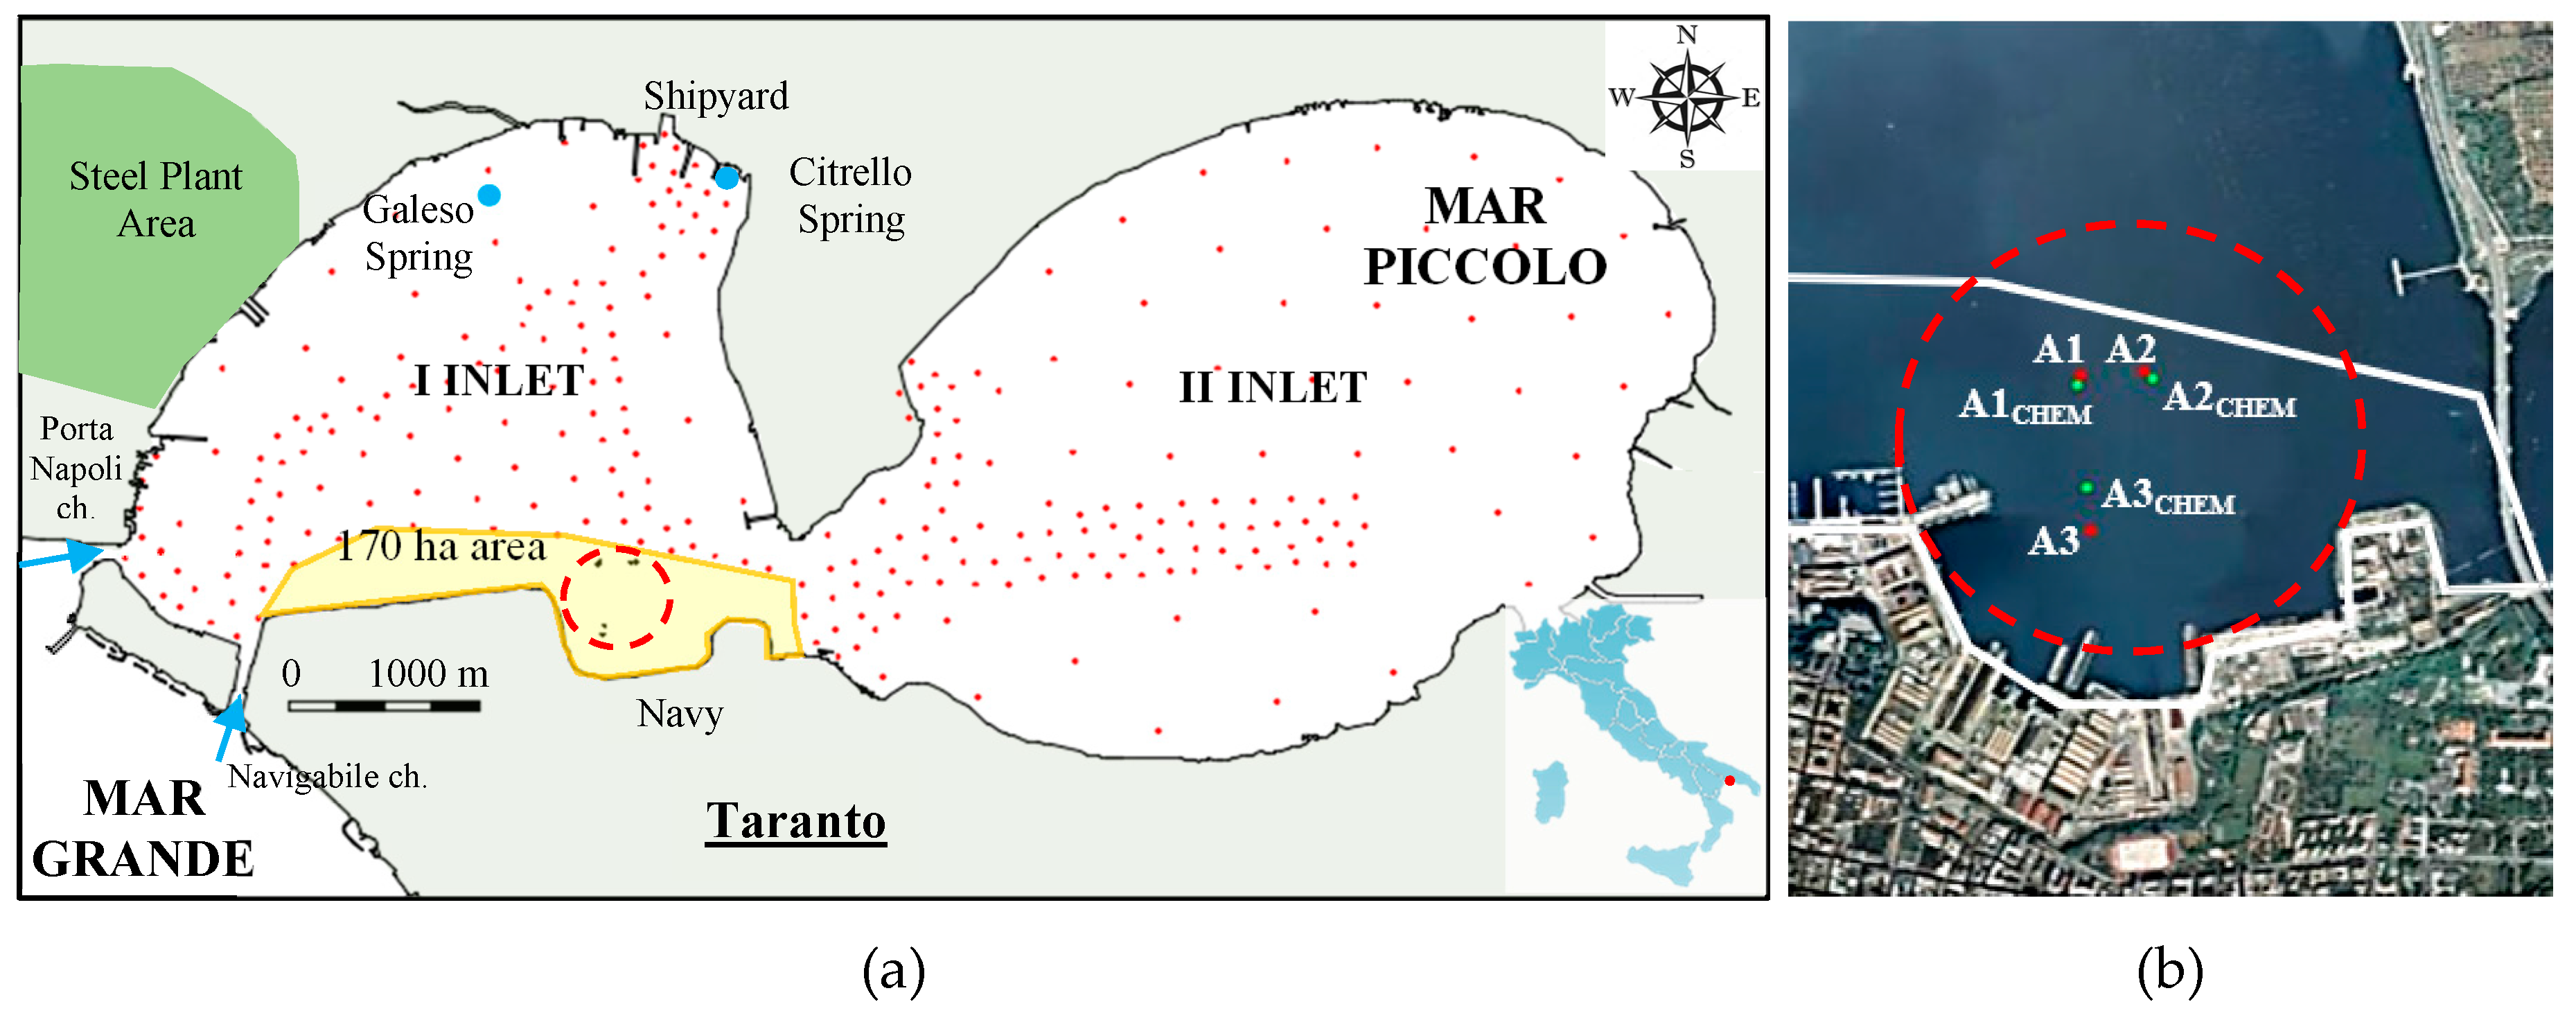
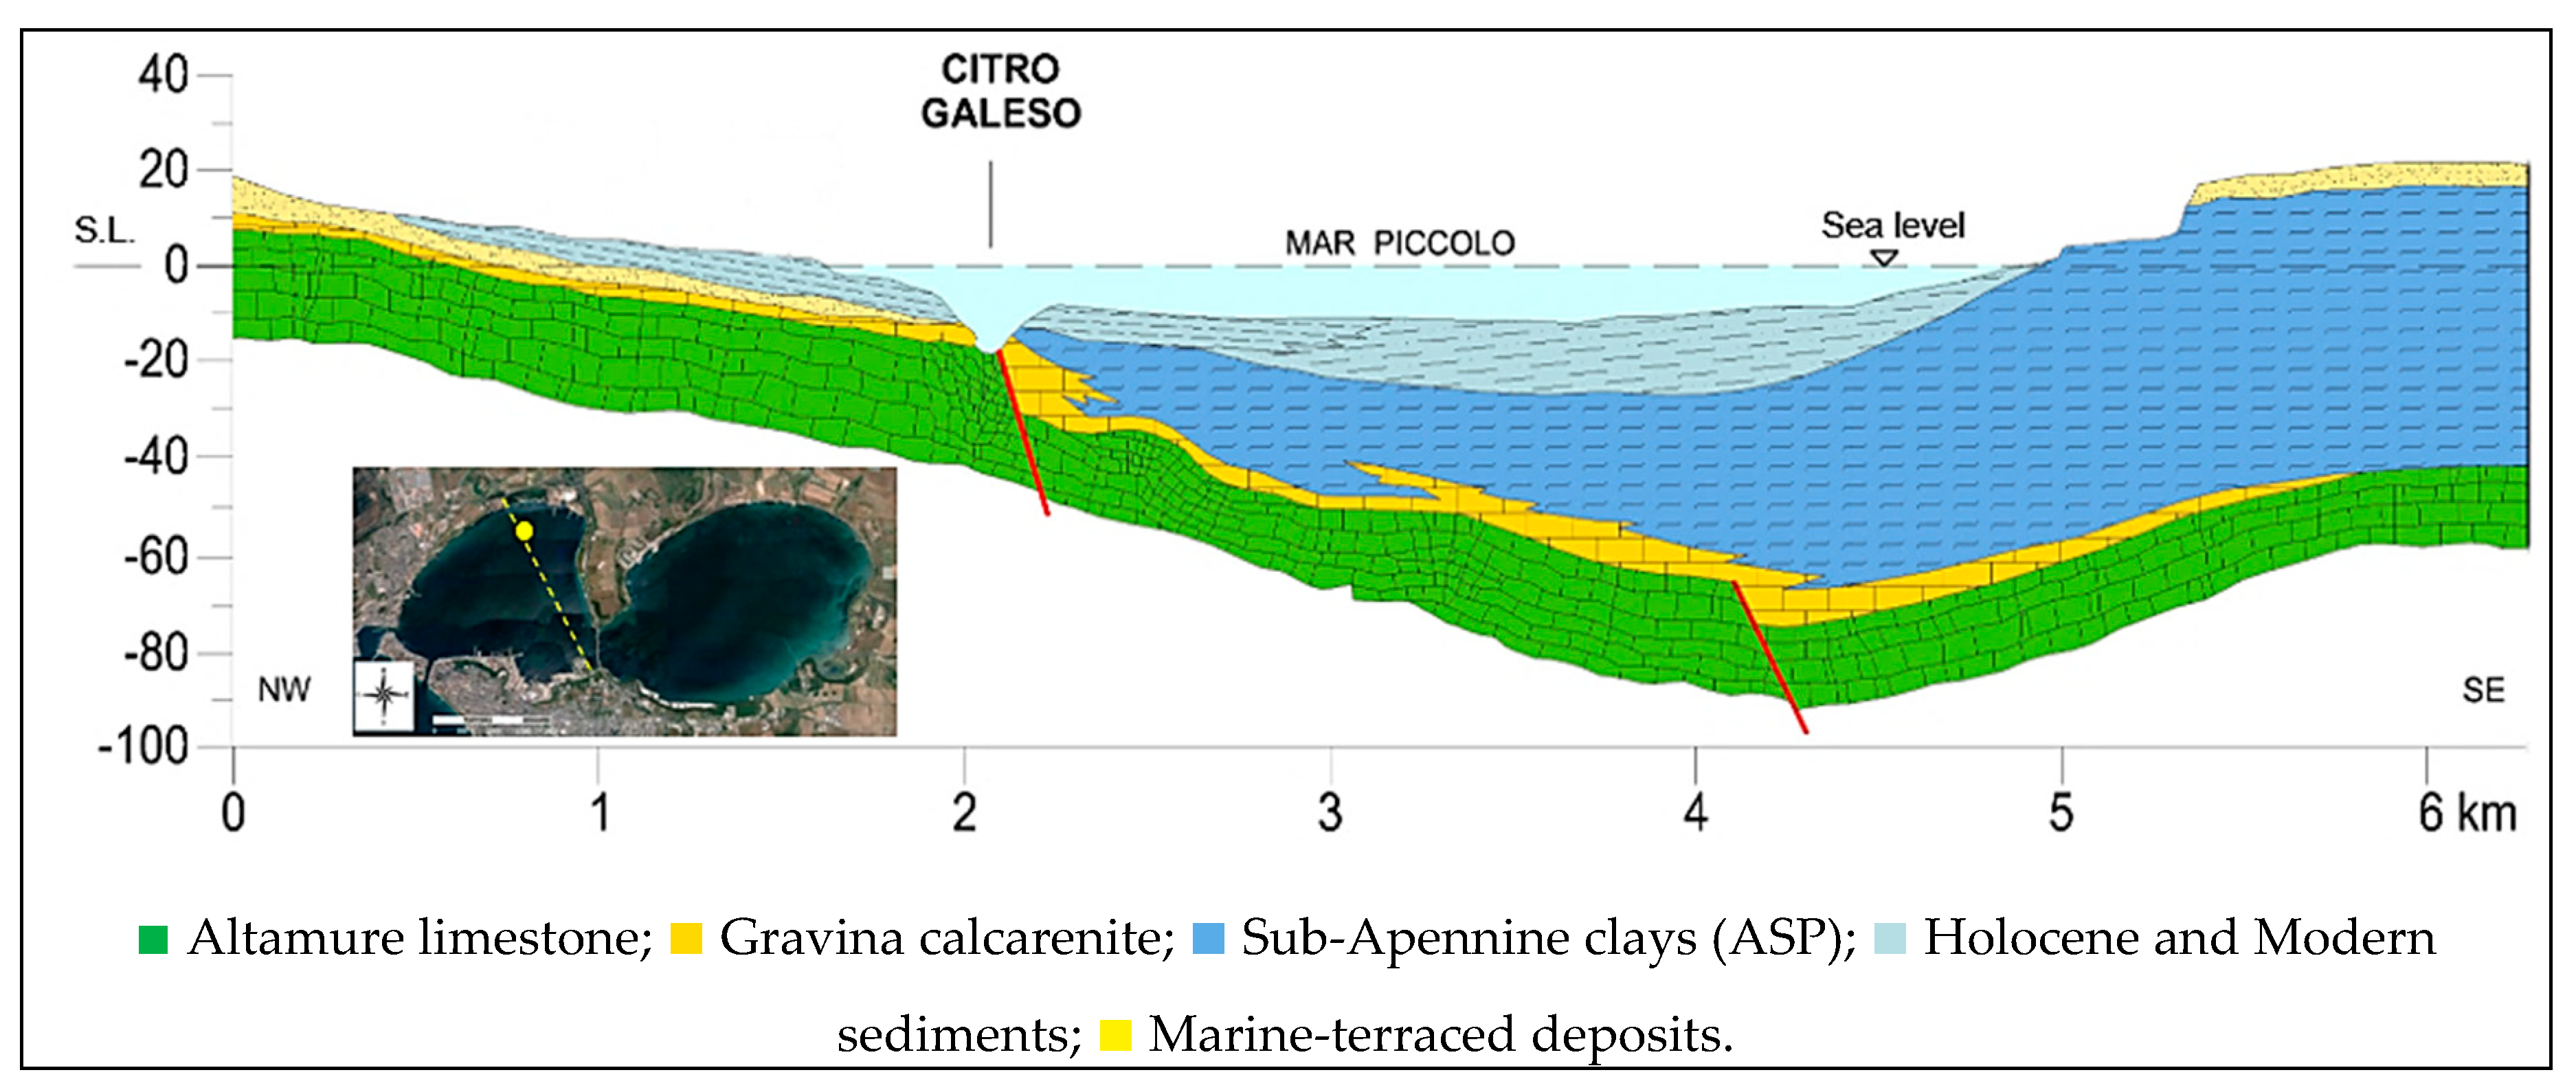
2.1. Geological Features of the Site

The area of the MP basin is located between the south-western sector of the Apulian Foreland and the eastern Bradanic Foredeep [12,13]. The MP is a semi-enclosed basin with a total surface of about 20 km2 and 13 m maximum water depth, divided into the First and Second Inlet (Figure 1a), officially named “Primo Seno” and “Secondo Seno,” respectively. The sub-elliptical shape of the basin derives from the combination of different geological processes, which occurred during the Pleistocene, such as the regional Tectonic uplift [14], the glacial eustatic sea level variations [15], and the consequent variations of the hydrographic network [16]. The two depressions that constitute the MP are supposed to be ancient river valleys that were incised during the continental phase related to the Last Glacial Maximum (20,000–25,000 years BP; [17]) and submerged by the sea during the Holocene marine transgression [16,17,18].
As inferred by [19], based upon the analysis of pioneering geophysical investigations, the sequence of submarine units in the basin, from the bottom to the top, schematically reported in Figure 2, is represented by: Mesozoic Altamura limestone, Upper Pliocene-Lower Pleistocene Gravina calcarenite, that passes upwards and laterally to the Sub-Apennine clays (ASP). Finally, Holocene and Modern sediments deposited after the erosion of ASP [12,18,19,20], reaching even a thickness of 15 m (Figure 2). Moreover, marine, transitional, and continental terraced deposits occur in the surrounding foreland and foredeep sectors [21]. Recent Carbon-14 dating results [22] show that the top layer of sediments may have suffered a significant remolding due to both the human activities carried out in the area and the occurrence of flooding events, which could have altered the natural process of sedimentation and the bioturbation activity.
The hydrogeologic boundary conditions of the basin are affected by a deep artesian groundwater body which flows under confined conditions inside the Altamura limestone [19] and discharges fresh water into the sea through several submarine springs (locally called “Citri”), where the overlaying clays have been eroded [19,23]. At present, “Citri” occur as submerged springs due to the overall eustatic rise of the sea level and to changes in the karstic base level.

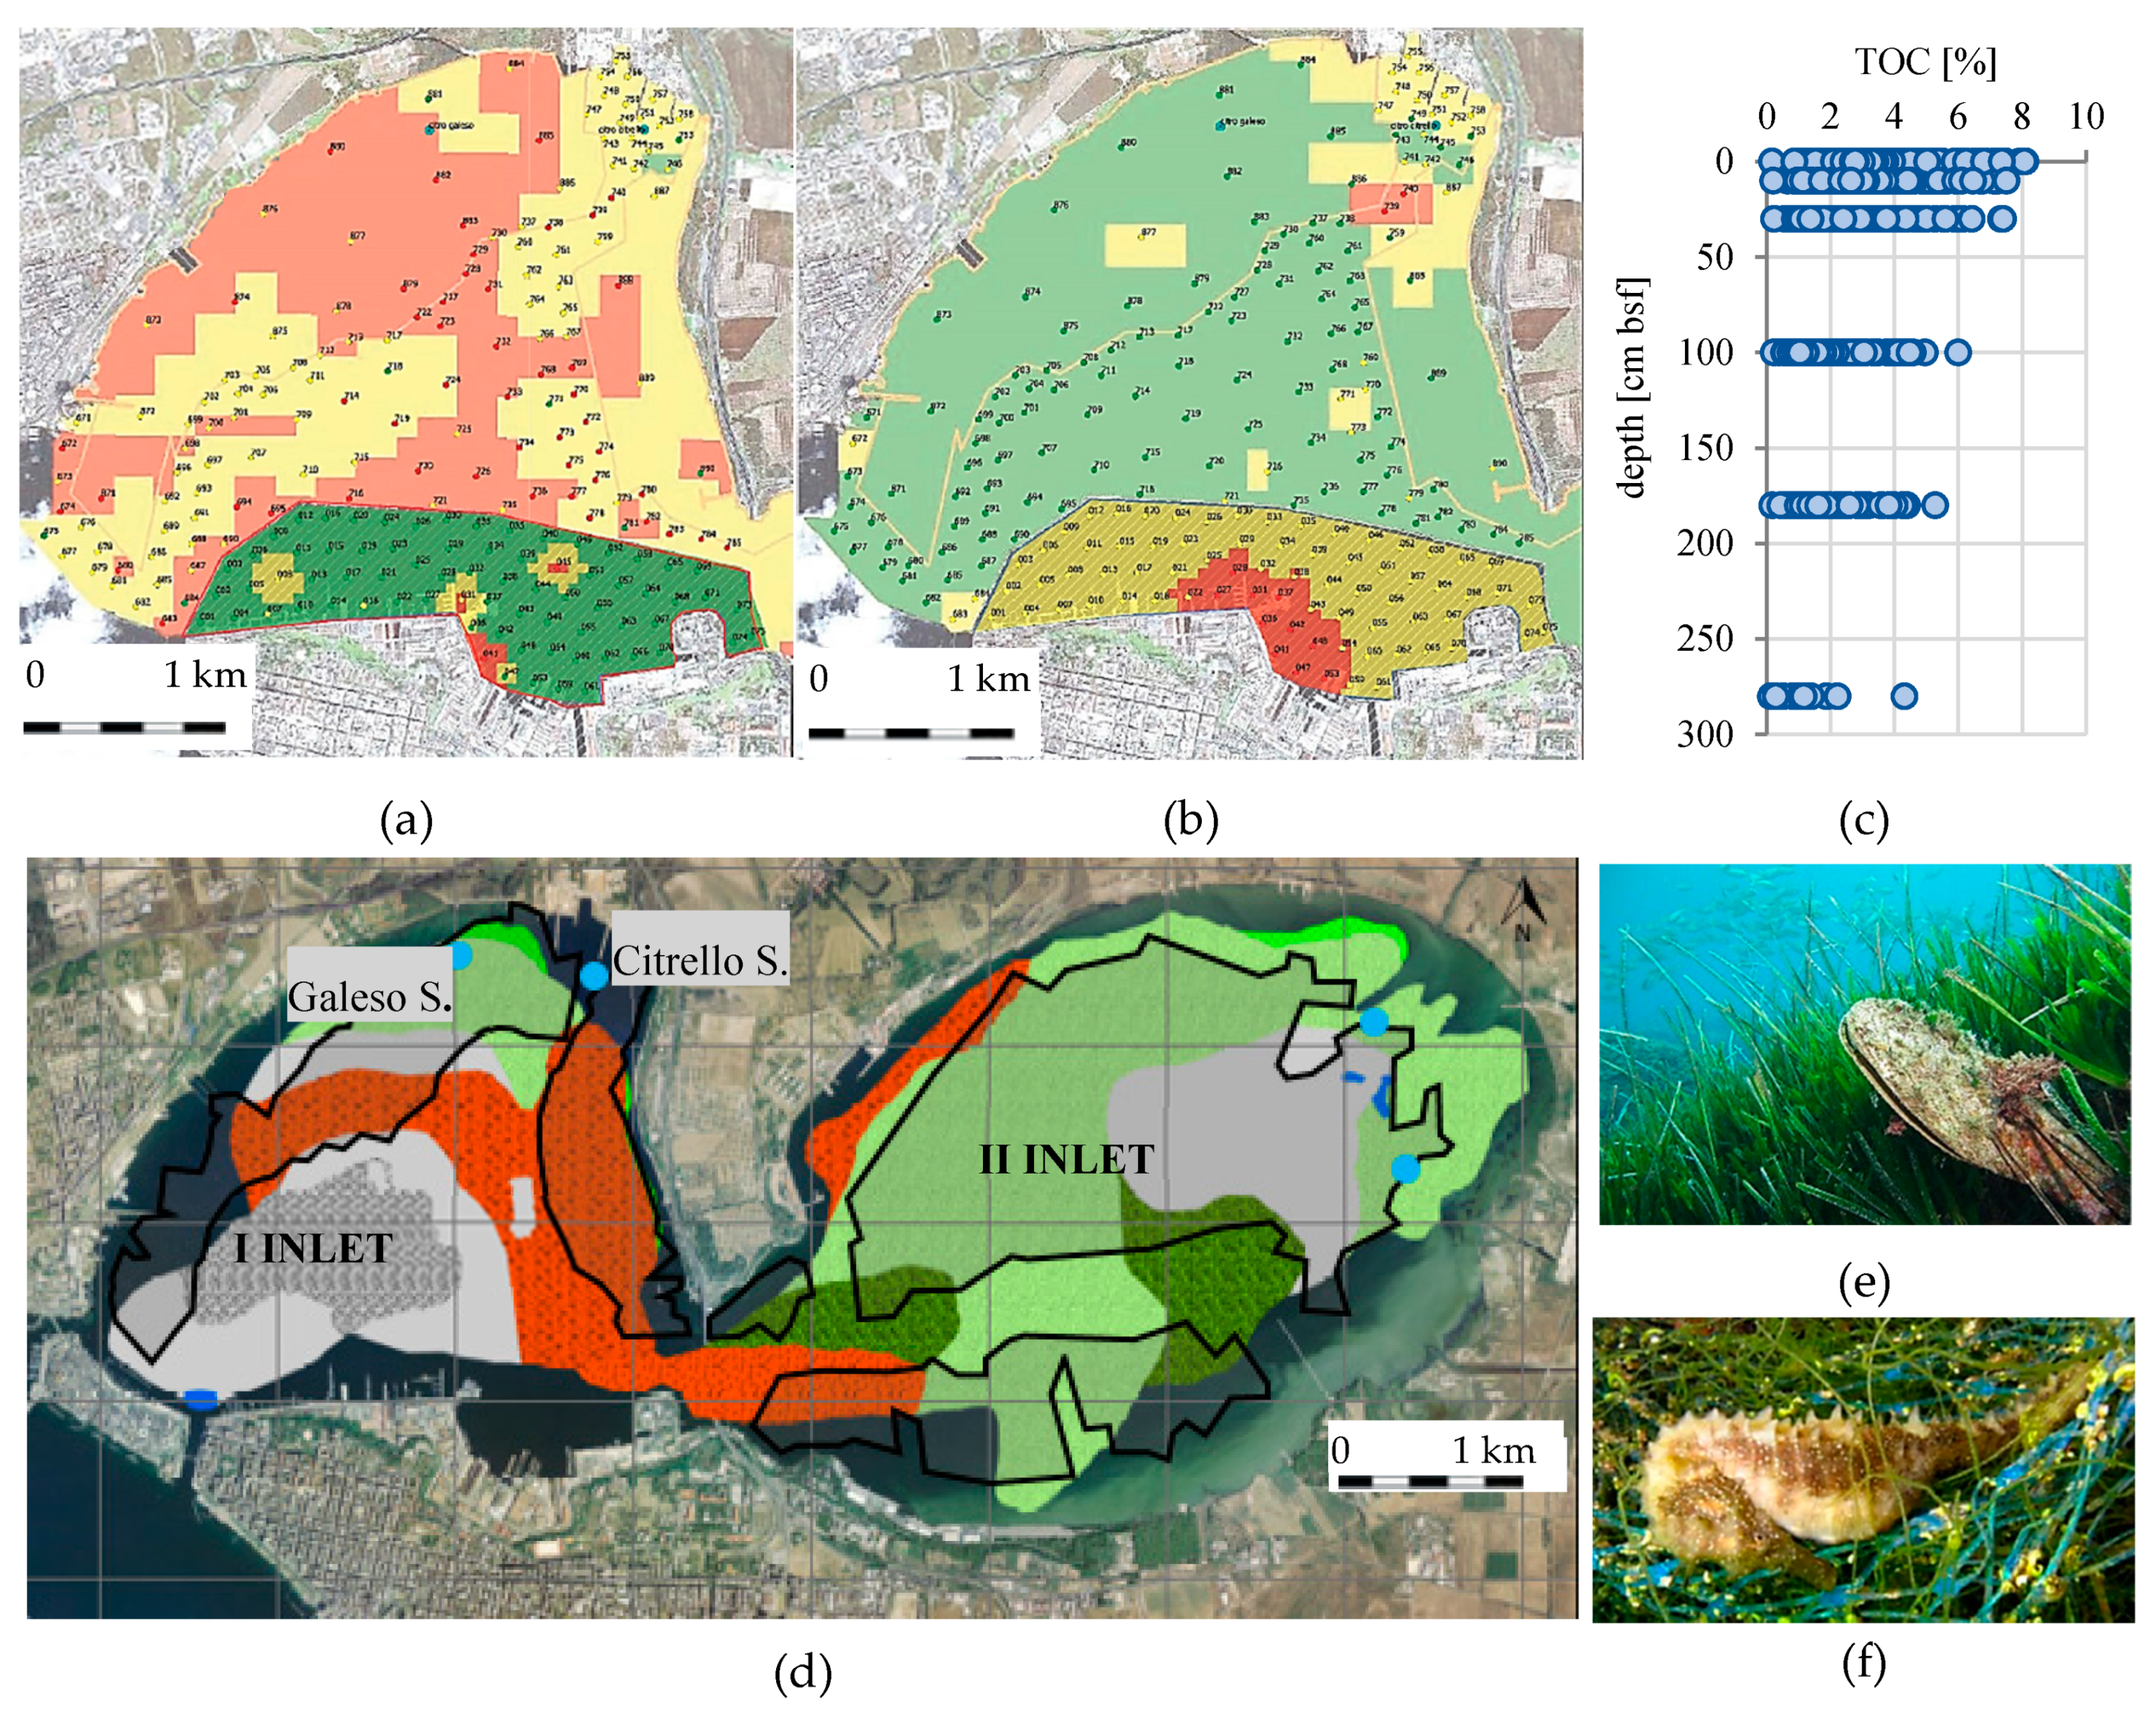
2.2. Environmental Features of the Site

MP is connected to the Mar Grande and Ionian Sea only through the Navigable Channel and Porta Napoli Channel in the First Inlet (Figure 1a). As a consequence, the water circulation is restricted and the tidal range does not exceed 30–40 cm [24], so as in the Gulf of Taranto the tidal range is lower than 30 cm. Both water circulation and water conditions are affected by the presence of several submarine springs and tributary rivers. The most important springs in the First Inlet are the “Galeso” and “Citrello” springs (Figure 1a), that have a mean flow of 750 and 350 L/s respectively [25]. Moreover, several small tributary rivers flow in the basin, the most important of them is the “Galeso river” in the First Inlet with a mean flow of 50,000 m3/day [25]. The salinity of seawater ranges between 31 and 39 g/L depending on the influence of fresh water coming from the submarine springs [22]. The measured salinity of the sediment pore fluid ranges between 30 and 32 g/L, even within the deep sediments (e.g., about 18 m below the seafloor (bsf)).
MP is also an example of a Mediterranean coastal marine ecosystem whose biological balances have been modified because of the considerable environmental stress due to the industrialization process. Commercial, agricultural, and industrial activities developed both in the in-land area and in the near-shore area of the basin. One of the largest steel plants in Europe, EX-ILVA, an oil ENI refinery, and a military Navy port may be cited, among the others (Figure 1a). Moreover, MP receives agricultural nutrients and untreated wastewater, which are among the causes of basin pollution. As more than 80% of the province of Taranto is used for farming, freshwater inputs carry chemicals drained from the surrounding agricultural soils in the basin [26,27]. Furthermore, until the year 2000, the discharges of 14 sewage pipes from the nearby towns amounted to 0.21 m3/s [26]. These inputs increase the nutrient discharges and lower the water quality.
Various chemical characterizations [22,27,28,29,30,31,32] have shown that the pollution in the sediments is due to both heavy metals (e.g., arsenic, As; lead, Pb; cadmium, Cd; mercury, Hg; copper, Cu; zinc, Zn), organic pollutants (polycyclic aromatic hydrocarbons (PAHs), polychlorinated biphenyls (PCBs), dioxins) and asbestos, with more severe conditions in the First Inlet. As an example of the extension of pollution by both inorganic and organic compounds in the First Inlet of the basin, Figure 3a,b shows the distribution of Hg and PCBs, respectively. In particular, the colors in Figure 3a,b indicate the different degrees of pollution: areas where concentrations exceed the limits provided by the site-specific law [33] are in yellow, and red areas indicate higher level of pollutants which exceed the national law [34] (see Table 1). One of the most contaminated areas in the basin is the “170 ha area” (Figure 1), that is characterized by the highest levels of As, Hg, and PCBs [29].
The scarce water circulation within the basin promotes the organic matter sedimentation that plays an important role in both the transport and accumulation of pollutants in sediments. The amount of total organic carbon (TOC) detected in the MP basin during previous campaigns [26,29] may reach values of 8% in the first centimeters and reduces with depth (Figure 3c). MP represents a case of shallow marine basin, near the coast, which receives inputs of organic particles from multiple sources, both autochthonous and allochthonous. The terrigenous contribution of organic matter (allochthonous OM) may have both natural and anthropogenic origin, making the processes of distribution of contaminants complex [35,36].
The MP environmental setting is the product of both natural conditions and human impacts, which make this site an example of a coastal marine ecosystem where, however, high levels of environmental risk persist. The map of biocenosis (Figure 3d) shows that some portions of the basin are constituted by seabed in which the presence of algae is absent or rare (dark grey and grey areas in the map, respectively), while large parts of the seabed are covered by several species of algae and macroalgae. The basin is also considered one of the most important areas for mussel farming in Europe, with an annual production of bivalves of about 40,000 tons per year [37], which is prevalent in the First Inlet. Figure 3d shows the boundaries of the mussel farming area, where the piles, used for the mussel cultivation, host a rich ecosystem of fouling community. Moreover, the Mar Piccolo is colonized by many animal and plant species included in the lists of sensible organisms for preserving biodiversity, such as Pinna nobilis bivalve, seahorses (Figure 3e,f), Caretta caretta turtle, that are mentioned both in the Habitat Directive [38] and in the Barcelona Convention [39]. However, the benthic communities observed in the Taranto seas are severely affected by human activities. Edible marine organisms were collected in the First Inlet, to investigate contamination level and public health risks, associated with consuming fish and seafood harvested from these areas. In most species, Cd, Pb, and PCbs were found over the limits set by European Community Regulation [40]. In consequence of the high levels of chemicals found in both water column and water biota, to reduce the risk for human health, both the commercialization and consumption of the mussels coming from the First Inlet have been prohibited.
The pH values measured within the sediments vary from zone to zone in the basin. In particular, in the First Inlet the pH is lower than 7 in the areas used for mussel cultivation (Figure 3d) close to the north-eastern coast and in the vicinity of the Second Inlet. The redox potential, Eh, exhibits negative values ranging from −200 to 0 mV already from the first cm of sediment [22,28]. The circumstance indicates both the abundance of reducing reactions and an oxygen deficiency in the top layer [41].
It follows that, in the basin, different substances of natural or anthropogenic origin combine to define a complex system of interacting contaminants, represented by water salinity, organic matter (OM), organic pollutants, and heavy metals.

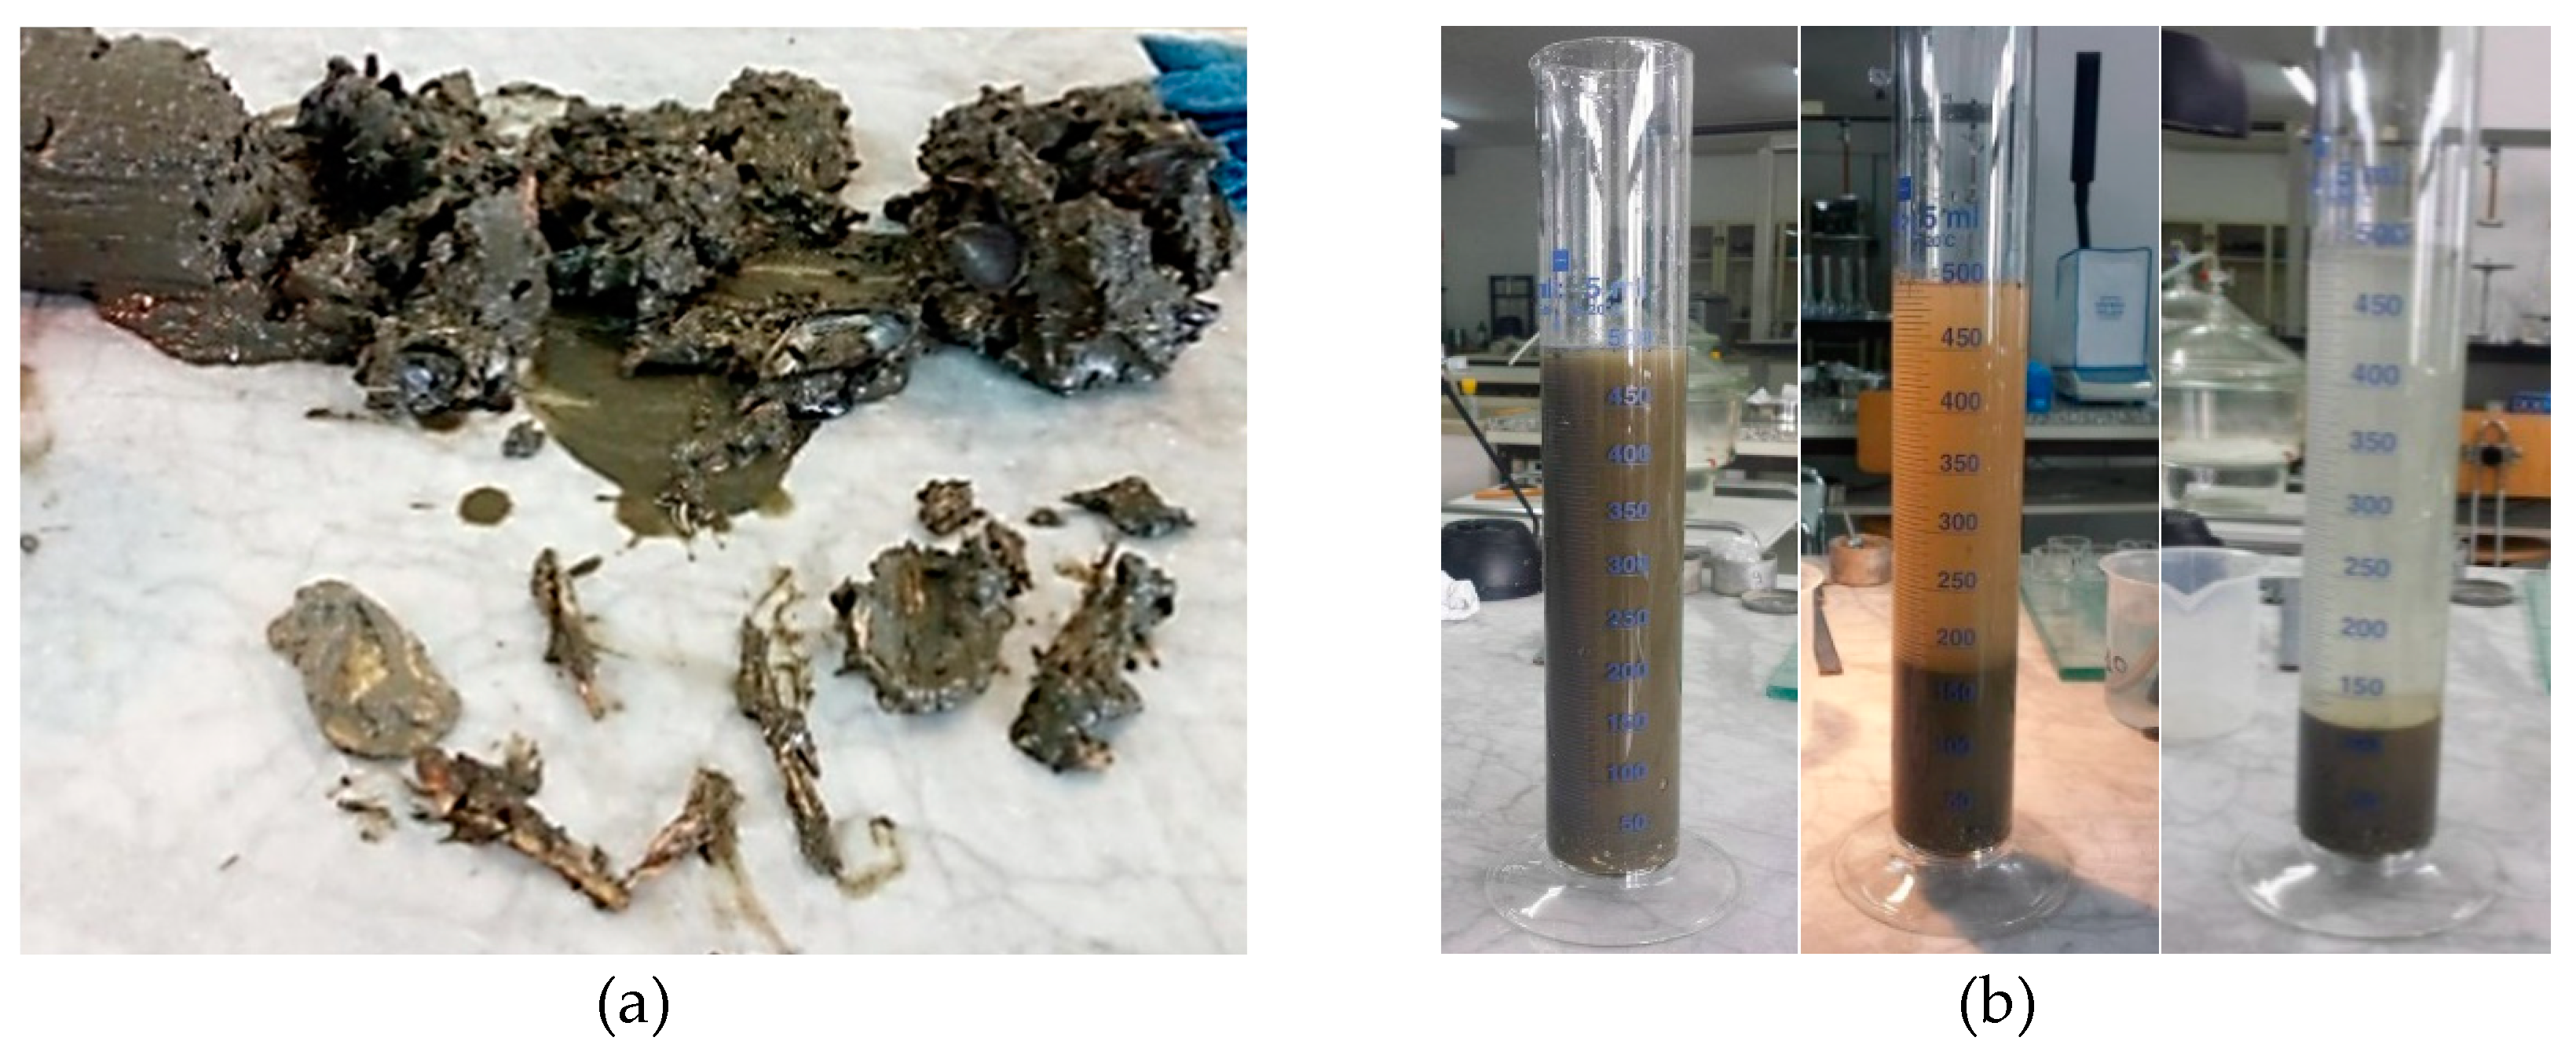
2.3. In Situ Sampling, Laboratory Procedures and Equipment

During the geotechnical campaign, three boreholes were investigated and, for the first time, depths larger than 3 m below the seafloor were explored in the basin. The verticals (A1, A2, and A3 in Figure 1b), were drilled up to depths of 8.5, 16.5, and 18.2 m below the seafloor respectively, by means of a drilling apparatus that was mounted on a platform previously fixed in place [42]. Undisturbed samples were taken from boreholes. Moreover, nearby these boreholes, three other samples (i.e., A1-M, A2-M, A3-M) were taken manually in the first meter of sediments by a team of expert scuba divers [42]. The 101 mm diameter samplers were made in polyvinylchloride (PVC), therefore characterized by high chemical and mechanical resistance. The three geotechnical boreholes were selected in proximity of 3 m long boreholes carried for chemical analyses during the environmental campaign [29] (A1CHEM, A2CHEM, A3CHEM in Figure 1b), in order to achieve a preliminary association of geotechnical and chemical data, at least within the top 3 m bsf.
In the following, the procedure for the geotechnical determinations of natural state, composition, and both physical and mechanical properties of the sediments are described, together with the corrections applied to take account of the influence of salinity and organic matter in the pore fluid and the presence of shell and mussel fragments.
When dealing with marine environment, the salinity of the pore fluid affects the calculation of the natural water content (test 1 in Table 2 [43]) determined by the standard procedures, since the salt crystallizes into a solid during the oven-drying process. For this reason, the data were corrected as also suggested by both the Standards [44,45] and the literature (e.g., [46,47,48,49]), according to equation:
w f = w m 1 r rw m ,
where wm is the measured water content, wf the fluid content and r is the salt content, defined as the ratio between weight of salt and weight of salt water. An average salt content, r, equal to 0.029 g/g was computed for this study. Equation (1) is derived considering that salt is present in the pore water of the wet sample and that it remains in the dry solids weight once the sample has been oven-dried, while pure water escapes in vapor [46].
Special consideration was given also for the Atterberg’s limits determination (test 2 in Table 2), as suggested by the standard [50]. Since the Atterberg limits are water contents which identify changes in the soil consistency, the data were corrected according to Equation (1). During the sample preparation, the procedures followed to prepare the material were also carefully considered. Concretions, shells, and other fragile particles, often visible to the naked eye (Figure 4a), were not crushed to make them pass through a 425-μm (No. 40) sieve, but they were retained on the sieve and removed [50]. The samples were not dried before testing because the liquid limit of a soil containing substantial amounts of organic matter decreases dramatically when the soil is oven-dried before testing [51]. When additional water was needed, sea water collected from the MP was used. However, the minimum amount of fluid was added, in order to determine the Atterberg limits at salt condition similar to the in-situ state. During the Atterberg limit determination, reduction of water content was accomplished by exposing the material passing the 425-μm (No. 40) sieve to air currents at room temperature. This method is recommended by the standard [50] for materials containing soluble salts, because it does not eliminate the soluble salts from the test specimen.
During the sieving procedure for the determination of the main grain size fractions of the soil samples (test 3 in Table 2), the material with diameter higher than 1 mm and retained on the sieve No. 18 was removed and the grading curves were consistently determined excluding this part [52]. With respect to MP sediments, especially for shallow soil, the material retained on the sieve No. 18 mainly consisted of mussel and shell fragments (Figure 4a).
The specific gravity of soil solids (test 4 in Table 2), Gs*, is here defined as the ratio of the mass of a unit volume of a soil solids, γs, to the mass of the same volume of marine water, γf, instead of distilled water, γw. It was obtained correcting the result of the pycnometer test (Gs), for γf equal to 10.055 kN/m3, according to equation:
G s * = γ s γ f = G s   γ w γ f   .
Since the soil is fully saturated, with a saturation degree, S, equal to 1, wf and Gs* were used to compute the void ratio, e, according to equation:
e = w f × G s * S .
The bulk unit weight (test 5 in Table 2) was determined as the ratio between weight and volume of specimens prepared for the mechanical tests. The organic matter, OMBS, (test 6 in Table 2) was measured by dichromate oxidation according to the Walkey and Black’s method, as shown in the British Standard [43]. Standard oedometer tests (OED, test 7 in Table 2) and direct shear tests (DST, test 8 in Table 2) were carried out on 56 mm diameter × 20 mm high specimens and 60 mm long × 20 mm thick squared specimens, respectively. The cells of both the apparatuses were filled with marine water collected in the basin, with the aim of reducing or even avoiding the chemically induced flows of water or ions through the soil due to differences in fluid composition (e.g., [53]). The compressibility data from OED were complemented with those from DST, obtained by recording the normal deformation of the specimen during the consolidation process in the DST cell for all load increments applied prior to shearing [54].
A soil washing procedure with distilled water was carried out as a first quantification of the effects of both natural and anthropogenic contaminants on the soil physical properties and composition. Firstly, the Atterberg limits were newly determined on a portion of a shallow sample of sediments A3-M, after having wrapped it in film and stored it in the fridge at constant temperature of +4 °C for two years. Subsequently, 600 g of the same sample were left in a glass sedimentation cylinder together with distilled water for a total volume of the solution equal to 500 mL (Figure 4b). The cylinder was turned upside down and back for 1 min and then the sediments were left to settle for the time necessary to see a clear separation between the fluid and the sediments. The salt concentration of the fluid was then measured by electrical conductivity and the fluid in the cylinder was replaced by distilled water up to the same total volume. This procedure was repeated six times, until the salinity of the fluid (clearly separated by the sediment) reached zero. The washed slurry was air dried and the Atterberg limits and particle size distribution were then determined again. The whole procedure took about 10 days. Lastly, the Atterberg limit determinations were repeated on the same washed sample after both oven-drying at 105 °C for 48 h and subsequent mixing of dried sediments with the MP marine water.
The testing programme on the contaminated sediments required the implementation of some measures in the geotechnical laboratory, to ensure not only the safety of the staff involved directly in the experimental activity but also to preserve the external environment. The measures concerned the adoption of both standard personal devices and special laboratory equipment and acquisition system [59].
The soil mineralogy analyses were carried out by means of X-Ray powder diffraction using a Rigaku MiniFlex diffractometer on both bulk sample and clay fraction [40]. Results of the report [29] about chemical analyses carried out by environmental investigation on the samples collected up to 3 m bsf are also included in this study.

3. Results

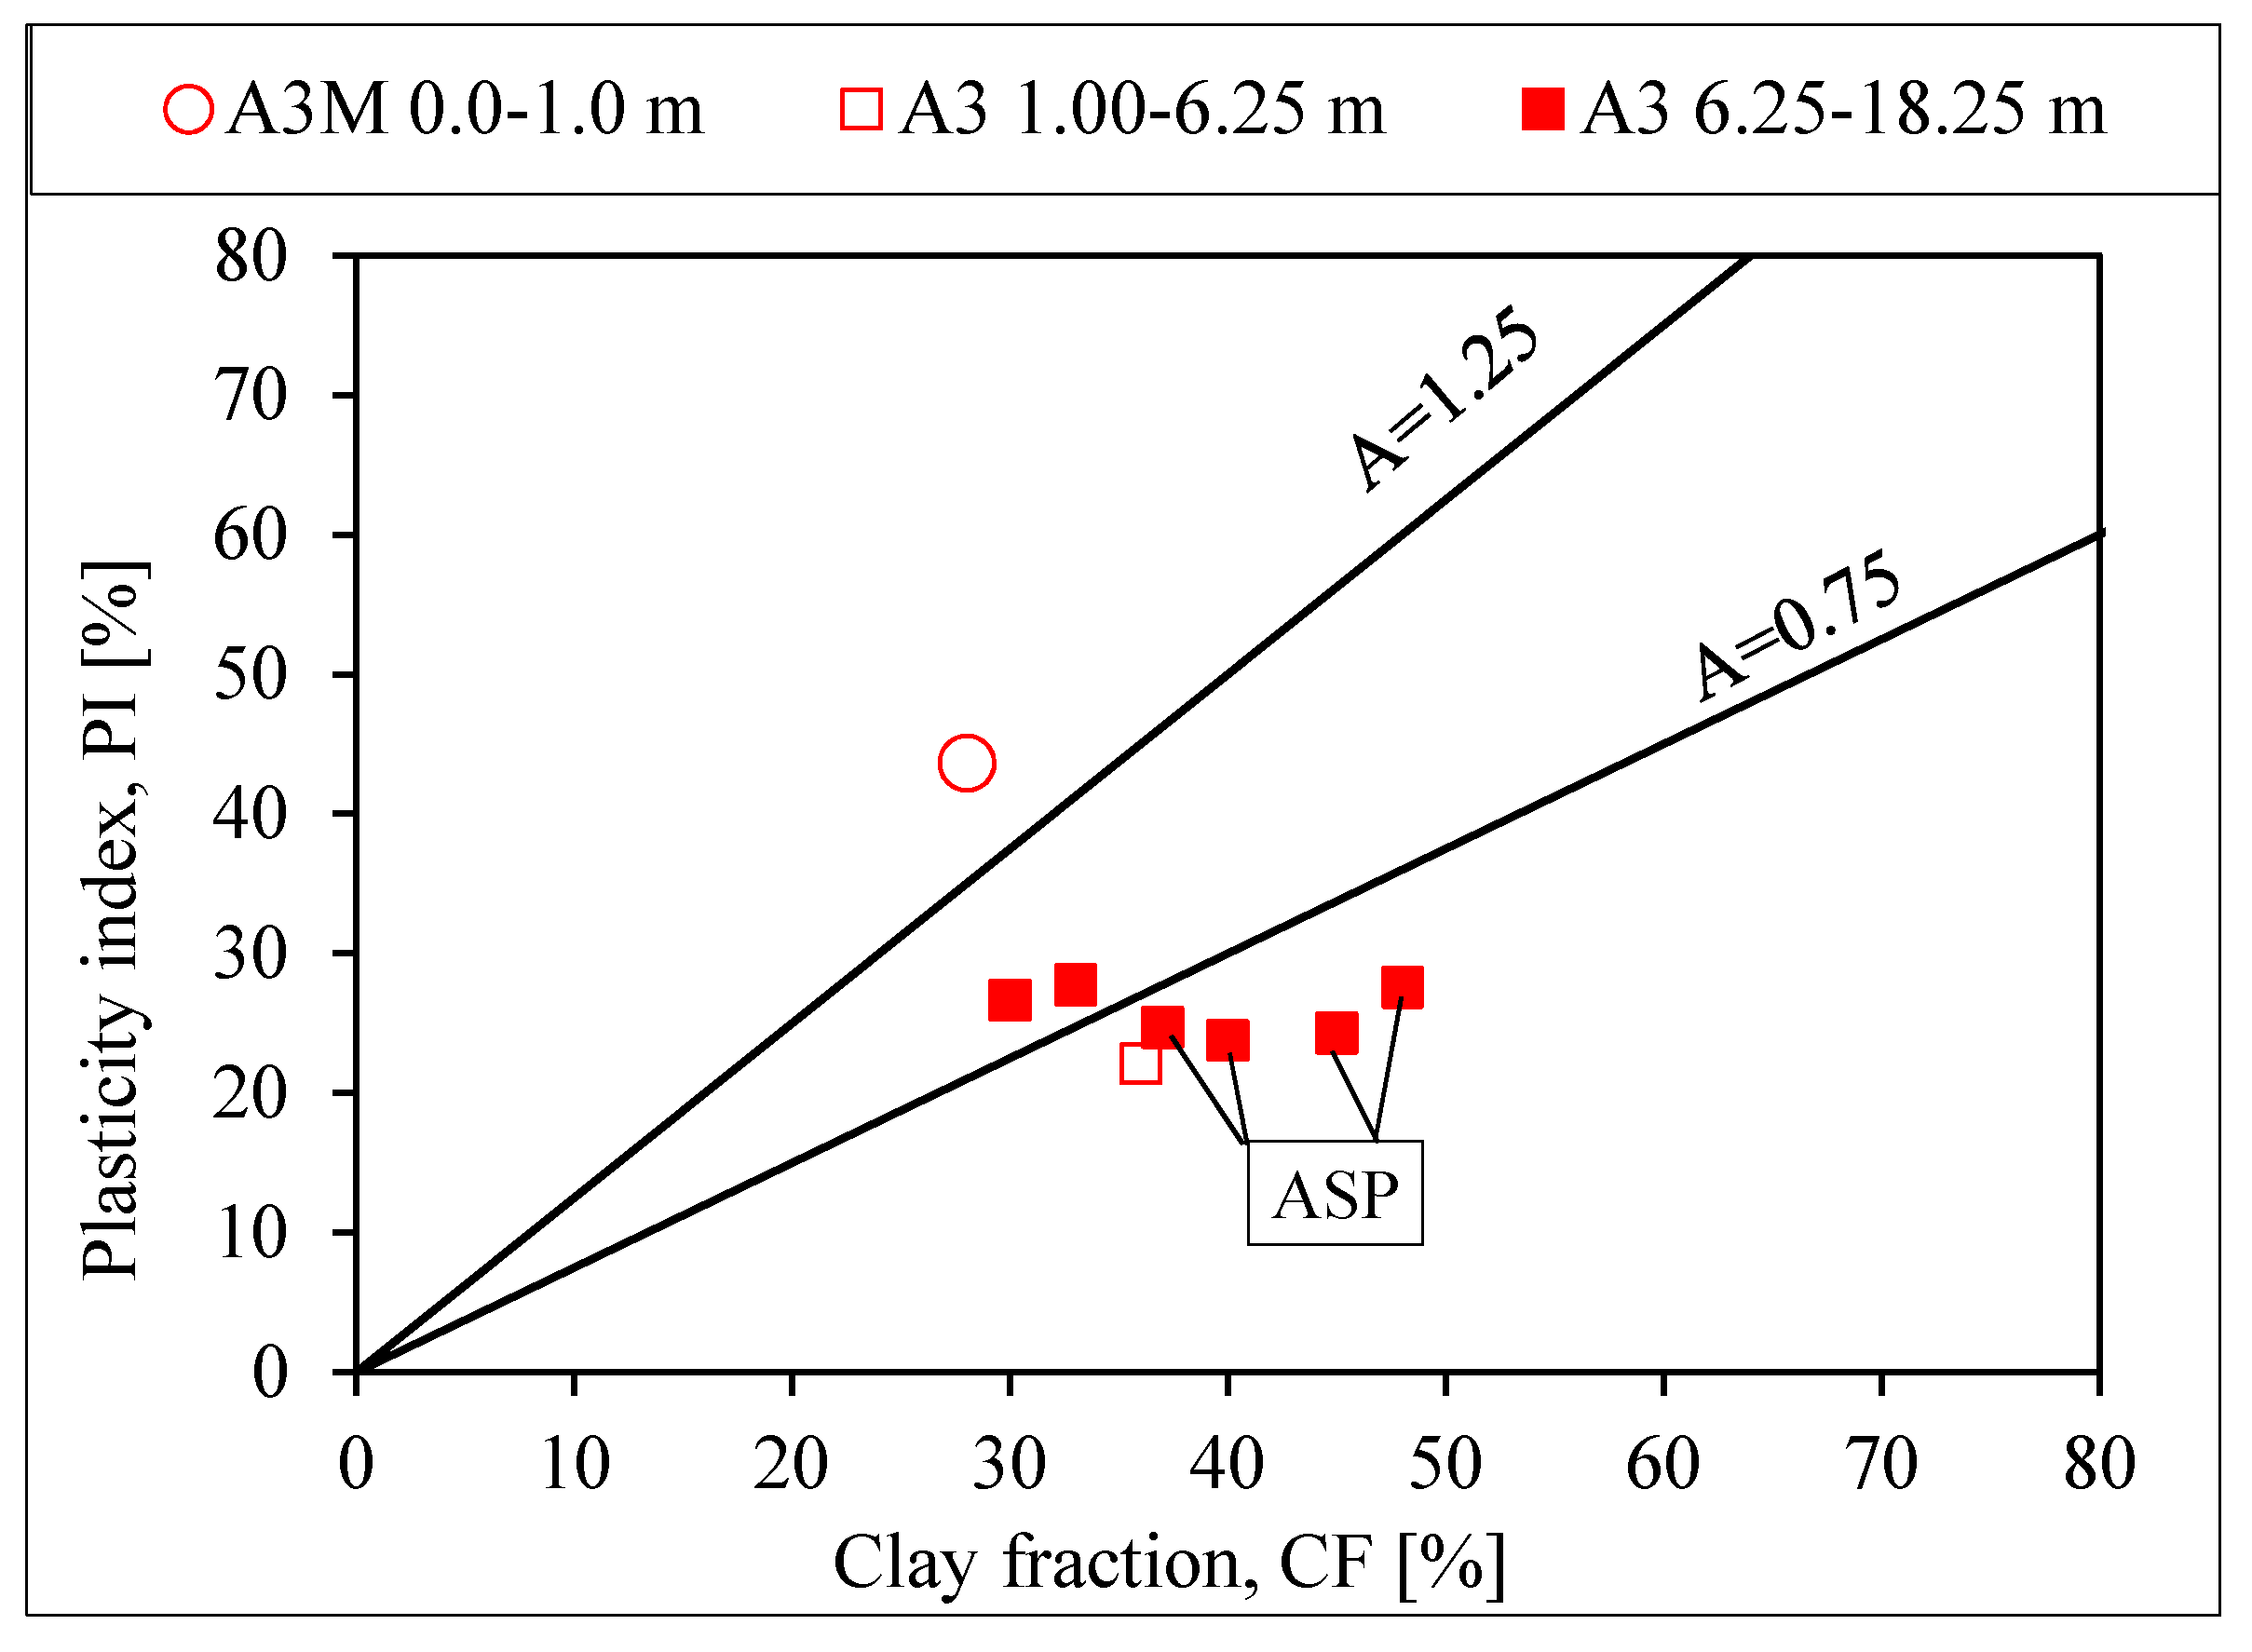
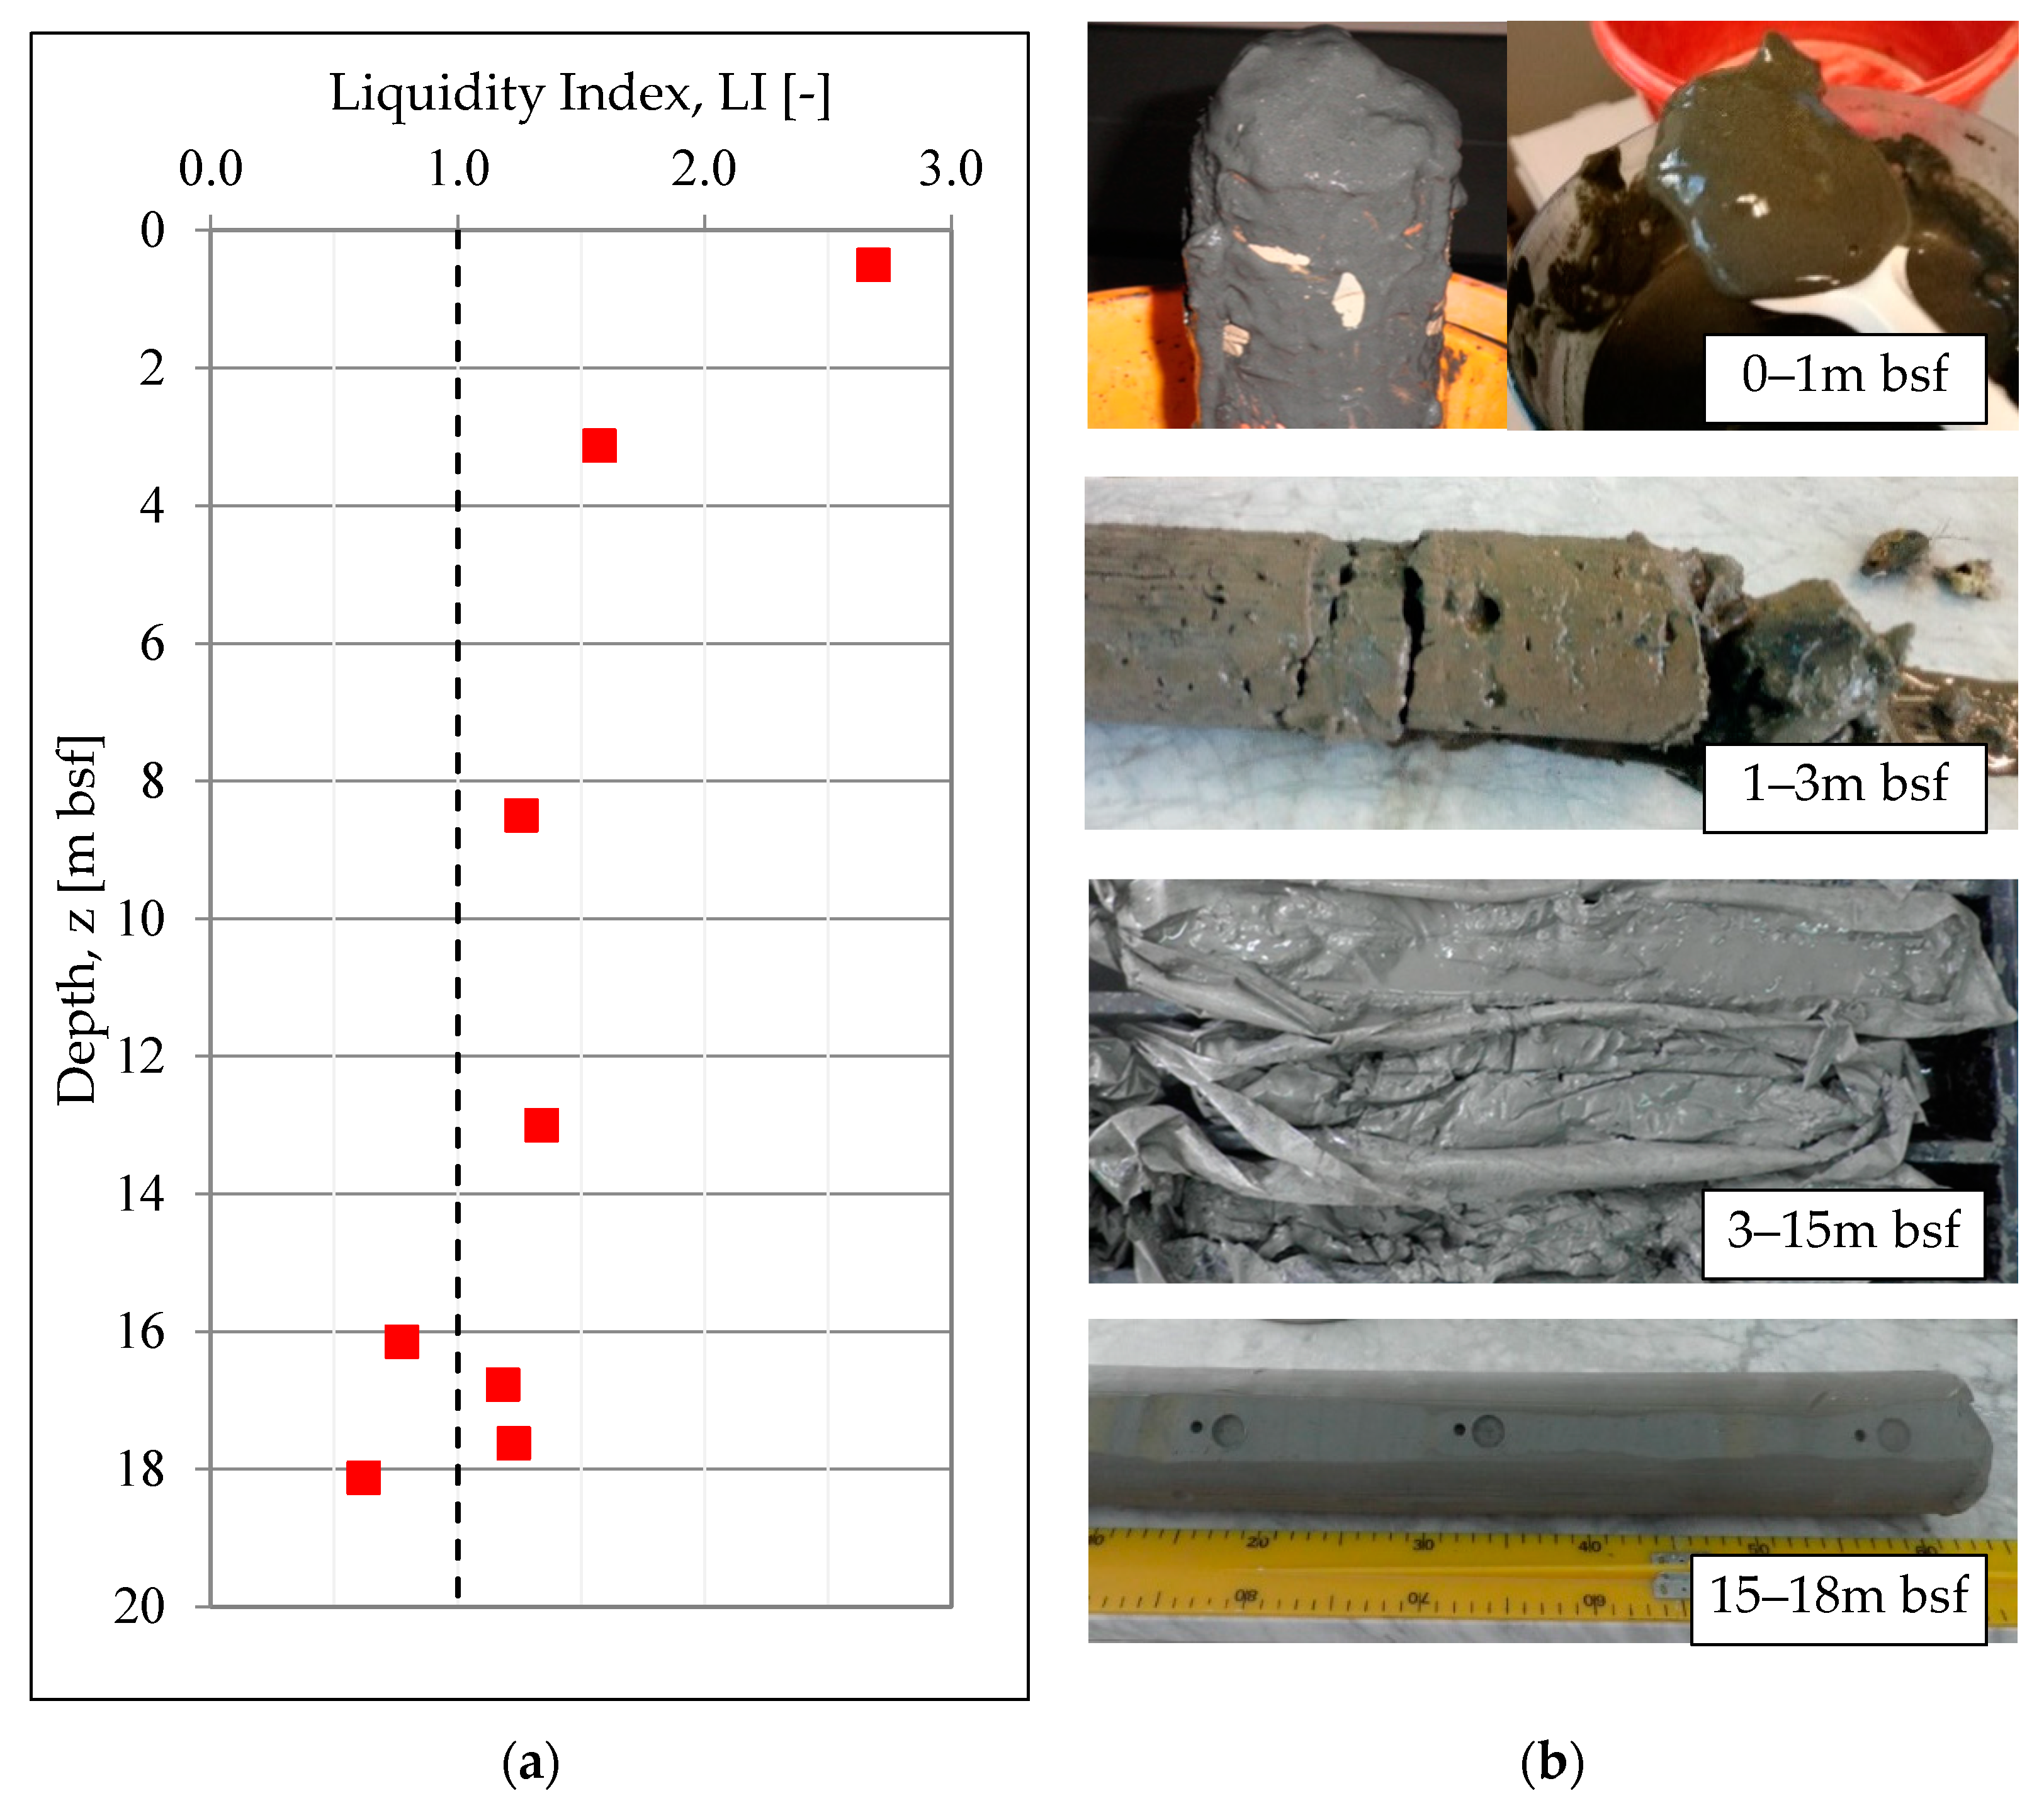
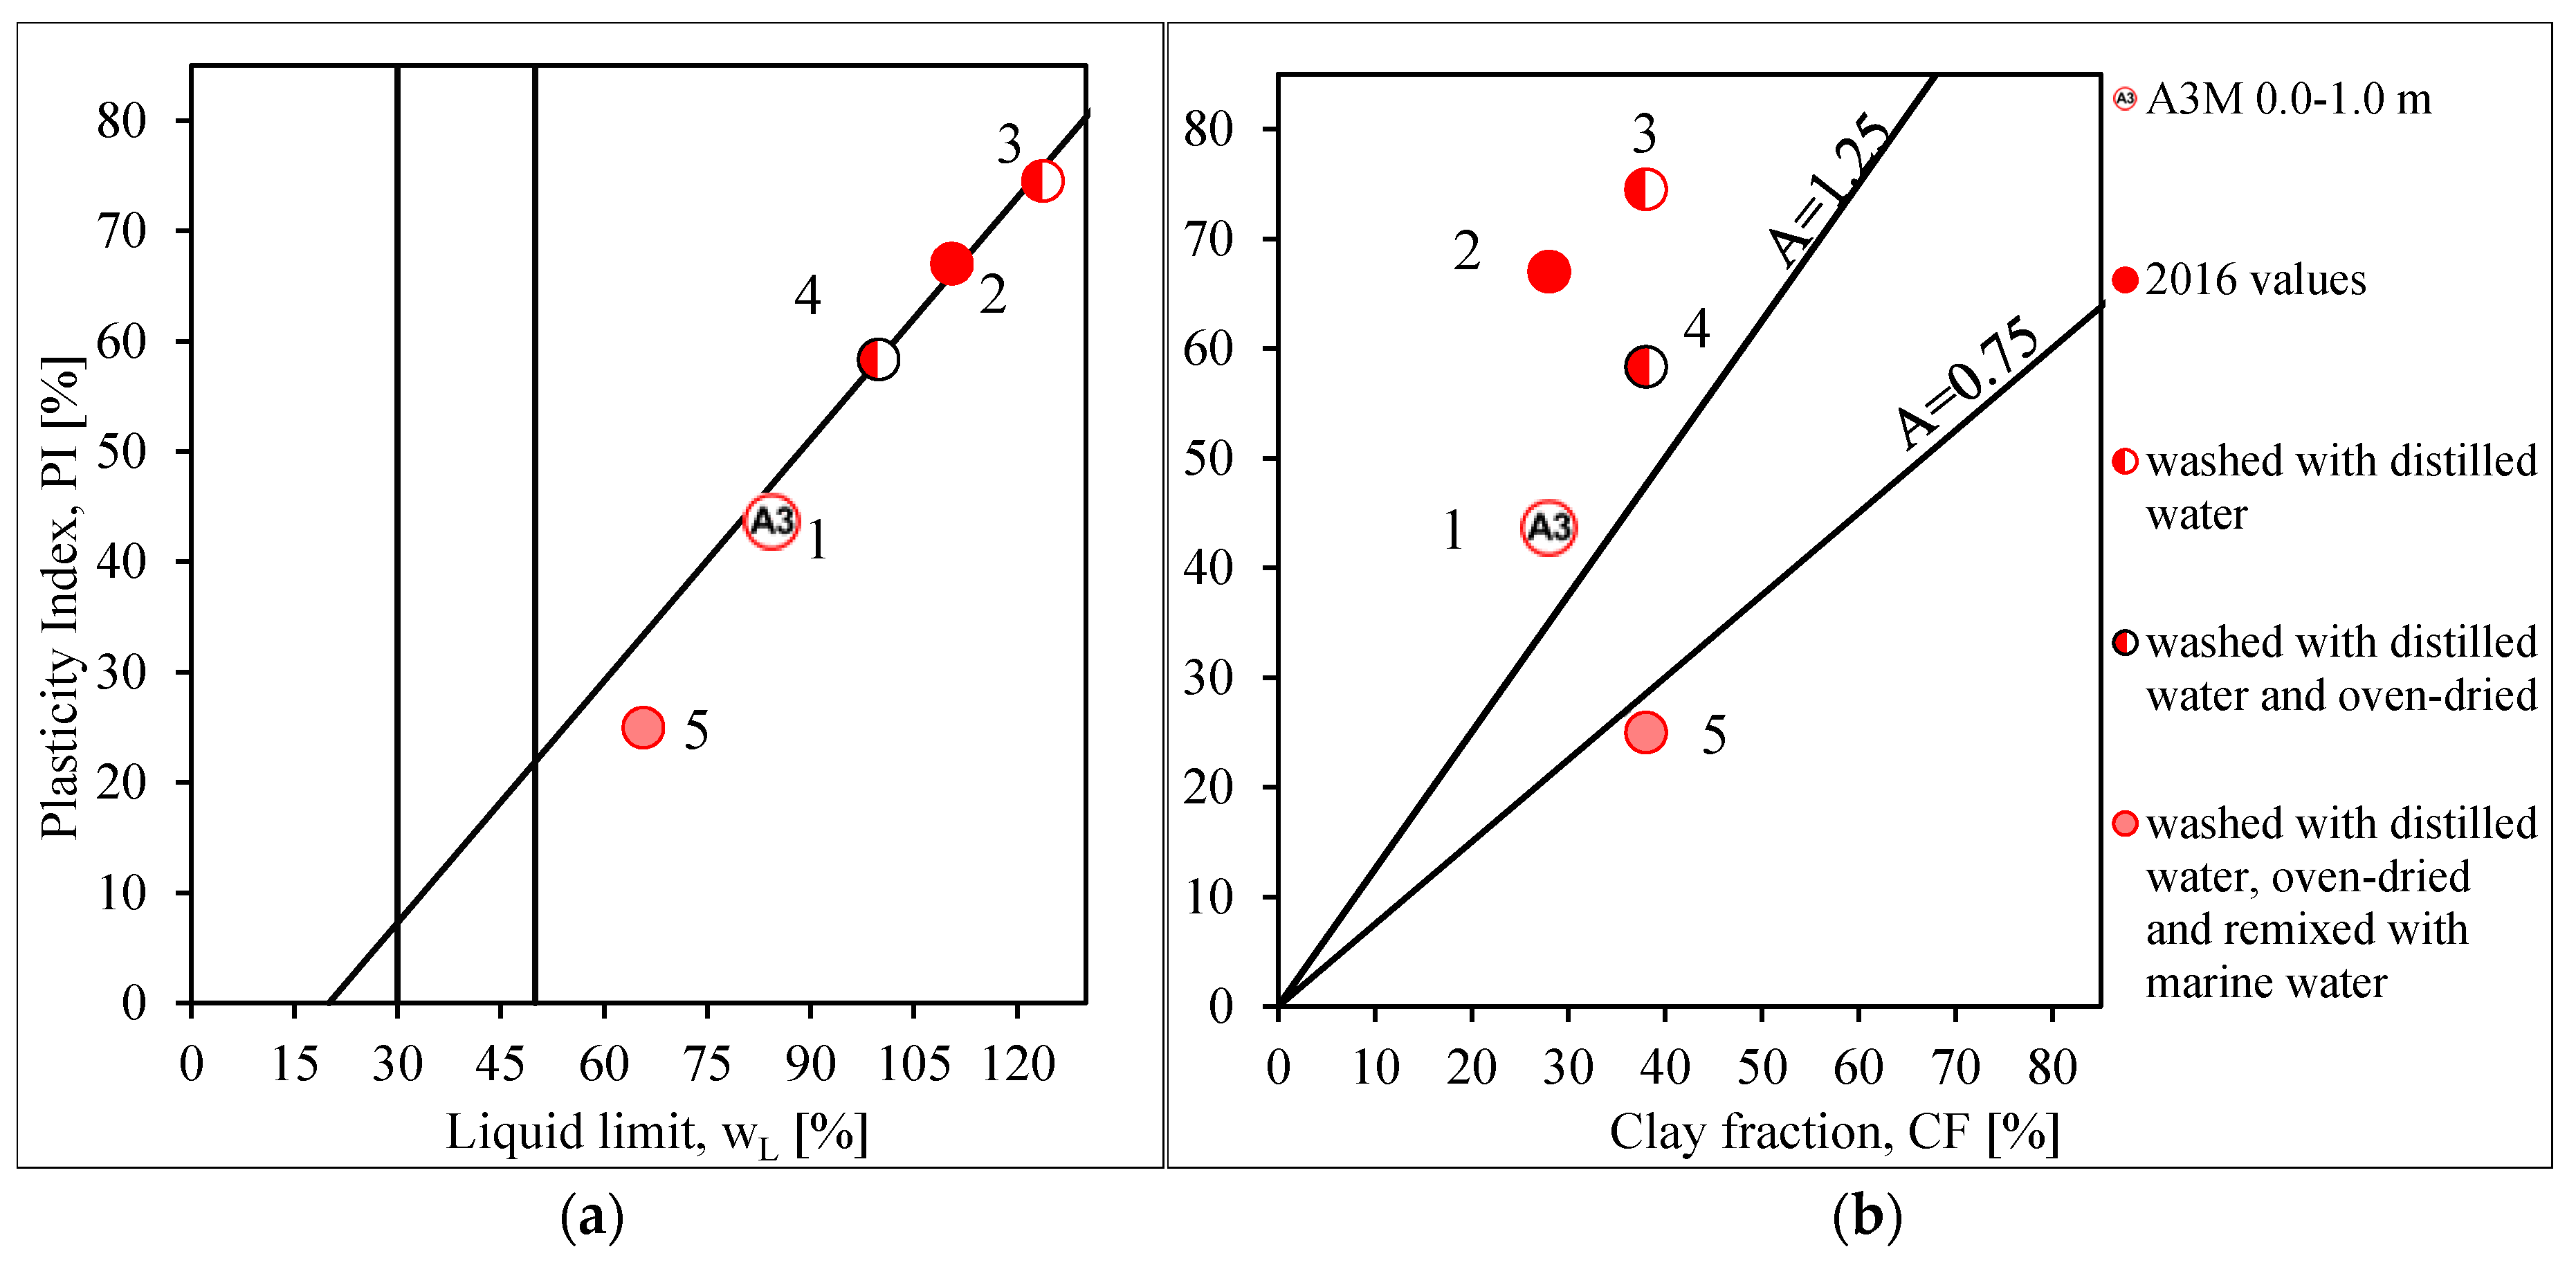
3.1. Physical Properties, State, and Chemical Composition

The data presented in the paper refer to chemical and geotechnical properties of MP sediments. The chemical investigation was conducted throughout the basin [22,28,29] on samples collected up to 3 m bsf, and the more recent geotechnical investigation was carried out within the most polluted “170 ha area” [42]. In the following, the characterization of sediments taken from site A3 will be presented, being both the deepest one and the site investigated in more detail through chemical, mineralogical and geotechnical analyses. The geotechnical data from [42] were modified in order to consider the influence of pore fluid salinity and shell fragments on the soil properties (see Section 2.3). Moreover, new mechanical results on the deepest sample belonging to the ASP formation were presented in this paper, together with the results of the experimental procedure carried out on a portion of the shallow sample A3-M, in order to test the sediment sensitivity to some chemical changes.
Composition and physical properties of the sediments from borehole A3 are summarized in Table 3. Along the studied borehole (located as in Figure 1b), the transition from recent Holocene sediments, H, to ASP formation, was recognized at about 16 m bsf [42]. The data show that the layer of recent sediments (H in Table 3) has a slightly lower clay fraction and higher sand fraction (i.e., CF = 28–36%, SF = 9–15%) than soils of the ASP formation (i.e., CF = 37–48%, SF = 6–12%). The recent sediments also have higher organic content: OMBS varies from 0.7% in ASP samples to 3–6% in H sediments, reaching the highest concentration at the top (Table 3). With respect to both intermediate and ASP samples, the top sediments are also characterized by lower Gs* and higher wL and PI values, which abruptly vary already at the transition with the intermediate layer of sediments, that exhibits values similar to those of the ASP. In term of state properties, γ increases with depth and both wf and e0 reduce, exhibiting a significant change between the top and the intermediate layer. Figure 5 and Figure 6a display, respectively, the chart of activity index, A, and the vertical profile of the liquidity index, LI, of all the samples under study. The Figures show that both A and LI of the sediments of the top layer (0–1 m bsf, A = 1.56, LI = 2.68) are much higher than those of both the sediments of the intermediate layer (3–6 m bsf, A = 0.61–0.88, LI = 1.26–1.57), and of the ASP (A = 0.53–0.66, LI = 0.62–1.23). Figure 6b testifies the significant difference in consistency of the soils along the investigated vertical.
The mineralogical analyses carried out on four samples down borehole A3 (Table 4, [42]) show that there is no significant variation with depth of the mineralogical composition, except for the halite and hematite contents and that a widespread presence of illite, interstratified illite/smectite, I/S, and chlorite/smectite, Chl/S, is recorded within the clay fraction [42]. Consistently with a similar composition, already from the intermediate layer the soil properties of the H samples tend to have values analogous to those of the ASP formation. On the other hand, the small variability in composition cannot explain the significant differences in the plasticity and activity index values recorded between the top layer and the deeper samples.
The chemical investigation of sediments carried out along A3CHEM borehole (Figure 1b) confirms the high content of organic matter in the shallow layer, since total organic carbon (TOC) [60], reduces from 8% in the first meter of sediments to 2.1% at depth [29].
During the same campaign, metals, i.e., Pb, Cu, Zn, and organic pollutants, i.e., PCB, were found above the site-specific limit (Table 1) within the top 3 m of sediments. The chemical analyses [29] show that, in the top layer, Pb, Cu, Zn reach the concentration of 784.80, 76.30, and 327.0 ppm, respectively, and PCBs assume as high values as 2.3 ppm. Further analyses carried out by Cardellicchio [61] on the A3-M sample (0–1 m bsf) offered an even more serious picture of the contamination in the top layer, since the concentration of As, Hg, Zn, and Cu exceeded the law limit values [34] in Table 1.

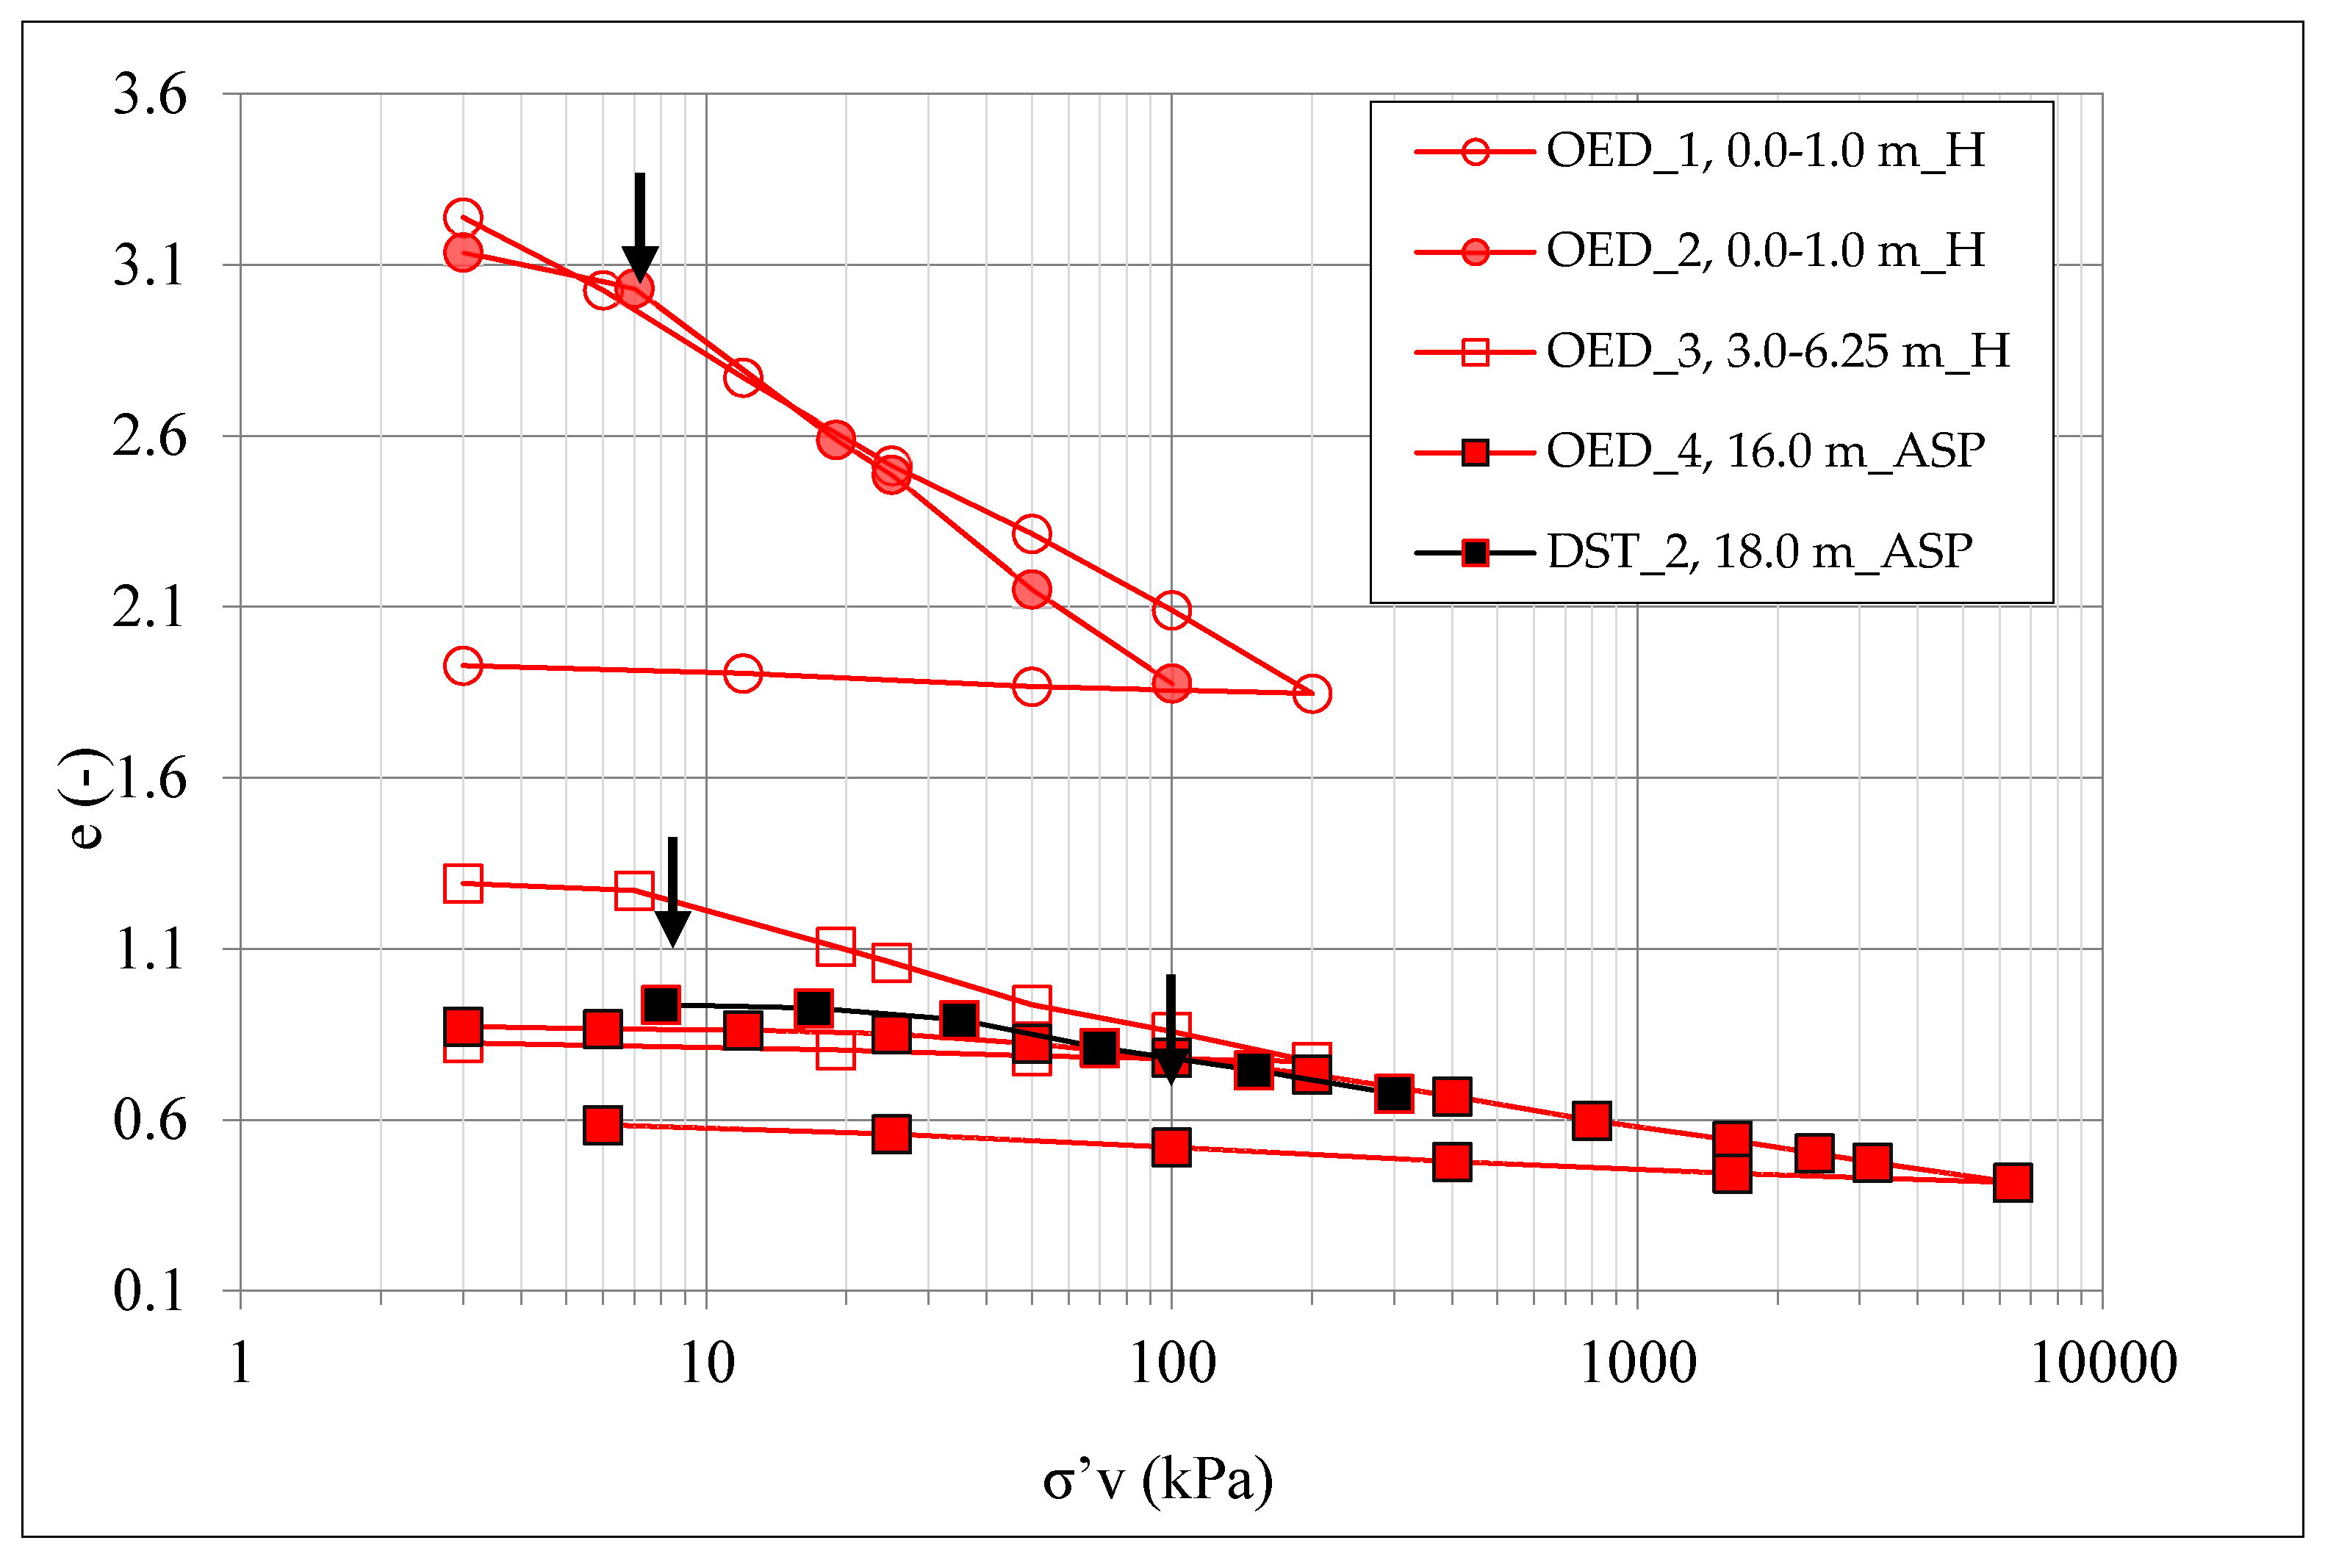
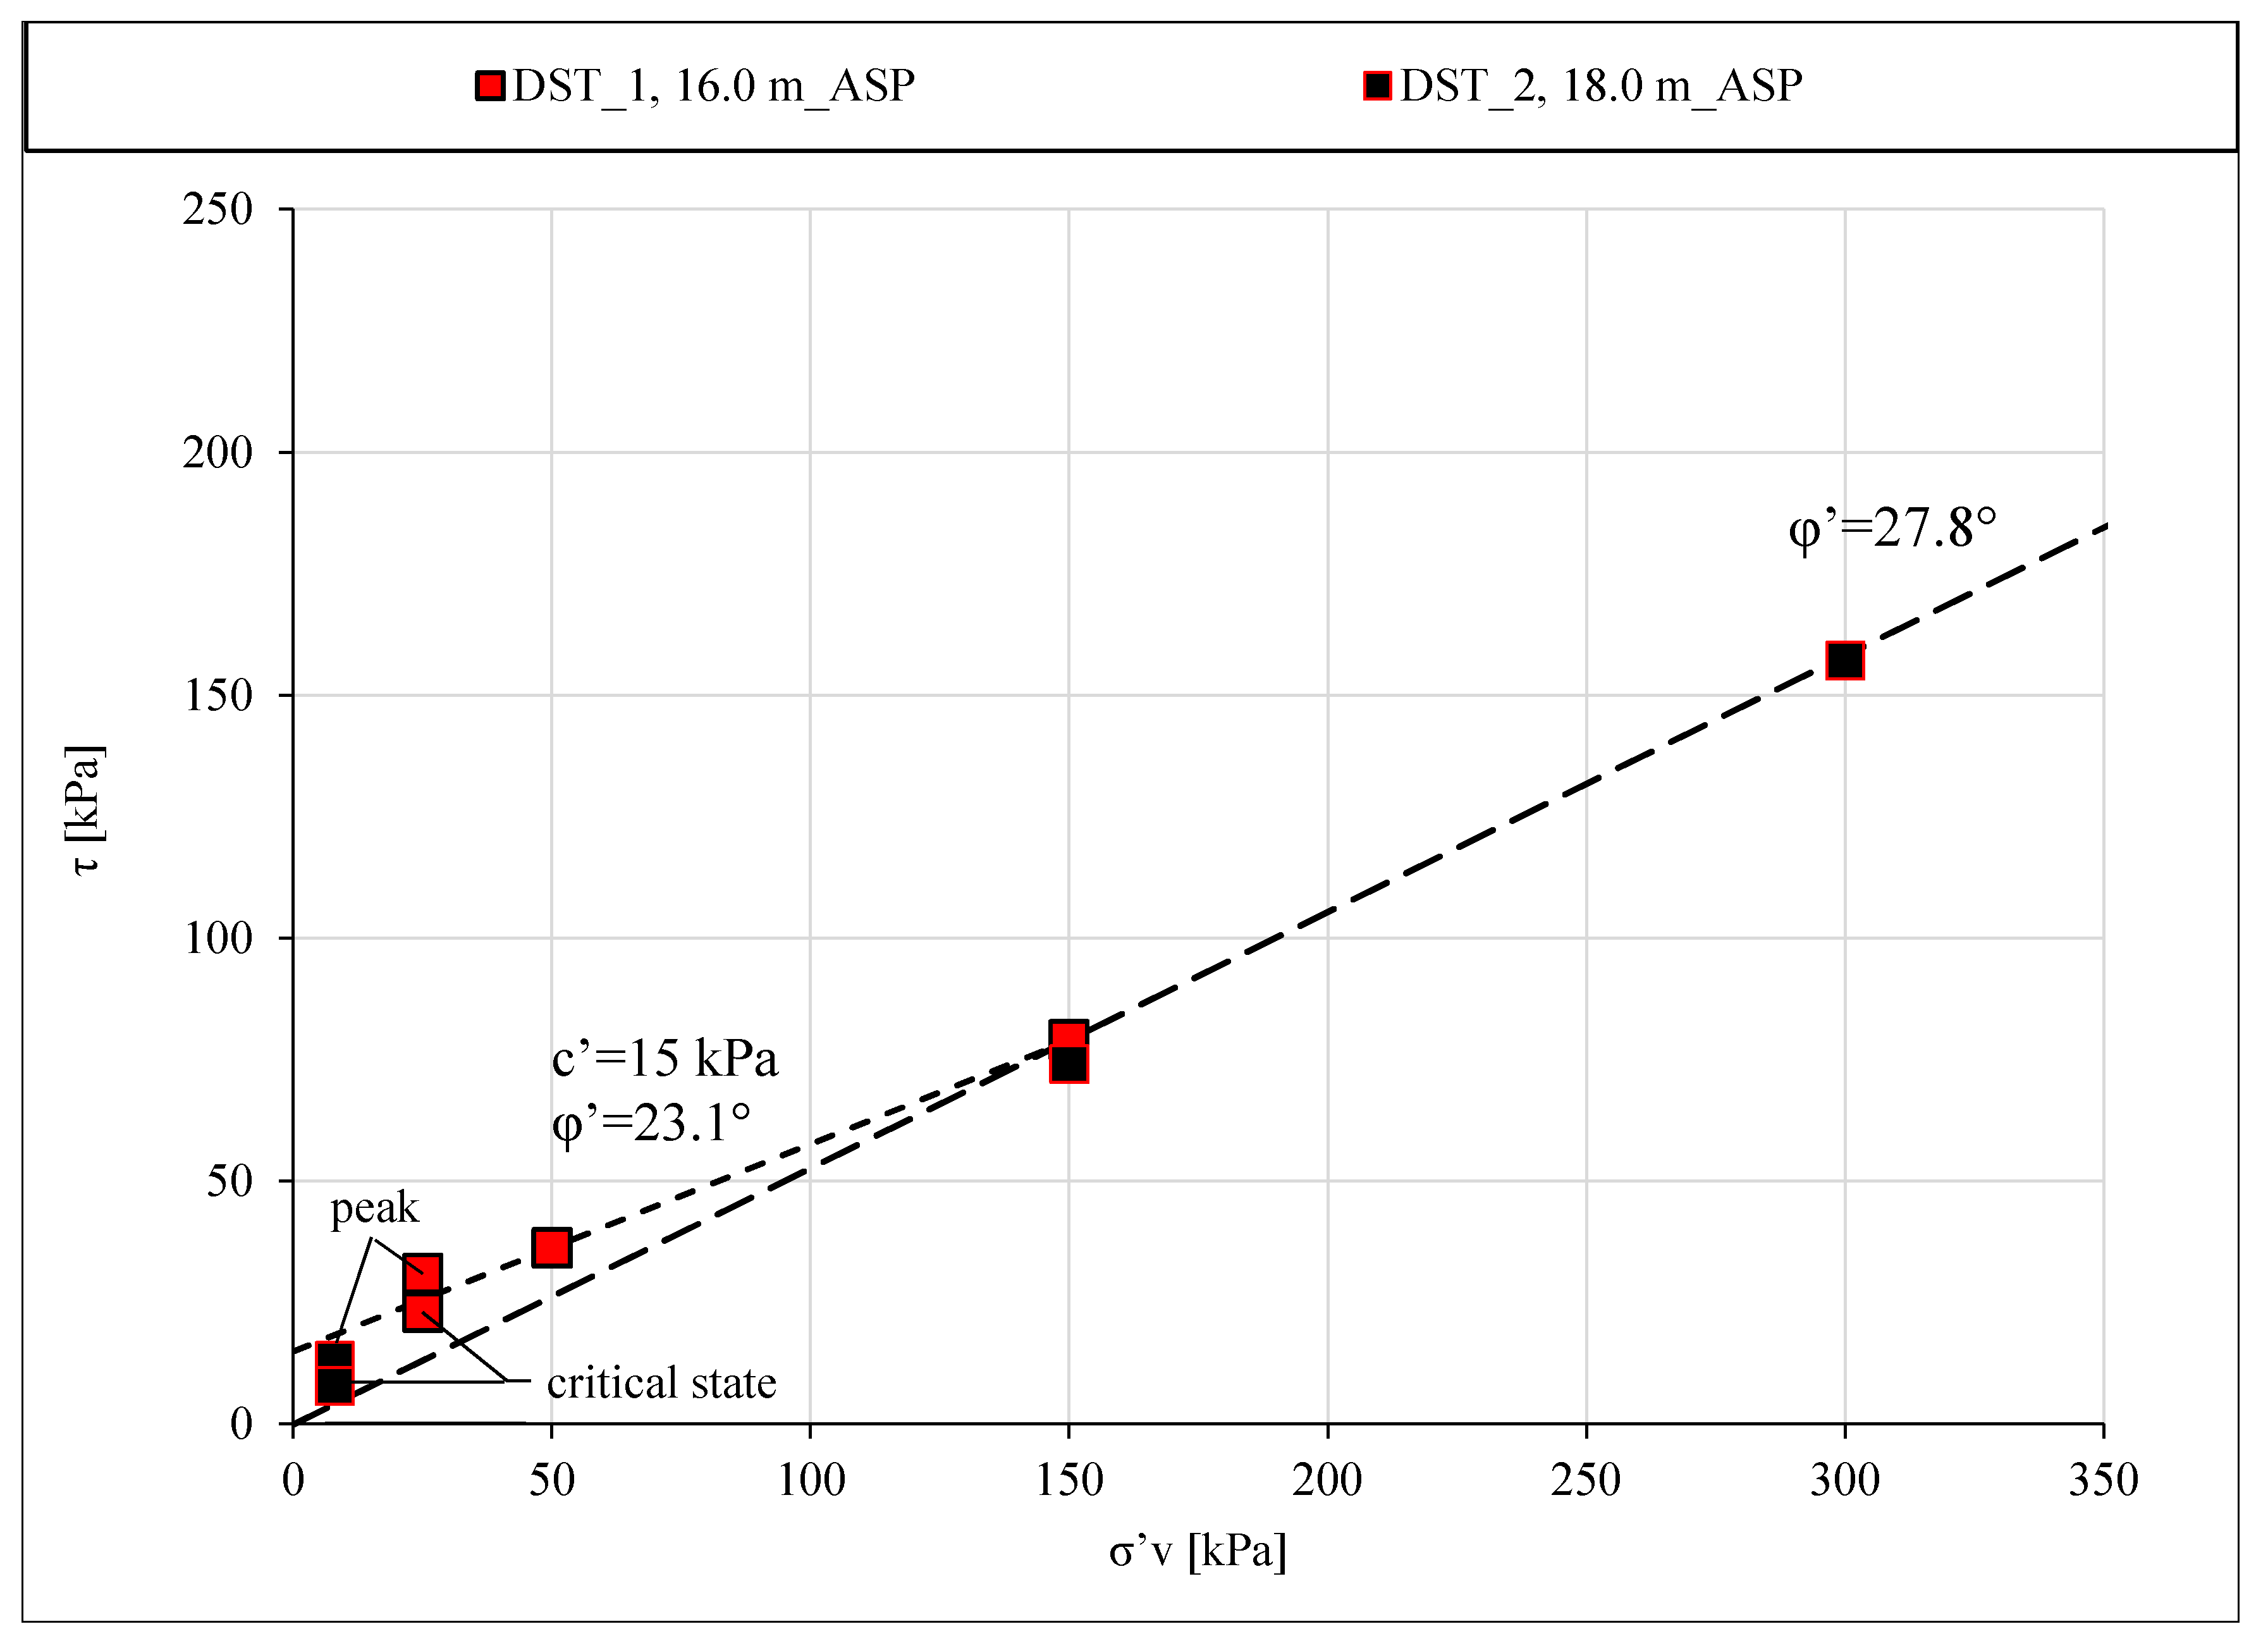
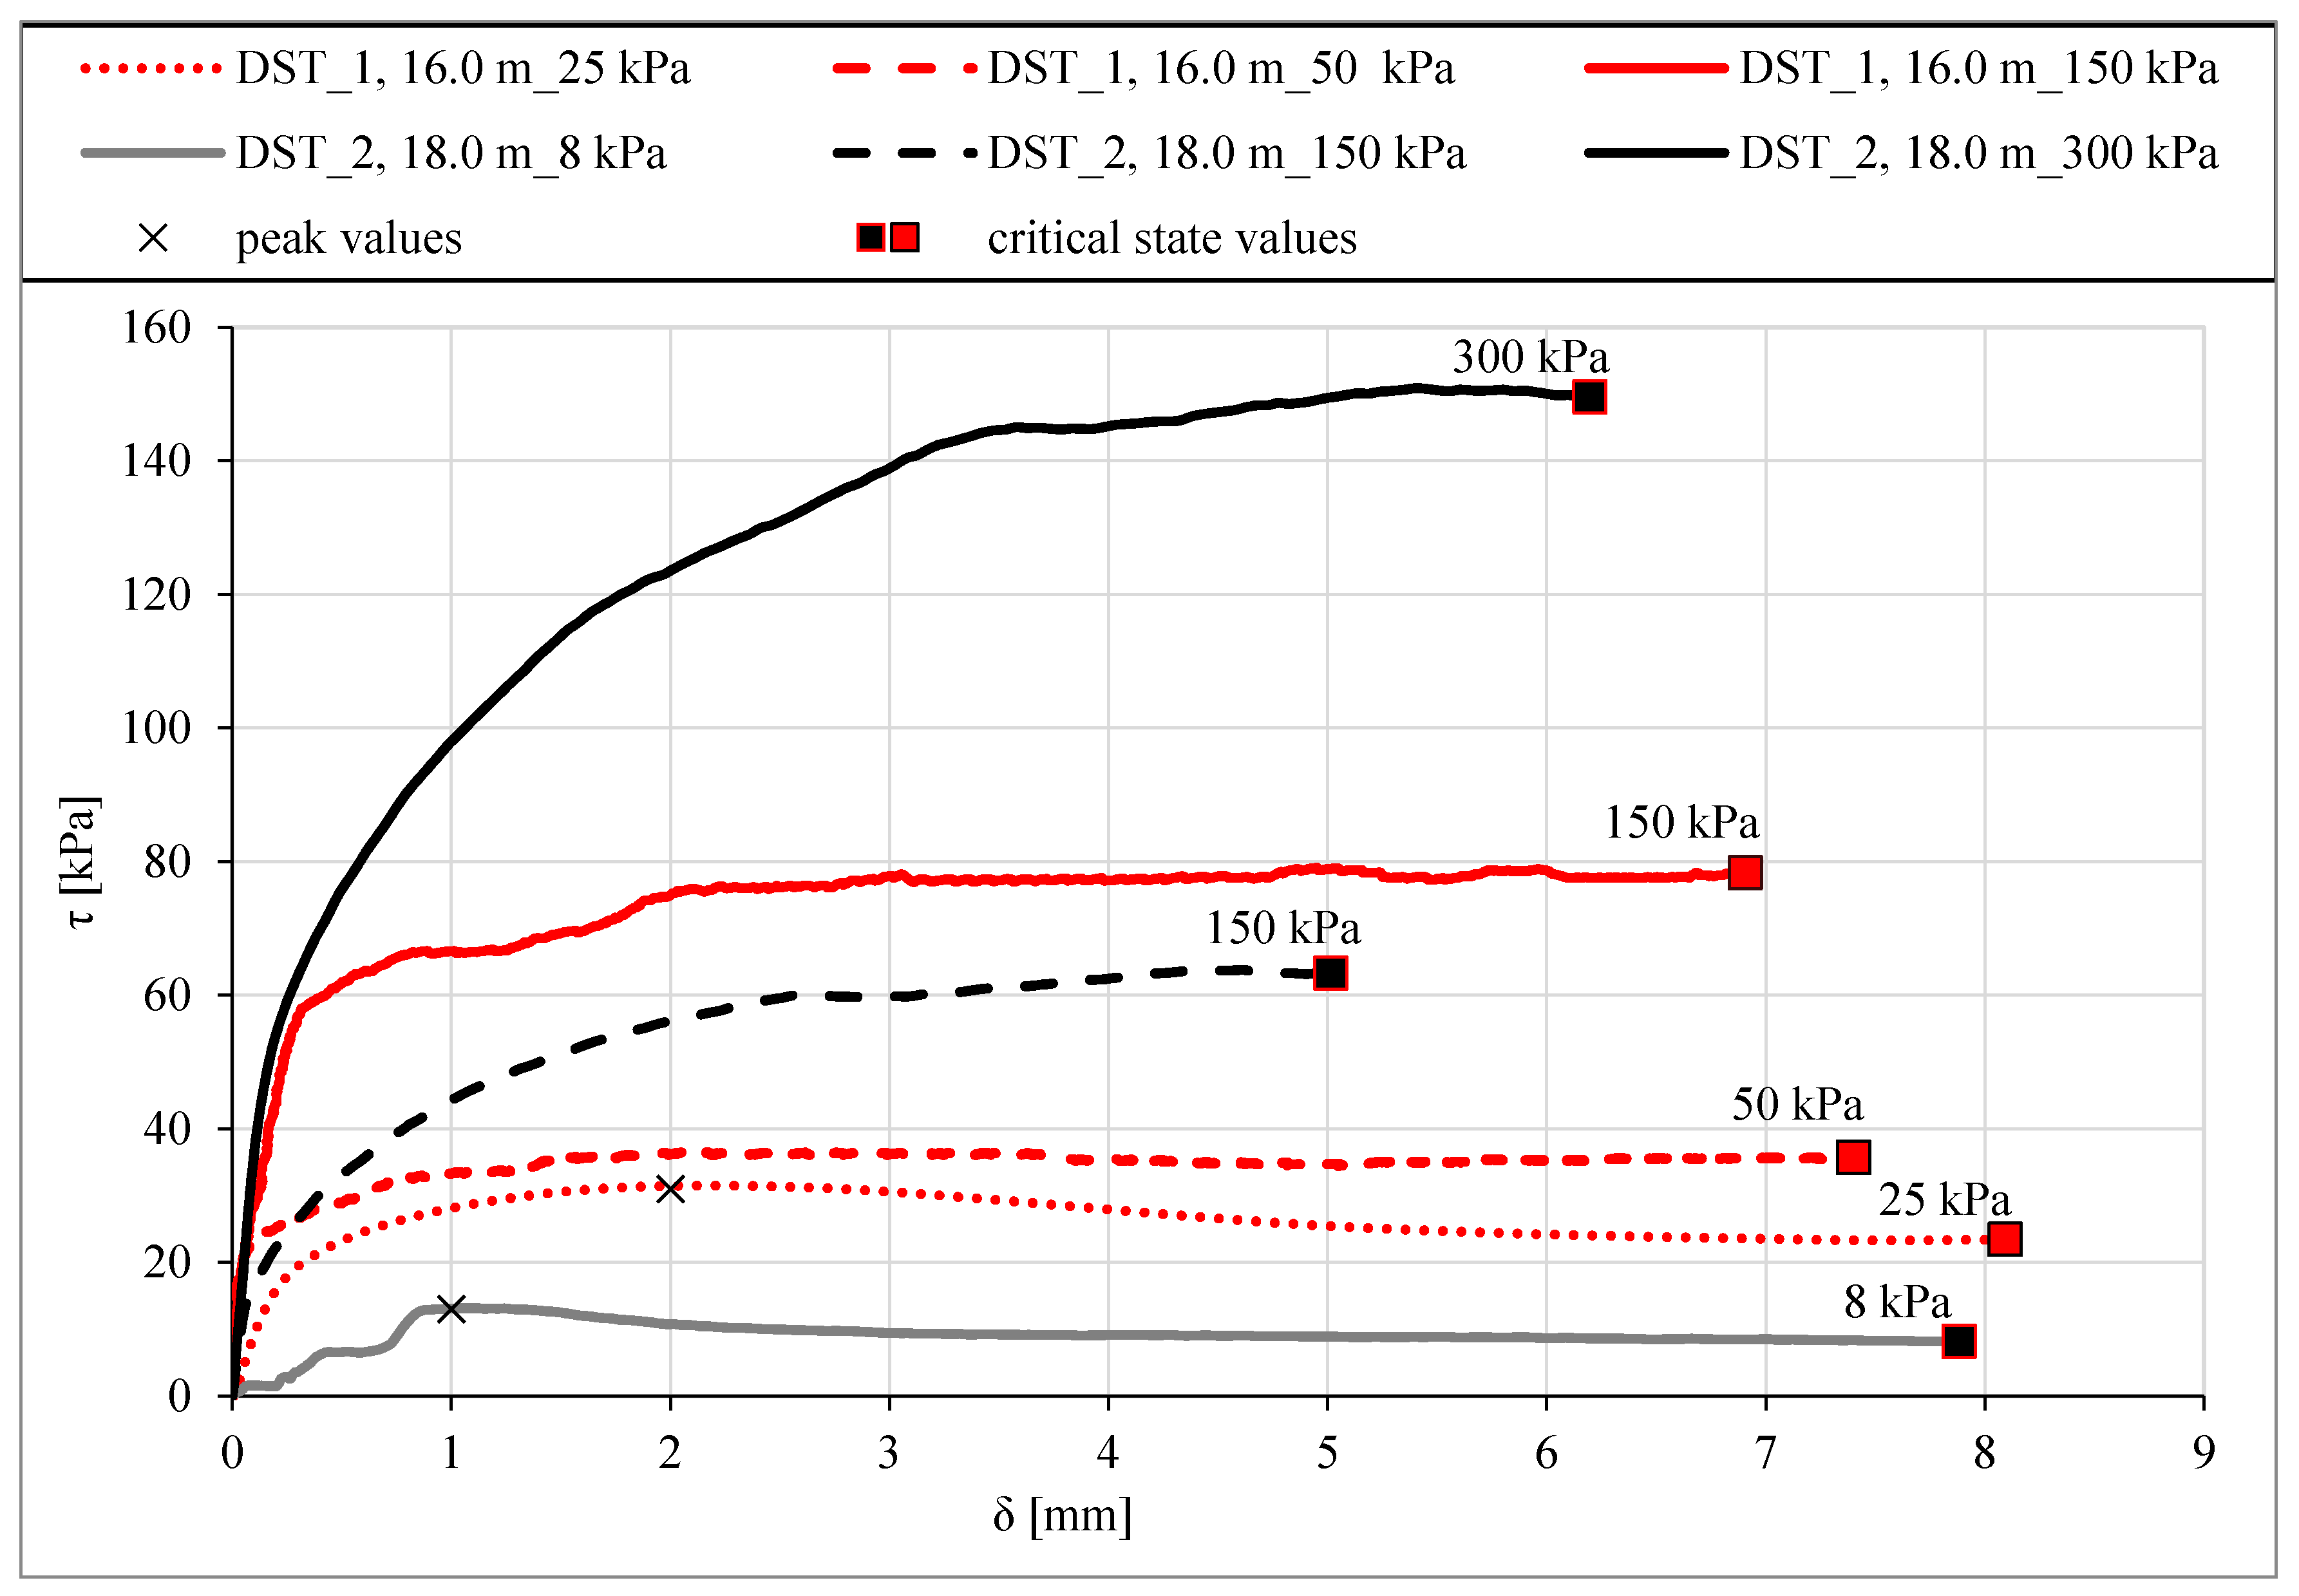
3.2. Mechanical Behavior

The one-dimensional compression of sediments due to the axial loading and unloading was detected by means of oedometer tests (OED), on samples collected at different depths from the seafloor up to 16.3 m bsf along site A3. The compression behavior of the deepest sample belonging the ASP formation (18.0 m bsf) was derived by the analyses of the consolidation curves of the specimen consolidated by means of incremental loading steps up to vertical effective stress equal to 300 kPa in the direct shear test (DST) apparatus, prior to the shearing phase. The results were compared with those obtained in the OED on the other ASP sample. The shearing behavior of the sediments was investigated by means DST, carried out on samples collected at different depths. Three specimens from each sample were prepared and consolidated to different values of vertical effective stress before shearing.
Figure 7 shows the void ratio, e—vertical effective stress, σ’v, one-dimensional compression curves of four OED specimens and one DST. As summarized in Table 2, the ASTM standard procedures were followed for both OED and DST.
The soil compression indexes during the loading and unloading phases, Cc and Cs respectively, were determined as the ratio between the total variation of void ratio, Δe, and the corresponding loading effective stress increment in the semi-logarithmic plane (i.e., Δlogσ′v). As described by [42], the compression index, Cc, of the recent sediments H (Figure 7) reduces abruptly from the sediments of the top layer (0–1 m bsf) to those of the intermediate layer (3–6 m bsf), consistently with the reduction recorded in soil plasticity (Table 3). In particular, Cc varies between about 0.8 and 1.0 in the first meter bsf (OED_1 and OED_2 in Figure 7), whereas it becomes significantly lower already for the specimen from the intermediate layer that has Cc = 0.35 at 3–6 m bsf (OED_3 in Figure 7). The vertical effective stress at yield, σ’y, (arrows in Figure 7) of the specimens varies from 7 kPa in the first meters bsf to 8 kPa at 3–6 m bsf.
Both the tests OED_4 and DST_2, allowed to recognize that the ASP samples, taken from 16.0 to 18.0 m bsf, exhibit lower compressibility index, Cc, which varies between 0.18 and 0.23 and a higher vertical effective stress at yield, that ranges between 80 and 100 kPa.
The swelling index recorded during the unloading phase, Cs, varies from 0.031 in recent sediments (OED_3 in Figure 7) to 0.056 in ASP (OED_4 in Figure 7).
Concerning the shearing behavior of sediment of the top layer, previous data [42] defined the effective strength parameter at critical state as ϕ’cs = 35°. The high value of friction angle at critical state is affected by the abundance of shell fragments in the soil matrix (Figure 8). Figure 9 reports the strength envelope in the shear stress, τ—vertical effective stress, σ’v, plot of the two samples of the ASP formation, DST_1 and DST_2, collected at 16.0 and 18.0 m bsf, respectively. The ASP specimens consolidated to vertical effective stress lower than the yield stress determined by OED tests (Figure 7), exhibit a dry behavior during the shearing phase, according Critical State Soil Mechanics [62,63]. These specimens sheared at vertical effective stress ranging from 8 to 25 kPa, reach a peak strength and strain-soften (Figure 10). The peak strength envelope is expressed by the effective strength parameters equal to c’p = 15 kPa and ϕ’p = 23.1° (Figure 9). For consolidation stress higher than the yield stress and ranging between 150 and 300 kPa, the specimens harden up to large displacements (Figure 10), following the wet behavior. The specimen of DST_1, that was sheared at 50 kPa, exhibit an intermediate behavior (Figure 10). The corresponding effective strength envelope is characterized by parameters at critical state, that are equal to c’cs = 0 kPa and ϕ’cs = 27.8° (Figure 9).

3.3. Washing Tests Results

The present section describes the variation in soil plasticity that the shallow sample A3-M has undergone because of both washing and drying procedures, that were carried out as preliminary tests aiming to understand the sensitivity of the shallow sediments to changes in contents of water salinity and organic matter, the latter also including organic pollutants. The results of the washing phases described in Section 2.3 are reported in the Casagrande plasticity chart and in the activity chart in Figure 11a,b, respectively. The starting point in the graphs is given by the Atterberg limits and the activity index (points 1 in Figure 11a,b) determined soon after sampling on the sediments taken within the first meter of the A3 vertical (i.e., sample A3-M).
Path 1–2 in Figure 11a testifies a noticeable increase of both the liquid limit and the plasticity index only due to the storage of the shallow sample in the fridge for two years. The Atterberg limits variability with time suggests that physical changes—probably due to either variation in water salinity, or contaminant degradation processes—have occurred within the sediments. Moreover, post-sampling microbial activities may degrade and alter organic material originally present and representative of in situ conditions [64,65] and explain such changes in soil behavior.
Points 3 in Figure 11a,b represents the properties of the sample tested after washing with distilled water, as described in the Section 2.3. Path 2–3 in Figure 11a is indicative of an increase in both liquid limit and plasticity index as salinity decreases. Moreover, a quite significant increase of clay fraction from 28% to 40% was measured, with a slight decrease of the soil activity (path 2–3 in Figure 11b).
The determination of the Atterberg limits on the same washed material, after oven drying, gave points 4 in Figure 11a,b. A reduction in both liquid limit and plasticity index was recorded (path 3–4 in Figure 11a,b), as a consequence of the combustion of the organic matter, that causes a decrease in the clayey soil plasticity (e.g., [65,66,67,68]) The reduction of liquid limit in organic clay after oven drying is also accounted for by the Unified Soil Classification System [69]. Finally, the determinations carried out on the sample after washing, oven-drying, and re-mixing with the MP marine water (points 5 in Figure 11a,b), show that the soil exhibits a further reduction in soil plasticity and liquid limit when the salinity increases (path 4–5 in Figure 11a,b), reaching values also lower than the initial ones (points 1).

4. Discussion

The experimental data obtained along a soil vertical profile within a polluted area of the MP show that the top layer of sediments of recent deposition exhibit geotechnical properties significantly different from those of the medium to large depth-soils and those of the ASP formation. These differences occur despite the homogeneity of mineralogical composition (Table 4), that should lead to homogeneity in the index properties [64,70], other factors being equal. Specifically, the top layer of H sediments in MP is characterized by higher liquid limit and both activity and plasticity index values than the medium and deep samples (Table 3). This finding cannot be attributed to an enrichment in fine fraction, because the top layer has a slightly higher sand fraction along the A3 borehole. Moreover, the mineralogical composition of the top layer cannot justify the very high value of the activity index, that is also above the range of activity expected for sediments made of a solid skeleton of such mineralogy (i.e., Illite A = 0.5–1; Smectites A = 1–7; Kaolinite A = 0.5 [70]), saturated with fresh water. In addition, the soil solid specific gravity assumes a lower value in the top layer, and the soil natural state is indicative of a more open fabric of the material, which exhibits higher natural fluid content and void ratio and lower soil unit weight (Table 3) than at medium and larger depths. As expected for normally consolidated clays with high plasticity [70,71], the soil compressibility is also higher at top of the MP deposit. However, the average compressibility of the shallow layer of sediments, Cc_av, equal to 0.9 (Table 5) is even higher than what was predicted for normally-consolidated sediments, e.g., following the relation proposed by [71] to compute the compressibility as function of liquid limit, Cc_Skempton:
Cc _ Skempton = 0.007 × ( w L 10 ) .
This discrepancy may be explained considering that Equation (3) excludes soil with high organic content.
Additionally, in terms of effective strength, the average values found for the MP shallow sediments seem to be larger than what expected according to the high plasticity, PI, of this layer. The relation between soil plasticity and critical state friction angle, ϕ’CS_Mitchell, [72] can be expressed as:
sin   ϕ CS _ Mitchell = 0.8 0.094 ln PI .
Values of critical state friction angle equal to 26° would be expected for soils with a plasticity index close to 84%, as the MP top layer. However, the larger measured values of ϕ’CS equal to 35° were related to the presence of shell fragments in the soil matrix. The DST test results show that the type of shearing behavior (WET–DRY) exhibited by the deep layer is found to comply with theoretical soil mechanics and the measured friction angle at critical state is consistent with the literature relations.
Hence, it emerges that the plasticity and activity indices, the state parameters, and the compressibility of the shallow sediments do not relate solely to the mineralogical composition of the soil skeleton, as observed for natural soils including fresh pore water. Such differences could be related to the contamination affecting the shallow layer. Among the other contaminants, the organic compounds, that reach high concentration in the shallow layer, can be adsorbed by negatively charged mineral surfaces and this adsorption modifies both the properties of the minerals and those of the organic material itself. Organic matter may absorb water and promote the aggregation of clay-size particles to form a more open fabric and soil-organic-matter aggregates (SOM) [70]. As a consequence, if OM is higher than 3%–5%, soils may be characterized by unusually high values of water content and plasticity index, with exceptionally low wet bulk densities [65,66,67,68], as in the case of MP sediments. Similar effects have been noted for organic-rich marine sediments, that have a natural water content that usually exceeds the liquid limit [73]. Furthermore, high activity is recorded for sediments from the Saguenay Fjord (Canada) for OM contents higher than 3% [68], and for estuarine clay sediments in Bothkennar (UK), despite the abundance of inactive minerals in clay fraction [74]. Additionally, the high compressibility of MP sediments can be linked to the increase in organic matter in the shallow layer, as discussed by several authors for organic soils [67,68]. On the other hand, the effect of OM on the shearing behavior of organic soil is more difficult to be predicted because it depends on both the state of decomposition and the features of the organic compounds [65]. The shallow MP sediments are characterized by a very high level of organic matter, as shown by the high values of OMBS, equal to 5.9% (Table 3), and TOC that reaches concentration of 3%. The organic matter is also associated to the metals, such as Hg, As, Cu, and Zn, that are abundant in the top layer. Once compared with the concentration of organic compounds such as PCBs, as high as 2.3 ppm, organic matter is recognised to include not only pollutants, but also a large portion of natural organic matter, as expected, given the peculiarity of the site. Indeed, the MP ecosystem and the biocenosis map give evidence of the productivity of the basin, rich in species which populate both the water column and the seafloor. As typical of marine environments, most of the organic matter in the sediments comes from the biosynthesis of organisms existing in the shallowest layers of the water column and is transported to the bottom as a Particulate Organic Matter (POM). Moreover, in this shallow marine basin, near the coast, terrigenous contribution of organic matter (allochthone OM) occurs: MP receives agricultural inputs and untreated wastewater that increase the nutrient discharges in the sediments and lower the water quality.
It is reasonable to infer that the higher organic content, which includes a percentage of organic pollutants and interact with heavy metals, may cause the peculiar properties of state, plasticity, and compressibility exhibited by the top layer (Table 3 and Table 5).
The sensitivity of the MP plasticity to changing in organic matter was also verified by the washing tests carried out on the A3-M sample, under controlled conditions.
Due to degradation of organic matter during oven drying, the Atterberg limits and activity index decrease in the dried sample (path 3–4 in Figure 11a). Furthermore, the circumstance that the end and the starting points in both the plasticity and activity charts (i.e., points 1 and 5 in Figure 11a,b, respectively) do not coincide, despite their similar salt content, seems to highlight the effect of the permanent loss of organic matter undertaken by the soil during the previous oven drying step. Specifically, points 5 in Figure 11a,b are representative of a less organic material and, as expected, they show lower plasticity.
Although the pore fluid salinity does not vary significantly with depth, the variability of soil properties determined on A3-M during the washing tests suggests that the plasticity of the MP sediments is also sensitive to variation in salt concentration. The sample exhibits an increase in liquid limit and plasticity index after washing with distilled water (path 2–3 Figure 11a,b), and their decrease after mixing with salt water (path 4–5 Figure 11a,b). The response of the MP sediments to variation in salinity is typical of pure illite [75] or soil of active mineralogy [3,75,76]. In these cases, plasticity increases when pore fluid salinity lowers, and reduces when pore fluid salinity increases.
Lastly, the washing procedure seems to suggest that the pore fluid salinity may affect the calculation of clay fraction determined by means of sedimentation. Indeed, during the washing procedure the time to obtain complete sedimentation of the mixture was found to increase step after step, as the pore fluid salinity decreases. Since the settling duration depends on the extent to which the washing procedure has been repeated (i.e., it increases with the number of washing cycles), the determination of the clay fraction of soils can be misleading, if CF is calculated through the Stokes’ law according to the ASTM Standards, which do not include specific washing procedures for marine sediments [54]. Furthermore, a higher clay content was measured on the washed sample with respect to the initial one (path 2–3, Figure 11b). The observed behavior seems to be in line with the reduction of the tendency for flocculation of the soil particles as salinity decreases. According to the diffusive double layer (DDL) theory, for concentrated solutions, the thickness of DDL reduces, the repulsion forces tend to reduce, and the attraction forces tend to increase, causing higher flocculation of soil particles.

5. Conclusions and Perspectives

This study represents an insight into the coupling between mechanical and chemical properties of submarine sediments from a highly-polluted site in the south of Italy. The geo-mechanical properties of a long submarine core were discussed in the light of the environmental and geological setting. The sediments are silty clays and clayey silts and their clay fraction is mainly represented by illite-smectite clay minerals. The geotechnical characterization pointed out that in the top layer the state, plasticity, and compressibility do not relate solely to the mineralogical composition of the soil skeleton, as observed for natural soils including fresh pore water, while the shearing behavior is affected by the presence of shells in the soil matrix. The analyses of the Mar Piccolo properties along a vertical profile, from the most contaminated shallow layer of Holocene deposit to the deep layer of Sub-Apennine clay basic formation, allowed to identify the variability of the soil behavior due to both the natural history of sedimentation and consolidation of the deposit and the presence of contamination. The contaminants, of both natural and anthropic origin, even when not dangerous for human safety, interact with soil particles of fine-grained soil, changing the behavior compared to what was expected for mineralogy and granulometry alone. This is the case of the organic matter, which includes organic pollutants and can attract heavy metals. A series of washing tests supported the interpretation of the aforementioned geotechnical variability, suggesting that the higher soil plasticity, activity, and compressibility of the top sediments with respect to the deeper layers are due to the higher organic matter of the shallow material.
A new campaign is currently on-going at several sites of the Mar Piccolo to deepen the environmental diagnosis of the site and, in particular, to investigate the spatial variability of both chemical and geochemical composition and geotechnical properties.

Author Contributions

Conceptualization, F.S., C.V. and F.C.; Data curation, F.S. and D.M.; Investigation, F.S.; Methodology, F.C.; Project administration, C.V. and F.C.; Supervision, M.P. and A.M.P.; Writing – original draft, F.S.; Writing – review & editing, C.V. and M.P.

Funding

The investigation campaign described in this publication was funded by the Agency for Environmental Protection of the Apulia Region (ARPA-Puglia) in the South of Italy. The development of the research activity was funded by Fondazione Puglia.

Acknowledgments

The authors are grateful to Fondazione Puglia for its support to the research, to A. Federico for making the geotechnical data available and to the technician Angelo Miccoli for his help in experimental laboratory testing.

Conflicts of Interest

The authors declare no conflict of interest.

References

  1. GESAMP (IMO/FAO/Unesco/WMO/WHO/IAEA/UN/UNEP Joint Group of Experts on the Scientific Aspects of Marine Pollution). Reducing Environmental Impacts of Coastal Aquaculture. Rep. Stud. GESAMP 1991, 47, 35. [Google Scholar]
  2. Hueckel, T. On effective stress concepts and deformation in clays subjected to environmental loads: Discussion. Can. Geotech. J. 1992, 29, 1120–1125. [Google Scholar] [CrossRef]
  3. Di Maio, C.; Santoli, L.; Schiavone, P. Volume change behaviour of clays: The influence of mineral composition, pore fluid composition and stress state. Mech. Mater. 2004, 36, 435–451. [Google Scholar] [CrossRef]
  4. Calvello, M.; Lasco, M.; Vassallo, R.; Di Maio, C. Compressibility and residual shear strength of smectitic clays: Influence of pore aqueous solutions and organic solvents. RIG 2005, 1, 34–47. [Google Scholar]
  5. Gajo, A.; Maines, M. Mechanical effects of aqueous solutions of inorganic acids and bases on a natural active clay. Géotechnique 2007, 57, 687–699. [Google Scholar] [CrossRef]
  6. Wahid, A.S.; Gajo, A.; Di Maggio, R. Chemo-mechanical effects in kaolinite. Part 1: Prepared samples. Géotechnique 2011, 61, 439–447. [Google Scholar] [CrossRef]
  7. Wahid, A.S.; Gajo, A.; Di Maggio, R. Chemo-mechanical effects in kaolinite. Part 2: Exposed samples and chemical and phase analyses. Géotechnique 2011, 61, 449–457. [Google Scholar] [CrossRef]
  8. Federico, A.; Vitone, C.; Murianni, A. On the mechanical behaviour of dredged submarine clayey sediments stabilized with lime or cement. Can. Geotech. J. 2015, 52, 2030–2040. [Google Scholar] [CrossRef]
  9. Santamarina, J.C.; Klein, K.; Palomino, A.; Guimaraes, M.S. Micro-Scale aspects of chemical–mechanical coupling: Interparticle forces and fabric. In Chemo-Mechanical Coupling in Clays: From Nanoscale to Engineering Applications, Proceedings of the Workshop, Maratea, Italy, 28–30 June 2001; Di Maio, C., Hueckel, T., Loret, B., Balkema, A.A., Eds.; Swets & Zeitlinger: Lisse, The Netherlands, 2002; pp. 47–64. [Google Scholar]
  10. Italian Law n. 349 Istituzione del Ministero dell’Ambiente e norme in materia di danno ambientale. Gazzetta Ufficiale della Repubblica Italiana n. 162 del 1986. Available online: https://www.minambiente.it/sites/default/files/legge_08_07_1986_349.pdf (accessed on 25 July 2019).
  11. Italian Law n. 426 Nuovi interventi in campo ambientale. Gazzetta Ufficiale della Repubblica Italiana n. 291 del 1998. Available online: https://www.gazzettaufficiale.it/atto/stampa/serie_generale/originario (accessed on 25 July 2019).
  12. Lisco, S.; Corselli, C.; De Giosa, F.; Mastronuzzi, G.; Moretti, M.; Siniscalchi, A.; Marchese, F.; Bracchi, V.; Tessarolo, V.; Tursi, A. Geology of Mar Piccolo, Taranto (southern Italy): The physical basis for remediation of a polluted marine area. J. Maps 2015, 12, 173–180. [Google Scholar] [CrossRef]
  13. Ricchetti, G.; Ciaranfi, N.; Luperto Sinni, E.; Mongelli, F.; Pieri, P. Geodinamica ed evoluzione sedimentaria e tettonica dell’Avampaese Apulo. Mem. Soc. Geol. Ital. 1988, 41, 57–82. [Google Scholar]
  14. Doglioni, C.; Mongelli, F.; Pieri, P. The Puglia uplift (SE Italy): An anomaly in the foreland of the Apenninic subduction due to the buckling of a thick lithosphere. Tectonics 1994, 13, 1309–1321. [Google Scholar] [CrossRef]
  15. Belluomini, G.; Caldara, M.; Casini, C.; Cerasoli, M.; Manfra, L.; Mastronuzzi, G.; Palmentola, G.; Sanso’, P.; Tuccimei, P.; Vesica, P.L. Age of Late Pleistocene shorelines, morphological evolution and tectonic history of Taranto area, Southern Italy. Quat. Sci. Rev. 2002, 21, 427–454. [Google Scholar] [CrossRef]
  16. Mastronuzzi, G.; Sansò, P. Pleistocene sea level changes, sapping processes and development of valleys network in Apulia region (southern Italy). Geomorphology 2002, 46, 19–34. [Google Scholar] [CrossRef]
  17. Mastronuzzi, G. Evoluzione dell’orografia antica della città di Taranto. In Proceedings of the Dal Kastron Bizantino al Castello Aragonese, Castello Aragonese, Taranto, Italy, 17 November 2004; Scorpione Editrice: Taranto, Italy, 2006; pp. 123–140. [Google Scholar]
  18. Mastronuzzi, G.; Sansò, P. Quaternary coastal morphology and sea level changes. In Proceedings of the Final Conference-Project IGCP 437 UNESCO - IUGS, GI2S Coast Coast-Gruppo Informale di Studi Costieri, Taranto, Italy, 22–28 September 2003; Research Publication Brizio srl: Taranto, Italy, 2003; p. 184. [Google Scholar]
  19. Cotecchia, V.; Lollino, G.; Pagliarulo, R.; Stefanon, A.; Tadolini, T.; Trizzino, R. Studi e controlli in situ per la captazione della sorgente sottomarina Galeso, Mar Piccolo di Taranto. In Proceedings of the International Congress of Geo-engineering, Torino, Italy, 27–30 September 1989; Associazione Mineraria Subalpina: Torino, Italy, 1989; pp. 475–484. [Google Scholar]
  20. Cotecchia, V. Le Acque Sotterranee E L’Intrusione Marina in Puglia: Dalla Ricerca All’Emergenza Nella Salvaguardia Della Risorsa. the Groundwater and the Seawater Intrusion in Apulia: From Research to Emergency in the Safeguard of the Water Resource. ISPRA. 2014. Available online: http://www.isprambiente.gov.it/it/pubblicazioni/periodici-tecnici/memorie-descrittive-della-carta-geologica-ditalia/le-acque-sotterranee-e-lintrusione-marina-in-puglia-dalla-ricerca-allemergenza-nella-salvaguardia-della-risorsa (accessed on 25 July 2019).
  21. Ciaranfi, N.; Pieri, P.; Ricchetti, G. Note alla carta geologica delle Murge e del Salento (Puglia centromeridionale). Mem. Soc. Geol. Ital. 1988, 41, 449–460. [Google Scholar]
  22. ISPRA. Elaborazione E Valutazione Dei Risultati Della Caratterizzazione AI Fini Della Individuazione Degli Opportuni Interventi Di Messa in Sicurezza E Bonifica Del Sito Di Interesse Nazionale Di Taranto. Available online: http://www.inchiostroverde.it/wp-content/uploads/2011/09/CII-El-PU-TA-Mar-Grande-II-Lotto-e-Mar-Piccolo-01.06.pdf (accessed on 25 July 2019).
  23. Panetta, P.; Dell’Angelo, B. I citri del Mar Piccolo di Taranto. Conchiglie 1975, 11, 65–86. [Google Scholar]
  24. De Serio, F.; Malcangio, D.; Mossa, M. Circulation in a southern Italy coastal basin: Modelling and field measurement. Cont. Shelf Res. 2007, 27, 779–797. [Google Scholar] [CrossRef]
  25. Conisma, Progetto Spicamar. Studio Pilota per La Caratterizzazione Delle Aree Marine a Rischio. Available online: http://www.conisma.it/it/ricerca-2/ricerca/ (accessed on 25 July 2019).
  26. Caroppo, C.; Rubino, F.; Giordano, L.; Trono, A.; Forleo, M.; Petrocelli, A.; Bellio, G.; Colella, R.; Palmieri, N.; Sclafani, P.; et al. System Design for ssa14 Mar Piccolo of Taranto (Southern Italy). Available online: http://spicosa-inline.databases.eucc-d.de/files/documents/00000925_System%20Design%20SSA14_%20Mar%20Piccolo_V02.pdf (accessed on 25 July 2019).
  27. Di Leo, A.; Cardellicchio, N.; Giandomenico, S.; Spada, L. Mercury andmethylmercury contamination in Mytilus galloprovincialis from Taranto Gulf (Ionian Sea, southern Italy): Risk evaluation for consumers. Food Chem. Toxicol. 2010, 48, 3131–3136. [Google Scholar] [CrossRef]
  28. ARPA PUGLIA. IL Mar Piccolo Di Taranto: Approfondimento Tecnico-Scientifico Sulle Interazioni Tra IL Sistema Ambientale Ed I Flussi Di Contaminanti Da Fonti Primarie E Secondarie. Available online: http://www.arpa.puglia.it/web/guest/rapporti (accessed on 25 July 2019).
  29. ICRAM. Progetto per La Messa in Sicurezza D’Emergenza Mar Piccolo—Area 170 Ha Sito Di Interesse Nazionale Di Taranto; Technical Report; ICRAM: Chioggia, Italy, 2005. [Google Scholar]
  30. Cardellicchio, N.; Buccolieri, A.; Di Leo, A.; Spada, L. Heavy metals in marine sediments from the Mar Piccolo of Taranto (Ionian Sea, Southern Italy). Ann. Chim. 2006, 96, 727–741. [Google Scholar] [CrossRef]
  31. Cardellicchio, N.; Buccolieri, A.; Di Leo, A.; Giandomenico, S.; Lopez, L.; Pizzulli, F.; Spada, L. Organic pollutants (PAHs, PCBs) in sediments from the Mar Piccolo in Taranto (Ionian Sea, Southern Italy). Mar. Pollut. Bull. 2007, 55, 451–458. [Google Scholar] [CrossRef]
  32. Petronio, B.M.; Cardellicchio, N.; Calace, N.; Pietroletti, M.; Pietrantonio, M.; Caliandro, L. Spatial and temporal heavy metal concentration (Cu, Pb, Zn, Hg, Fe, Mn, Hg) in sediments of the Mar Piccolo in Taranto. Water Air Soil Pollut. 2012. [Google Scholar] [CrossRef]
  33. ICRAM 2004. doc. # CII-Pr-PU-TA-valori intervento-01.04. Available online: https://va.minambiente.it/File/Documento/76634 (accessed on 25 July 2019).
  34. Italian Law n. 152 Norme in materia ambientale. Gazzetta Ufficiale della Repubblica Italiana n. 88 del 2006. Available online: https://www.gazzettaufficiale.it/atto/serie_generale/caricaDettaglioAtto/originario?atto.dataPubblicazioneGazzetta=2006-04-14&atto.codiceRedazionale=006G0171 (accessed on 25 July 2019).
  35. Mayer, L.M. Organic matter at the sediment–water interface. In Organic Geochemistry; Engel, M.H., Macko, S.A., Eds.; Springer: Boston, MA, USA, 1993; pp. 171–184. [Google Scholar]
  36. Meyers, P.A. Applications of organic geochemistry of paleolimnological reconstructions: A summary of examples from the Laurentian Great Lakes. Org. Geochem. 2003, 34, 261–289. [Google Scholar] [CrossRef]
  37. Caroppo, C.; Giordano, L.; Palmieri, N.; Bellio, G.; Paride Bisci, A.; Portacci, G.; Scafani, P.; Sawyer Hopkins, T. Progress towards sustainable mussel aquaculture in Mar Piccolo, Italy. Ecol. Soc. 2012, 17, 10. [Google Scholar] [CrossRef]
  38. EEC Reg. 1992/43. On the Conservation of Natural Habitats and of Wild Fauna and Flora (Habitat Directive). Available online: https://eur-lex.europa.eu/legal-content/IT/TXT/?uri=CELEX:31992L0043 (accessed on 13 March 2018).
  39. SPA Protocol. Protocol Concerning Specially Protected Areas and Biological Diversity in the Mediterranean; UNEP: Barcelona, Spain, 1995. [Google Scholar]
  40. Giandomenico, S.; Cardellicchio, N.; Spada, L.; Annicchiarico, C. Di Leo, A. Metals and PCB levels in some edible marine organisms from the Ionian Sea: Dietary intake evaluation and risk for consumers. Environ. Sci. Pollut. Res. Int. 2016, 23, 12596–12612. [Google Scholar] [CrossRef]
  41. Bartholini, G. L’Influenza Della Sostanza Organica Nei Processi Di Diagenesi Precoce Nei Sedimenti Del Mar. Adriatico E Ionio. Ph.D. Thesis, Alma Mater Studiorum—Università di Bologna, Bologna, Italy, 2015. [Google Scholar]
  42. Vitone, C.; Federico, A.; Puzrin, A.M.; Ploetze, M.; Carrassi, E.; Todaro, F. On the geotechnical characterisation of the polluted submarine sediments from Taranto. Environ. Sci. Pollut. Res. 2016, 23, 12495–12501. [Google Scholar] [CrossRef]
  43. ASTM D2216. Standard Test Methods for Laboratory Determination of Water (Moisture) Content of Soil and Rock by Mass; ASTM International: West Conshohocken, PA, USA, 2019. [Google Scholar]
  44. BS 1337. Methods of Test Soils for Civil Engineering Purposes; Classification Tests; BSI Standards Limited: London, UK, 2016. [Google Scholar]
  45. ASTM D4542. Standard Test Methods for Pore Water Extraction and Determination of the Soluble Salt Content of Soils by Refractometer; ASTM International: West Conshohocken, PA, USA, 2000. [Google Scholar]
  46. Imai, G.; Tsoruya, K.; Yano, K. A treatment of salinity in water content determination of very soft clays. Technical note. Soils Found. 1978, 19, 84–89. [Google Scholar] [CrossRef]
  47. Ho, E.W.L. Geotechnical Properties of Deep-Ocean Sediments: A Critical State Approach. Ph.D. Thesis, The City University, London, UK, 1987. [Google Scholar]
  48. Nash, D.F.T.; Sills, G.C.; Davison, L.R. One-dimensional consolidation testing of soft clay from Bothkennar. Géotechnique 1992, 42, 241–256. [Google Scholar] [CrossRef]
  49. Le, M.H. Caracterisation Physique ET Mecanique Des Sols Marins D’Offshore Profound. Ph.D. Thesis, l’Ecole Nationale des Ponts et Chaussées, Paris, France, 2008. [Google Scholar]
  50. ASTM D4318. Standard Test Methods for Liquid Limit, Plastic Limit, and Plasticity Index of Soils; ASTM International: West Conshohocken, PA, USA, 2017. [Google Scholar]
  51. ASTM D2487. Standard Practice for Classification of Soils for Engineering Purposes; ASTM International: West Conshohocken, PA, USA, 2017. [Google Scholar]
  52. Sollecito, F.; Cotecchia, F.; Vitone, C. Geotechnical characterisation of submarine sediments from a polluted site. Environ. Sci. Eng. 2019, 756–763. [Google Scholar] [CrossRef]
  53. Di Maio, C.; Onorati, R. Influence of pore liquid composition on the shear strength of an active clay. In Proceedings of the VIII International Symposium on Landslide, Wales, UK, 26–30 June 2000; pp. 1–463. [Google Scholar]
  54. ASTM D3080. Standard Test Method for Direct Shear Test of Soils Under Consolidated Drained Conditions; ASTM International: West Conshohocken, PA, USA, 2011. [Google Scholar]
  55. ASTM D422. Standard Test Method for Particle-Size Analysis of Soils; ASTM International: West Conshohocken, PA, USA, 2007. [Google Scholar]
  56. ASTM D854. Standard Test Methods for Specific Gravity of Soil Solids by Water Pycnometer; ASTM International: West Conshohocken, PA, USA; Available online: https://www.astm.org/Standards/D854 (accessed on 25 July 2019).
  57. CNR-UNI 10013. Prove Sulle Terre-Peso Specifico Dei Granuli; UNI: Milano, Italy, 1964. [Google Scholar]
  58. ASTM D2435. Standard Test Methods for One-Dimensional Consolidation Properties of Soils Using Incremental Loading; ASTM International: West Conshohocken, PA, USA; Available online: https://www.astm.org/Standards/D2435 (accessed on 25 July 2019).
  59. Adamo, F.; Andria, G.; Bottiglieri, O.; Cotecchia, F.; Di Nisio, A.; Miccoli, D.; Sollecito, F.; Spadavecchia, M.; Todaro, F.; Trotta, A.; et al. GeoLab, a measurement system for the geotechnical characterization of polluted submarine sediments. Measurement 2018, 127, 335–347. [Google Scholar] [CrossRef]
  60. Italian law, DM 13/09/1999 “Metodi ufficiali di analisi chimica del suolo”. Available online: http://ctntes.arpa.piemonte.it/Bonifiche/Documenti/Norme/13_Set_99.pdf (accessed on 25 July 2019).
  61. Cardellicchio, N.; (CNR, Institute for Marine Coastal Environment, Taranto, Italy). Personal Communication, 2014.
  62. Roscoe, K.H.; Schofield, A.N.; Wroth, C.P. On the yielding of soils. Géotechnique 1958, 8, 22–53. [Google Scholar] [CrossRef]
  63. Schofield, A.N.; Wroth, C.P. Critical State Soil Mechanics; McGraw-Hill: London, UK, 1968. [Google Scholar]
  64. Skempton, A.W. The consolidation of clays by gravitational compaction. Q. J. Geol. Surv. Lond. 1970, 125, 373–411. [Google Scholar] [CrossRef]
  65. Bennet, R.H.; Lehman, L.; Hulbert, M.H.; Harvey, G.R.; Bush, S.A.; Forde, E.B.; Crews, P.; Sawyer, W.B. Interrelationships of Organic Carbon and Submarine Sediment Geotechnical Properties. Mar. Geotechnol. 1985, 6, 61–98. [Google Scholar] [CrossRef]
  66. Pusch, R. Influence of salinity and organic matter on the formation of clay microstructure. In Proceedings of the International Symposium on Soil Structure, Gothenburg, Sweden, 1–2 August 1973; pp. 161–173. [Google Scholar]
  67. Coutinho, R.Q.; Lacerda, W.A. Characterization and consolidation of Juturnaiba organic clays. In Proceedings of the International Symposium of Geotechnical Engineering Soft Soils, Mexico City, Mexico, 13–14 August 1987; Volume 1, pp. 17–24. [Google Scholar]
  68. Levesque, C.L.; Locat, J.; Leroueil, S. Characterisation of postglacial sediments of the Saguenay Fjord, Quebec, Canada. In Characterisation and Engineering Properties of Natural Soils; Taylor & Francis Group: London, UK, 2007; pp. 2645–2677. [Google Scholar]
  69. ASTM D 2217. Standard Practice for Wet Preparation of Soil Samples for Particle-Size Analysis and Determination of Soil Constants; ASTM International: West Conshohocken, PA, USA, 1998. [Google Scholar]
  70. Mitchell, J.K.; Soga, K. Fundamentals of Soil Behavior, 3rd ed; John Wiley & Sons: Hoboken, NJ, USA, 2005. [Google Scholar]
  71. Skempton, A.W. Notes on the Compressibility of Clays. Q. J. Geol. Soc. Lond. 1944, 100, 119–135. [Google Scholar] [CrossRef]
  72. Terzaghi, K.; Peck, R.B. Soil Mechanics in Engineering Practice; John Wiley & Sons: Hoboken, NJ, USA, 1948. [Google Scholar]
  73. Keller, G.H. Organic matter and the geotechnical properties of submarine sediments. Geo-Mar. Lett. 1982, 2, 191–198. [Google Scholar] [CrossRef]
  74. Paul, M.A.; Barras, B.F. Role of organic material in the plasticity of Bothkennar clay. Géotechnique 1999, 49, 529–535. [Google Scholar] [CrossRef]
  75. Jang, J.; Santamarina, J.C. Fines classification based on sensitivity to pore-fluid chemistry. J. Geotech. Geoenviron. Eng. 2016, 142, 06015018. [Google Scholar] [CrossRef]
  76. Torrance, J.K. A laboratory investigation of the effect of leaching on the compressibility and shear strength of Norwegian marine clays. Géotechnique 1975, 24, 155–173. [Google Scholar] [CrossRef]
Figure 1. (a) Mar Piccolo basin in Taranto (Southern Italy) and map of the sampling sites. Red dots: ISPRA campaign (Institute for Environmental Protection and Research); dots in the circle: ARPA campaign (Regional Agency for Environmental Protection). (b) Location of the geotechnical ARPA boreholes (A1, A2, A3) and nearby chemical sites (A1CHEM, A2CHEM, A3CHEM) within the “170 ha area.”
Geosciences 09 00333 g001
Figure 2. Mar Piccolo: geological sketch ([19,20]).
Geosciences 09 00333 g002
Figure 3. Environmental features of the Mar Piccolo [22,28,29]. Statistical representation of pollution level by Hg (a) and polychlorinated biphenyls (PCBs) (b) in the first 50 cm below seafloor of the First Inlet, key: green, acceptable level (concentration below site-specific limit [33], Table 1); yellow, medium level (concentration above site-specific limit [33], Table 1); red, heavy level of pollution (concentration above law limit [34], Table 1). (c) Profiles of total organic carbon up to 3 m below the seafloor (bsf). (d) Map of biocenosis, key: seabed without algae; seabed covered by macroalgae; seabed covered by several species of algae; seabed covered by debris of shell fragments; black contours define the mussel cultivation areas; main submarine freshwater springs (Citri). Photographs of typical protected species in the area: Pinna nobilis bivalve (e), seahorse (f).
Geosciences 09 00333 g003
Figure 4. (a) Photo of a shallow sample (1 m bsf) rich in fossils and mussels. (b) Phases of the sediment settling process in cylinders after a step of soil washing with distilled water: start of sedimentation, 20 min later, end of sedimentation, respectively.
Geosciences 09 00333 g004
Figure 5. Activity chart of sediments from borehole A3 collected from Holocene (H) to Sub-Apennine clays (ASP) formations.
Geosciences 09 00333 g005
Figure 6. (a) Liquidity index profile along the A3 borehole; (b) photographs of the samples at different coring depths.
Geosciences 09 00333 g006
Figure 7. Compression curves of samples collected at different depths along borehole A3. ([42], modified). The arrows in the figure indicate the vertical effective stress at yield, σ’y.
Geosciences 09 00333 g007
Figure 8. Photographs of a dry direct shear test (DST) specimen from the top layer rich in shell fragments.
Geosciences 09 00333 g008
Figure 9. Strength envelopes of the Mar Piccolo (MP) deep sediments obtained by direct shear tests.
Geosciences 09 00333 g009
Figure 10. Direct shear test results of Sub-Apennine clay (ASP) samples: shear stress, τ, versus horizontal displacement, δ.
Geosciences 09 00333 g010
Figure 11. Results of the washing experiments on the Atterberg limits (a) and on the activity index (b) of the shallow sample A3-M.
Geosciences 09 00333 g011
Table 1. Concentration limits for soil pollution by organic compounds and metals (ppm).
PAHsPCBshmwHCsAsCdCrHgNiPbVCuZn
Site-specific law [33]40.19-2011600.810050-45110
National law [34]100575050158005.050010002506001500
Table 2. Synthesis of the geotechnical tests performed and of standard methods and corrections applied.
No.TestSymbolStandardNote
1Natural fluid contentwf[43]Corrected according to Equation (1)
2Atterberg limits (liquid and plastic limit)wL, wP[50,51]Corrected according to Equation (1)
3Soil fractions (clay, silt, sand and gravel fraction)CF, MF, SF, GF[55]Corrected for the presence of shell fragments (retained to the sieve No. 18 (1 mm))
4Specific gravity of soil solidsGs*[56,57]Corrected according to Equation (2)
5Bulk unit weightγFrom mechanical tests-
6Organic matterOMBS[44]-
7Oedometer testOED[58]Marine water in the cell, corrected according to Equation (1)
8Direct shear testDST[54]Marine water in the cell, corrected according to Equation (1)
Table 3. Composition and physical properties and geological features of the submarine sediments from borehole A3. Key: H, Holocene sediments; ASP, Sub-Apennine clays; M, manual sampling; UC, undisturbed sampling; CD, core drilling; SF, sand fraction; MF, silt fraction; CF, clay fraction; G*s specific gravity of soil solids; γ, total unit weight; e0, void ratio; wf, fluid content; wL, liquid limit; PI, plasticity index; LI, liquidity index; OMBS organic matter; nd, not determined.
DepthFmtSamplerSFMFCFGs*γe0wfwLPILIOMBS
(m bsf) (%)(%)(%)(-)(kN/m3)(-)(%)(%)(%)(%)(%)
0.00–1.00HM2052282.50513.853.95157.984.443.72.685.9
3.00–6.25HUC955362.59317.221.4756.844.122.11.57nd
6.25–10.75HCD1456302.661nd1.5056.549.726.61.26nd
10.75–15.25HCD1552332.656nd1.6060.250.827.71.343.2
16.00–16.30ASPUC654402.70118.721.1040.846.223.80.77nd
16.30–17.25ASPCD844482.665nd1.4955.850.827.61.18nd
17.25–18.00ASPCD946452.675nd1.3651.045.524.31.230.7
18.00–18.25ASPUC1251372.67018.141.0539.348.724.70.62nd
Table 4. Mineralogical composition (weight %) of the bulk sample and in the clay fraction (in parentheses) of the submarine sediments from borehole A3. Key: Qtz, quartz; K-feld, feldspars; Cal, calcite; Dol, dolomite; Hem, hematite; Hal, halite; I/S, illite/smectite; Chl/S, chlorite/smectite; I, illite; Kao, kaolinite; Chl, chlorite [42].
DepthQtzK-feldCalDolHemHalI/S + Chl/SIKaoChl
(m bsf)(%)(%)(%)(%)(%)(%)(%)(%)(%)(%)
0.00–1.0014320641527 (60)6 (22)3 (11)3 (7)
1.00–5.002262373421 (71)8 (18)2 (6)2 (5)
15.25–16.00197218<1<123 (62)12 (21)4 (10)5 (7)
Table 5. Summary of the measured properties and those computed as function of soil plasticity. Key: wL, liquid limit; PI, plasticity index; OMBS, organic matter; Cc_AV, measured average compressibility for the layer; Cc_Skempton, compressibility computed by Equation (4); ϕ’CS, critical state friction angle; ϕ’CS_Mitchell, critical state friction angle computed by Equation (5).
Sampling DepthwLPIOMBSCc_AVCc Skemptonϕ’CSϕ’CS_Mitchell
(m bsf)(%)(%)(%)(-)(-)(°)(°)
0.00–1.0084.443.75.90.900.523526
3.00–6.2544.122.1n.d0.350.24n.d30
16.00–16.3046.223.70.70.200.252829
18.00–18.2548.724.70.70.200.272829

