Article

Effective Formula for Impact Damping Ratio for Simulation of Earthquake-induced Structural Pounding

by
Seyed Mohammad Khatami
1,
Hosein Naderpour
2,
Rui Carneiro Barros
3,
Anna Jakubczyk-Gałczyńska
4 and
Robert Jankowski
4,*
1
Center of Semnan Municipality, University of Applied Science and Technology, 35149 Semnan, Iran
2
Faculty of Civil Engineering, Semnan University, 3513119111 Semnan, Iran
3
Faculty of Engineering, University of Porto (FEUP), 4200-465 Porto, Portugal
4
Faculty of Civil and Environmental Engineering, Gdansk University of Technology, 80-233 Gdansk, Poland
*
Author to whom correspondence should be addressed.
Geosciences 2019, 9(8), 347; https://doi.org/10.3390/geosciences9080347
Submission received: 10 May 2019 / Revised: 26 July 2019 / Accepted: 6 August 2019 / Published: 8 August 2019
(This article belongs to the Section Natural Hazards)

Abstract

:
Structural pounding during earthquakes may cause substantial damage to colliding structures. The phenomenon is numerically studied using different models of collisions. The aim of the present paper is to propose an effective formula for the impact damping ratio, as a parameter of the impact force model used to study different problems of structural pounding under seismic excitations. Its accuracy has been verified by four various approaches. Firstly, for the case of collisions between two structural elements, the dissipated energy during impact has been compared to the loss of kinetic energy. In the second stage of verifications, the peak impact forces during single collision have been analyzed. Then, the accuracy of different equations have been verified by comparing the impact force time histories for the situation when a concrete ball is dropped on a rigid concrete surface. Finally, pounding between two structures during earthquakes has been studied. The results of the analysis focused on comparison between dissipated and kinetic energy show relatively low errors between calculated and assumed values of the coefficient of restitution when the proposed equation is used. In addition, the results of the comparison between experimentally and numerically determined peak impact forces during single collision confirm the effectiveness of the approach. The same conclusion has been obtained for the whole impact time history for collision between a ball and a rigid surface. Finally, the results of the comparative analysis, conducted for pounding between two structures during an earthquake, confirm the simulation accuracy when the proposed approach is used. The above conclusions indicate that the proposed formula for impact damping ratio, as a parameter of impact force model for simulation of earthquake-induced structural pounding, is very effective and accurate in numerical simulations in the case of different scenarios.

1. Introduction

It is obviously accepted that insufficient separation distance between buildings, or bridge segments, provides many damages due to collisions during earthquakes, which is called structural pounding [1,2]. This phenomenon occurs when critical distance cannot cover relative movements under seismic excitations, and large lateral displacement exceeds separation distance between adjacent structures or structural elements [3,4,5,6,7,8].
In order to investigate earthquake-induced structural pounding, many researchers experimentally tested collisions between models of structures and also conducted numerical analyses using different impact force models. In order to calculate impact force during ground motions, several equations were suggested to describe the impact damping ratio so as to determine the energy dissipation. Anagnostopoulos [9,10], Maison and Kasai [11], Jankowski [12,13], Mahmoud et al. [14,15], Komodromos et al. [16,17], Ye et al. [18], Barros et al. [19], Naderpour et al. [20,21,22,23,24] as well as Bamer and Markert [25] analyzed a number of proposed models and also demonstrated the effects of earthquake-induced structural pounding. Moreover, Filiatrault et al. [26] presented results of shake table tests of pounding between adjacent single-bay steel framed model structures and compared them with predictions resulting from two existing pounding analysis programs. Masroor and Mosqueda [27] performed a series of earthquake simulator experiments to assess performance limit states of seismically isolated buildings under strong ground motions. Jankowski [28] presented the analysis of pounding between superstructure segments of a highway elevated bridge with three-span continuous deck under 3D non-uniform earthquake excitation and showed that the structural response depends much on the gap size between adjacent segments.
Moreover, Papadrakakis and Mouzakis [29] conducted the experimental study and analytical analysis focused on collisions between adjacent buildings during earthquakes. After static and shaking table dynamic tests, the results of experiments were compared with analytical results and good agreement was obtained. An interesting approach was also demonstrated by Papadrakakis et al. in [30]. The authors presented an effective method of testing the impacts of two, or more, adjacent buildings during earthquakes based on the Lagrange multiplier method. A solution scheme was proposed and the correlation between numerical and analytical results was found to be satisfactory. Shakya and Wijeyewickrema [31] presented the analysis of seismic pounding of reinforced concrete buildings of various heights, including the aspects of soil-structure interaction. Two configurations of buildings were considered and pounding between structures was modelled by impact Kelvin–Voigt elements. In most of the cases, the incorporation of soil, taken into account in the analysis, resulted in a lower normalized story shear. Kajita et al. [32] performed collision tests and simulation analyses using the three-dimensional finite element method. The authors proved that the maximum impact force can be roughly estimated from the simulation analyses. Miari et al. [33] carried out the in-depth analysis of the results of other researchers and also noted the recommendations concerning appropriate gap size between structures so as to prevent pounding. Cole et al. [34] analyzed damages observed in the February 2011 Christchurch earthquake. They found that susceptibility to building collisions during an earthquake can be identified with adequate accuracy by comparing specified configurations with characteristics previously noted by researchers. It is also worth mentioning the recent publication by Crozet et al. [35] who carried out the shaking table experimental tests which can be utilized as reference tests to be compared with the results of numerical analyses.
A number of the above-mentioned analyses considered the numerical models which can accurately simulate impact force in the specific situation taking into account the amount of dissipated energy during collision. However, there might be significant differences in the values of impact force and dissipated energy in the case of different pounding scenarios during earthquakes. Therefore, the aim of the present paper is to propose an effective formula for the impact damping ratio which can cover all situations and required parameters while representing the best accuracy. The effectiveness of the formula is confirmed by four different approaches.

2. Existing Formulae for Impact Force

In most of the cases, a special impact element, consisting of a spring and dashpot, is used to investigate collisions between two structures during earthquakes in order to simulate impacts and calculate energy absorption (see [9,10,11,12,13,14,15,16,17,18,19,20,21,22,23,24] for details). The general formula to calculate impact force during contact, F i m p ( t ) , is normally presented as [12,36]:
F i m p ( t ) = k s δ n ( t ) + c i m p δ ˙ ( t )
where Ks, Cimp, δ ( t ) and δ ˙ ( t ) are: Impact stiffness, impact damping, relative displacement and relative velocity, respectively. The power of n is usually taken as equal to 1 (linear models) or 1.5 (non-linear models). It should be added that the impact stiffness, Ks, should be obtained through the iterative procedure so as to equalize the peak pounding force determined from the simulations with the peak pounding force obtained from the experiment (see [12] for details). On the other hand, the impact damping, c i m p , used for simulation of earthquake-induced structural pounding can be directly calculated as [9,12]:
c i m p = 2 ζ i m p k s M e q ( for linear models ) c i m p = 2 ζ i m p k s δ ( t ) M e q ( for non-linear models ) M e q = m i m j m i + m j
where m i , m j are masses of colliding structures, or structural elements, and ζ i m p is the impact damping ratio which is related to the coefficient of restitution, CR, and can be defined by a general formula as in [37]:
C R = δ ˙ r e b o u n d δ ˙ i m p
where δ ˙ i m p is the relative prior-impact velocity and δ ˙ r e b o u n d is the relative post-impact rebound velocity (CR = 1 means a fully elastic collision and CR = 0 deals with a fully plastic impact). It should be underlined that the CR value may depend on a number of factors, such as: Masses and shapes of colliding structures, structural material properties and contact surface geometry [37]. The value can be determined experimentally in a simplified way by dropping a sphere on a massive plane plate of the same material from a specified height and observing the rebound height (see [37] for details). In spite of its simplicity, the method is yet accurate to obtain appropriate CR values so as to conduct the impact analyses.
Different formulae for impact damping ratio, ζ i m p , based on CR, were used by a number of researchers. Anagnostopoulos [9] proposed the impact damping ratio for the linear viscoelastic model to be described as (valid for 0 < C R 1 ):
ζ i m p = ln ( C R ) π 2 + ( ln ( C R ) ) 2
Mahmoud and Jankowski [15] suggested formula for the impact damping ratio in the modified linear viscoelastic model in the following form (valid for 0 < C R 1 ):
ζ i m p = 1 C R 2 C R ( C R ( π 2 ) + 2 )
Assuming that the damping term is activated only during the approach period of collision in order to simulate the process of energy dissipation which takes place mainly during that period.
On the other hand, Jankowski [13] considered the non-linear viscoelastic model of impact, in which the impact damping ratio is calculated as (valid for 0 < C R 1 ):
ζ i m p = 9 5 2 1 C R 2 C R ( C R ( 9 π 16 ) + 16 )
while also assuming that the damping term is activated only during the approach period of collision. The same assumption was taken into account by Barros et al. [19] who suggested another equation based on the nonlinear viscoelastic model and justified the impact damping ratio using the coefficient of restitution expressed by (valid for 0 < C R 1 ):
ζ i m p = ( ( 1 C R 2 ) C R ( π ( C R 2 + 1 π ) C R ) ) 2
Comparison between different impact force models using Equations (4)–(7) for one chosen CR value equal to 0.5 is shown in Figure 1. The figure clearly indicates that different equations show visible different results for the same CR value.

3. Effective Formula for Impact Damping Ratio

All previously proposed impact force models, applied to study structural pounding during earthquakes, define the impact damping ratio based on the coefficient of restitution. However, the results obtained for different models indicate that the use of them leads to visible different results for the same CR value. Therefore, there is a need to justify the equation for impact damping ratio in order to determine accurately all the responses during earthquakes. For the purpose of defining the parameter in a more general form, an iterative process has been designed using CRVK (coefficient of restitution—velocity—stiffness) optimization program (see [22] for details) so as to reach a formula for solving the simulation of impact and calculate the impact damping ratio. In this way, a new formula has been derived based on the CR value. The iterative process has been divided into two different parts. In the first one, the impact damping ratio has been defined as:
ζ i m p = μ ( 1 C R )
where μ is the parameter of the model.
Then, the effectiveness of CR has been investigated by the following procedure:
Firstly, values of CR and μ are selected and the process starts to solve the problem. The dissipated energy is calculated as being equal to the area of hysteresis loop during impact (A) and its value is compared to the loss of kinetic energy (E) determined as [37]:
E = 1 2 M e q ( 1 C R 2 ) δ ˙ i m p 2
Then, it is investigated whether the energy dissipation and the energy absorption are equal. If they are, μ is accepted and the output is obtained; otherwise, another value for μ is selected and the procedure is repeated.
Based on the results of the first part of the iterative process, the following expression has been obtained:
μ = 1 C R α α = 1.05 C R 0.653
In the second part of the iterative process, Equation (10) has been rectified so as to obtain the same responses by using different coefficients of restitution. Another parameter has been added to investigate in details the impact damping ratio for different scenarios. In this way, the equation has been improved into the following form:
ζ i m p = ( 1 C R ) C R α + β
where β is a coefficient which, based on the results of iterative process, has been determined as equal to:
β = 3.351 C R C R 0.204 π
So, the impact damping ratio can be defined by the following expression, as a proposed formula for the impact damping ratio used to study earthquake-induced structural pounding (valid for 0 < C R 1 ):
ζ i m p = ( 1 C R ) C R ( α + 0.204 ) + 3.351 C R π C R 0.204
The relation defined in Equation (13) is presented graphically in Figure 2. The detailed scheme of the above described iterative procedure used to determine the proposed formula for the impact damping ratio is also shown in Figure 3.

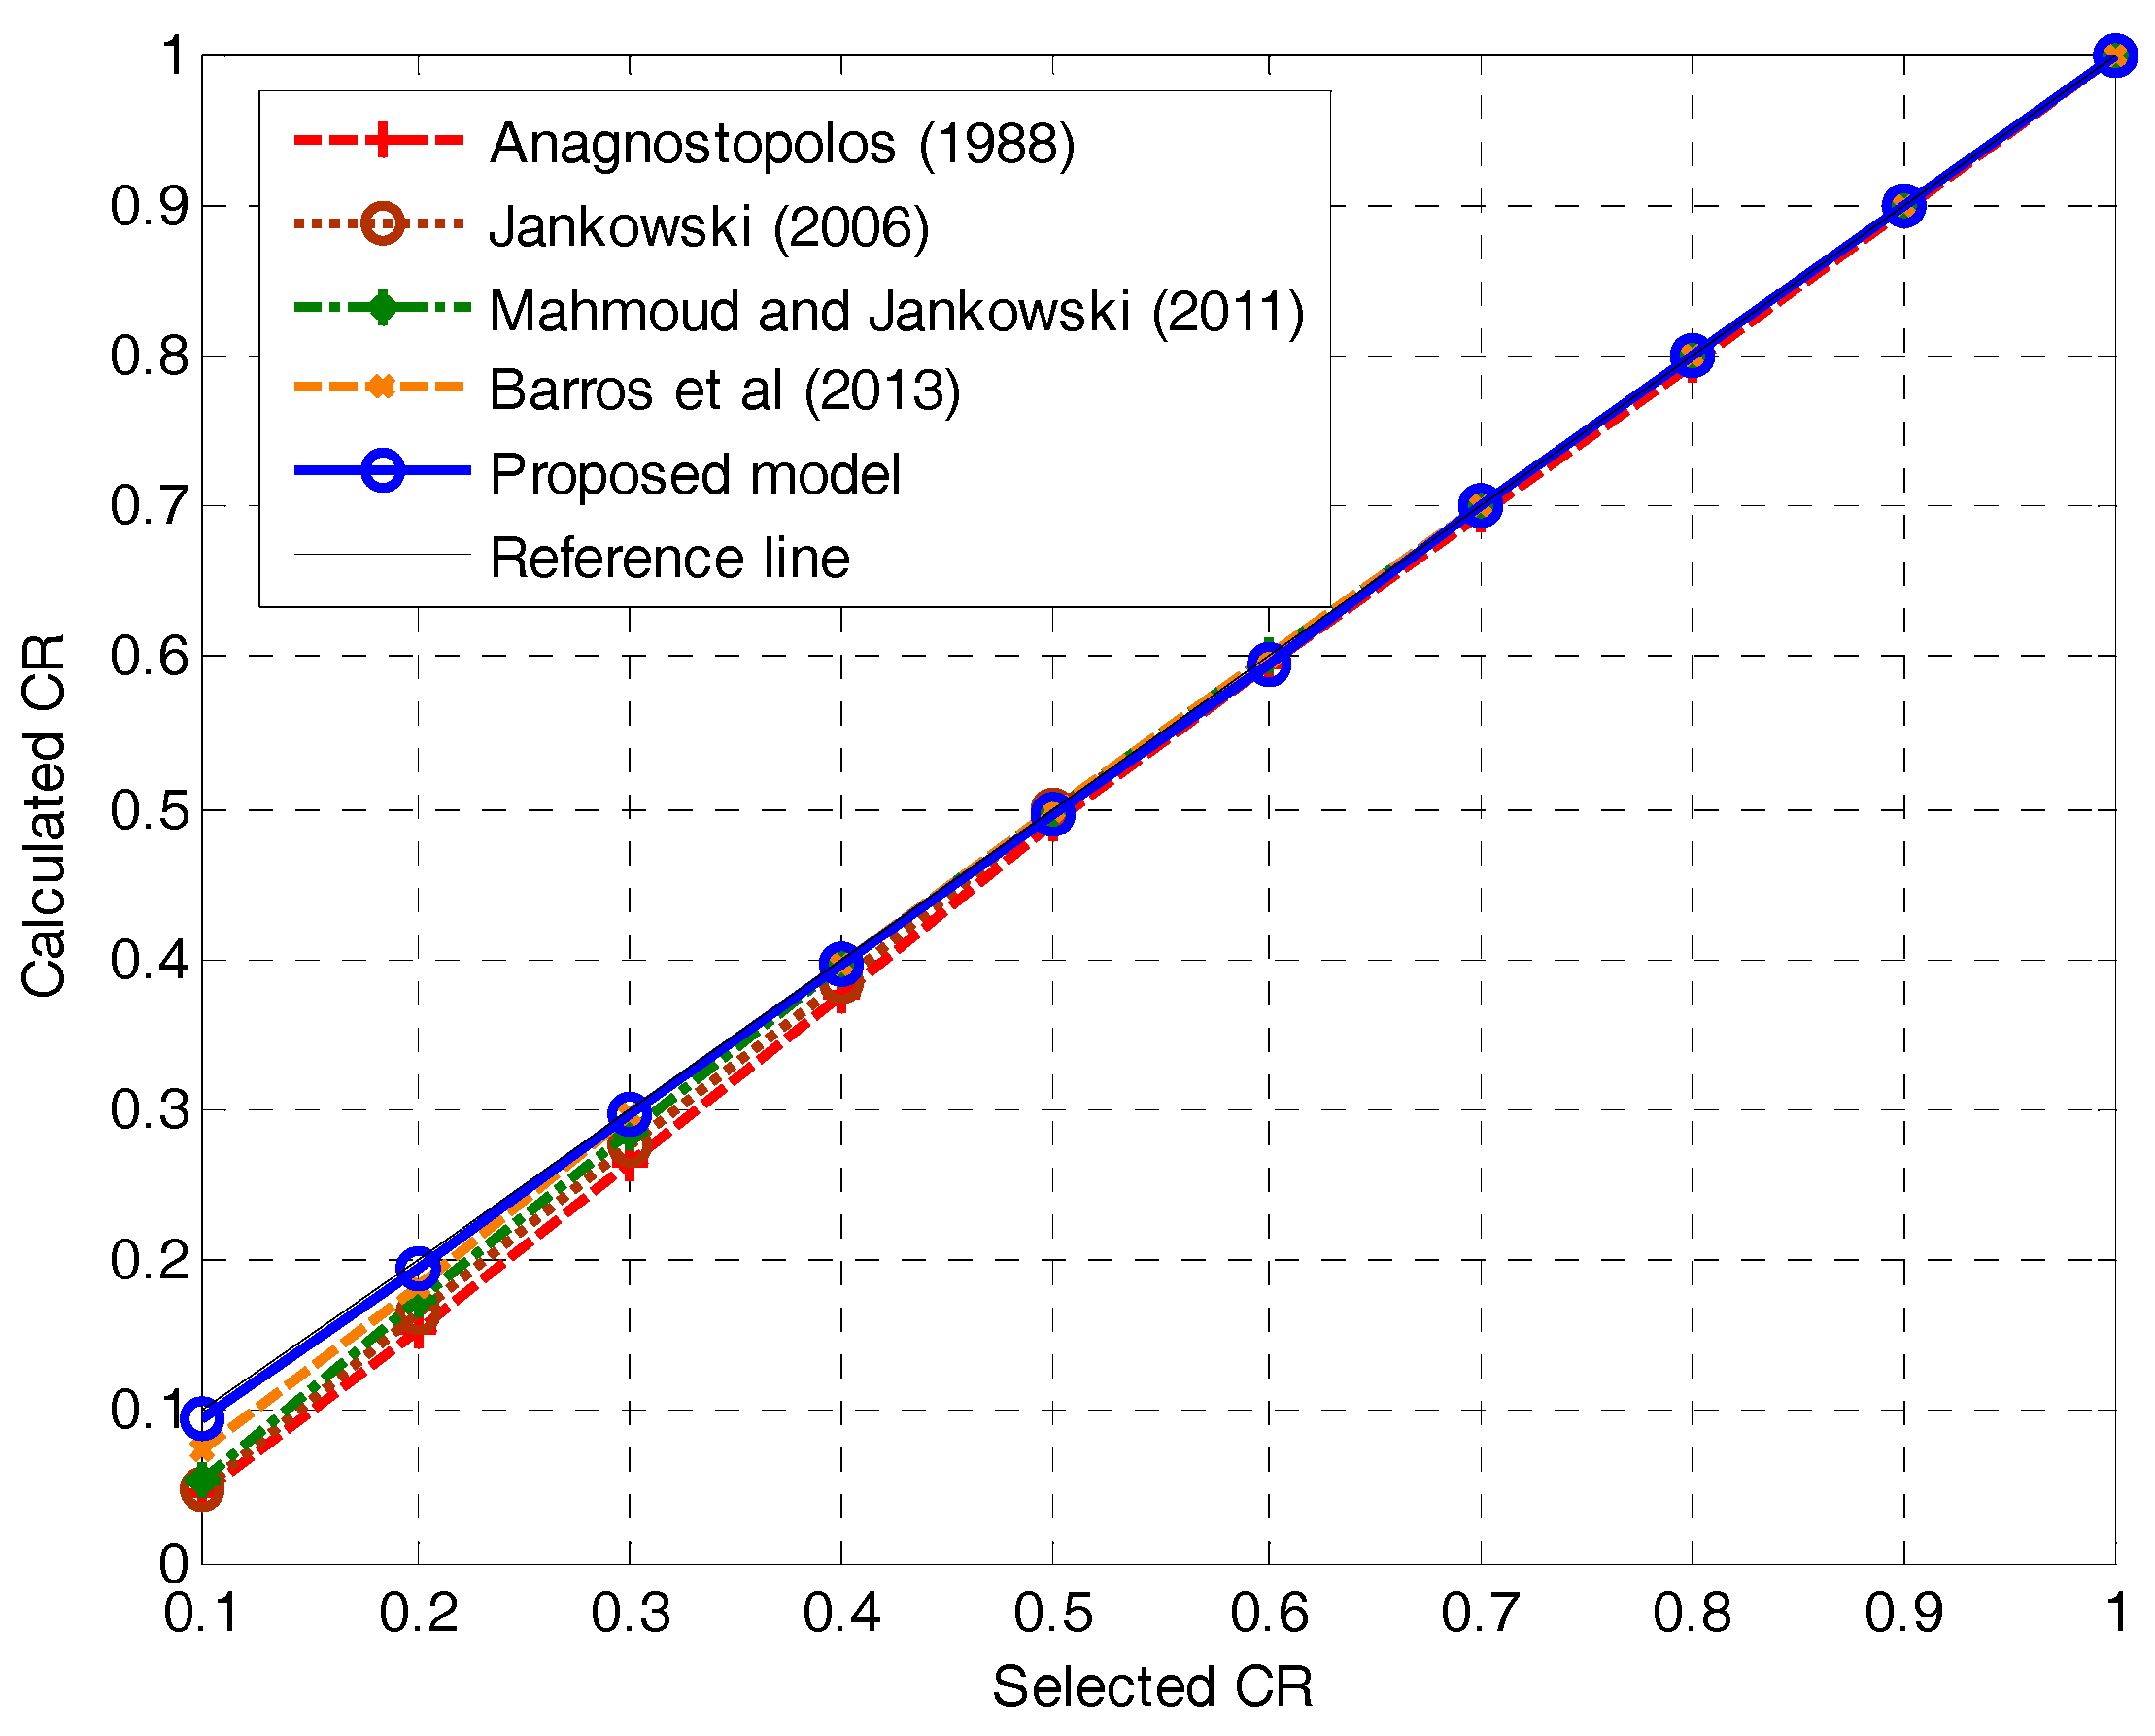
4. Verification of Effectiveness

In here, by focusing on Equation (13), in order to investigate the effectiveness of the model proposed, four different approaches have been used. In all the cases, the CRVK program has been applied and developed to perform dynamic analyses and solve impact problems (see [22] for details). Firstly, the dissipated energy and the absorbed energy during impact have been compared with each other for the case of collisions between two structural elements. In the second part of investigation, the experimentally obtained peak impact forces during single collision have been compared with the numerical results. Then, the accuracy of different equations has been verified by comparing the impact force time histories for the situation when a concrete ball is dropped on a rigid concrete surface. Finally, the results of the investigation focused on pounding between two structures during earthquake have been investigated.

4.1. Energy Dissipation during Impact

Firstly, in order to determine the impact force and energy dissipation, impact between two structural elements has been simulated and the hysteresis loop has been depicted. The dissipated energy during impact has been calculated as being equal to the area of hysteresis loop and its value has been compared to the loss of kinetic energy determined by Equation (9). As an example, the representative results for two structural elements with mass of 170 kg and 320 kg impacting with CR = 0.4 and δ ˙ i m p = 1 m/s are presented below. The impact damping ratio has been calculated using Equation (13). The relation between impact force and displacement during impact, for the example considered, is shown in Figure 4.
In this case, the enclosed area of the hysteresis loop has been determined as equal to 47.63 Nm, while the loss of the kinetic energy has been calculated as equal to 46.63 Nm. The calculated CR value has been found to be 0.3764. Therefore, the error of calculated CR with relation to the assumed CR value is as low as 5.9% confirming the accuracy of the approach.
The calculated values of CR, for different cases of assumed (selected) CRs, are also presented in Figure 5 for the formula proposed as well as for other impact force models. The errors between both CR values are additionally summarized in Table 1. Figure 5 and Table 1 show that the proposed method results in the lowest errors obtained for all values of CR, as compared to other impact force models considered in the analysis.

4.2. Peak Impact Force

In the second stage of verifications, the experimentally obtained and numerically determined peak impact forces during single collision have been compared. The results of the experimental test conducted by Kajita et al. [32] have been considered in the analysis. The experiment (see [32] for details) was focused on impact between two 300 kg steel frames with a 40 × 40 cm beam separated by a 10 cm gap (see Figure 6). The collision test was implemented using a horizontal hydraulic high-speed loading machine with a loading capacity of 1000 kN and a maximum loading speed of 3.0 m/s. The test was conducted in a line on a guide rail with the length of 3000 mm allowing to obtain the impact velocity of 0.68 m/s [32]. When the specimen was moving, the sliding friction force was slow, as compared to the movement of the steel bars. Therefore, the sliding friction force was reduced by using the compressed air and the energy loss caused by the sliding friction force was suppressed during collision.
It should be added that Kajita et al. [32] performed also the numerical analysis using the three-dimensional finite element method. They underlined that there are three characteristic measures (impact force, law of conservation of momentum and kinetic energy loss) to be evaluated in the case of collision problems involving two bodies. The authors estimated the maximum impact force using the results of the numerical analysis. Its value was found to be approximately the same as the value obtained from the experimental test. They concluded, therefore, that the maximum impact force can be roughly estimated from the simulation analyses using the approach applied.
The hysteresis loop obtained from the experiment by Kajita et al. [32] is shown in Figure 7. For the purposes of comparative analysis, the hysteresis loop has also been numerically determined by fitting the experimental results using the method of the least squares while applying Equation (13) to calculate the impact damping ratio (see the results in Figure 7). It can be seen from Figure 7 that the experimentally determined peak impact force is equal to 30.75 kN, while the value obtained from the numerical analysis is equal to 30.35 kN. The difference between both peak impact force values is as low as 1.3% confirming the accuracy of the approach proposed.

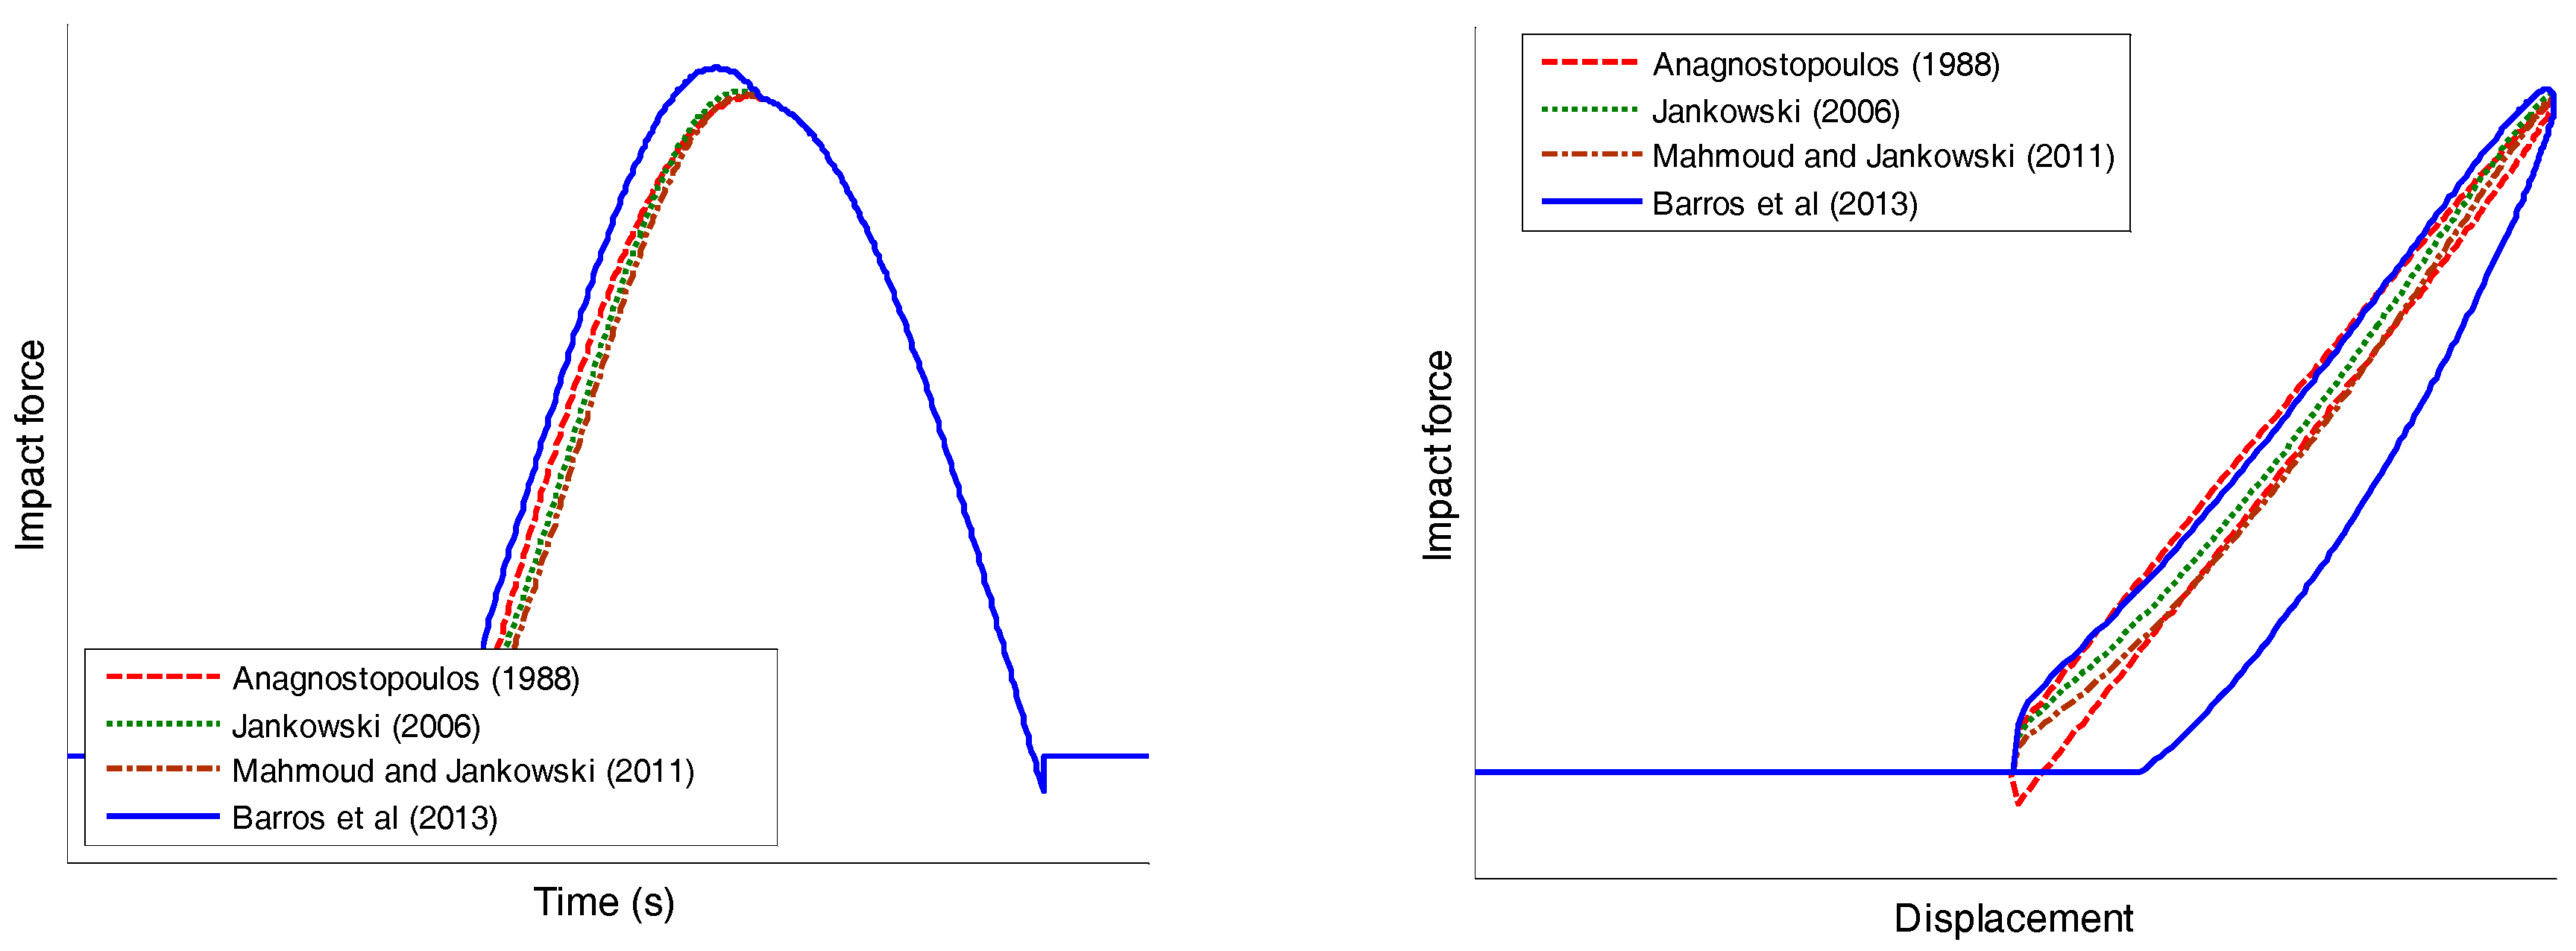
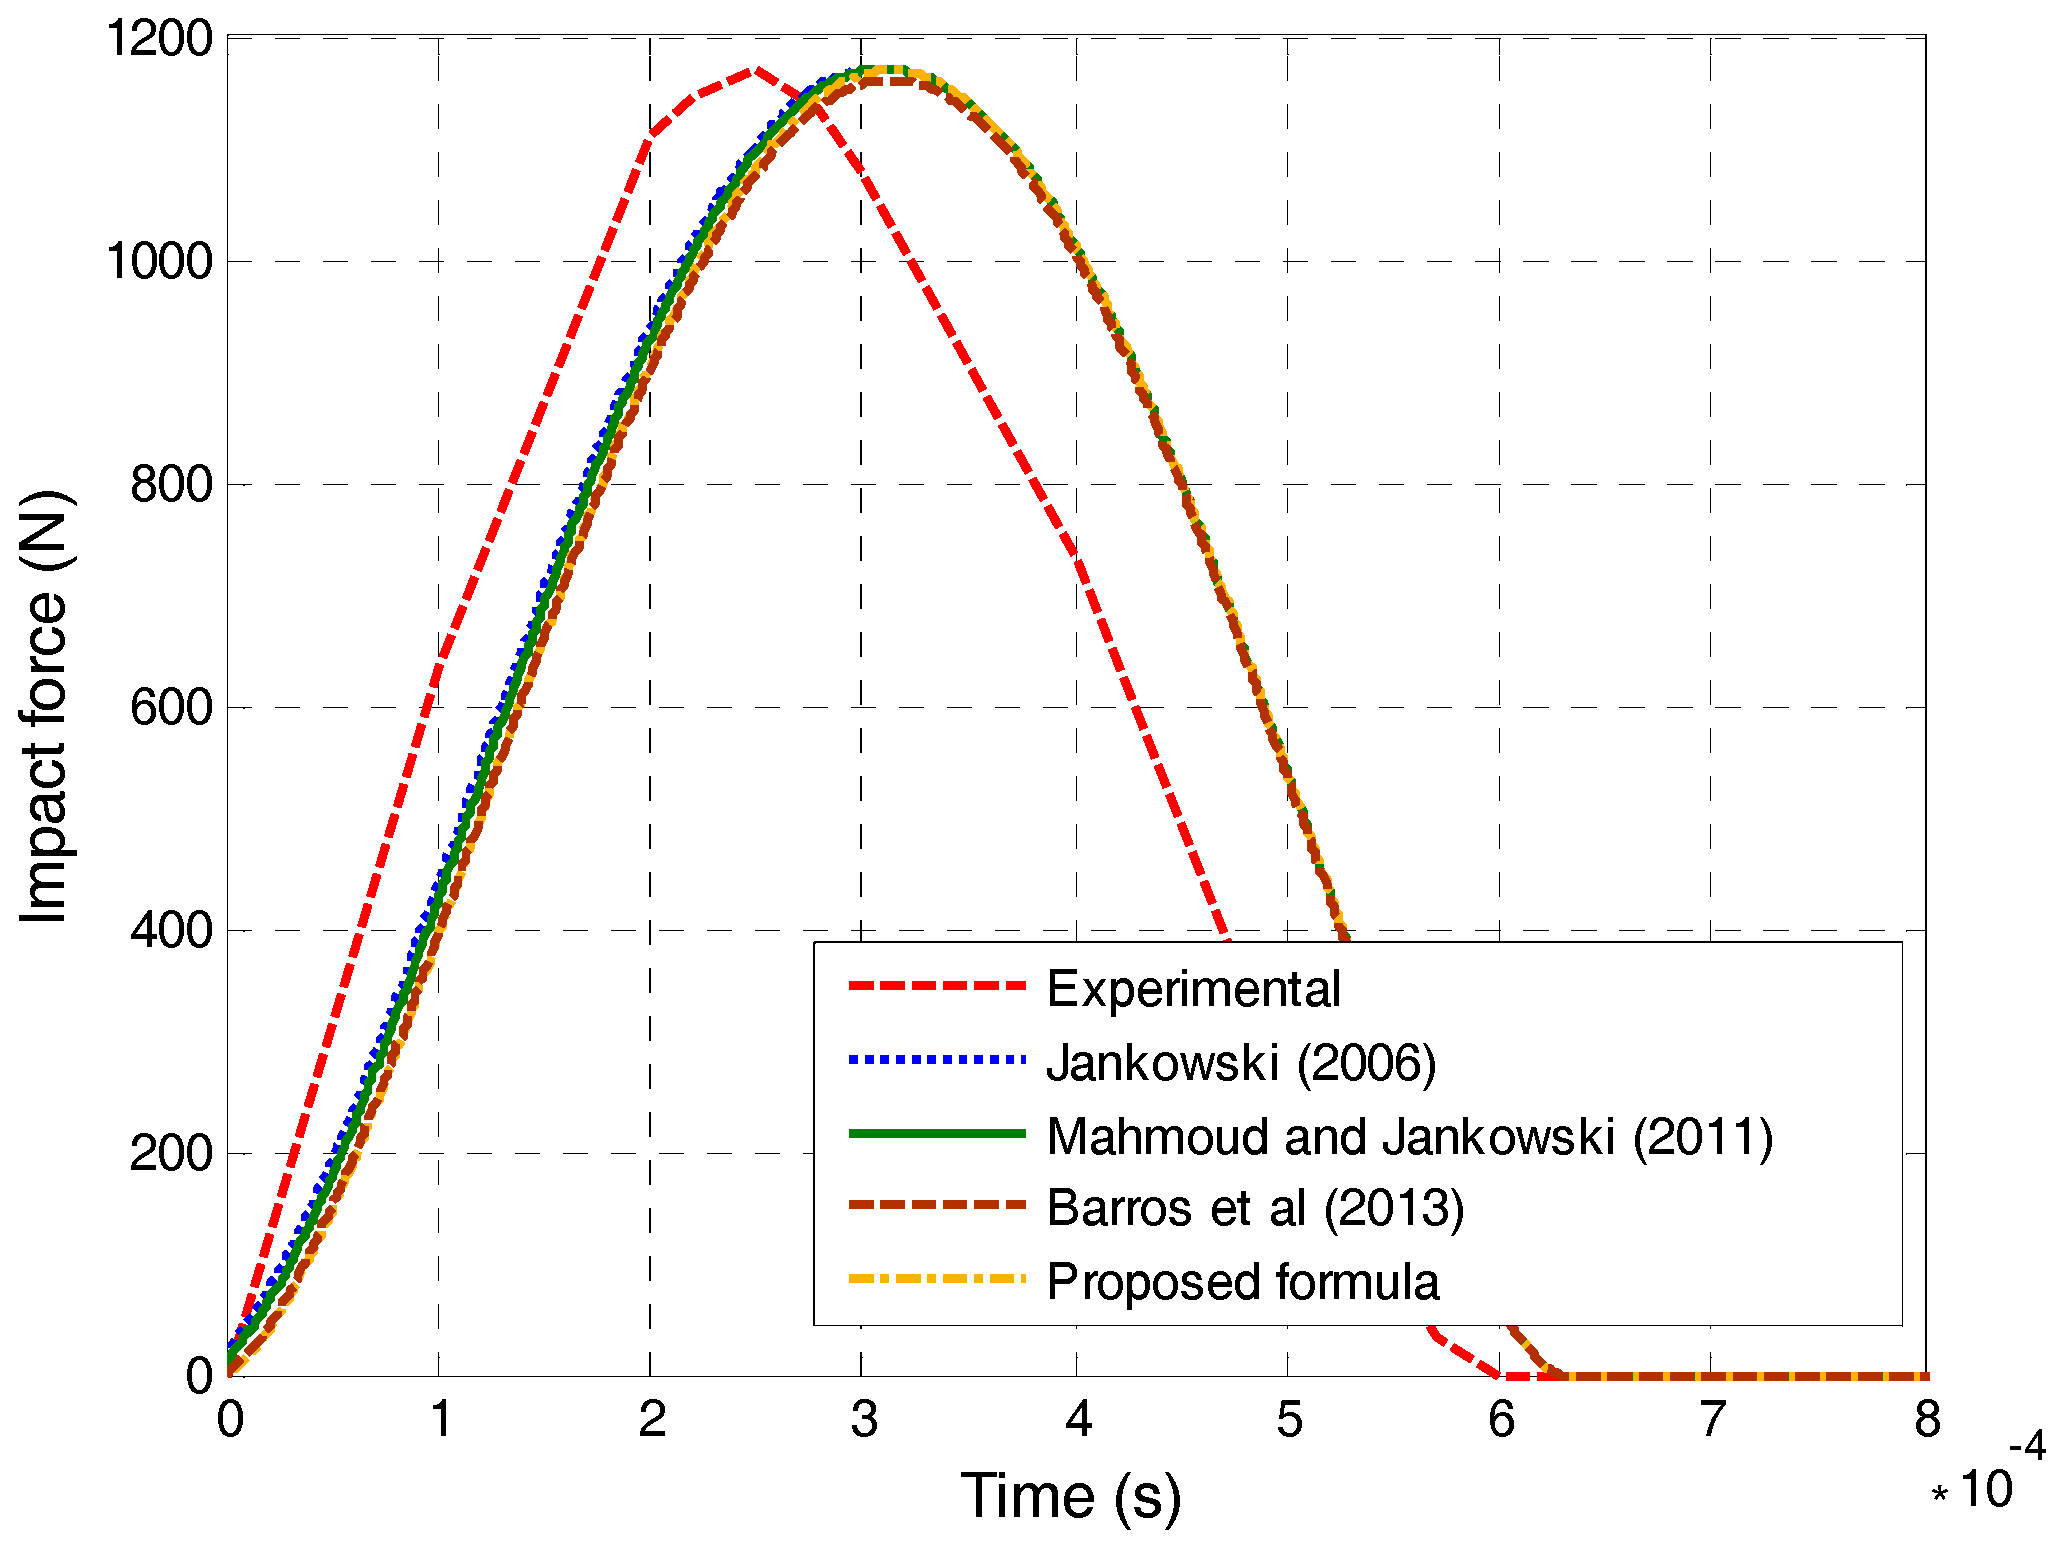
4.3. Impact Force Time History

In this part, the accuracy of different equations is verified by comparing the impact force time histories for the situation when a ball is dropped onto a rigid surface (see Figure 8). The results of the experiment conducted by Jankowski and Mahmoud [36] have been used in the analysis. A number of balls made of different materials and masses, m, were dropped from various height levels, h, onto a rigid surface of the same material and tested during the extensive experimental investigation (see [36] for details). The results obtained for the concrete ball with mass of 1.763 kg impacting the rigid concrete surface with the velocity of 0.13 m/s have been used for the purposes of the present analysis.
The numerical analysis has been conducted using Equations (5)–(7) and (13). Parameters of different models used in the numerical analysis have been determined through iterative procedure so as to equalize the peak impact force determined from the simulations with the peak impact force obtained from the experiment (see [36] for details). The results of the numerical simulations, together with the experimental results, are shown in Figure 9.
The difference between the experimental results and the results from the numerical analysis has been assessed by calculating the normalized root mean square error (see [38]):
E = i = 1 N V ( H i H ¯ i ) 2 i = 1 N V H i 2 100 %
where H i and H ¯ i denote the values from the impact time history records obtained from the experiment and from the numerical analysis, respectively and NV is the number of values in these history records. The errors calculated using Equation (14) for different impact force models based on Equations (5–7) and (13) are shown in Table 2. The results presented in the table confirm the simulation accuracy when the proposed formula is used.

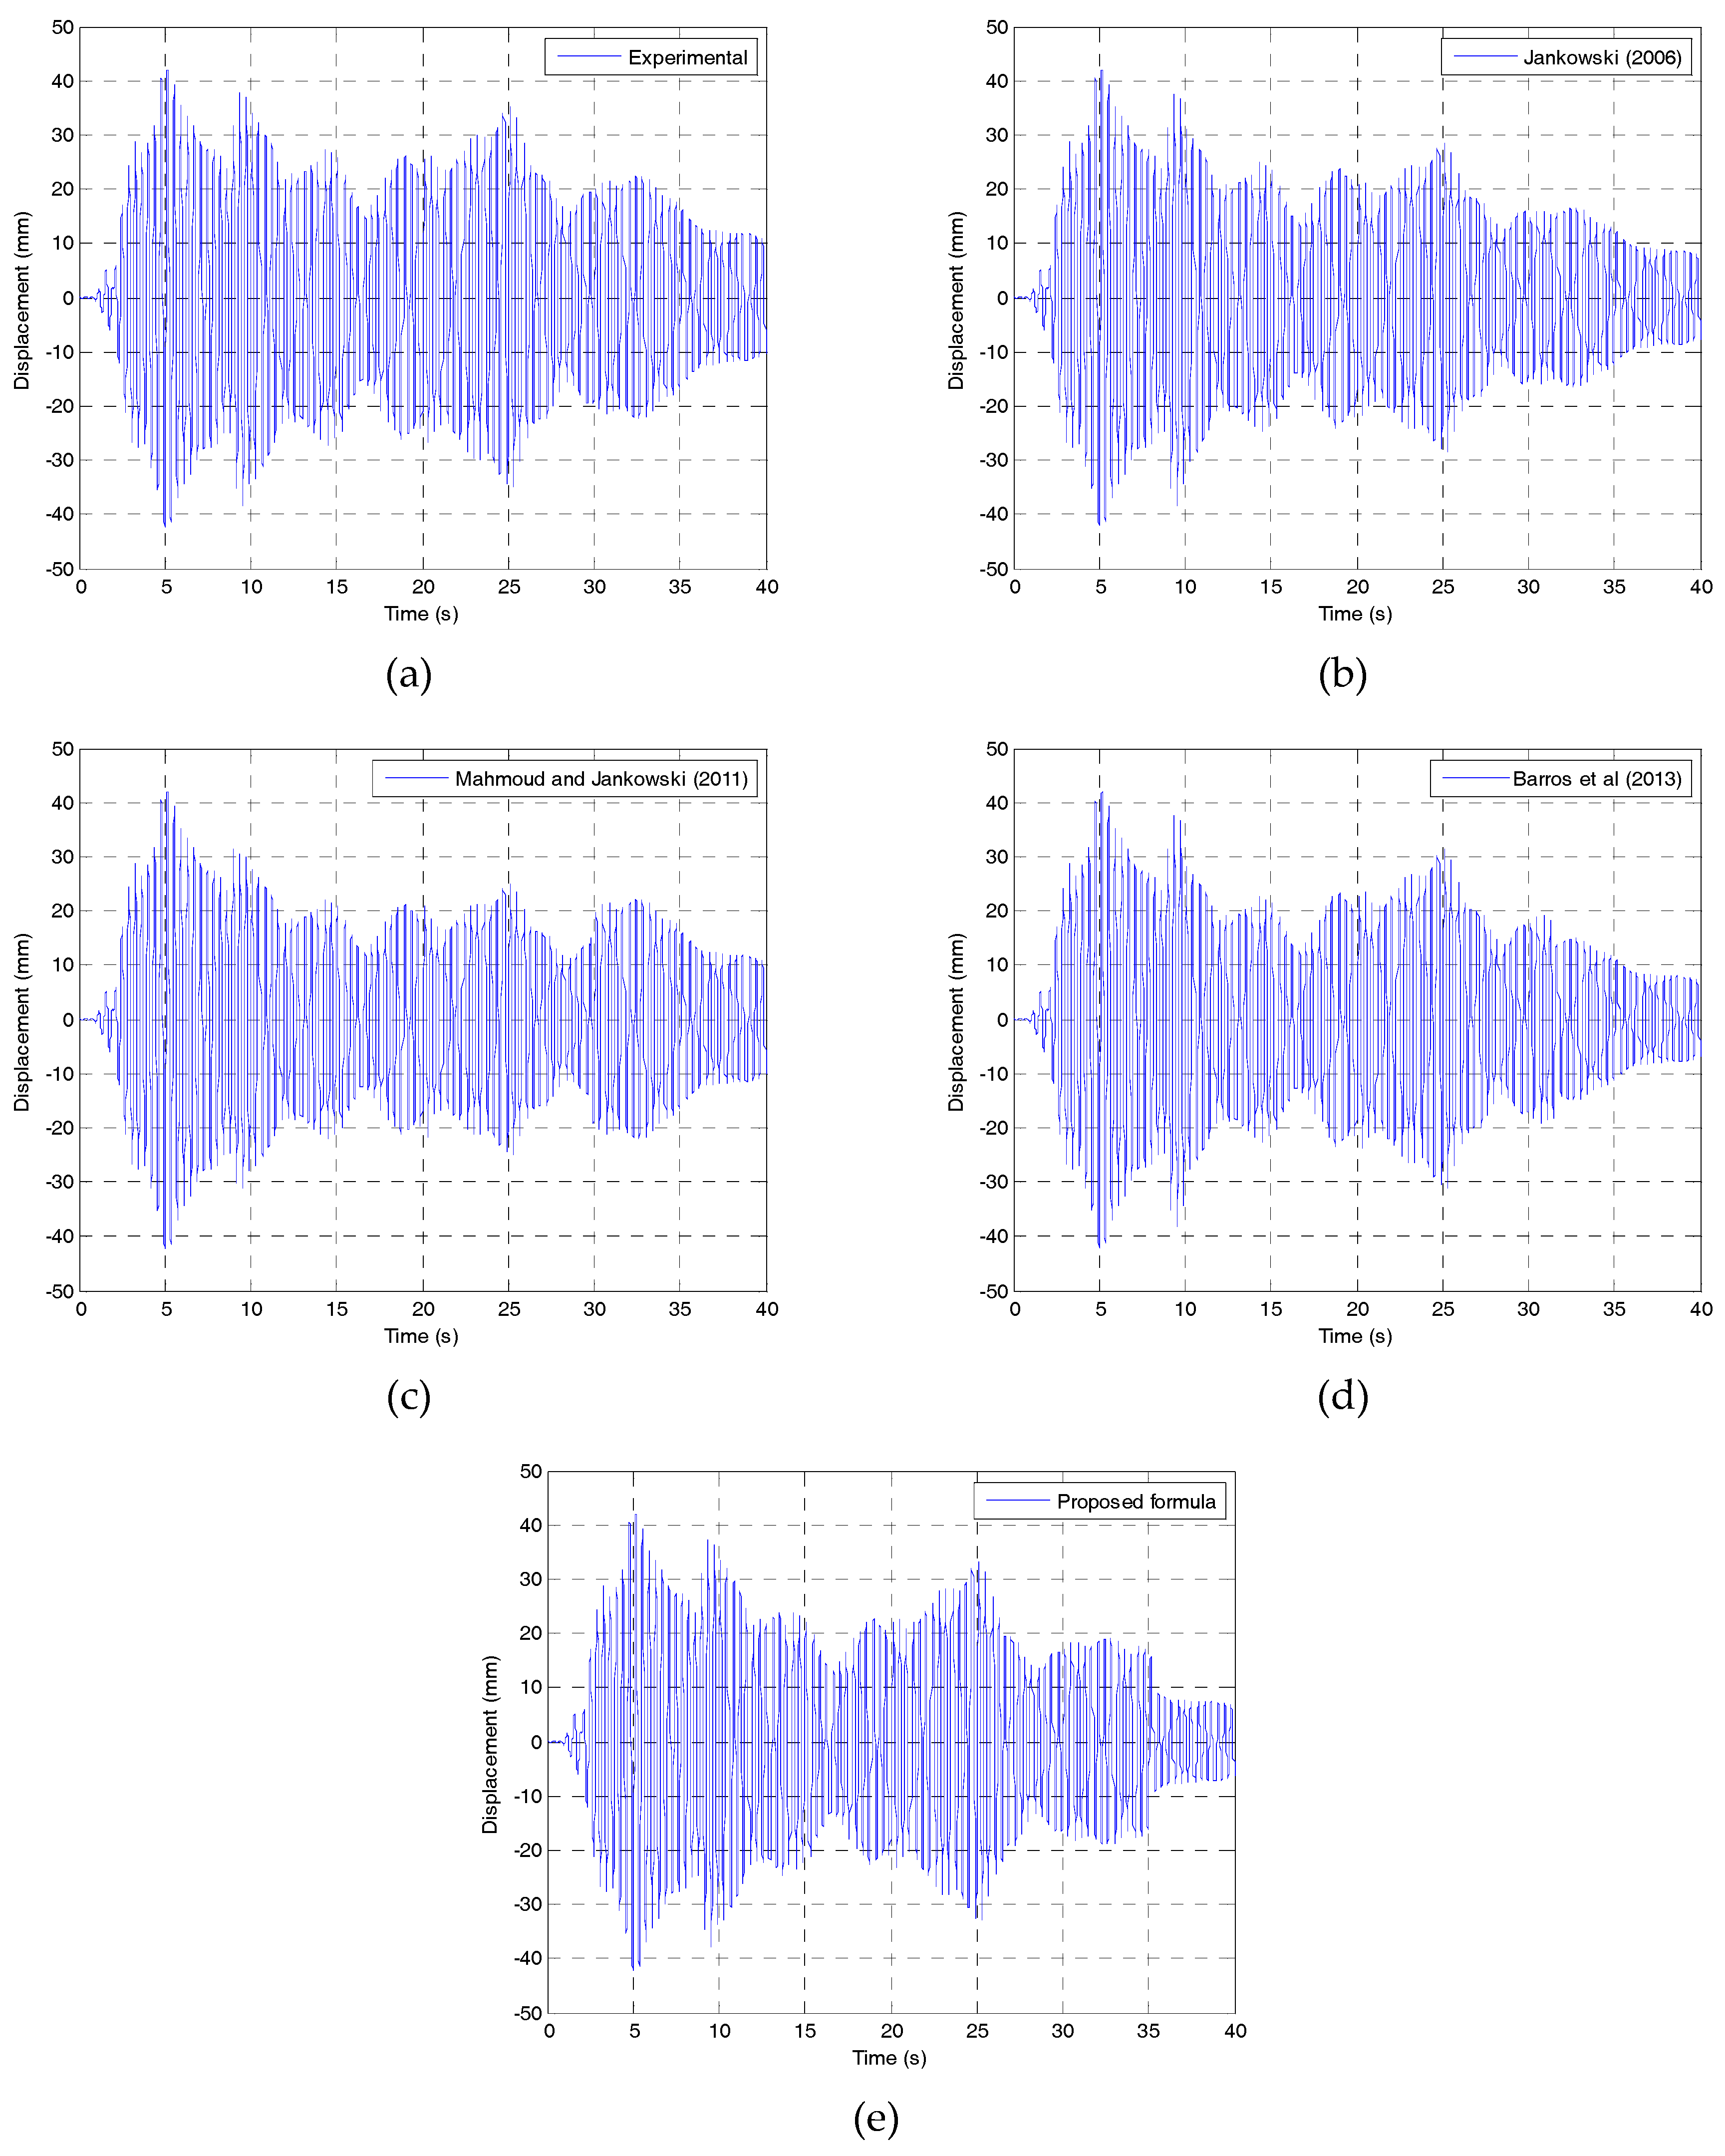
4.4. Pounding between Two Structures during Earthquake

In the last stage of verifications, the results of the numerical analysis have been compared with the results of the shaking table experiment focused on pounding between two steel structures (tower models—see Figure 10) with impacting concrete elements (see [36] for details). The columns of 1 m high tested structures were arranged in a rectangular pattern with a spacing of 0.22 m along the shaking direction (longitudinal one) and a spacing of 0.3 m along the orthogonal (transverse) direction (see Figure 10). All supporting elements used in the left tower model had a rectangular cross section with dimensions: 6 × 6 mm, whereas the model of the right tower was constructed of members with a section of 8 × 8 mm. Elements made of different materials were fixed at the top of both towers, and, with the help of additional masses in the form of plates and bolts (see [36]), the mass of each tower model was kept constant during all experimental tests, apart from the material used. The top mass of the left tower model, m 1 , was equal to 9.485 kg, while the top mass of the right tower, m 2 , was 18.337 kg. The structures were fixed to the shaking table platform with the in-between gap size of d = 40 mm and excited by the NS component of the El Centro earthquake (18.05.1940).
The result of the experiment in the form of the pounding-involved displacement time history of the left tower is shown in Figure 11 [36]. For the purposes of comparison, the numerical analysis has been conducted using Equations (5)–(7) and (13). Parameters of different models used in the analysis have been determined through iterative procedure so as to equalize the peak impact force determined from the simulations with the peak impact force obtained from the experiment (see [36] for details). The results of numerical analysis are also shown in Figure 11. The normalized root mean square errors have been calculated using Equation (14) for different impact force models based on Equations (5)–(7) and (13) and the results are presented in Table 3. It can be seen from the table that the best accuracy of simulations is obtained by using the proposed formula.

5. Concluding Remarks

An effective formula for impact damping ratio, as a parameter of impact force model for simulation of earthquake-induced structural pounding, has been proposed in this paper. It has been determined based on the iterative process using a numerical program. The effectiveness of the equation has been verified by four different approaches, i.e., by checking the energy dissipation during impact, by analyzing the peak impact forces during single collision, by comparing the impact force time histories for the case of collision between a ball and a rigid surface and by studying pounding between two structures during earthquake.
The results of the comparative analysis clearly indicate that using different, previously proposed, impact force models leads to considerably different results for the same CR value. Therefore, the need for an effective formula for the impact damping ratio in order to cover all the responses accurately has been justified in the paper. The results of the analysis focused on the comparison between dissipated and kinetic energy during impact show relatively low errors between calculated and assumed CR values while using the proposed equation. In addition, the results of the comparison between experimentally and numerically determined peak impact forces during single collision confirm the effectiveness of the approach. The same conclusion has been obtained for the whole impact time history for collision between a ball and a rigid surface. Finally, the results of the comparative analysis, conducted for pounding between two structures during an earthquake, confirm the simulation accuracy when the proposed approach is used.
The above conclusions indicate that the proposed formula for impact damping ratio, as one of the most important parameters of impact force model, is accurate in numerical simulations in the case of different scenarios. Therefore, it can be effectively used to study various problems of earthquake-induced structural pounding.

Author Contributions

Methodology, S.M.K., H.N., R.C.B. and R.J.; software, S.M.K.; validation, S.M.K., H.N., R.C.B., A.J.-G. and R.J.; formal analysis S.M.K.; investigation, S.M.K., H.N., R.C.B. and R.J.; writing—original draft, S.M.K.; writing—review and editing, A.J.-G. and R.J.

Funding

This research received no external funding.

Acknowledgments

The authors would like to thank Seyed Mohammad Nazem Razavi for his help in conducting some numerical simulations.

Conflicts of Interest

The authors declare no conflict of interest.

References

  1. Kasai, K.; Maison, B.F. Building pounding damage during the 1989 Loma Prieta earthquake. Eng. Struct. 1997, 19, 195–207. [Google Scholar] [CrossRef]
  2. Hall, J.F.; Holmes, W.T.; Somers, P. Northridge Earthquake of Reconnaissance 17 January 1994—Report. In EERI Report 95–03; Earthquake Engineering Research Institute: Oakland, CA, USA, 1995; Volume 1. [Google Scholar]
  3. Jankowski, R.; Mahmoud, S. Linking of adjacent three-storey buildings for mitigation of structural pounding during earthquakes. Bull. Earthq. Eng. 2016, 14, 3075–3097. [Google Scholar] [CrossRef] [Green Version]
  4. Elwardany, H.; Seleemah, A.; Jankowski, R. Seismic pounding behavior of multi-story buildings in series considering the effect of infill panels. Eng. Struct. 2017, 144, 139–150. [Google Scholar] [CrossRef]
  5. Kun, C.; Yang, Z.; Chouw, N. Seismic response of skewed bridges including pounding effects. Earthq. Struct. 2018, 14, 467–476. [Google Scholar]
  6. Li, C.; Bi, K.; Hao, H. Seismic performances of precast segmental column under bidirectional earthquake motions: Shake table test and numerical evaluation. Eng. Struct. 2019, 187, 314–328. [Google Scholar] [CrossRef]
  7. Raheem, S.E.A.; Fooly, M.Y.; Shafy, A.G.A.; Taha, A.M.; Abbas, Y.A.; Latif, M.M.A. Numerical simulation of potential seismic pounding among adjacent buildings in series. Bull. Earthq. Eng. 2019, 17, 439–471. [Google Scholar] [CrossRef]
  8. Sasaki, T.; Sato, E.; Fukuyama, K.; Kajiwara, K. Enhancement of Base-Isolation Based on e-Defense Full-Scale Shake Table Experiments: Dynamic Response of Base-Isolated Building under Impact due to Pounding. In Proceedings of the 16th World Conference on Earthquake Engineering, Santiago, Chile, 9–13 January 2017; p. 4082. [Google Scholar]
  9. Anagnostopoulos, S.A. Pounding of buildings in series during earthquakes. Earthq. Eng. Struct. Dyn. 1988, 16, 443–456. [Google Scholar] [CrossRef]
  10. Anagnostopoulos, S.A. Equivalent viscous damping for modeling inelastic impacts in earthquake pounding problems. Earthq. Eng. Struct. Dyn. 2004, 33, 897–902. [Google Scholar] [CrossRef]
  11. Maison, B.F.; Kasai, K. Dynamics of pounding when two buildings collide. Earthq. Eng. Struct. Dyn. 1992, 21, 771–786. [Google Scholar] [CrossRef]
  12. Jankowski, R. Non-linear viscoelastic modelling of earthquake-induced structural pounding. Earthq. Eng. Struct. Dyn. 2005, 34, 595–611. [Google Scholar] [CrossRef]
  13. Jankowski, R. Analytical expression between the impact damping ratio and the coefficient of restitution in the non-linear viscoelastic model of structural pounding. Earthq. Eng. Struct. Dyn. 2006, 35, 517–524. [Google Scholar] [CrossRef]
  14. Mahmoud, S.; Chen, X.; Jankowski, R. Structural pounding models with Hertz spring and nonlinear damper. J. Appl. Sci. 2008, 8, 1850–1858. [Google Scholar]
  15. Mahmoud, S.; Jankowski, R. Modified linear viscoelastic model of earthquake-induced structural pounding. Iranian J. Sci. Technol. 2011, 35, 51–62. [Google Scholar]
  16. Komodromos, P.; Polycarpou, P.C.; Papaloizou, L.; Phocas, M.C. Response of seismically isolated buildings considering poundings. Earthq. Eng. Struct. Dyn. 2007, 36, 1605–1622. [Google Scholar] [CrossRef]
  17. Polycarpou, P.; Komodromos, P. On the Numerical Simulation of Impacts for the Investigation of Earthquake-Induced Pounding of Buildings. In Proceedings of the Tenth International Conference on Computational Structures Technology, Valenthia, Spain, 14–17 September 2010. [Google Scholar]
  18. Ye, K.; Li, L.; Zhu, H. A note on the Hertz contact model with nonlinear damping for pounding simulation. Earthq. Eng. Struct. Dyn. 2008, 38, 1135–1142. [Google Scholar] [CrossRef]
  19. Barros, R.C.; Naderpour, H.; Khatami, S.M.; Mortezaei, A. Influence of seismic pounding on RC buildings with and without base isolation system subject to near-fault ground motions. J. Rehabil. Civ. Eng. 2013, 1, 39–52. [Google Scholar]
  20. Naderpour, H.; Khatami, S.M.; Barros, R.C.; Papadrakakis, M. Creation of A New Equation of Motion to Calculate Dissipated Energy between Two Adjacent Buildings. In Proceedings of the 5th International Conference on Computational Methods in Structural Dynamics and Earthquake Engineering Methods in Structural Dynamics and Earthquake Engineering, Crete Island, Greece, 25–27 May 2015; pp. 2865–2875. [Google Scholar]
  21. Naderpour, H.; Barros, R.C.; Khatami, S.M. A new model for calculating the impact force and the energy dissipation based on CR-factor and impact velocity. Sci. Iran. 2015, 22, 59–68. [Google Scholar]
  22. Naderpour, H.; Barros, R.C.; Khatami, S.M.; Jankowski, R. Numerical Study on Pounding between Two Adjacent Buildings under Earthquake Excitation. Shock. Vib. 2016, 2016, 1–9. [Google Scholar] [CrossRef]
  23. Naderpour, H.; Barros, R.C.; Khatami, S.M. Suggestion of an equation of motion to calculate damping ratio during earthquake based on cyclic procedure. J. Theor. Appl. Mech. 2016, 54, 963–973. [Google Scholar] [CrossRef]
  24. Naderpour, H.; Khatami, S.M.; Barros, R.C. Prediction of Critical Distance Between Two MDOF Systems Subjected to Seismic Excitation in Terms of Artificial Neural Networks. Period. Polytech. Civ. Eng. 2017, 61, 516–529. [Google Scholar] [CrossRef]
  25. Bamer, F.; Markert, B. A nonlinear visco-elastoplastic model for structural pounding. Earthq. Eng. Struct. Dyn. 2018, 47, 2490–2495. [Google Scholar]
  26. Filiatrault, A.; Wagner, P.; Cherry, S. Analytical prediction of experimental building pounding. Earthq. Eng. Struct. Dyn. 1995, 24, 1131–1154. [Google Scholar] [CrossRef]
  27. Masroor, A.; Mosqueda, G. Experimental simulation of base-isolated buildings pounding against moat wall and effects on superstructure response. Earthq. Eng. Struct. Dyn. 2012, 41, 2093–2109. [Google Scholar] [CrossRef]
  28. Jankowski, R. Pounding Between Superstructure Segments in Multi-Supported Elevated Bridge with Three-Span Continuous Deck Under 3D Non-Uniform Earthquake Excitation. J. Earthq. Tsunami 2015, 9, 1550012. [Google Scholar] [CrossRef]
  29. Papadrakakis, M.; Mouzakis, H.P. Earthquake simulator testing of pounding between adjacent buildings. Earthq. Eng. Struct. Dyn. 1995, 24, 811–834. [Google Scholar] [CrossRef]
  30. Papadrakakis, M.; Mouzakis, H.; Plevris, N.; Bitzarakis, S. A lagrange multiplier solution method for pounding of buildings during earthquakes. Earthq. Eng. Struct. Dyn. 1991, 20, 981–998. [Google Scholar] [CrossRef]
  31. Shakya, K.; Wijeyewickrema, A.C. Mid-column pounding of multi-story reinforced concrete buildings considering soil effects. Adv. Struct. Eng. 2019, 12, 71–85. [Google Scholar] [CrossRef]
  32. Kajita, Y.; Kitahara, T.; Nishimoto, Y.; Otsuka, H. Estimation of Maximum Impact Force on Natural Rubber during Collision of Two Steel Bars. In Proceedings of the First European Conference on Earthquake Engineering and Seismology (1st ECEES), Geneva, Switzerland, 3–8 September 2006; p. 488. [Google Scholar]
  33. Miari, M.; Choong, K.K.; Jankowski, R. Seismic pounding between adjacent buildings: Identification of parameters, soil interaction issues and mitigation measures. Soil Dyn. Earthq. Eng. 2019, 121, 135–150. [Google Scholar] [CrossRef]
  34. Cole, G.L.; Dhakal, R.P.; Turner, F.M. Building pounding damage observed in the 2011 Christchurch earthquake. Earthq. Eng. Struct. Dyn. 2012, 41, 893–913. [Google Scholar] [CrossRef]
  35. Crozet, V.; Politopoulos, I.; Chaudat, T. Shake table tests of structures subject to pounding. Earthq. Eng. Struct. Dyn. 2019, 48, 1156–1173. [Google Scholar] [CrossRef]
  36. Jankowski, R.; Mahmoud, S. Earthquake-Induced Structural Pounding; Springer: Cham, Switzerland, 2015. [Google Scholar]
  37. Goldsmith, W. Impact: The Theory and Physical Behavior of Colliding Solids; Edward Arnold: London, UK, 1960. [Google Scholar]
  38. Bendat, J.S.; Piersol, A.G. Random Data: Analysis and Measurement Procedures; Wiley-Interscience: New York, NY, USA, 1971. [Google Scholar]
Figure 1. Comparison between different impact force models using Equations (4)–(7).
Geosciences 09 00347 g001
Figure 2. Relation between impact damping ratio and coefficient of restitution (CR) according to Equation (13).
Geosciences 09 00347 g002
Figure 3. The detailed scheme of iterative procedure to determine the impact damping ratio.
Geosciences 09 00347 g003
Figure 4. Relation between impact force and displacement during impact between two structural elements.
Geosciences 09 00347 g004
Figure 5. Relation between selected and calculated CR values for different impact force models.
Geosciences 09 00347 g005
Figure 6. Experimental setup for impact between two steel frames [32].
Geosciences 09 00347 g006
Figure 7. Experimentally and numerically determined relation between impact force and displacement during impact between two steel frames.
Geosciences 09 00347 g007
Figure 8. Sketch of a ball falling onto a rigid surface.
Geosciences 09 00347 g008
Figure 9. Impact force time histories for different equations.
Geosciences 09 00347 g009
Figure 10. Sketch of two steel structures (tower models) with impacting concrete elements during the shaking table experiment.
Geosciences 09 00347 g010
Figure 11. Displacement time histories of the left tower for pounding between two towers under the El Centro earthquake using different approaches: (a) experimental; (b) Jankowski [13]; (c) Mahmoud and Jankowski [15]; (d) Barros et al. [19] and (e) proposed formula.
Geosciences 09 00347 g011
Table 1. Errors between selected and calculated CR values for different impact force models.
ModelError (%)
CR = 0.1CR = 0.2CR = 0.3CR = 0.4CR = 0.5CR = 0.6CR = 0.7CR = 0.8CR = 0.9CR = 1
Anagnostopoulos [9]53.444.532.523.414.57.24.52.11.30.77
Jankowski [13]14.211.38.46.34.73.11.91.10.750.51
Mahmoud and Jankowski [15]40.433.324.516.89.54.12.71.80.940.63
Barros et al. [19]19.815.510.78.56.43.82.31.50.820.54
Proposed model7.46.96.45.94.22.91.81.10.720.42
Table 2. Errors between experimental and numerical results for the impact force time history.
ModelError (%)
Jankowski [13]13.9
Mahmoud and Jankowski [15]13.8
Barros et al. [19]14.9
Proposed formula13.7
Table 3. Errors between experimental and numerical results for pounding between two structures during earthquake.
ModelError (%)
Jankowski [13]11.5
Mahmoud and Jankowski [15]13.9
Barros et al. [19]17.6
Proposed formula9.4

