

The Effect of the Ala16Val Mutation on the Secondary Structure of the Manganese Superoxide Dismutase Mitochondrial Targeting Sequence

Abstract
:
1. Introduction
2. Materials and Methods
2.1. Force Field Comparison
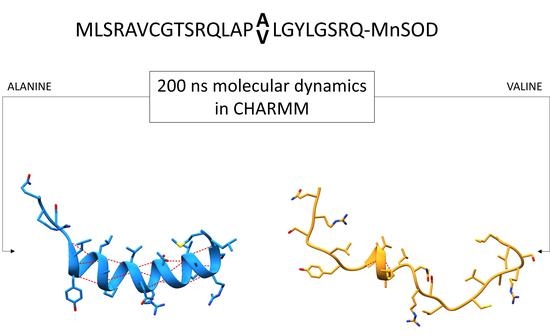
2.2. MTS Construction
2.3. Docking of the MTS to the MnSOD
2.4. Molecular Dynamics Simulations
3. Results and Discussion
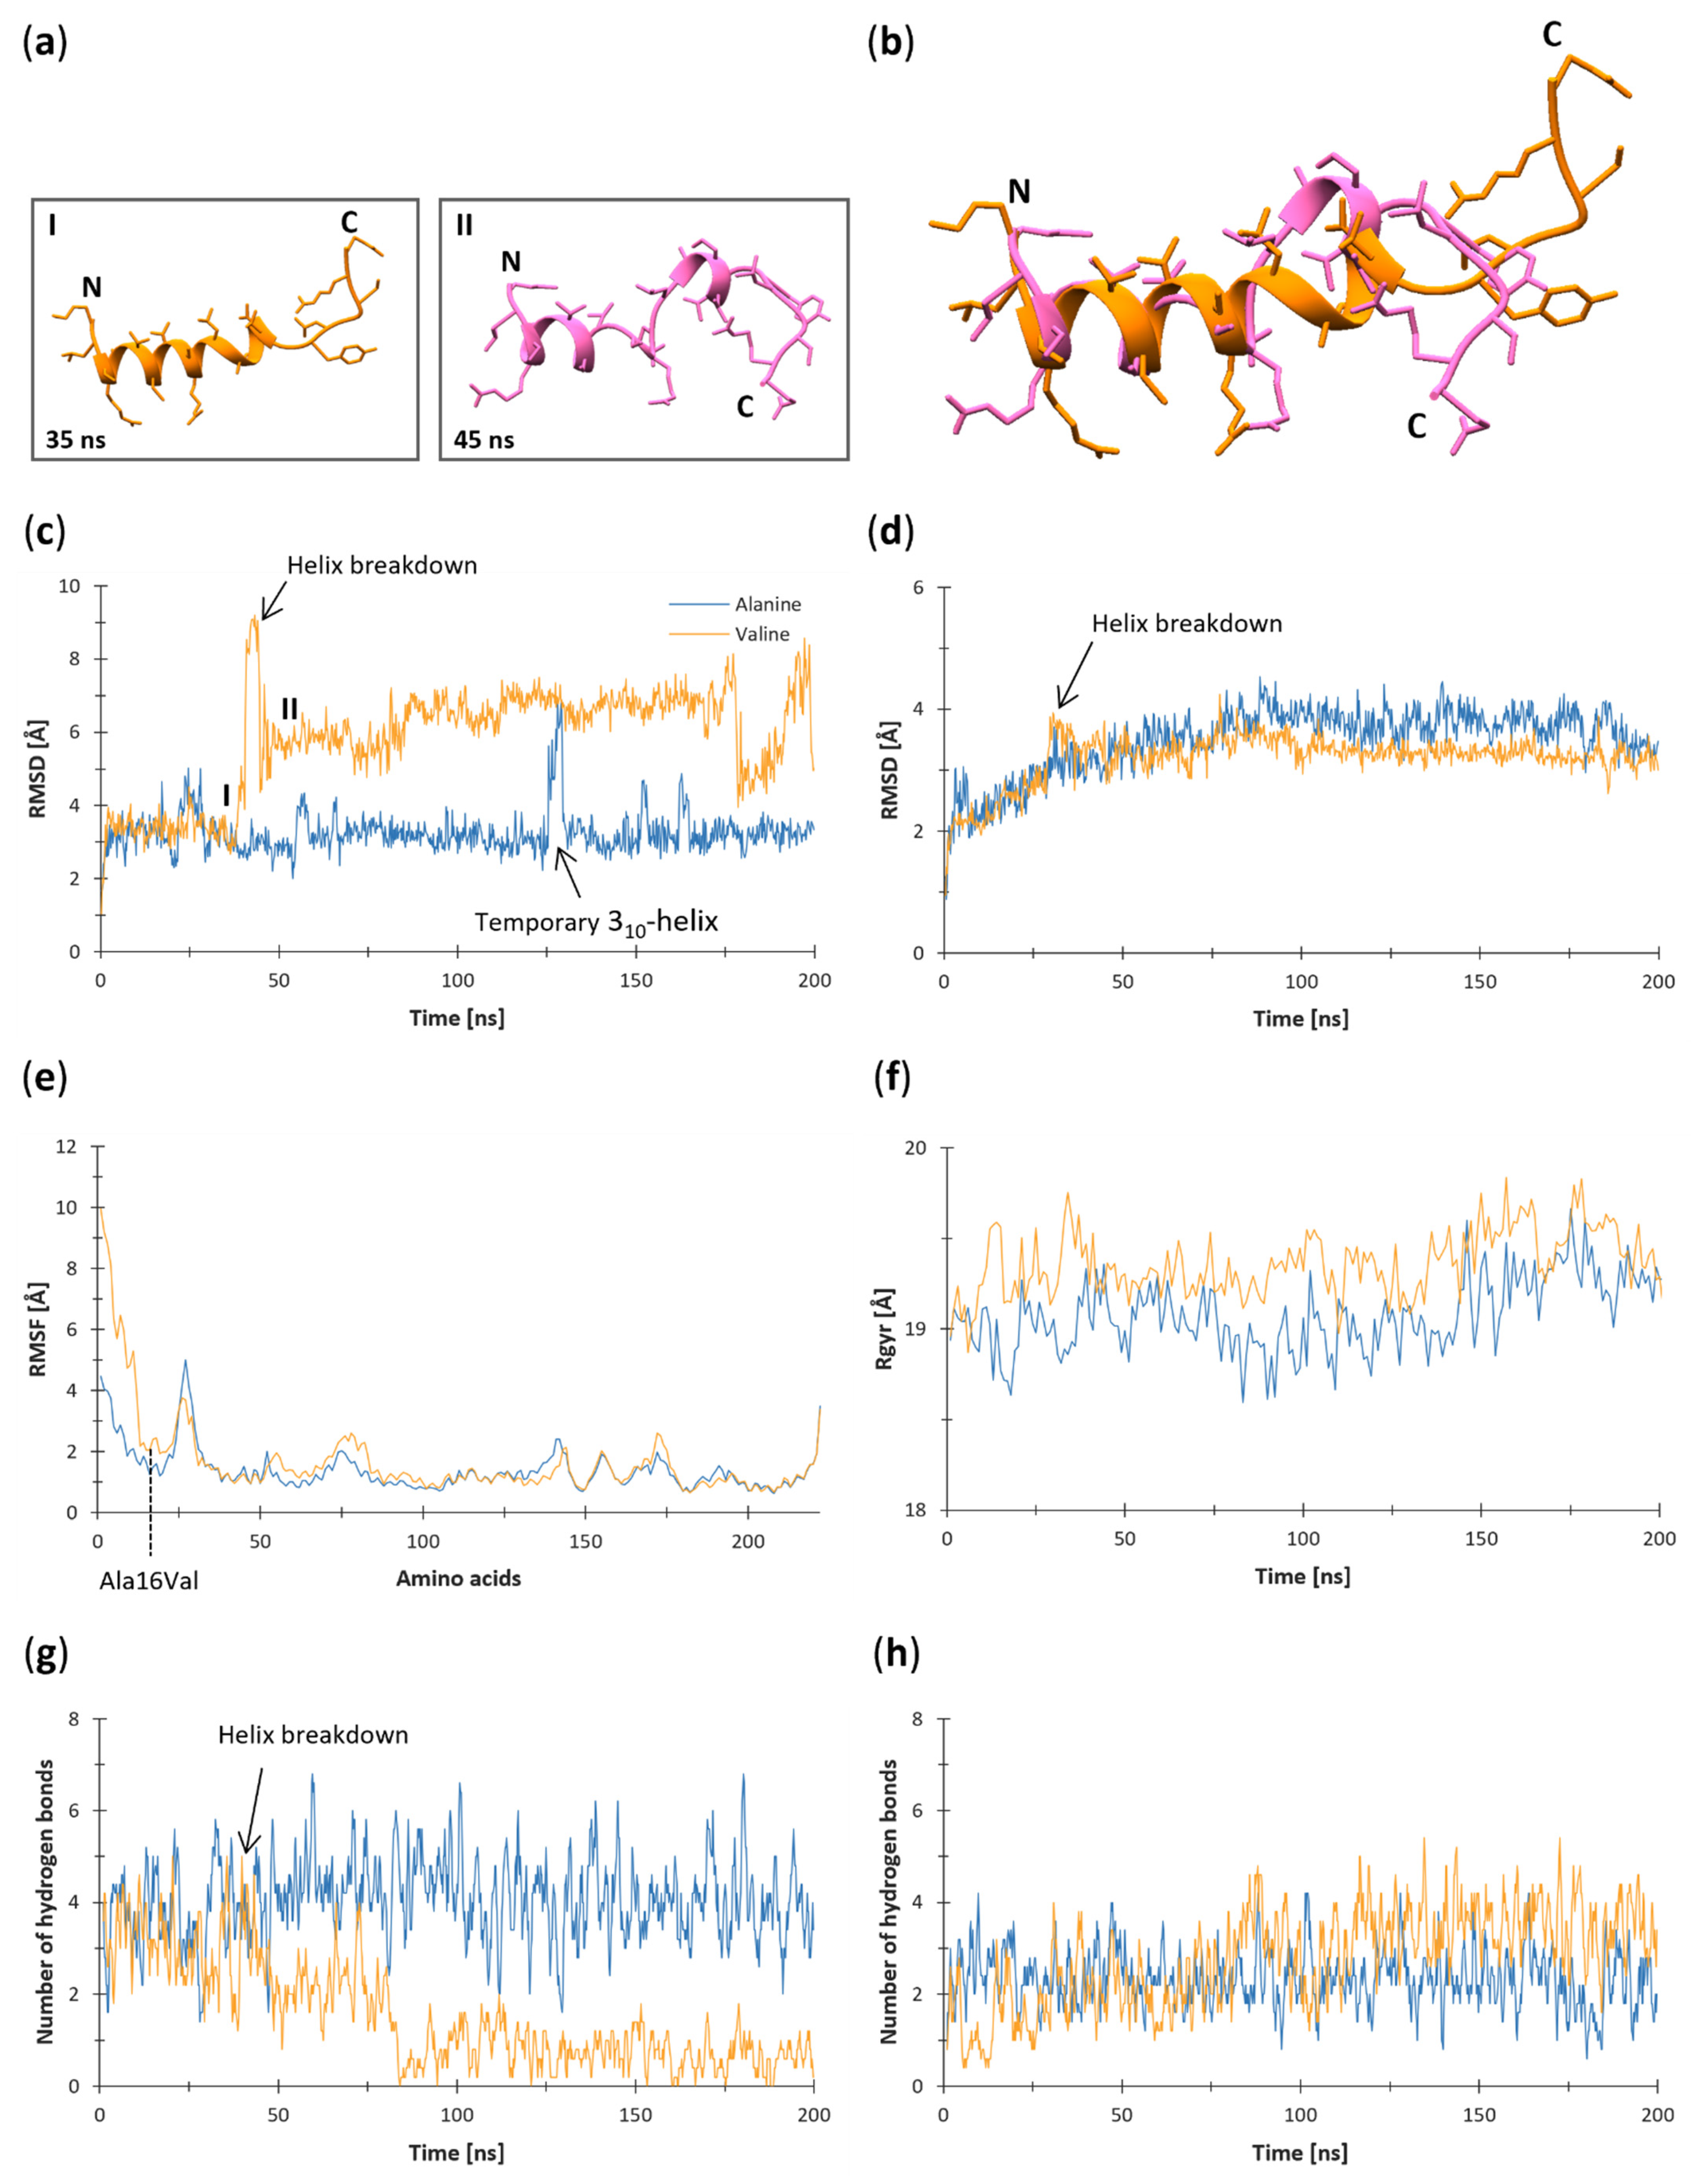
3.1. Root-Mean-Square Deviation (RMSD)
3.2. Root-Mean-Square Fluctuation (RMSF)
3.3. Radius of Gyration (Rgyr)
3.4. Hydrogen Bonds
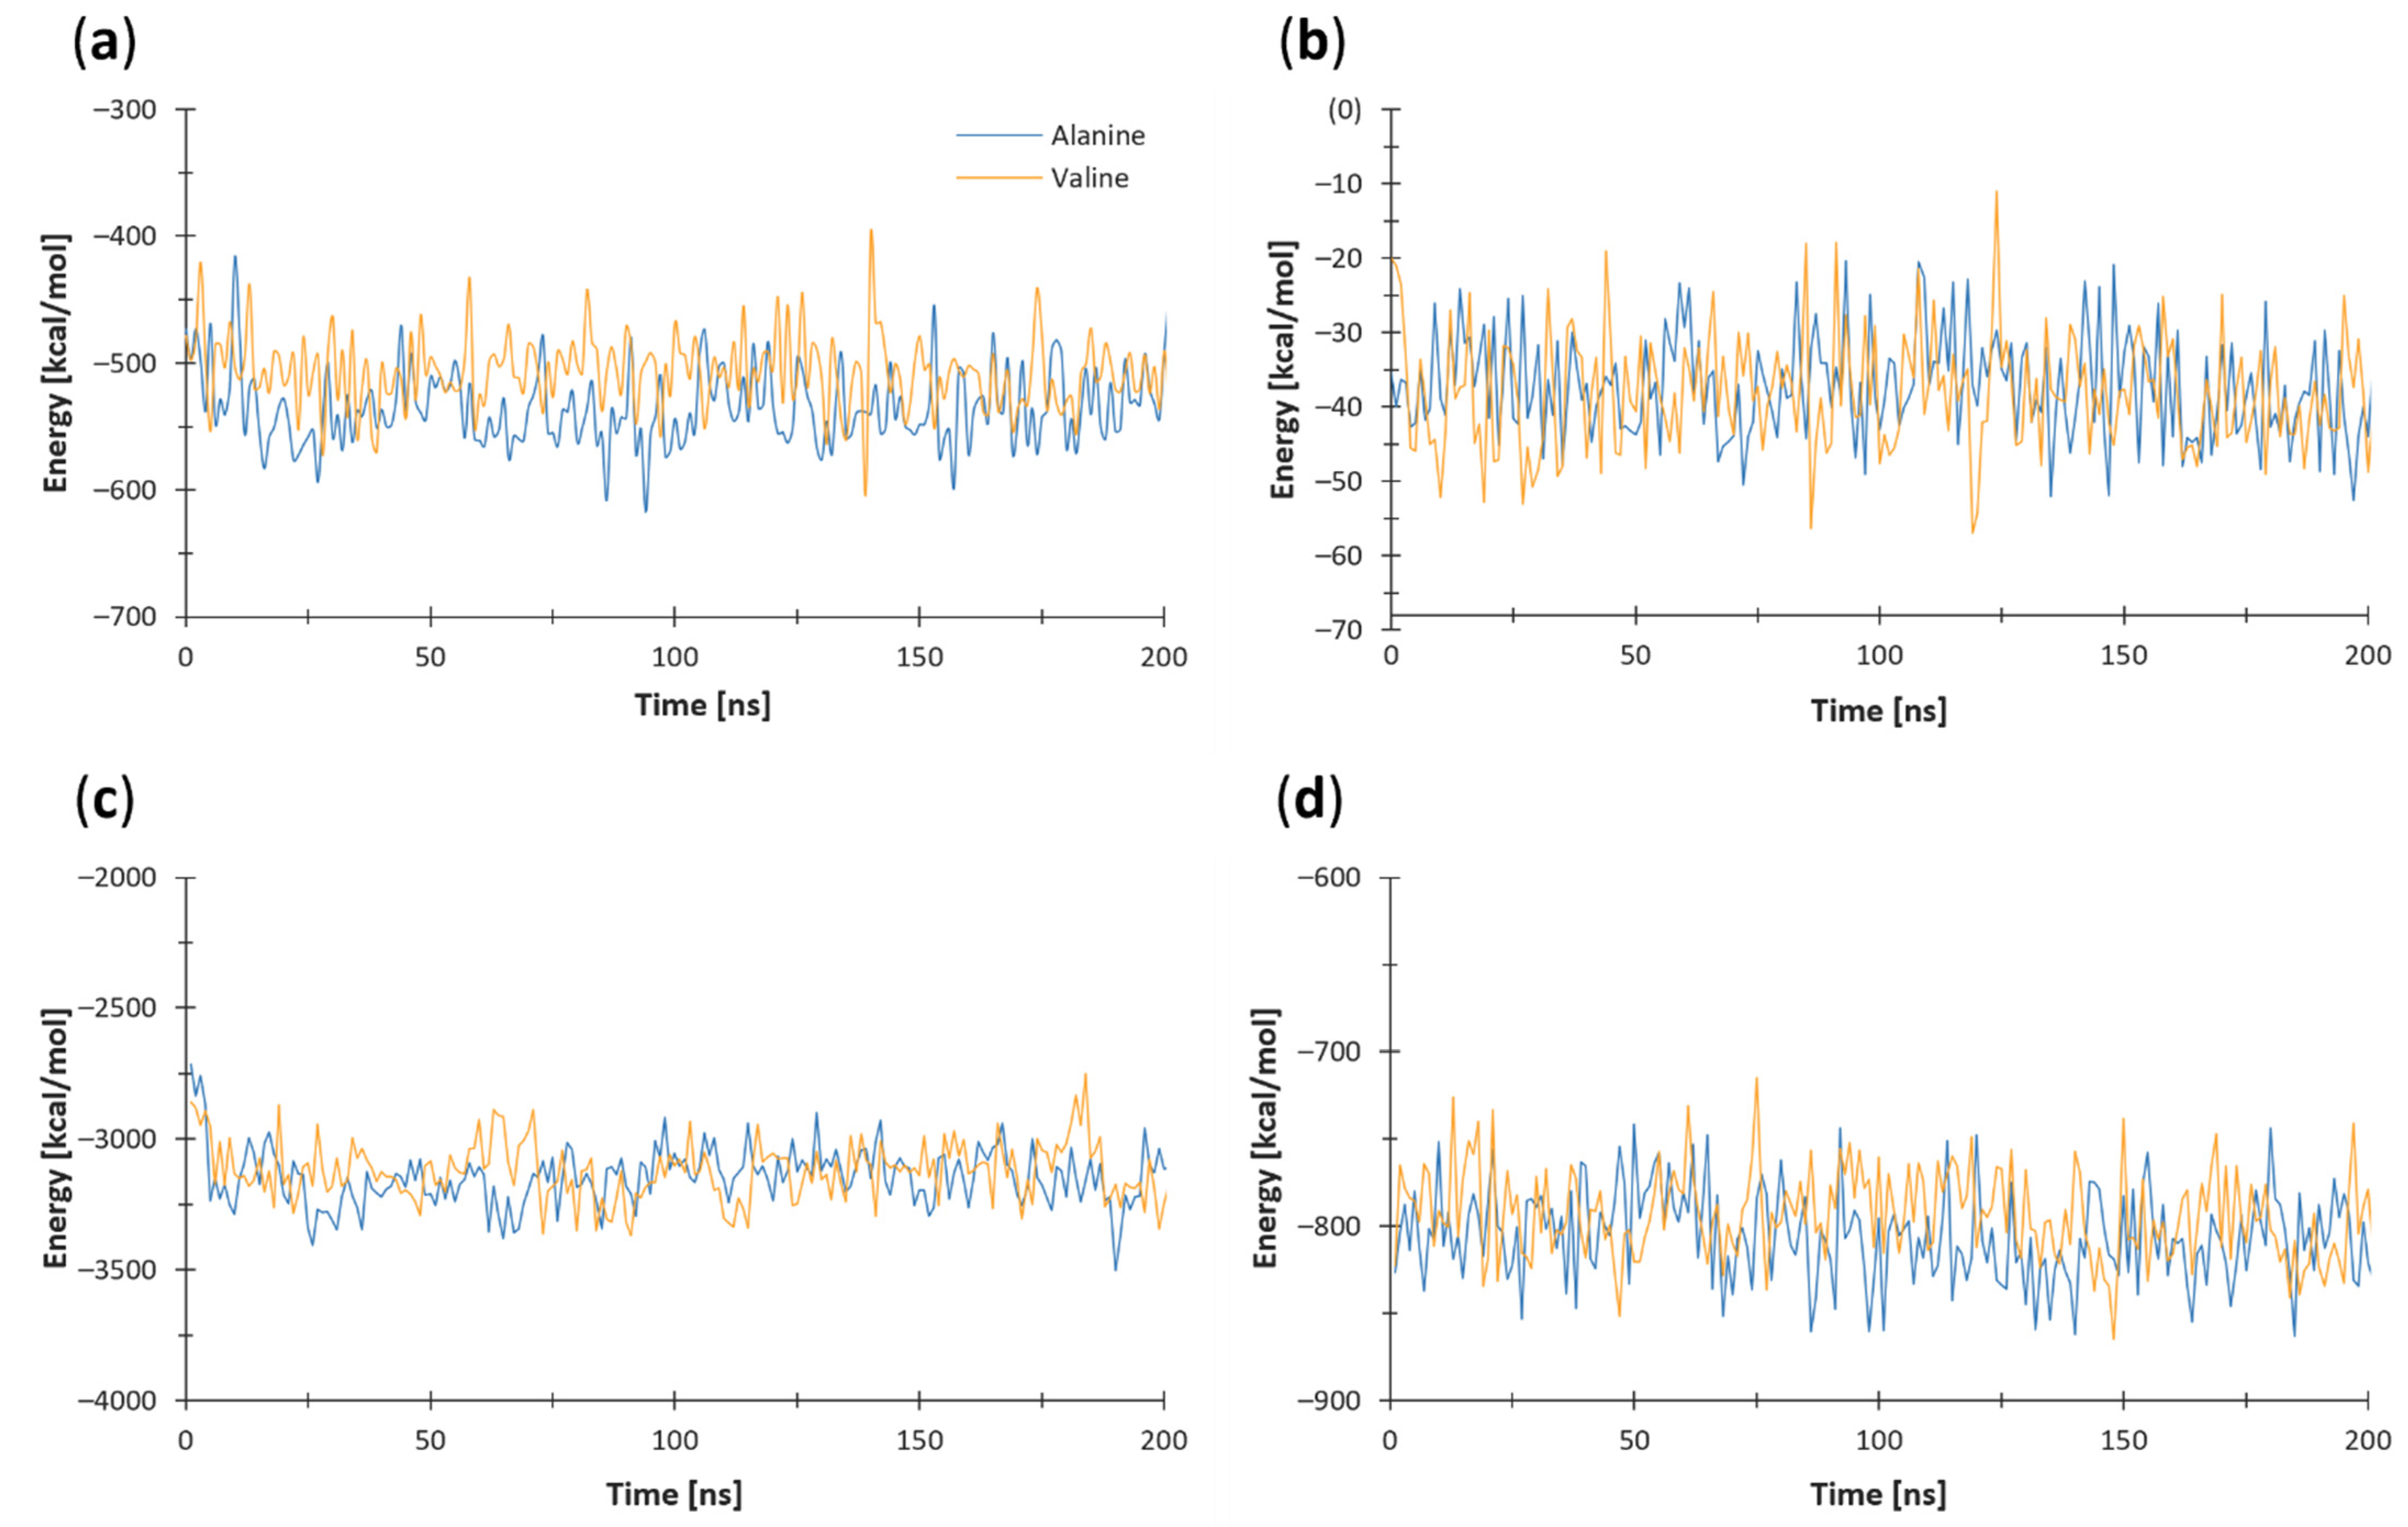
3.5. Nonbonded Energy
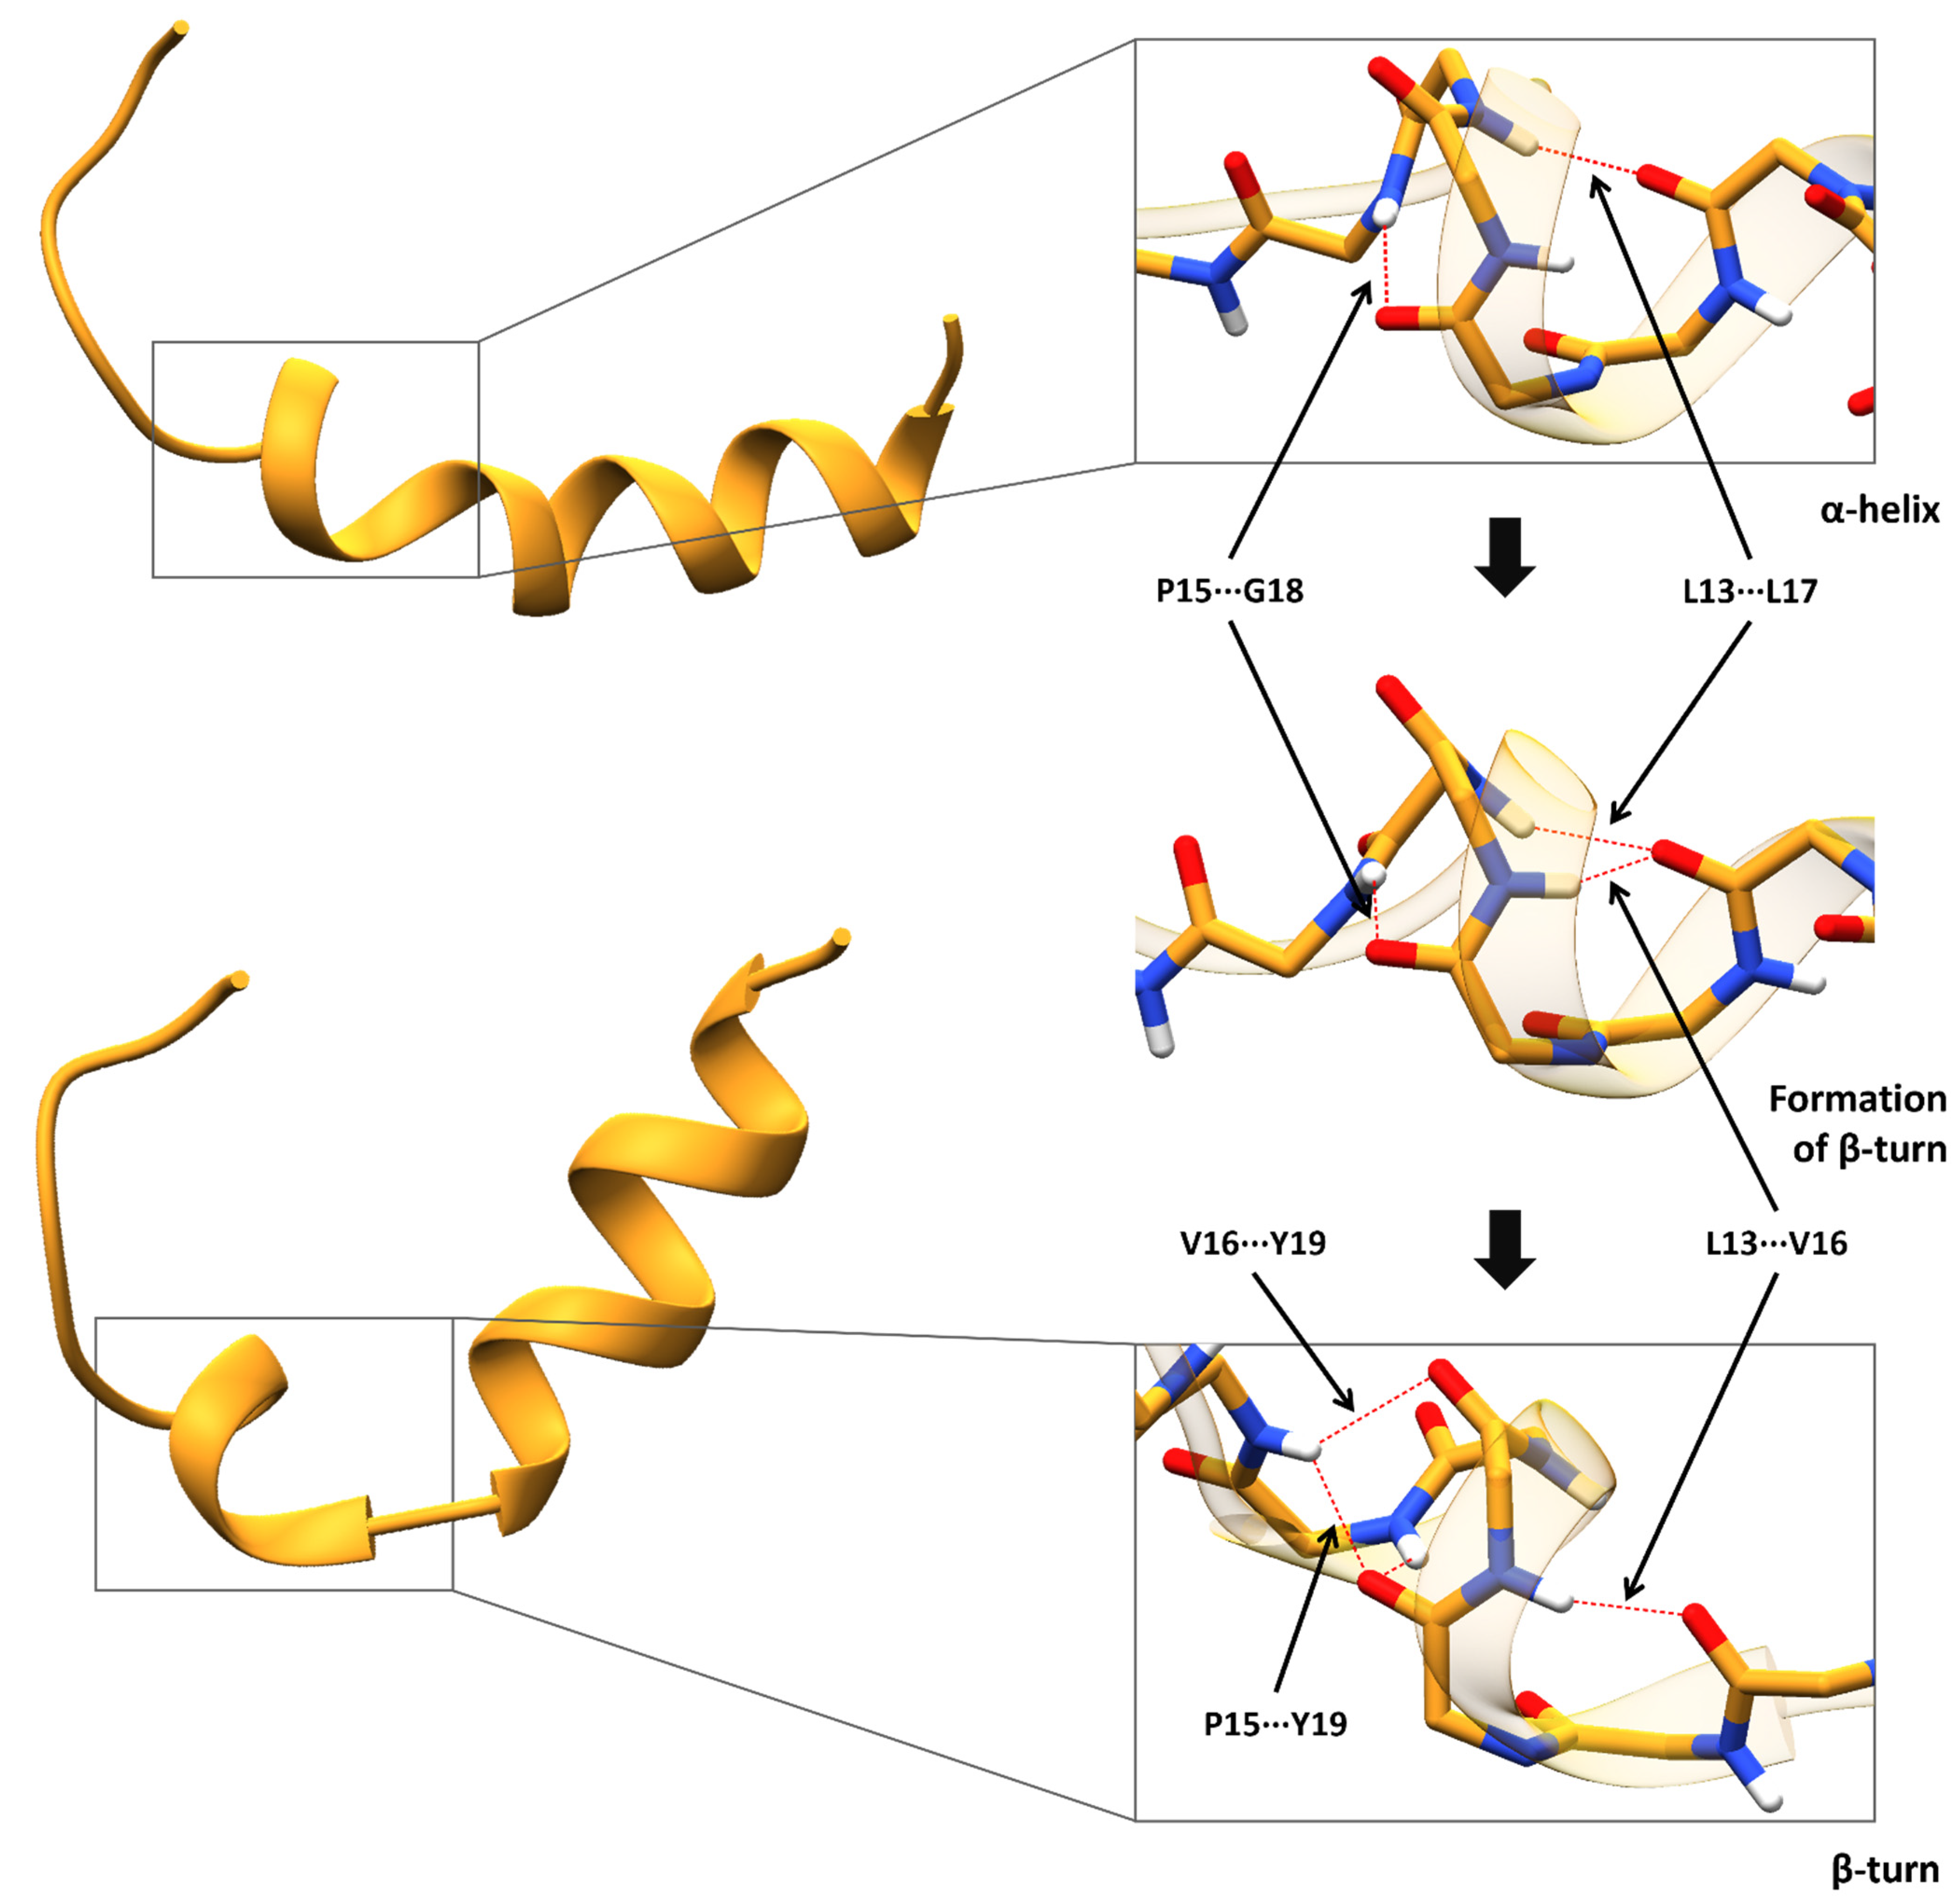
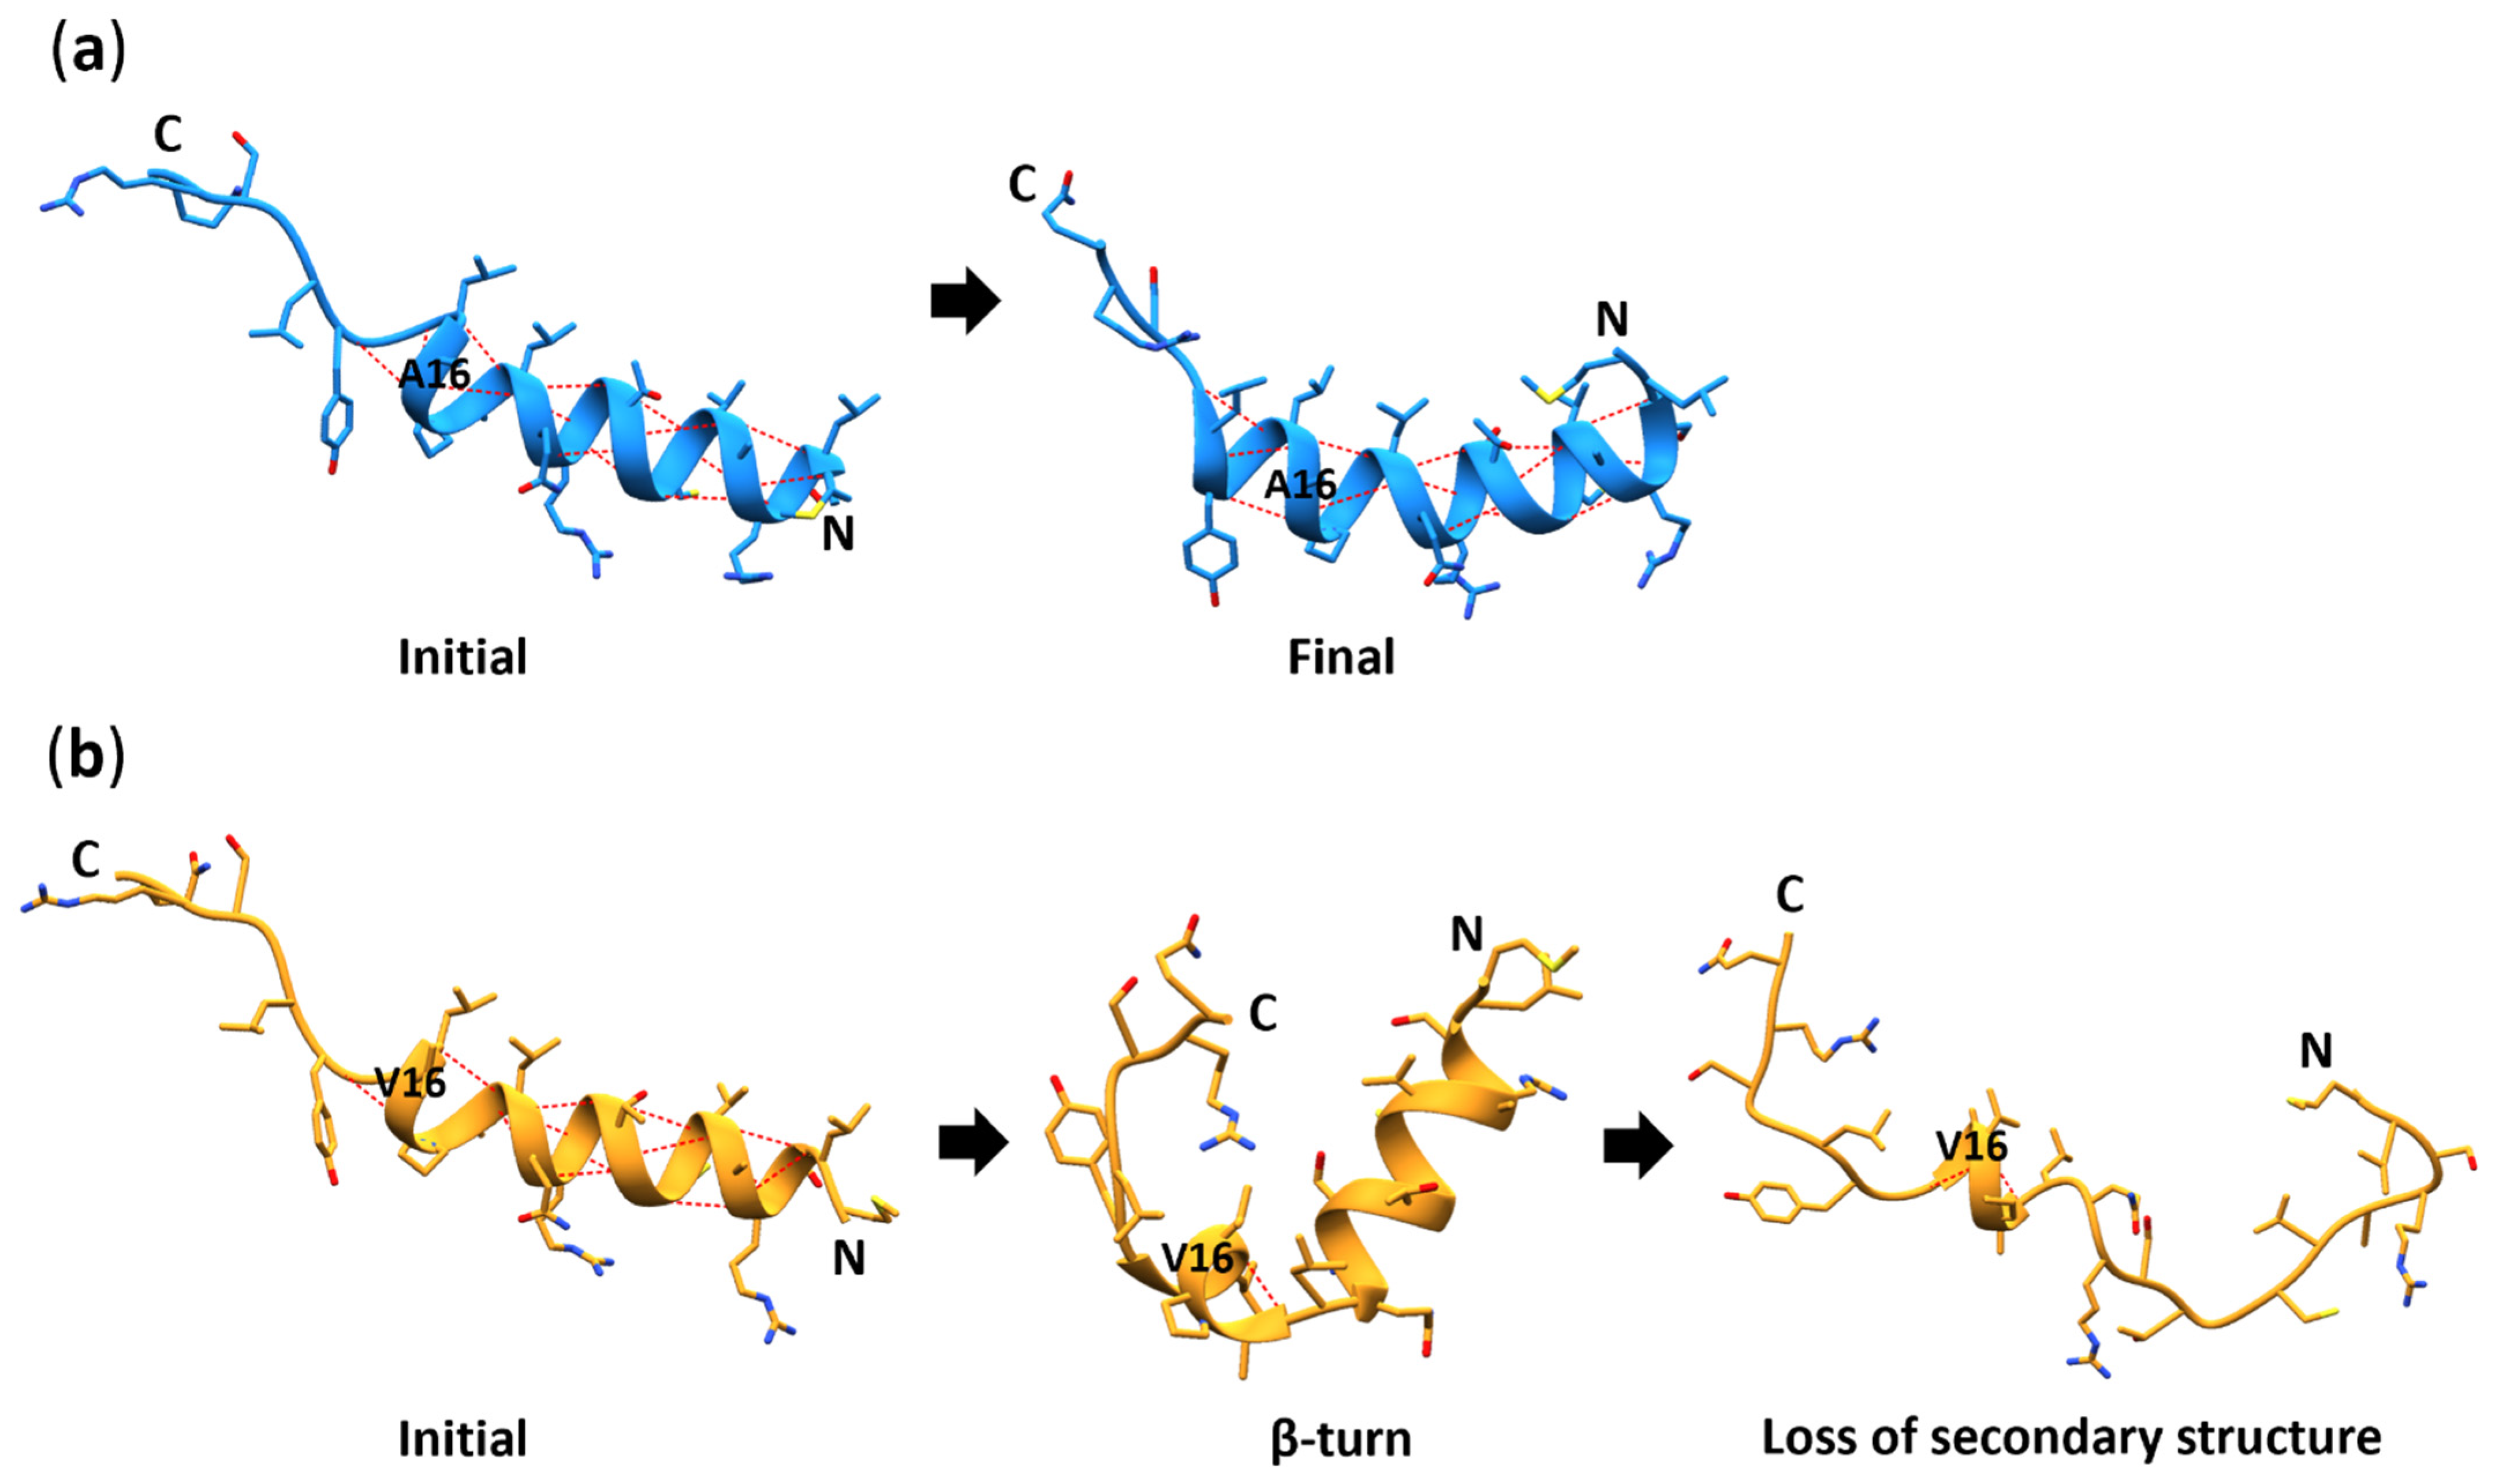
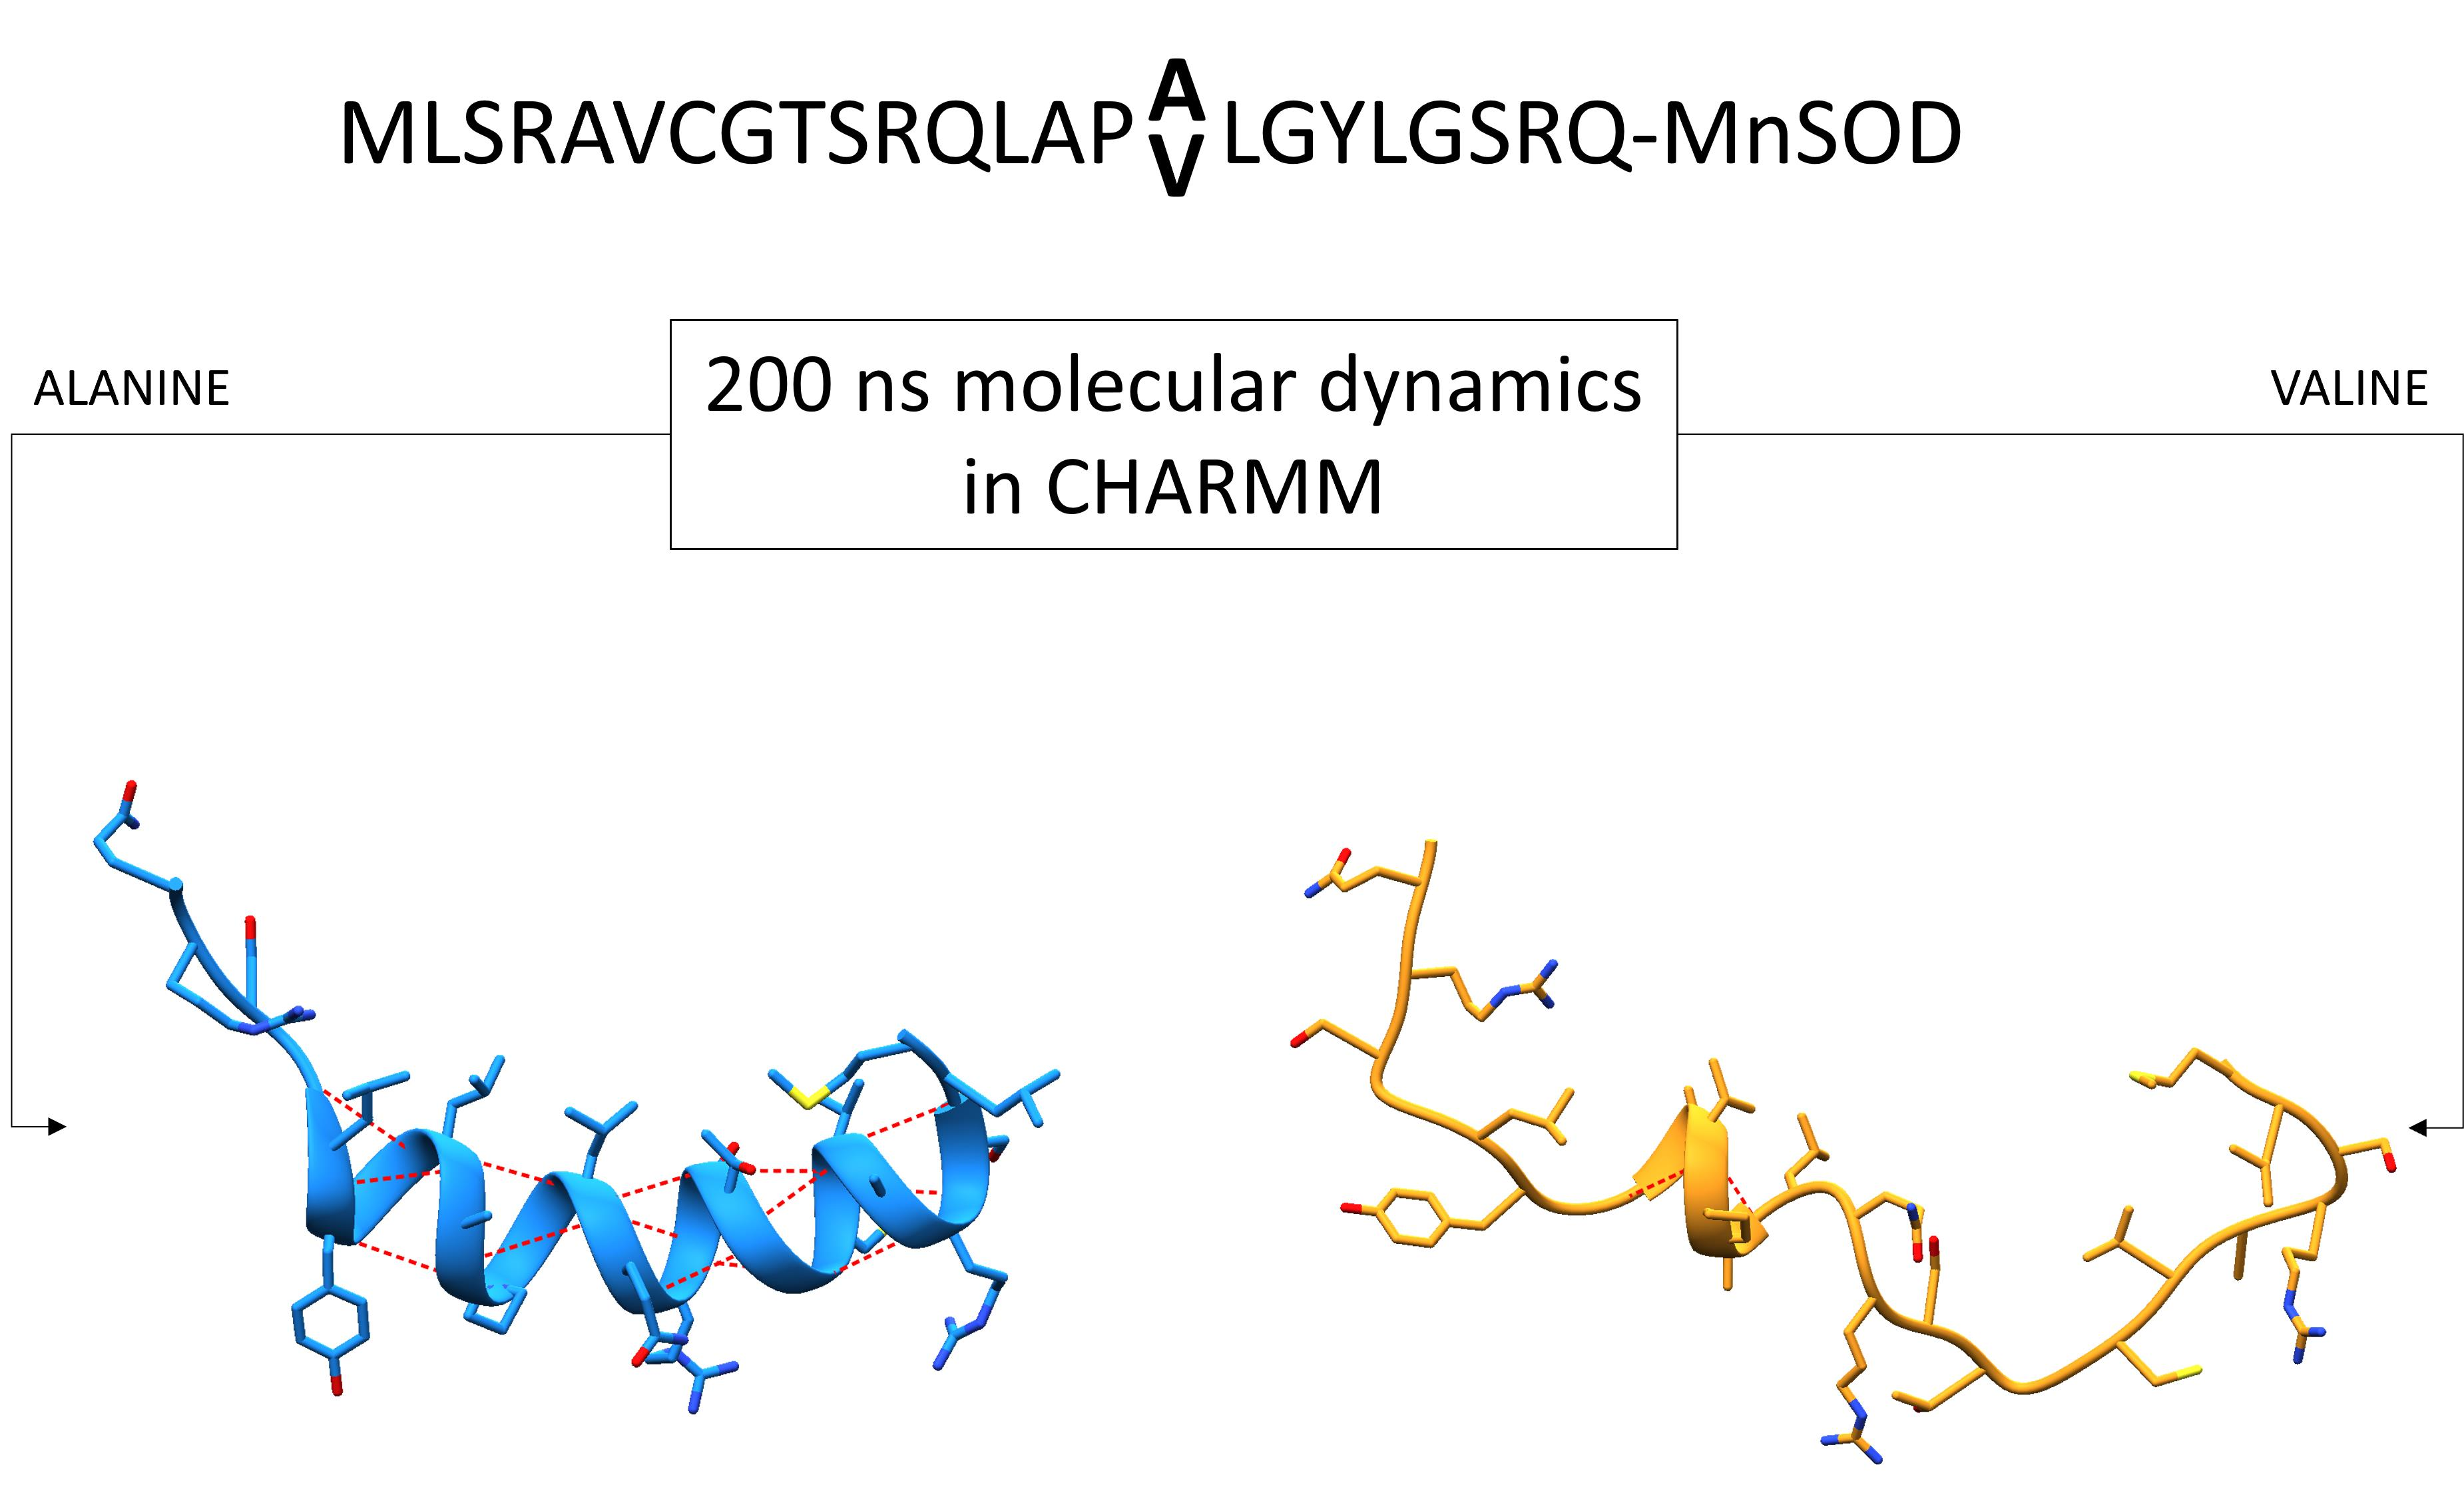
3.6. Secondary Structure
4. Conclusions
Supplementary Materials
Author Contributions
Funding
Institutional Review Board Statement
Informed Consent Statement
Data Availability Statement
Conflicts of Interest
Abbreviations
| Ala | alanine |
| Ala-MTS | alanine variant of mitochondrial targeting sequence |
| Arg | arginine |
| Asn | asparagine |
| Cα | alpha carbon atom in amino acids |
| C | cytosine allele |
| CC | cytosine-cytosine genotype for the RS4880 SNP |
| CT | cytosine-thymine genotype for the RS4880 SNP |
| ETC | electron transport chain |
| Gln | glutamine |
| Glu | glutamic acid |
| Gly | glycine |
| Leu | leucine |
| IMM | inner mitochondrial membrane |
| MD | molecular dynamics |
| Mn3+ | manganese (III) ion |
| MnSOD | manganese superoxide dismutase |
| MPM | malignant pleural mesothelioma |
| MTS | mitochondrial targeting sequence |
| PAH | polycyclic aromatic hydrocarbon |
| Pro | proline |
| RGYR | radius of gyration |
| RMSD | root-mean-square deviation |
| RMSF | root-mean-square fluctuation |
| ROS | reactive oxygen species |
| SNP | single nucleotide polymorphism |
| SOD2 | superoxide dismutase 2 gene |
| Val | valine |
| Val-MTS | valine variant of mitochondrial targeting sequence |
| T | thymine allele |
| TT | thymine-thymine genotype for the RS4880 SNP |
| Tyr | tyrosine |
References
- Thannickal, V.J.; Fanburg, B.L. Reactive oxygen species in cell signaling. Am. J. Physiol. Lung Cell Mol. Physiol. 2000, 279, 1005–1028. [Google Scholar] [CrossRef] [PubMed] [Green Version]
- Fingel, T. Signal transduction by reactive oxygen species in non-phagocytic cells. J. Leukoc. Biol. 1999, 65, 337–340. [Google Scholar] [CrossRef]
- Lo, Y.Y.C.; Cruz, T.F. Involvement of reactive oxygen species in cytokine and growth factor induction of c-fos expression in chondrocytes. J. Biol. Chem. 1995, 270, 11727–11730. [Google Scholar] [CrossRef] [PubMed] [Green Version]
- Krieger-Brauer, H.I.; Kather, H. Human fat cells possess a plasma membrane-bound H202-generating system that is activated by insulin via a mechanisms bypassing the receptor kinase. J. Clin. Investig. 1992, 89, 1006–1013. [Google Scholar] [CrossRef] [Green Version]
- Meier, B.; Radeke, H.H.; Sell, S.; Younes, M.; Sies, H.; Resch, K.; Habermehl, G.G. Human fibroblasts release reactive oxygen species in response to interleukin-1 or tumor necrosis factor. Biochem. J. 1989, 263, 539–545. [Google Scholar] [CrossRef] [PubMed]
- Ohba, M.; Shibanuma, M.; Kuroki, T.; Nose, K. Production of hydrogen peroxide by transforming growth factor-β1 and its involvement in induction of egr-1 in mouse osteoblastic cells. J. Cell. Biol. 1994, 126, 1079–1088. [Google Scholar] [CrossRef]
- Ohl, K.; Tenbrock, K.; Kipp, M. Oxidative stress in multiple sclerosis: Central and peripheral mode of action. Exp. Neurol. 2016, 277, 58–67. [Google Scholar] [CrossRef]
- Niles, J.C.; Wishnok, J.S.; Tannenbaum, S.R. Peroxynitrite-induced oxidation and nitration products of guanine and 8−oxoguanine: Structures and mechanisms of product formation. Nitric Oxide 2006, 14, 109–121. [Google Scholar] [CrossRef] [PubMed]
- Alvarez, B.; Radi, R. Peroxynitrite reactivity with amino acids and proteins. Amino Acids 2003, 25, 295–311. [Google Scholar] [CrossRef]
- Hogg, N.; Kalyanaraman, B. Nitric oxide and lipid peroxidation. Biochim. Biophy. Acta-Bioenerg. 1995, 1411, 378–384. [Google Scholar] [CrossRef]
- Doppler, H.; Storz, P. Mitochondrial and Oxidative Stress-Mediated Activation of Protein Kinase D1 and its importance in Pancreatic Cancer. Front. Oncol. 2017, 7, 41. [Google Scholar] [CrossRef] [PubMed] [Green Version]
- Weber, J.; Zuehlsdorff, T.; Cole, D.; Di Antonio, M.; Bohndiek, S. An Activatable Contrast Agent for Photoacoustic Imaging to Probe Oxidative Stress in Cancer. Proc. Physiol. Soc. 2016, 36, C06. [Google Scholar]
- Piskounova, E.; Agathocleous, M.; Murphy, M.; Hu, Z.P.; DeBerardinis, R.; Morrison, S. Oxidative stress limits metastasis of human melanoma cells. Cancer Res. 2015, 527, 186–191. [Google Scholar]
- Gurer-Orhan, H.; Ince, E.; Konyar, D.; Saso, L.; Suzen, S. The Role of Oxidative Stress Modulators in Breast Cancer. Curr. Med. Chem. 2018, 25, 4084–4101. [Google Scholar] [CrossRef] [PubMed]
- Sahine, U.M.; Birben, E.; Erzurum, S.; Sackesen, C.; Kalyci, O. Oxidative stress in asthma. World Allergy Organ. J. 2011, 4, 151–158. [Google Scholar] [CrossRef] [Green Version]
- Yuksel, M.; Ates, I.; Kaplan, M.; Arikan, M.F.; Ozin, Y.O.; Kilic, Z.M.Y.; Topcuoglu, C.; Kayacetin, E. Is oxidative stress associated with activation and pathogenesis of inflammatory bowel disease? J. Med. Biochem. 2017, 36, 341–348. [Google Scholar] [CrossRef]
- Weisiger, R.A.; Fridovich, I. Superoxide dismutase. Organelle specificity. J. Biol. Chem. 1973, 248, 3582–3592. [Google Scholar] [CrossRef]
- Andreyev, A.Y.; Kushnareva, Y.E.; Starkov, A.A. Mitochondrial metabolism of reactive oxygen species. Biochemistry 2005, 70, 200–214. [Google Scholar] [CrossRef]
- Chance, B.; Sies, H.; Boveris, A. Hydroperoxidemetabolism in mammalian organs. Physiol. Rev. 1979, 59, 527–605. [Google Scholar] [CrossRef]
- Lambert, A.J.; Brand, M.D. Superoxide production by NADH: Ubiquinone oxidoreductase (complex I) depends on the pH gradient across the mitochondrial inner membrane. Biochem. J. 2004, 382, 511–517. [Google Scholar] [CrossRef]
- Fukai, T.; Ushio-Fukai, M. Superoxide Dismutases: Role in Redox Signaling, Vascular Function, and Diseases. Antioxid. Redox Signal. 2011, 15, 1583–1606. [Google Scholar] [CrossRef] [PubMed] [Green Version]
- Fridovich, I. Superoxide radical and superoxide dismutases. Annu. Rev. Biochem. 1995, 64, 97–112. [Google Scholar] [CrossRef] [PubMed]
- Wan, X.S.; Devalaraja, M.N.; St. Clair, D.K. Molecular structure and organization of the human manganese superoxide dismutase gene. DNA Cell. Biol. 1994, 13, 1127–1136. [Google Scholar] [CrossRef]
- Wispe, J.R.; Clark, J.C.; Burhans, M.S.; Kropp, K.E.; Korfhagen, T.R.; Whitsett, J.A. Synthesis and processing of the precursor for human mangano-superoxide dismuates. Biochim. Biophys. Acta 1988, 994, 30–36. [Google Scholar] [CrossRef] [PubMed]
- Pfanner, N.; Geissler, A. Versatility of the mitochondrial protein import machinery. Nat. Rev. Mol. Cell Biol. 2001, 2, 339–349. [Google Scholar] [CrossRef]
- Wiedemann, N.; Frazier, A.E.; Pfanner, N. The Protein Import Machinery of Mitochondria. J. Biol. Chem. 2004, 279, 14473–14476. [Google Scholar] [CrossRef] [PubMed] [Green Version]
- Roise, D.; Horvath, S.J.; Tomich, J.M.; Richards, J.H.; Schatz, G. A chemically synthesized pre-sequence of an imported mitochondrial protein can form an amphiphilic helix and perturb natural and artificial phospholipid bilayers. EMBO J. 1986, 5, 1327–1334. [Google Scholar] [CrossRef]
- Chen, W.J.; Douglas, M.G. The role of protein structure in the mitochondrial import pathway. Unfolding of mitochondrially bound precursors is required for membrane translocation. J. Biol. Chem. 1987, 262, 15605–15609. [Google Scholar] [CrossRef]
- Von Heijne, G. Mitochondrial targeting sequences may form amphiphilic helices. EMBO J. 1986, 5, 1335–1342. [Google Scholar] [CrossRef]
- Taylor, A.B.; Smith, B.S.; Kitada, S.; Kojima, K.; Miyaura, H.; Otwinowski, Z.; Ito, A.; Deisenhofer, J. Crystal structures of mitochondrial processing peptidase reveal the mode for specific cleavage of import signal sequences. Structure 2001, 9, 615–625. [Google Scholar] [CrossRef] [Green Version]
- Hawlitschek, G.; Schneider, H.; Schmidt, B.; Tropschug, M.; Hartl, F.-U.; Neupert, W. Mitochondrial protein import: Identification of processing peptidase and of PEP, a processing enhancing protein. Cell 1988, 53, 795–806. [Google Scholar] [CrossRef] [PubMed] [Green Version]
- Shimoda-Matsubayashi, S.; Matsumine, H.; Kobayashi, T.; Nakagawa-Hattori, Y.; Shimizu, Y.; Mizuno, Y. Structural dimorphism in the mitochondrial targeting sequence in the human manganese superoxide dismutase gene. A predictive evidence for conformational change to influence mitochondrial transport and a study of allelic association in Parkinson’s disease. Biochem. Biophys. Res. Commun. 1996, 226, 561–565. [Google Scholar] [CrossRef] [PubMed]
- Rosenblum, J.S.; Gilula, N.B.; Lerner, R.A. On signal sequence polymorphisms and diseases of distribution. Proc. Natl. Acad. Sci. USA 1996, 93, 4471–4473. [Google Scholar] [CrossRef] [PubMed] [Green Version]
- Chou, P.Y.; Fasman, G.D. Prediction of protein conformation. Biochemistry 1974, 13, 222–245. [Google Scholar] [CrossRef] [PubMed]
- Schiffer, M.; Edmundson, A.B. Use of Helical Wheels to Represent the Structures of Proteins and to Identify Segments with Helical Potential. Biophys. J. 1967, 7, 121–135. [Google Scholar] [CrossRef] [Green Version]
- Sutton, A.; Khoury, H.; Prip-Buus, C.; Cepanec, C.; Pessayre, D.; Degoul, F. The Ala16Val genetic dimorphism modulates the import of human manganese superoxide dismutase into rat liver mitochondria. Pharm. Genom. 2003, 13, 145–157. [Google Scholar] [CrossRef]
- Sutton, A.; Imbert, A.; Igoudjil, A.; Descatoire, V.; Cazanave, S.; Pessayre, D.; Degoul, F. The manganese superoxide dismutase Ala16Val dimorphism modulates both mitochondrial import and mRNA stability. Pharm. Genom. 2005, 15, 311–319. [Google Scholar] [CrossRef]
- Bastakia, M.; Huena, K.; Manzanilloa, P.; Chande, N.; Chena, C.; Balmes, J.R.; Tager, I.B.; Hollanda, N. Genotype-activity relationship for Mn-superoxide dismutase, glutathione peroxidase 1 and catalase in humans. Pharm. Genom. 2006, 16, 279–286. [Google Scholar] [CrossRef] [PubMed] [Green Version]
- Valenti, L.; Conte, D.; Piperno, A.; Dongiovanni, P.; Fracanzani, A.L.; Fraquelli, M.; Vergani, A.; Gianni, C.; Carmagnola, L.; Fargion, S. The mitochondrial superoxide dismutase A16V polymorphism in the cardiomyopathy associated with hereditary haemochromatosis. J. Med. Genet. 2004, 41, 946–950. [Google Scholar] [CrossRef] [PubMed] [Green Version]
- Choi, J.Y.; Neuhouser, M.L.; Barnet, M.J.; Hong, C.C.; Kristal, A.R.; Thornquist, M.D.; King, I.B.; Goodman, G.E.; Ambrosone, C.B. Iron intake, oxidative stress-related genes (MnSOD and MPO) and prostate cancer risk in CARET cohort. Carcinogenesis 2008, 29, 964–970. [Google Scholar] [CrossRef] [PubMed] [Green Version]
- Zejnilovic, J.; Akev, N.; Yilmaz, H.; Isbir, T. Association between manganese superoxide dismutase polymorphism and risk of lung cancer. Cancer Gen. Cytogen. 2009, 189, 1–4. [Google Scholar] [CrossRef] [PubMed]
- Landi, S.; Gemignani, F.; Neri, M.; Barale, R.; Bonassi, S.; Bottari, F.; Canessa, P.A.; Canzian, F.; Ceppi, M.; Rosangela, F.; et al. Polymorphisms of glutathione-S-transferase M1 and manganese superoxide dismutase are associated with the risk of malignant pleural mesothelioma. Int. J. Cancer 2007, 120, 2739–2743. [Google Scholar] [CrossRef] [PubMed]
- Rajaraman, P.; Hutchinson, A.; Rothman, N.; Black, P.M.; Fine, H.A.; Loeffler, J.S.; Selker, R.G.; Shapiro, W.R.; Linet, M.S.; Inskip, P.D. Oxidative response gene polymorphisms and risk of adult brain tumours. Neuro Oncol. 2008, 10, 709–715. [Google Scholar] [CrossRef] [Green Version]
- Glynn, S.A.; Boersma, B.J.; Howe, T.M.; Edvardsen, H.; Geisler, S.B.; Goodman, J.E.; Ridnour, L.A.; Lønning, P.E.; Børresen-Dale, A.-L.; Naume, B.; et al. A mitochondrial target sequence polymorphism in manganese superoxide dismutase predicts inferior survival in breast cancer patients treated with cyclophosphamide. Clin. Cancer Res. 2009, 15, 4165–4173. [Google Scholar] [CrossRef] [PubMed] [Green Version]
- Tu, H.; Pan, K.-F.; Zhang, Y.; Li, W.-Q.; Zhang, L.; Ma, J.-L.; Li, J.-Y.; You, W.-C. Manganese superoxide dismutase polymorphism and risk of gastric lesions, and its effects on chemoprevention in a Chinese population. Cancer Epidemiol. Biomark. Prev. 2010, 19, 1089–1097. [Google Scholar] [CrossRef] [PubMed] [Green Version]
- Xu, Z.; Chen, Y.; Gu, D.; Lee, N.P.; Sun, S.; Gong, W.; Tan, Y.; Luk, J.M.; Chen, J. SOD2 rs4880 CT/CC genotype predicts poor survival for Chinese gastric cancer patients received platinum and fluorouracil based adjuvant chemotherapy. Am. J. Transl. Res. 2015, 7, 401–410. [Google Scholar] [CrossRef] [Green Version]
- Hong, Y.-C.; Lee, K.-H.; Yi, C.-H.; Ha, E.-H.; Christiani, D.C. Genetic susceptibility of term pregnant women to oxidative damage. Toxicol. Lett. 2002, 129, 255–263. [Google Scholar] [CrossRef]
- Park, S.-Y.; Lee, K.-H.; Kang, D.; Lee, K.-H.; Ha, E.-H.; Hong, Y.-C. Effect of genetic polymorphisms of MnSOD and MPO on the relationship between PAH exposure and oxidative DNA damage. Mutat. Res. 2006, 593, 108–115. [Google Scholar] [CrossRef]
- Ambrosone, C.B.; Freudenheim, J.L.; Thompson, P.A.; Bowman, E.; Vena, J.E.; Marshall, J.R.; Graham, S.; Laughlin, R.; Nemoto, T.; Shields, P.G. Manganese superoxide dismutase (MnSOD) genetic polymorphisms, dietary antioxidants, and risk of breast cancer. Cancer Res. 1999, 59, 602–606. [Google Scholar]
- Poljsak, B.; Šuput, D.; Milisav, I. Achieving the balance between ROS and antioxidants: When to use the synthetic antioxidants. Oxidative Med. Cell. Longev. 2013, 2013, 956792. [Google Scholar] [CrossRef]
- Allan, K.; Kelly, F.J.; Devereux, G. Antioxidants and allergic disease: A case of too little or too much? Clin. Exp. Allergy 2010, 40, 370–380. [Google Scholar] [CrossRef]
- SNPedia, rs4880. Available online: https://www.snpedia.com/index.php/Rs4880 (accessed on 5 November 2022).
- McGuffin, L.J.; Bryson, K.; Jones, D.T. The PSIPRED protein structure prediction server. Bioinformatics 2000, 16, 404–405. [Google Scholar] [CrossRef] [Green Version]
- Lamiable, A.; Thévenet, P.; Rey, J.; Vavrusa, M.; Derreumaux, P.; Tufféry, P. PEP-FOLD3: Faster de novo structure prediction for linear peptides in solution and in complex. Nucleic Acids Res. 2016, 44, 449–454. [Google Scholar] [CrossRef] [PubMed]
- Azadmanesh, J.; Trickel, S.R.; Borgstahl, G.E.O. Substrate-analog binding and electrostatic surfaces of human manganese superoxide dismutase. J. Struct. Biol. 2017, 199, 68–75. [Google Scholar] [CrossRef]
- Yan, Y.; Zhang, D.; Zhou, P.; Li, B.; Huang, S.-Y. HDOCK: A web server for protein-protein and protein-DNA/RNA docking based on a hybrid strategy. Nucleic Acids Res. 2017, 45, 365–373. [Google Scholar] [CrossRef] [PubMed]
- Brooks, B.R.; Brooks, C.L.; MacKerell, A.D., Jr.; Nilsson, L.; Petrella, R.J.; Roux, B.; Won, Y.; Archontis, G.; Bartels, C.; Boresch, S.; et al. CHARMM: The Biomolecular simulation Program. J. Comp. Chem. 2009, 30, 1545–1615. [Google Scholar] [CrossRef] [PubMed] [Green Version]
- Phillips, J.C.; Hardy, D.J.; Maia, J.D.C.; Stone, J.E.; Ribeiro, J.V.; Bernardi, R.C.; Buch, R.; Fiorin, G.; Henin, J.; Jiang, W.; et al. Scalable molecular dynamics on CPU and GPU architectures with NAMD. J. Chem. Phsy. 2020, 153, 044130. [Google Scholar] [CrossRef]
- Berman, H.M.; Westbrook, J.; Feng, Z.; Gilliland, G.; Bhat, T.N.; Weissig, H.; Shindyalov, I.N.; Bourne, P.E. The Protein Data Bank. Nucleic Acids Res. 2000, 28, 235–242. [Google Scholar] [CrossRef] [PubMed] [Green Version]
- Case, D.A.; Aktulga, H.M.; Belfon, K.; Ben-Shalom, I.Y.; Brozell, S.R.; Cerutti, D.S.; Cheatham, T.E.; Cruzeiro, V.W.D.; Darden, T.A.; Duke, R.E.; et al. Amber 2020; University of California: San Francisco, CA, USA, 2020. [Google Scholar]
- Van Gunsteren, W.F.; Billeter, S.R.; Eising, A.A.; Hünenberger, P.H.; Krüger, P.; Mark, A.E.; Scott, W.R.P.; Tironi, I.G. Biomolecular Simulation: The GROMOS96 Manual and User Guide; Vdf Hochschulverlag AG an der ETH Zürich: Zürich, Switzerland, 1996; pp. 1–1044. [Google Scholar]
- Katchalski-Katzir, E.; Shariv, I.; Eisenstein, M.; Friesem, A.A.; Aflalo, C.; Vakser, I.A. Molecular surface recognition: Determination of geometric fit between proteins and their ligands by correlation techniques. Proc. Natl. Acad. Sci. USA 1992, 89, 2195–2199. [Google Scholar] [CrossRef] [Green Version]
- Huang, S.Y.; Zou, X. MDockPP: A hierarchical approach for protein-protein docking and its application to CAPRI rounds 15–19. Proteins Struct. Funct. Bioinform. 2010, 78, 3096–3103. [Google Scholar] [CrossRef] [Green Version]
- Pettersen, E.F.; Goddard, T.D.; Huang, C.C.; Couch, G.S.; Greenblatt, D.M.; Meng, E.C.; Ferring, T.E. UCSF Chimera—A visualization system for exploratory research and analysis. J. Comput. Chem. 2004, 25, 1602–1612. [Google Scholar] [CrossRef] [Green Version]
- Sali, A.; Blundell, T.L. Comparative protein modelling by satisfaction of spatial restraints. J. Mol. Biol. 1993, 234, 779–815. [Google Scholar] [CrossRef] [PubMed]
- Borgstahl, G.E.O.; Parge, H.E.; Hickey, M.J.; Beyer, W.F., Jr.; Hallewell, R.A.; Tainer, J.A. The structure of human mitochondrial manganese superoxide dismutase reveals a novel tetrameric interface of two 4-helix bundles. Cell 1992, 71, 107–118. [Google Scholar] [CrossRef]
- Barnese, K.; Sheng, Y.; Stich, T.A.; Gralla, E.B.; Britt, R.D.; Cabelli, D.E.; Valentine, J.S. Investigation of the Highly Active Manganese Superoxide Dismutase from Saccharomyces cerevisiae. J. Am. Chem. Soc. 2010, 132, 12525–12527. [Google Scholar] [CrossRef] [PubMed] [Green Version]
- Stroupe, M.E.; DiDonato, M.; Tainer, J.A. Handbook of Metalloproteins; Messerschmidt, A., Ed.; John Wiley & Sons Ltd.:: Chichester, UK, 2001; Volume 2, p. 941. [Google Scholar]
- Khan, H.M.; MacKerrel, A.D.; Reuter, N. Cation-π Interactions between Methylated Ammonium Groups and Tryptophan in the CHARMM36 Additive Force Field. J. Chem. Theory Comput. 2019, 15, 7–12. [Google Scholar] [CrossRef]
- Nosé, S. A molecular dynamics method for simulations in the canonical ensemble. Mol. Phys. 1984, 52, 255–268. [Google Scholar] [CrossRef]
- Darden, T.; Perera, L.; Li, L.; Pedersen, L. New Tricks for Modelers from the Crystallography Toolkit: The Particle Mesh Ewald Algorithm and its Use in Nucleic Acid Simulations. Structure 1999, 7, R55–R60. [Google Scholar] [CrossRef] [Green Version]
- Humphrey, W.; Dalke, A.; Schulten, K. VMD—Visual Molecular Dynamics. J. Molec. Graph. 1996, 14, 33–38. [Google Scholar] [CrossRef]
- Heinig, M.; Frishman, D. STRIDE: A web server for secondary structure assignment from known atomic coordinates of proteins. Nucleic Acids Res. 2004, 32, 500–502. [Google Scholar] [CrossRef] [Green Version]
- Microsoft Corporation. Microsoft Excel 2018. Available online: https://office.microsoft.com/excel (accessed on 13 August 2022).
- St. Clair, D.; Kasarskis, E. Genetic polymorphism of the human manganese superoxide dismutase: What difference does it make? Pharm. Genom. 2003, 13, 129–130. [Google Scholar] [CrossRef] [PubMed]
- Yang, J.; Yan, R.; Roy, A.; Xu, D.; Poisson, J.; Zhang, Y. The I-TASSER Suite: Protein structure and function prediction. Nat. Methods 2015, 12, 7–8. [Google Scholar] [CrossRef] [Green Version]
- de Carvalho, M.D.C.; de Mesquita, J.F. Structural Modeling and In Silico Analysis of Human Superoxide Dismutase 2. PLoS ONE 2013, 8, e65558. [Google Scholar] [CrossRef] [PubMed]
- Mayer, B.; Klein, C. Influence of solvation on the helix-forming tendency of nonpolar amino acids. J. Mol. Struct. 2000, 532, 213–226. [Google Scholar] [CrossRef]
- Okamoto, Y.; Hansmann, U.H.E. Thermodynamics of Helix-Coil Transitions Studied by Multicanonical Algorithms. J. Phys. Chem. 1995, 99, 11276–11287. [Google Scholar] [CrossRef]
- Chakrabartty, A.; Kortemme, T.; Baldwin, R.L. Helix propensities of the amino acids measured in alanine-based peptides without helix-stabilizing side-chain interactions. Protein Sci. 1994, 3, 843–852. [Google Scholar] [CrossRef] [PubMed] [Green Version]
- Gregoret, L.M.; Sauer, R.T. Tolerance of a protein helix to multiple alanine and valine substitutions. Fold. Des. 1998, 3, 119–126. [Google Scholar] [CrossRef] [Green Version]
- Tobias, D.J.; Brooks 3rd, C.L. Thermodynamics and mechanism of alpha helix initiation in alanine and valine peptides. Biochemistry 1991, 30, 6059–6070. [Google Scholar] [CrossRef]
- Okamoto, Y. Helix-forming tendencies of nonpolar amino acids predicted by Monte Carlo simulated annealing. Proteins Struct. Funct. Genet. 1994, 19, 14–23. [Google Scholar] [CrossRef]
- Padmanabhan, S.; Marquesse, S.; Ridgeway, T.; Laue, T.M.; Baldwin, R.L. Relative helix-forming tendencies of nonpolar amino acids. Nature 1990, 344, 268–270. [Google Scholar] [CrossRef]
- O’Neil, K.T.; DeGrado, W.F. A thermodynamic scale for the helix-forming tendencies of the commonly occurring amino acids. Science 1990, 250, 646–651. [Google Scholar] [CrossRef]
- Lyu, P.C.; Liff, M.I.; Marky, L.A.; Kallenbach, N.R. Side Chain Contributions to the Stability of Alpha-Helical Structure in Peptides. Science 1990, 250, 669–673. [Google Scholar] [CrossRef]
- Jacchieri, S.G.; Richards, N.G. Probing the influence of sequence-dependent interactions upon alpha-helix stability in alanine-based linear peptides. Biopolymers 1993, 33, 971–984. [Google Scholar] [CrossRef]
- Piela, L.; Nemethy, G.; Scheraga, H.A. Conformational constraints of amino acid side chains in α-helices. Biopolymers 1987, 26, 1273–1286. [Google Scholar] [CrossRef] [PubMed]
- Lyu, P.C.; Sherman, J.C.; Chen, A.; Kallenbach, N.R. α-Helix stabilization by natural and unnatural amino acids with alkyl side chains. Proc. Natl. Acad. Sci. USA 1991, 88, 5317–5320. [Google Scholar] [CrossRef] [PubMed] [Green Version]
- Crasto, C.; Feng, J. Sequence codes for extended conformation: A neighbor-dependent sequence analysis of loops in proteins. Proteins Struct. Funct. Bioinform. 2001, 42, 399–413. [Google Scholar] [CrossRef]


| Rs4880 | Alanine | Valine |
|---|---|---|
| Location | 6q.25.3, SOD2 gene, position 47 | |
| Nucleotide polymorphism | C (cytosine) | T (thymine) |
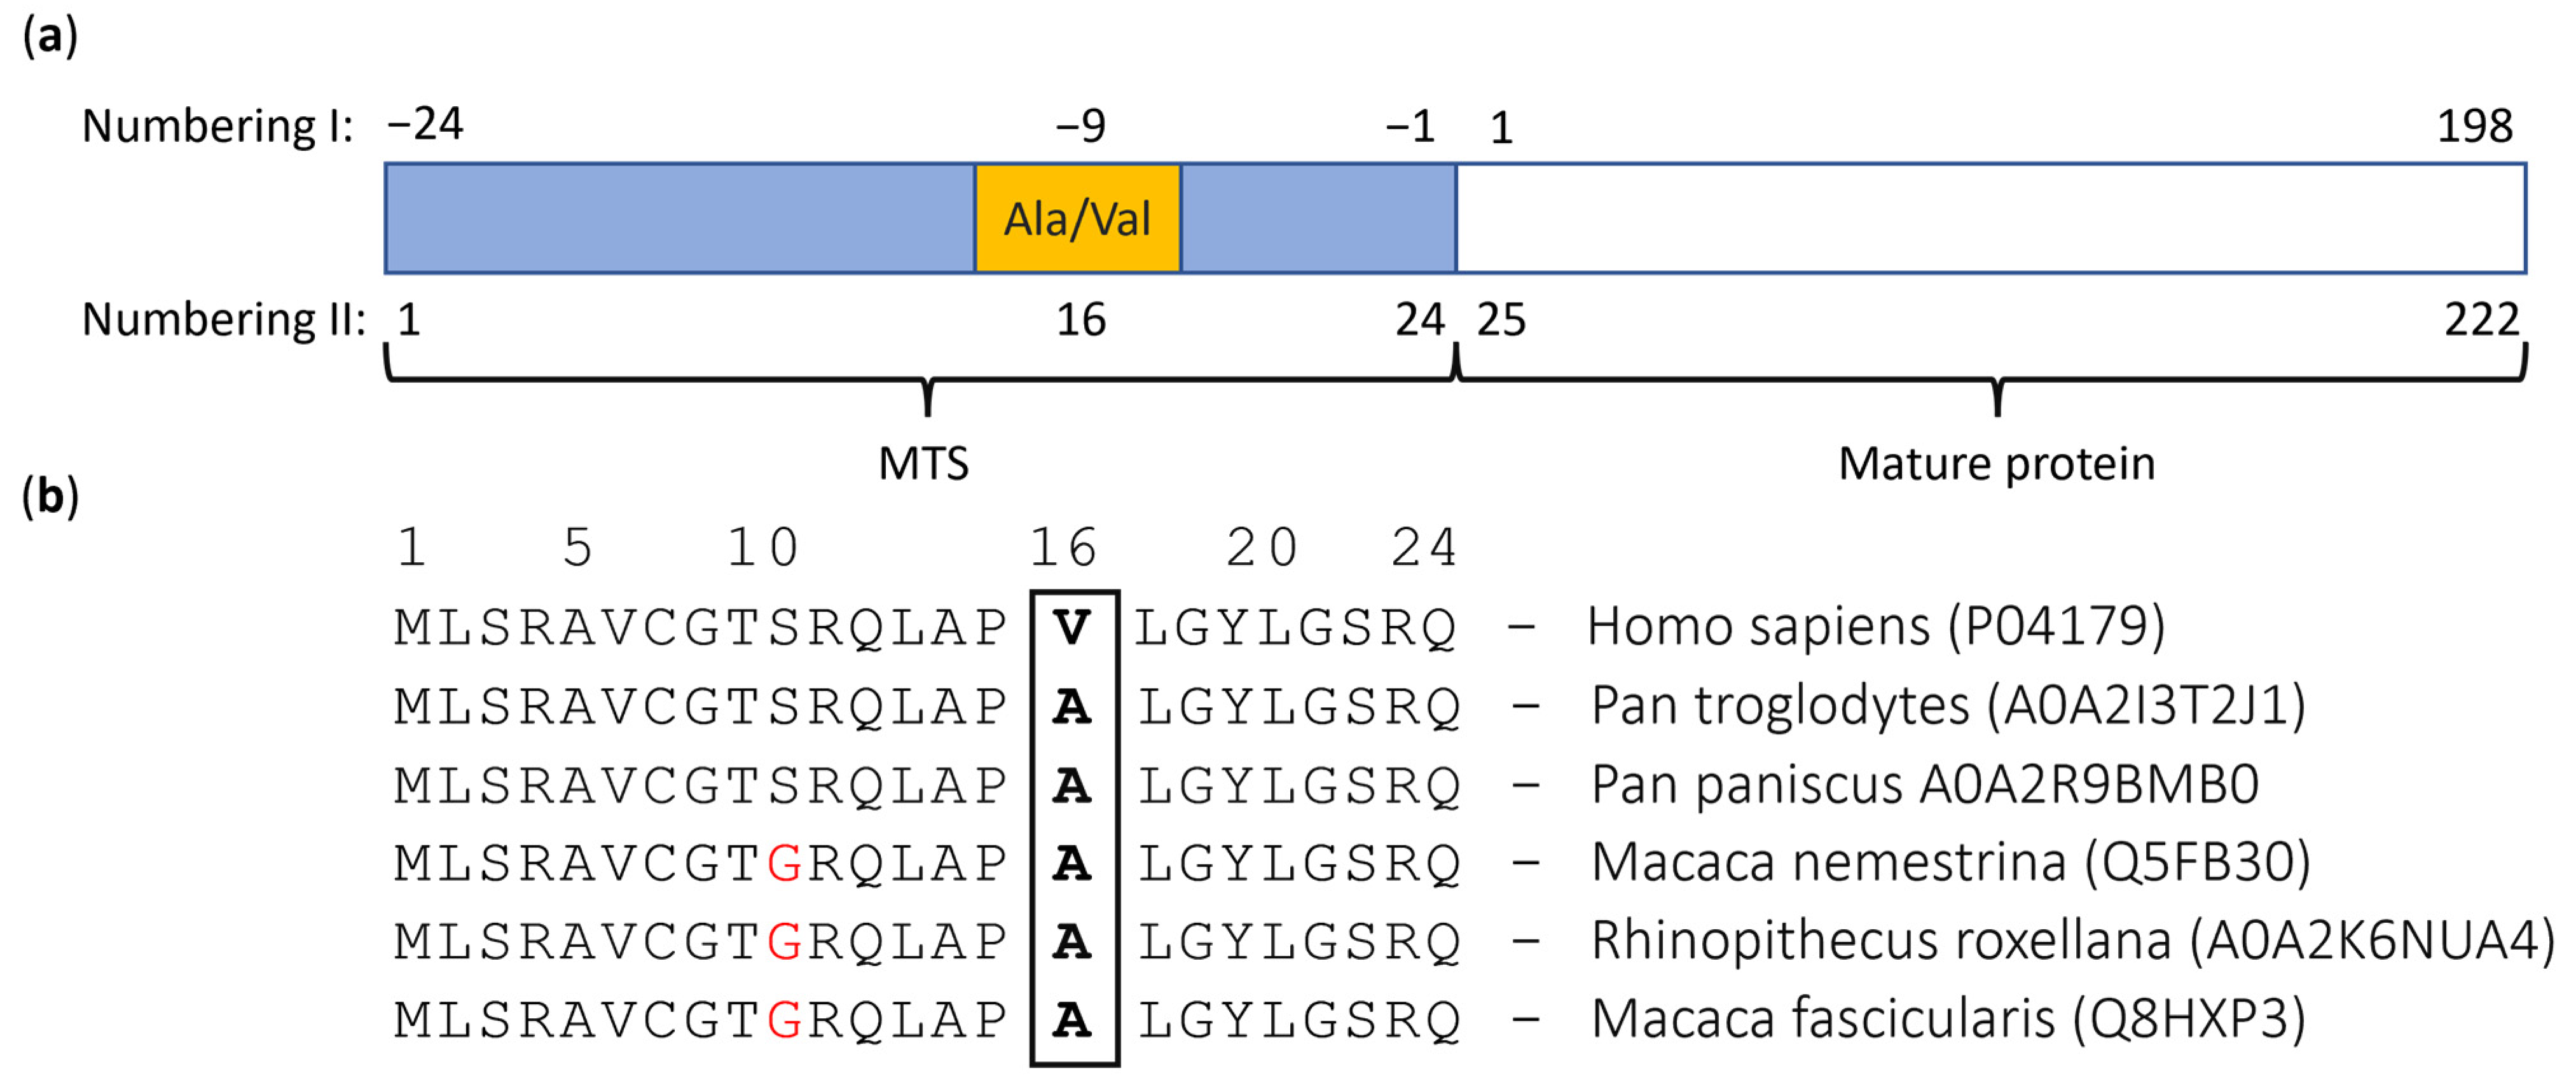
| Substitution location | Position 16 of MTS, position −9 of MnSOD (Figure 2a) | |
| Translates to | Alanine (Ala) | Valine (Val) |
| Protein secondary structure | (4–9) α-helix, (10–17) β-sheet [32] | (4–20) β-sheet [32] |
| Disease implications | Malignant pleural mesothelioma [42] | Heart disease in hereditary hemochromatosis [39] |
| Acoustic neuroma [43] | An aggressive form of prostate cancer [40] | |
| Breast cancer [44] | Lung cancer [41] | |
| Intestinal metaplasia [45] | ||
| Gastric cancer [46] | ||
| Increased concentration of ROS-induced DNA damage biomarkers [47] | ||
| Greater oxidative injury caused by the PAH exposure [48] | ||
| Alanine | Valine | ||||
|---|---|---|---|---|---|
| Donor | Acceptor | Occupancy [%] | Donor | Acceptor | Occupancy [%] |
| Leu20 N | Ala16 O | 43.5 | Arg23 NH2 | Glu66 OE2 | 36.3 |
| Leu17 N | Leu13 O | 39.6 | Arg23 NH1 | Glu66 OE1 | 35.9 |
| Thr9 OG1 | Ala5 O | 31.3 | Tyr69 OH | Gln12 O | 35.1 |
| Cys7 N | Ser3 O | 29.7 | Leu17 N | Leu13 O | 25.4 |
| Ser10 N | Val6 O | 29.2 | Arg23 NH2 | Glu66 OE1 | 21.3 |
| Thr9 N | Ala5 O | 28.5 | Arg23 NH1 | Glu66 OE2 | 21.0 |
| Leu13 N | Thr9 O | 27.6 | Asn63 ND2 | Gln24 O | 18.0 |
| Arg23 NH1 | Leu20 O | 26.8 | Cys7 N | Ser3 O | 16.2 |
| Gly8 N | Arg4 O | 26.7 | Thr9 OG1 | Ala5 O | 15.5 |
| Arg23 NE | Asn63 OD1 | 25.8 | Arg23 NH2 | Asn63 OD1 | 13.5 |
Publisher’s Note: MDPI stays neutral with regard to jurisdictional claims in published maps and institutional affiliations. |
© 2022 by the authors. Licensee MDPI, Basel, Switzerland. This article is an open access article distributed under the terms and conditions of the Creative Commons Attribution (CC BY) license (https://creativecommons.org/licenses/by/4.0/).
Share and Cite
Broz, M.; Furlan, V.; Lešnik, S.; Jukič, M.; Bren, U. The Effect of the Ala16Val Mutation on the Secondary Structure of the Manganese Superoxide Dismutase Mitochondrial Targeting Sequence. Antioxidants 2022, 11, 2348. https://doi.org/10.3390/antiox11122348
Broz M, Furlan V, Lešnik S, Jukič M, Bren U. The Effect of the Ala16Val Mutation on the Secondary Structure of the Manganese Superoxide Dismutase Mitochondrial Targeting Sequence. Antioxidants. 2022; 11(12):2348. https://doi.org/10.3390/antiox11122348
Chicago/Turabian StyleBroz, Matic, Veronika Furlan, Samo Lešnik, Marko Jukič, and Urban Bren. 2022. "The Effect of the Ala16Val Mutation on the Secondary Structure of the Manganese Superoxide Dismutase Mitochondrial Targeting Sequence" Antioxidants 11, no. 12: 2348. https://doi.org/10.3390/antiox11122348