
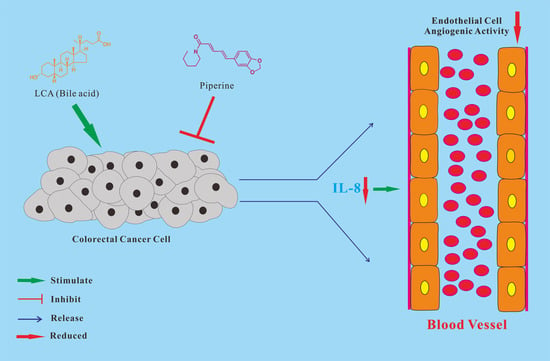
Piperine Attenuates Lithocholic Acid-Stimulated Interleukin-8 by Suppressing Src/EGFR and Reactive Oxygen Species in Human Colorectal Cancer Cells

 ,
,  and
and
Abstract
:
1. Introduction
2. Materials and Methods
2.1. Chemicals and Reagents
2.2. Cell Culture and Culture Conditions
2.3. Reverse Transcription Polymerase Chain Reaction (RT-PCR) and Real-Time Quantitative Polymerase Chain Reaction (RT-qPCR)
2.4. Western Blot Analysis
2.5. ELISA (Enzyme-Linked Immunosorbent Assay) of IL-8 Secretion
2.6. Measurement of Intracellular H2O2
2.7. NADPH Oxidase Activity Assay
2.8. Transient Transfection of Plasmid and Measurement of Promoter Luciferase Activity
2.9. siRNA(Small Interfering RNA)) Transfection
2.10. Angiogenesis Assay
2.11. Statistical Analysis
3. Results
3.1. Lithocholic Acid (LCA) Stimulates Interleukin-8 (IL-8) Expression in HCT-116 Cells
3.2. Piperine Inhibits LCA-Stimulated IL-8 Upregulation in HCT-116 Cells
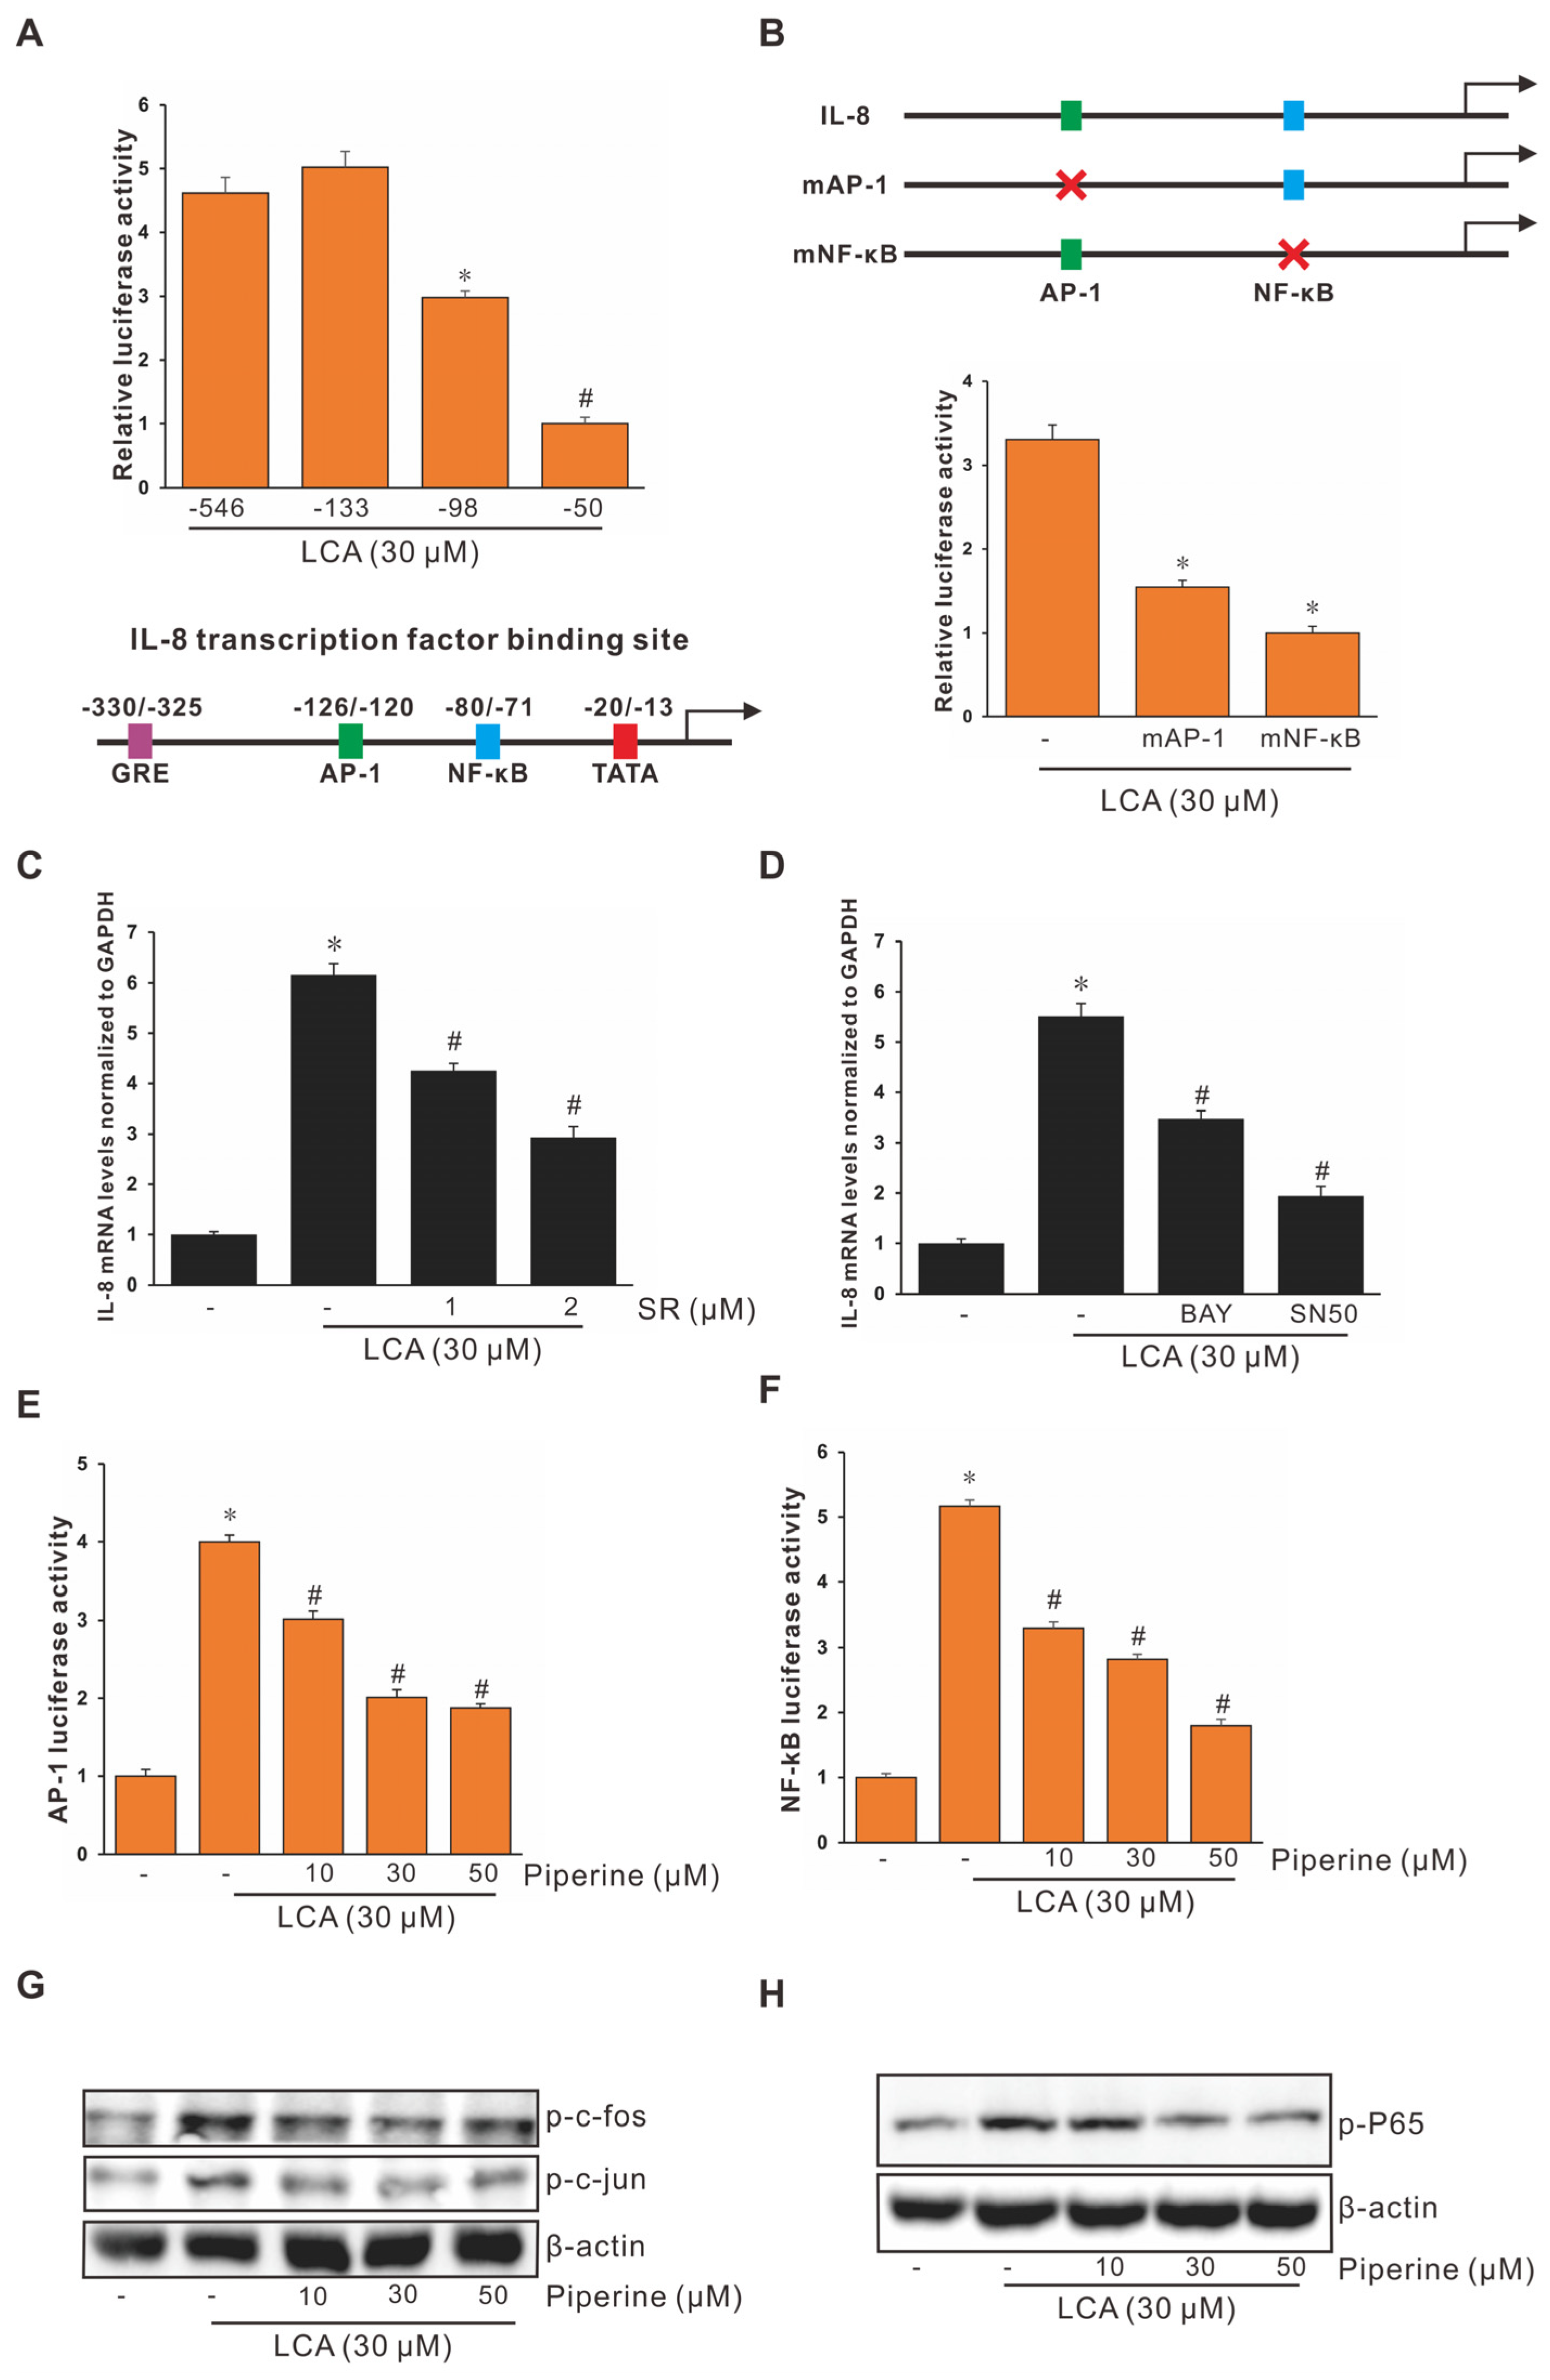
3.3. Role of Activating Protein-1 (AP-1) and Nuclear Factor Kappa B (NF-κB) in LCA-Stimulated IL-8 Promoter Activity in Human CRC Cells
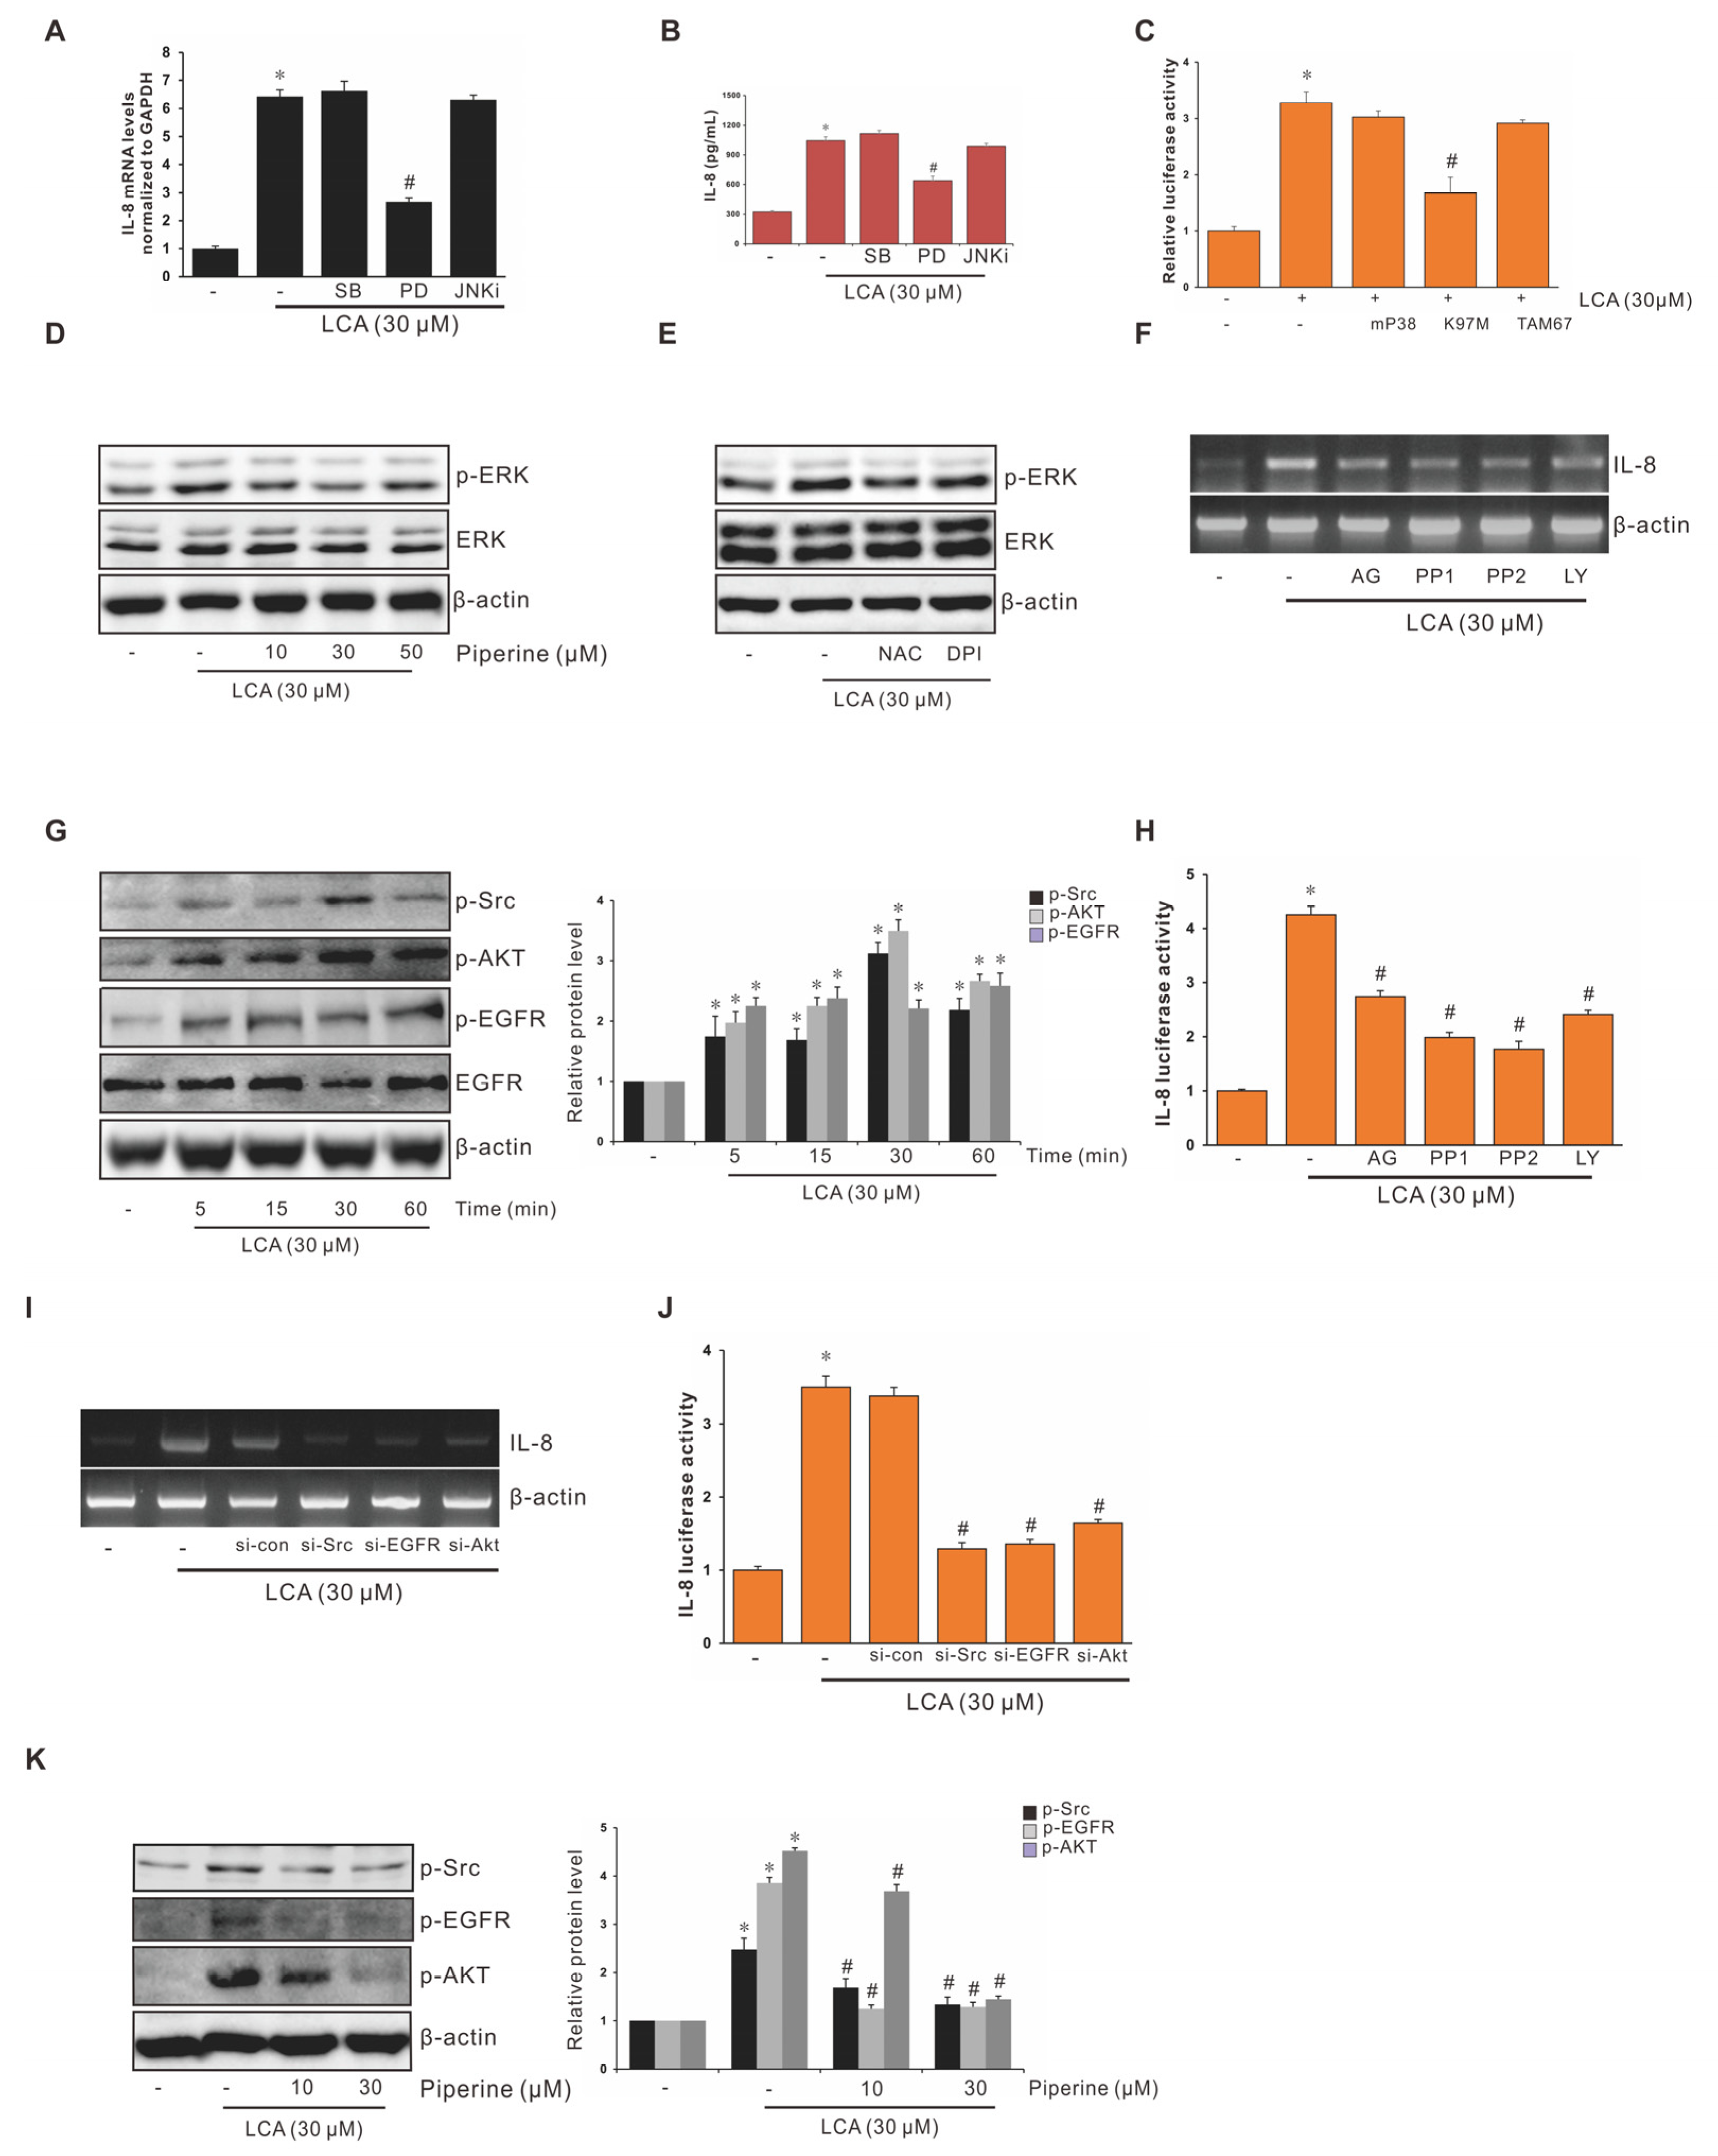
3.4. Role of ERK1/2 in Suppression of LCA-Stimulated IL-8 Expression by Piperine in Human CRC Cells
3.5. Role of EGFR, Src, and AKT in Suppression of LCA-Stimulated Interleukin-8 (IL-8) Expression by Piperine in Human CRC Cells
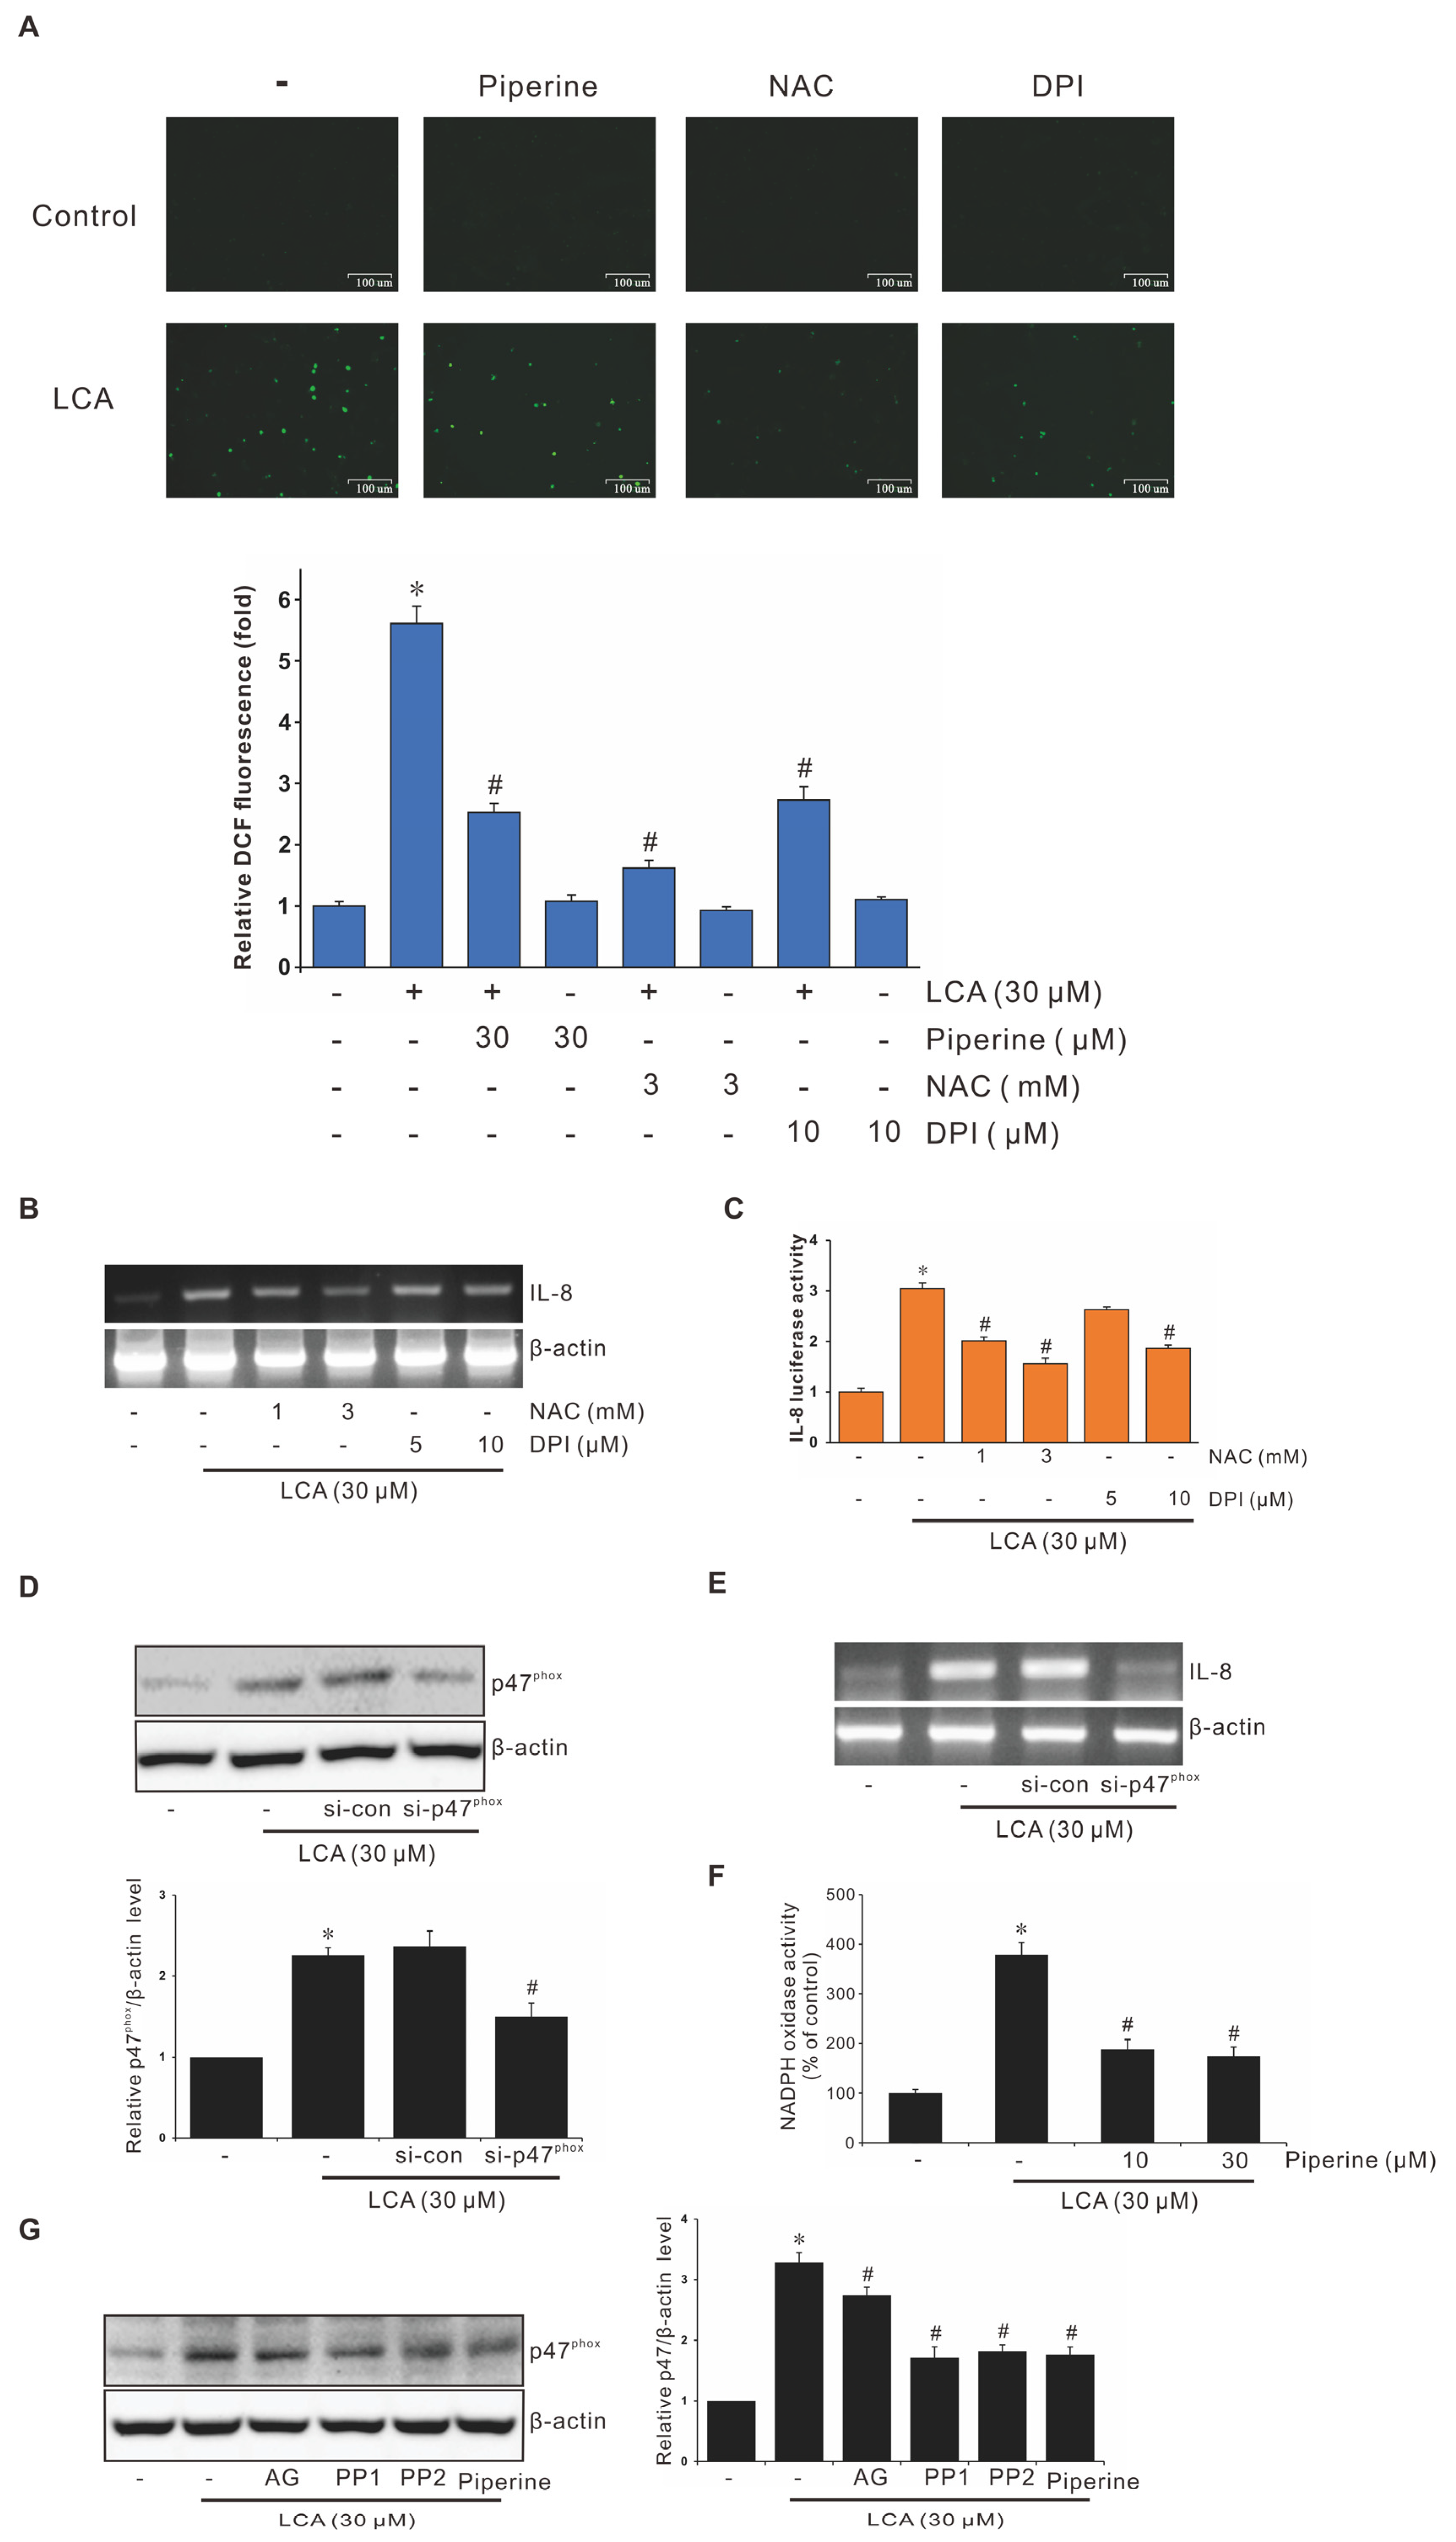
3.6. Role of NADPH Oxidase-Derived ROS in Suppression of LCA-Stimulated IL-8 Expression by Piperine
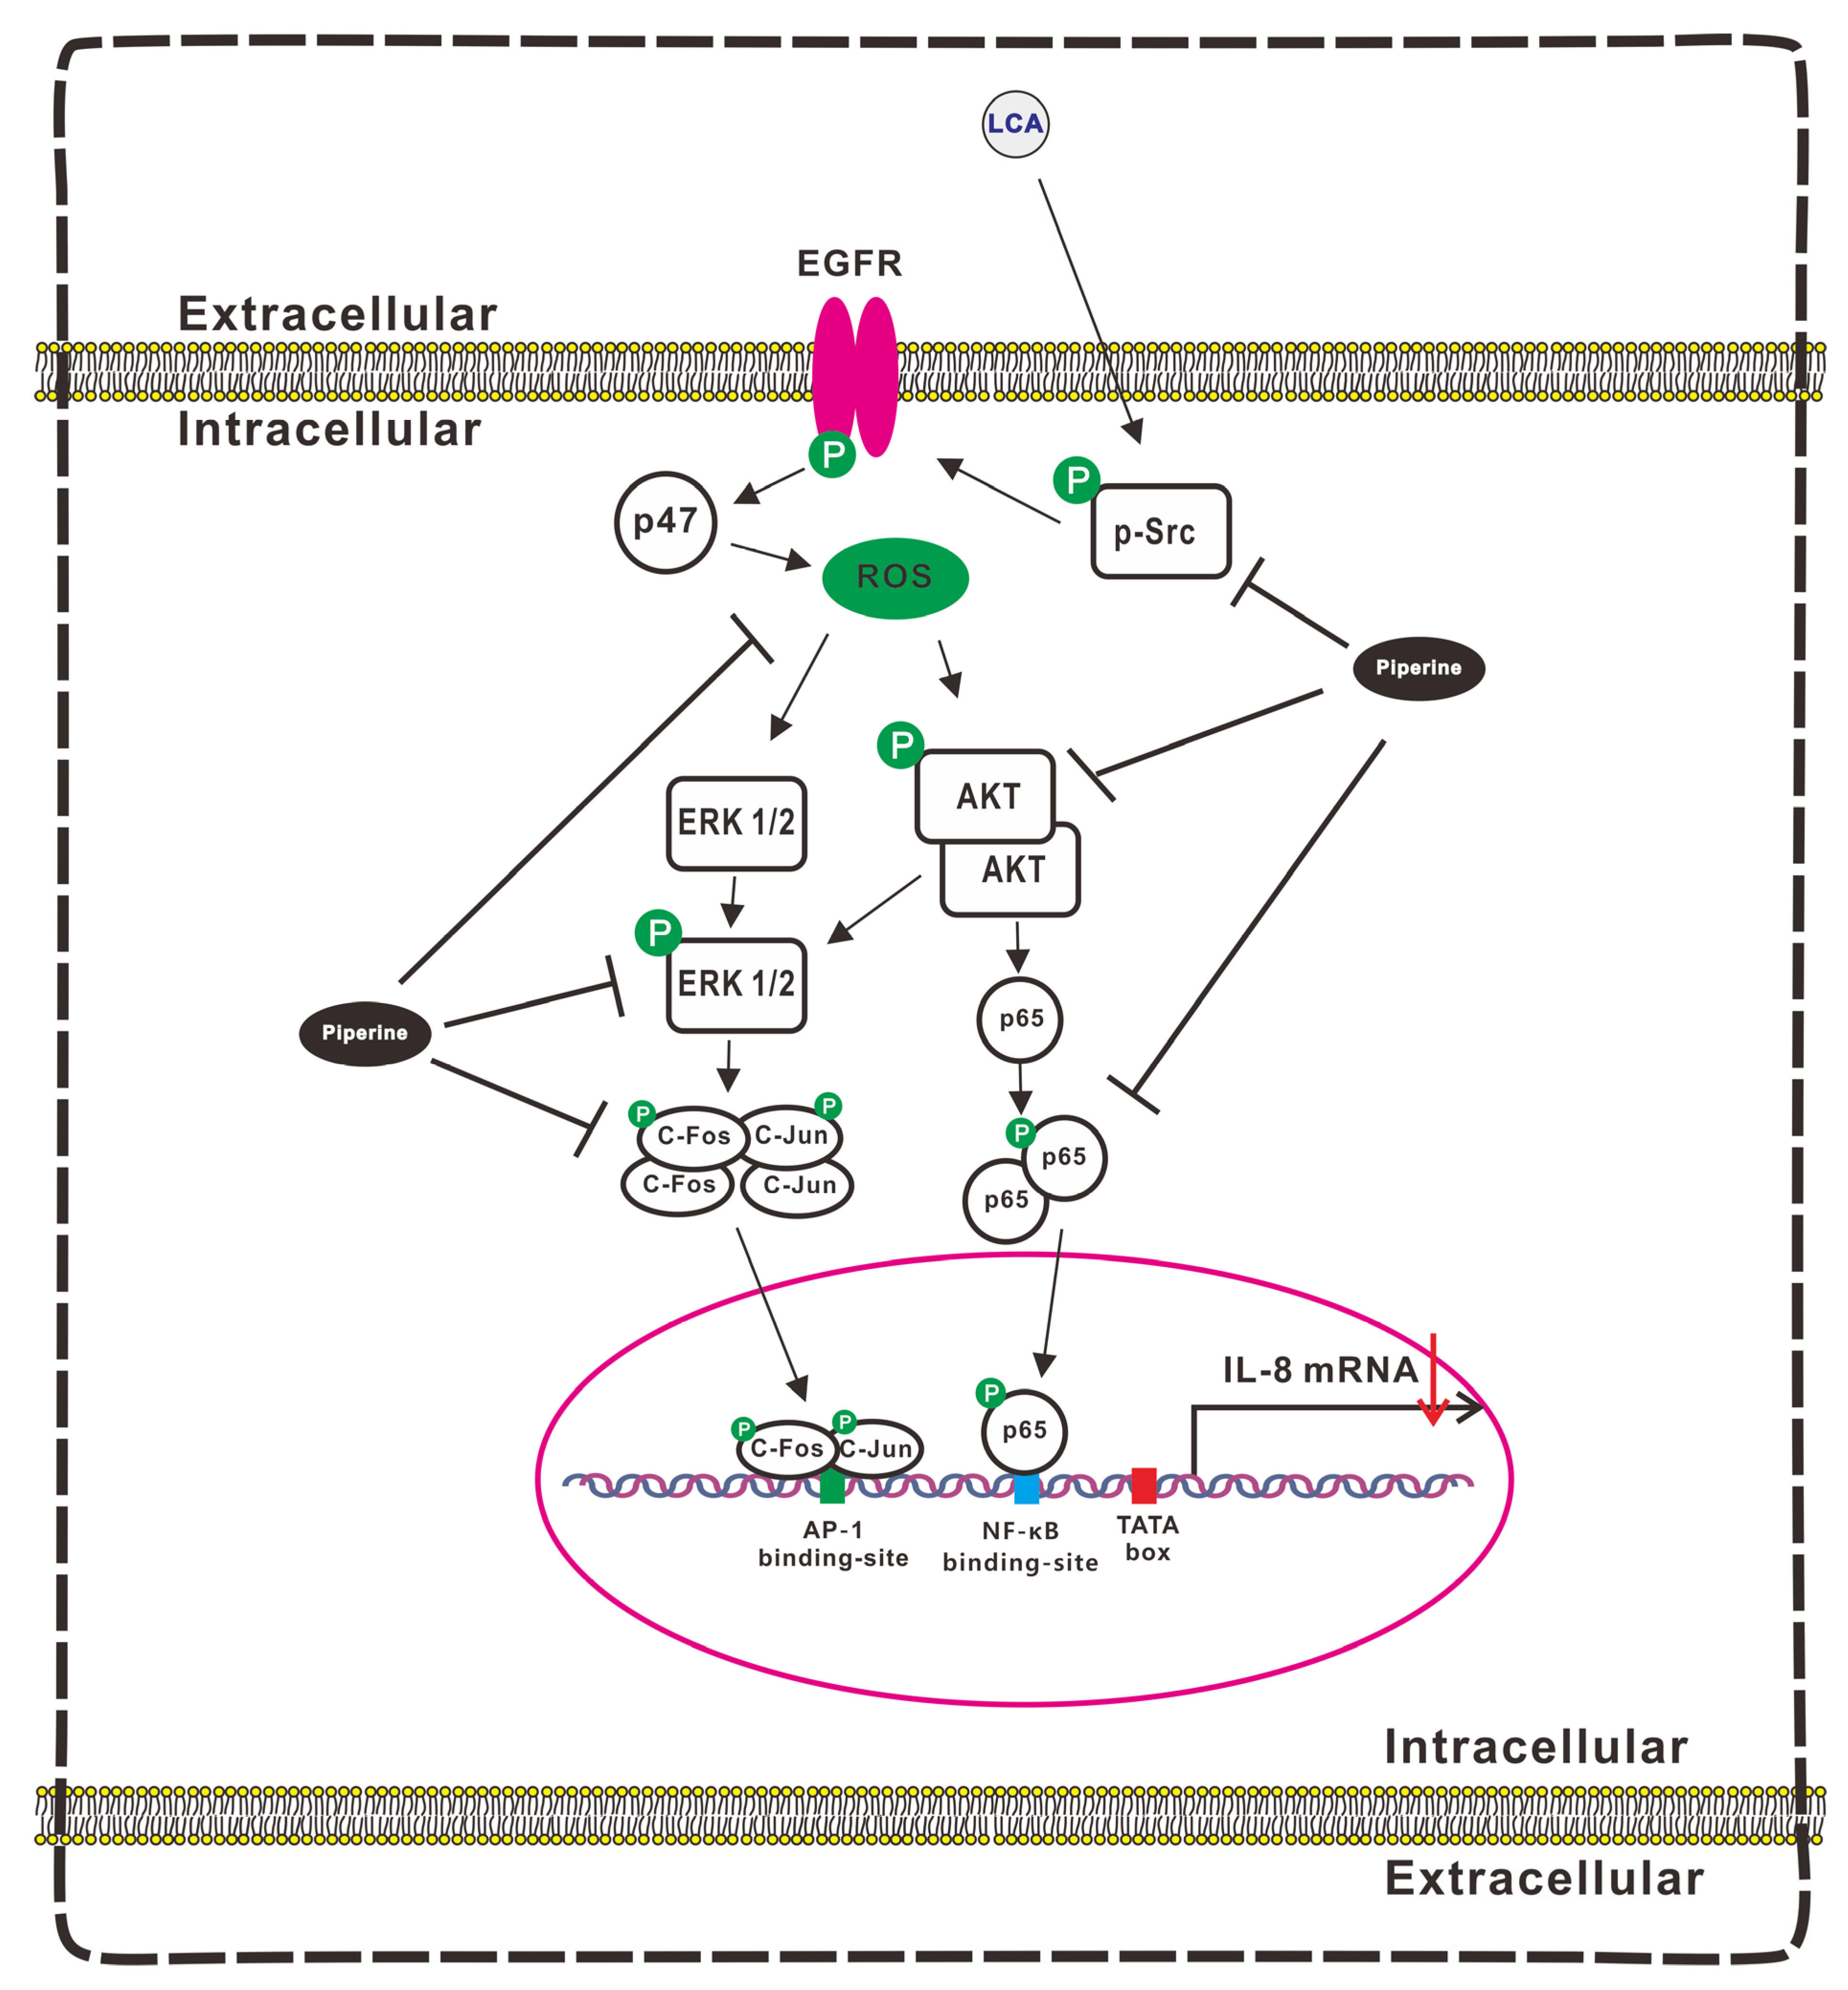
3.7. Signaling Pathways Involvement in Suppression of LCA-Induced IL-8 Expression by Piperine
3.8. Piperine Attenuates the Conditioned Medium (CM) Dervied from LCA-Treated CRC-Induced Angiogenesis
4. Discussion
5. Conclusions
Author Contributions
Funding
Institutional Review Board Statement
Informed Consent Statement
Data Availability Statement
Conflicts of Interest
References
- De Palma, M.; Biziato, D.; Petrova, T.V. Microenvironmental regulation of tumour angiogenesis. Nat. Rev. Cancer 2017, 17, 457–474. [Google Scholar] [CrossRef] [PubMed]
- Bielenberg, D.R.; Zetter, B.R. The Contribution of Angiogenesis to the Process of Metastasis. Cancer J. 2015, 21, 267–273. [Google Scholar] [CrossRef] [PubMed] [Green Version]
- Ziyad, S.; Iruela-Arispe, M.L. Molecular mechanisms of tumor angiogenesis. Genes Cancer 2011, 2, 1085–1096. [Google Scholar] [CrossRef] [PubMed] [Green Version]
- Lugano, R.; Ramachandran, M.; Dimberg, A. Tumor angiogenesis: Causes, consequences, challenges and opportunities. Cell. Mol. Life Sci. 2020, 77, 1745–1770. [Google Scholar] [CrossRef] [PubMed] [Green Version]
- Hwang, Y.S.; Jeong, M.; Park, J.S.; Kim, M.H.; Lee, D.B.; Shin, B.A.; Mukaida, N.; Ellis, L.M.; Kim, H.R.; Ahn, B.W.; et al. Interleukin-1beta stimulates IL-8 expression through MAP kinase and ROS signaling in human gastric carcinoma cells. Oncogene 2004, 23, 6603–6611. [Google Scholar] [CrossRef] [PubMed] [Green Version]
- Nguyen, T.T.; Lian, S.; Ung, T.T.; Xia, Y.; Han, J.Y.; Jung, Y.D. Lithocholic Acid Stimulates IL-8 Expression in Human Colorectal Cancer Cells Via Activation of Erk1/2 MAPK and Suppression of STAT3 Activity. J. Cell. Biochem. 2017, 118, 2958–2967. [Google Scholar] [CrossRef] [PubMed]
- Rubie, C.; Frick, V.O.; Pfeil, S.; Wagner, M.; Kollmar, O.; Kopp, B.; Graber, S.; Rau, B.M.; Schilling, M.K. Correlation of IL-8 with induction, progression and metastatic potential of colorectal cancer. World J. Gastroenterol. 2007, 13, 4996–5002. [Google Scholar] [CrossRef] [PubMed]
- Nguyen, T.T.; Ung, T.T.; Li, S.; Lian, S.; Xia, Y.; Park, S.Y.; Do Jung, Y. Metformin inhibits lithocholic acid-induced interleukin 8 upregulation in colorectal cancer cells by suppressing ROS production and NF-kB activity. Sci. Rep. 2019, 9, 2003. [Google Scholar] [CrossRef] [PubMed] [Green Version]
- Zeng, Y.; Yang, Y. Piperine depresses the migration progression via downregulating the Akt/mTOR/MMP9 signaling pathway in DU145 cells. Mol. Med. Rep. 2018, 17, 6363–6370. [Google Scholar] [CrossRef] [PubMed] [Green Version]
- Doucette, C.D.; Hilchie, A.L.; Liwski, R.; Hoskin, D.W. Piperine, a dietary phytochemical, inhibits angiogenesis. J. Nutr. Biochem. 2013, 24, 231–239. [Google Scholar] [CrossRef] [Green Version]
- Xia, Y.; Khoi, P.N.; Yoon, H.J.; Lian, S.; Joo, Y.E.; Chay, K.O.; Kim, K.K.; Jung, Y.D. Piperine inhibits IL-1beta-induced IL-6 expression by suppressing p38 MAPK and STAT3 activation in gastric cancer cells. Mol. Cell. Biochem. 2015, 398, 147–156. [Google Scholar] [CrossRef] [PubMed]
- Lian, S.; Xia, Y.; Ung, T.T.; Khoi, P.N.; Yoon, H.J.; Kim, N.H.; Kim, K.K.; Jung, Y.D. Carbon monoxide releasing molecule-2 ameliorates IL-1beta-induced IL-8 in human gastric cancer cells. Toxicology 2016, 361–362, 24–38. [Google Scholar] [CrossRef] [PubMed]
- Xia, Y.; Lian, S.; Khoi, P.N.; Yoon, H.J.; Han, J.Y.; Chay, K.O.; Kim, K.K.; Jung, Y.D. Chrysin inhibits cell invasion by inhibition of Recepteur d’origine Nantais via suppressing early growth response-1 and NF-kappaB transcription factor activities in gastric cancer cells. Int. J. Oncol. 2015, 46, 1835–1843. [Google Scholar] [CrossRef] [PubMed] [Green Version]
- Lian, S.; Li, S.; Zhu, J.; Xia, Y.; Do Jung, Y. Nicotine stimulates IL-8 expression via ROS/NF-kappaB and ROS/MAPK/AP-1 axis in human gastric cancer cells. Toxicology 2022, 466, 153062. [Google Scholar] [CrossRef] [PubMed]
- Ung, T.T.; Nguyen, T.T.; Li, S.; Han, J.Y.; Jung, Y.D. Nicotine stimulates CYP1A1 expression in human hepatocellular carcinoma cells via AP-1, NF-kappaB, and AhR. Toxicol. Lett. 2021, 349, 155–164. [Google Scholar] [CrossRef] [PubMed]
- Khoi, P.N.; Park, J.S.; Kim, N.H.; Jung, Y.D. Nicotine stimulates urokinase-type plasminogen activator receptor expression and cell invasiveness through mitogen-activated protein kinase and reactive oxygen species signaling in ECV304 endothelial cells. Toxicol. Appl. Pharmacol. 2012, 259, 248–256. [Google Scholar] [CrossRef] [PubMed]
- Xia, Y.; Yuan, M.; Li, S.; Thuan, U.T.; Nguyen, T.T.; Kang, T.W.; Liao, W.; Lian, S.; Jung, Y.D. Apigenin Suppresses the IL-1beta-Induced Expression of the Urokinase-Type Plasminogen Activator Receptor by Inhibiting MAPK-Mediated AP-1 and NF-kappaB Signaling in Human Bladder Cancer T24 Cells. J. Agric. Food Chem. 2018, 66, 7663–7673. [Google Scholar] [CrossRef] [PubMed]
- Rehman, M.U.; Rashid, S.; Arafah, A.; Qamar, W.; Alsaffar, R.M.; Ahmad, A.; Almatroudi, N.M.; Alqahtani, S.M.A.; Rashid, S.M.; Ahmad, S.B. Piperine Regulates Nrf-2/Keap-1 Signalling and Exhibits Anticancer Effect in Experimental Colon Carcinogenesis in Wistar Rats. Biology 2020, 9, 302. [Google Scholar] [CrossRef]
- Liang, Y.D.; Bai, W.J.; Li, C.G.; Xu, L.H.; Wei, H.X.; Pan, H.; He, X.H.; Ouyang, D.Y. Piperine Suppresses Pyroptosis and Interleukin-1beta Release upon ATP Triggering and Bacterial Infection. Front. Pharmacol. 2016, 7, 390. [Google Scholar] [CrossRef] [Green Version]
- Jaisin, Y.; Ratanachamnong, P.; Wongsawatkul, O.; Watthammawut, A.; Malaniyom, K.; Natewong, S. Antioxidant and anti-inflammatory effects of piperine on UV-B-irradiated human HaCaT keratinocyte cells. Life Sci. 2020, 263, 118607. [Google Scholar] [CrossRef]
- Chuchawankul, S.; Khorana, N.; Poovorawan, Y. Piperine inhibits cytokine production by human peripheral blood mononuclear cells. Genet. Mol. Res. 2012, 11, 617–627. [Google Scholar] [CrossRef] [PubMed]
- Nguyen, T.T.; Ung, T.T.; Kim, N.H.; Jung, Y.D. Role of bile acids in colon carcinogenesis. World J. Clin. Cases 2018, 6, 577–588. [Google Scholar] [CrossRef] [PubMed]
- Kozoni, V.; Tsioulias, G.; Shiff, S.; Rigas, B. The effect of lithocholic acid on proliferation and apoptosis during the early stages of colon carcinogenesis: Differential effect on apoptosis in the presence of a colon carcinogen. Carcinogenesis 2000, 21, 999–1005. [Google Scholar] [CrossRef] [PubMed]
- Debruyne, P.R.; Bruyneel, E.A.; Karaguni, I.M.; Li, X.; Flatau, G.; Muller, O.; Zimber, A.; Gespach, C.; Mareel, M.M. Bile acids stimulate invasion and haptotaxis in human colorectal cancer cells through activation of multiple oncogenic signaling pathways. Oncogene 2002, 21, 6740–6750. [Google Scholar] [CrossRef] [PubMed] [Green Version]
- Baek, M.K.; Park, J.S.; Park, J.H.; Kim, M.H.; Kim, H.D.; Bae, W.K.; Chung, I.J.; Shin, B.A.; Jung, Y.D. Lithocholic acid upregulates uPAR and cell invasiveness via MAPK and AP-1 signaling in colon cancer cells. Cancer Lett. 2010, 290, 123–128. [Google Scholar] [CrossRef] [PubMed]
- de Almeida, G.C.; Oliveira, L.F.S.; Predes, D.; Fokoue, H.H.; Kuster, R.M.; Oliveira, F.L.; Mendes, F.A.; Abreu, J.G. Piperine suppresses the Wnt/beta-catenin pathway and has anti-cancer effects on colorectal cancer cells. Sci. Rep. 2020, 10, 11681. [Google Scholar] [CrossRef] [PubMed]
- Hou, X.F.; Pan, H.; Xu, L.H.; Zha, Q.B.; He, X.H.; Ouyang, D.Y. Piperine Suppresses the Expression of CXCL8 in Lipopolysaccharide-Activated SW480 and HT-29 Cells via Downregulating the Mitogen-Activated Protein Kinase Pathways. Inflammation 2015, 38, 1093–1102. [Google Scholar] [CrossRef] [PubMed]
- Kopetz, S. Targeting SRC and epidermal growth factor receptor in colorectal cancer: Rationale and progress into the clinic. Gastrointest. Cancer Res. 2007, 1, S37–S41. [Google Scholar] [PubMed]
- Sasaki, T.; Hiroki, K.; Yamashita, Y. The role of epidermal growth factor receptor in cancer metastasis and microenvironment. Biomed. Res. Int. 2013, 2013, 546318. [Google Scholar] [CrossRef] [Green Version]
- Hurwitz, H.; Fehrenbacher, L.; Novotny, W.; Cartwright, T.; Hainsworth, J.; Heim, W.; Berlin, J.; Baron, A.; Griffing, S.; Holmgren, E.; et al. Bevacizumab plus irinotecan, fluorouracil, and leucovorin for metastatic colorectal cancer. N. Engl. J. Med. 2004, 350, 2335–2342. [Google Scholar] [CrossRef] [Green Version]
- Kumar, P.; Amin, M.A.; Harlow, L.A.; Polverini, P.J.; Koch, A.E. Src and phosphatidylinositol 3-kinase mediate soluble E-selectin-induced angiogenesis. Blood 2003, 101, 3960–3968. [Google Scholar] [CrossRef] [PubMed]
- Li, P.; Chen, D.; Cui, Y.; Zhang, W.; Weng, J.; Yu, L.; Chen, L.; Chen, Z.; Su, H.; Yu, S.; et al. Src Plays an Important Role in AGE-Induced Endothelial Cell Proliferation, Migration, and Tubulogenesis. Front. Physiol. 2018, 9, 765. [Google Scholar] [CrossRef] [PubMed]
- Yeh, M.; Gharavi, N.M.; Choi, J.; Hsieh, X.; Reed, E.; Mouillesseaux, K.P.; Cole, A.L.; Reddy, S.T.; Berliner, J.A. Oxidized phospholipids increase interleukin 8 (IL-8) synthesis by activation of the c-src/signal transducers and activators of transcription (STAT)3 pathway. J. Biol. Chem. 2004, 279, 30175–30181. [Google Scholar] [CrossRef] [PubMed] [Green Version]
- Lin, C.H.; Cheng, H.W.; Hsu, M.J.; Chen, M.C.; Lin, C.C.; Chen, B.C. c-Src mediates thrombin-induced NF-kappaB activation and IL-8/CXCL8 expression in lung epithelial cells. J. Immunol. 2006, 177, 3427–3438. [Google Scholar] [CrossRef] [PubMed] [Green Version]
- Eum, S.Y.; Rha, G.B.; Hennig, B.; Toborek, M. c-Src is the primary signaling mediator of polychlorinated biphenyl-induced interleukin-8 expression in a human microvascular endothelial cell line. Toxicol. Sci. 2006, 92, 311–320. [Google Scholar] [CrossRef] [PubMed] [Green Version]
- Appert-Collin, A.; Hubert, P.; Cremel, G.; Bennasroune, A. Role of ErbB Receptors in Cancer Cell Migration and Invasion. Front. Pharmacol. 2015, 6, 283. [Google Scholar] [CrossRef] [PubMed] [Green Version]
- Jin, X.; Yin, J.; Kim, S.H.; Sohn, Y.W.; Beck, S.; Lim, Y.C.; Nam, D.H.; Choi, Y.J.; Kim, H. EGFR-AKT-Smad signaling promotes formation of glioma stem-like cells and tumor angiogenesis by ID3-driven cytokine induction. Cancer Res. 2011, 71, 7125–7134. [Google Scholar] [CrossRef] [PubMed] [Green Version]
- Kelly, F.L.; Weinberg, K.E.; Nagler, A.E.; Nixon, A.B.; Star, M.D.; Todd, J.L.; Brass, D.M.; Palmer, S.M. EGFR-Dependent IL8 Production by Airway Epithelial Cells After Exposure to the Food Flavoring Chemical 2,3-Butanedione. Toxicol. Sci. 2019, 169, 534–542. [Google Scholar] [CrossRef] [PubMed]
- Ganesan, S.; Unger, B.L.; Comstock, A.T.; Angel, K.A.; Mancuso, P.; Martinez, F.J.; Sajjan, U.S. Aberrantly activated EGFR contributes to enhanced IL-8 expression in COPD airways epithelial cells via regulation of nuclear FoxO3A. Thorax 2013, 68, 131–141. [Google Scholar] [CrossRef] [PubMed] [Green Version]
- Sharma, R.; Quilty, F.; Gilmer, J.F.; Long, A.; Byrne, A.M. Unconjugated secondary bile acids activate the unfolded protein response and induce golgi fragmentation via a src-kinase-dependant mechanism. Oncotarget 2017, 8, 967–978. [Google Scholar] [CrossRef] [Green Version]
- Jean-Louis, S.; Akare, S.; Ali, M.A.; Mash, E.A., Jr.; Meuillet, E.; Martinez, J.D. Deoxycholic acid induces intracellular signaling through membrane perturbations. J. Biol. Chem. 2006, 281, 14948–14960. [Google Scholar] [CrossRef] [PubMed] [Green Version]
- Farhana, L.; Nangia-Makker, P.; Arbit, E.; Shango, K.; Sarkar, S.; Mahmud, H.; Hadden, T.; Yu, Y.; Majumdar, A.P. Bile acid: A potential inducer of colon cancer stem cells. Stem Cell Res. Ther. 2016, 7, 181. [Google Scholar] [CrossRef] [PubMed] [Green Version]
- Domingue, J.C.; Ao, M.; Sarathy, J.; Rao, M.C. Chenodeoxycholic acid requires activation of EGFR, EPAC, and Ca2+ to stimulate CFTR-dependent Cl- secretion in human colonic T84 cells. Am. J. Physiol. Cell Physiol. 2016, 311, C777–C792. [Google Scholar] [CrossRef] [PubMed] [Green Version]
- Liang, H.; Estes, M.K.; Zhang, H.; Du, G.; Zhou, Y. Bile acids target proteolipid nano-assemblies of EGFR and phosphatidic acid in the plasma membrane for stimulation of MAPK signaling. PLoS ONE 2018, 13, e0198983. [Google Scholar] [CrossRef] [PubMed] [Green Version]
- Dossa, A.Y.; Escobar, O.; Golden, J.; Frey, M.R.; Ford, H.R.; Gayer, C.P. Bile acids regulate intestinal cell proliferation by modulating EGFR and FXR signaling. Am. J. Physiol. Gastrointest. Liver Physiol. 2016, 310, G81–G92. [Google Scholar] [CrossRef] [PubMed] [Green Version]
- Lian, S.; Xia, Y.; Ung, T.T.; Khoi, P.N.; Yoon, H.J.; Lee, S.G.; Kim, K.K.; Jung, Y.D. Prostaglandin E2 stimulates urokinase-type plasminogen activator receptor via EP2 receptor-dependent signaling pathways in human AGS gastric cancer cells. Mol. Carcinog. 2017, 56, 664–680. [Google Scholar] [CrossRef] [PubMed]
- Ushio-Fukai, M.; Nakamura, Y. Reactive oxygen species and angiogenesis: NADPH oxidase as target for cancer therapy. Cancer Lett. 2008, 266, 37–52. [Google Scholar] [CrossRef] [Green Version]
- Li, S.; Ung, T.T.; Nguyen, T.T.; Sah, D.K.; Park, S.Y.; Jung, Y.D. Cholic Acid Stimulates MMP-9 in Human Colon Cancer Cells via Activation of MAPK, AP-1, and NF-kappaB Activity. Int. J. Mol. Sci. 2020, 21, 3420. [Google Scholar] [CrossRef]
- Xia, C.; Meng, Q.; Liu, L.Z.; Rojanasakul, Y.; Wang, X.R.; Jiang, B.H. Reactive oxygen species regulate angiogenesis and tumor growth through vascular endothelial growth factor. Cancer Res. 2007, 67, 10823–10830. [Google Scholar] [CrossRef] [Green Version]
- Yuan, M.; Meng, W.; Liao, W.; Lian, S. Andrographolide Antagonizes TNF-alpha-Induced IL-8 via Inhibition of NADPH Oxidase/ROS/NF-kappaB and Src/MAPKs/AP-1 Axis in Human Colorectal Cancer HCT116 Cells. J. Agric. Food Chem. 2018, 66, 5139–5148. [Google Scholar] [CrossRef]
- Lee, K.P.; Lee, K.; Park, W.H.; Kim, H.; Hong, H. Piperine inhibits platelet-derived growth factor-BB-induced proliferation and migration in vascular smooth muscle cells. J. Med. Food 2015, 18, 208–215. [Google Scholar] [CrossRef] [PubMed]
- Kim, J.; Lee, K.P.; Lee, D.W.; Lim, K. Piperine enhances carbohydrate/fat metabolism in skeletal muscle during acute exercise in mice. Nutr. Metab. 2017, 14, 43. [Google Scholar] [CrossRef] [PubMed]
- Gianni, D.; Taulet, N.; DerMardirossian, C.; Bokoch, G.M. c-Src-mediated phosphorylation of NoxA1 and Tks4 induces the reactive oxygen species (ROS)-dependent formation of functional invadopodia in human colon cancer cells. Mol. Biol. Cell 2010, 21, 4287–4298. [Google Scholar] [CrossRef] [PubMed] [Green Version]
- Khoi, P.N.; Park, J.S.; Kim, J.H.; Xia, Y.; Kim, N.H.; Kim, K.K.; Jung, Y.D. (-)-Epigallocatechin-3-gallate blocks nicotine-induced matrix metalloproteinase-9 expression and invasiveness via suppression of NF-kappaB and AP-1 in endothelial cells. Int. J. Oncol. 2013, 43, 868–876. [Google Scholar] [CrossRef] [PubMed]
- Mook, O.R.; Frederiks, W.M.; Van Noorden, C.J. The role of gelatinases in colorectal cancer progression and metastasis. Biochim. Biophys. Acta 2004, 1705, 69–89. [Google Scholar] [CrossRef]
- Angel, P.; Karin, M. The role of Jun, Fos and the AP-1 complex in cell-proliferation and transformation. Biochim. Biophys. Acta 1991, 1072, 129–157. [Google Scholar] [CrossRef]
- Ozanne, B.W.; Spence, H.J.; McGarry, L.C.; Hennigan, R.F. Transcription factors control invasion: AP-1 the first among equals. Oncogene 2007, 26, 1–10. [Google Scholar] [CrossRef] [Green Version]


Publisher’s Note: MDPI stays neutral with regard to jurisdictional claims in published maps and institutional affiliations. |
© 2022 by the authors. Licensee MDPI, Basel, Switzerland. This article is an open access article distributed under the terms and conditions of the Creative Commons Attribution (CC BY) license (https://creativecommons.org/licenses/by/4.0/).
Share and Cite
Li, S.; Nguyen, T.T.; Ung, T.T.; Sah, D.K.; Park, S.Y.; Lakshmanan, V.-K.; Jung, Y.D. Piperine Attenuates Lithocholic Acid-Stimulated Interleukin-8 by Suppressing Src/EGFR and Reactive Oxygen Species in Human Colorectal Cancer Cells. Antioxidants 2022, 11, 530. https://doi.org/10.3390/antiox11030530
Li S, Nguyen TT, Ung TT, Sah DK, Park SY, Lakshmanan V-K, Jung YD. Piperine Attenuates Lithocholic Acid-Stimulated Interleukin-8 by Suppressing Src/EGFR and Reactive Oxygen Species in Human Colorectal Cancer Cells. Antioxidants. 2022; 11(3):530. https://doi.org/10.3390/antiox11030530
Chicago/Turabian StyleLi, Shinan, Thi Thinh Nguyen, Trong Thuan Ung, Dhiraj Kumar Sah, Seon Young Park, Vinoth-Kumar Lakshmanan, and Young Do Jung. 2022. "Piperine Attenuates Lithocholic Acid-Stimulated Interleukin-8 by Suppressing Src/EGFR and Reactive Oxygen Species in Human Colorectal Cancer Cells" Antioxidants 11, no. 3: 530. https://doi.org/10.3390/antiox11030530