
Effects of Harvest Timing on Phytochemical Composition in Lamiaceae Plants under an Environment-Controlled System


Abstract
:1. Introduction
2. Materials and Methods
2.1. Cultivation of Plants
2.2. Sample Preparation
2.3. Analysis of Total Phenols
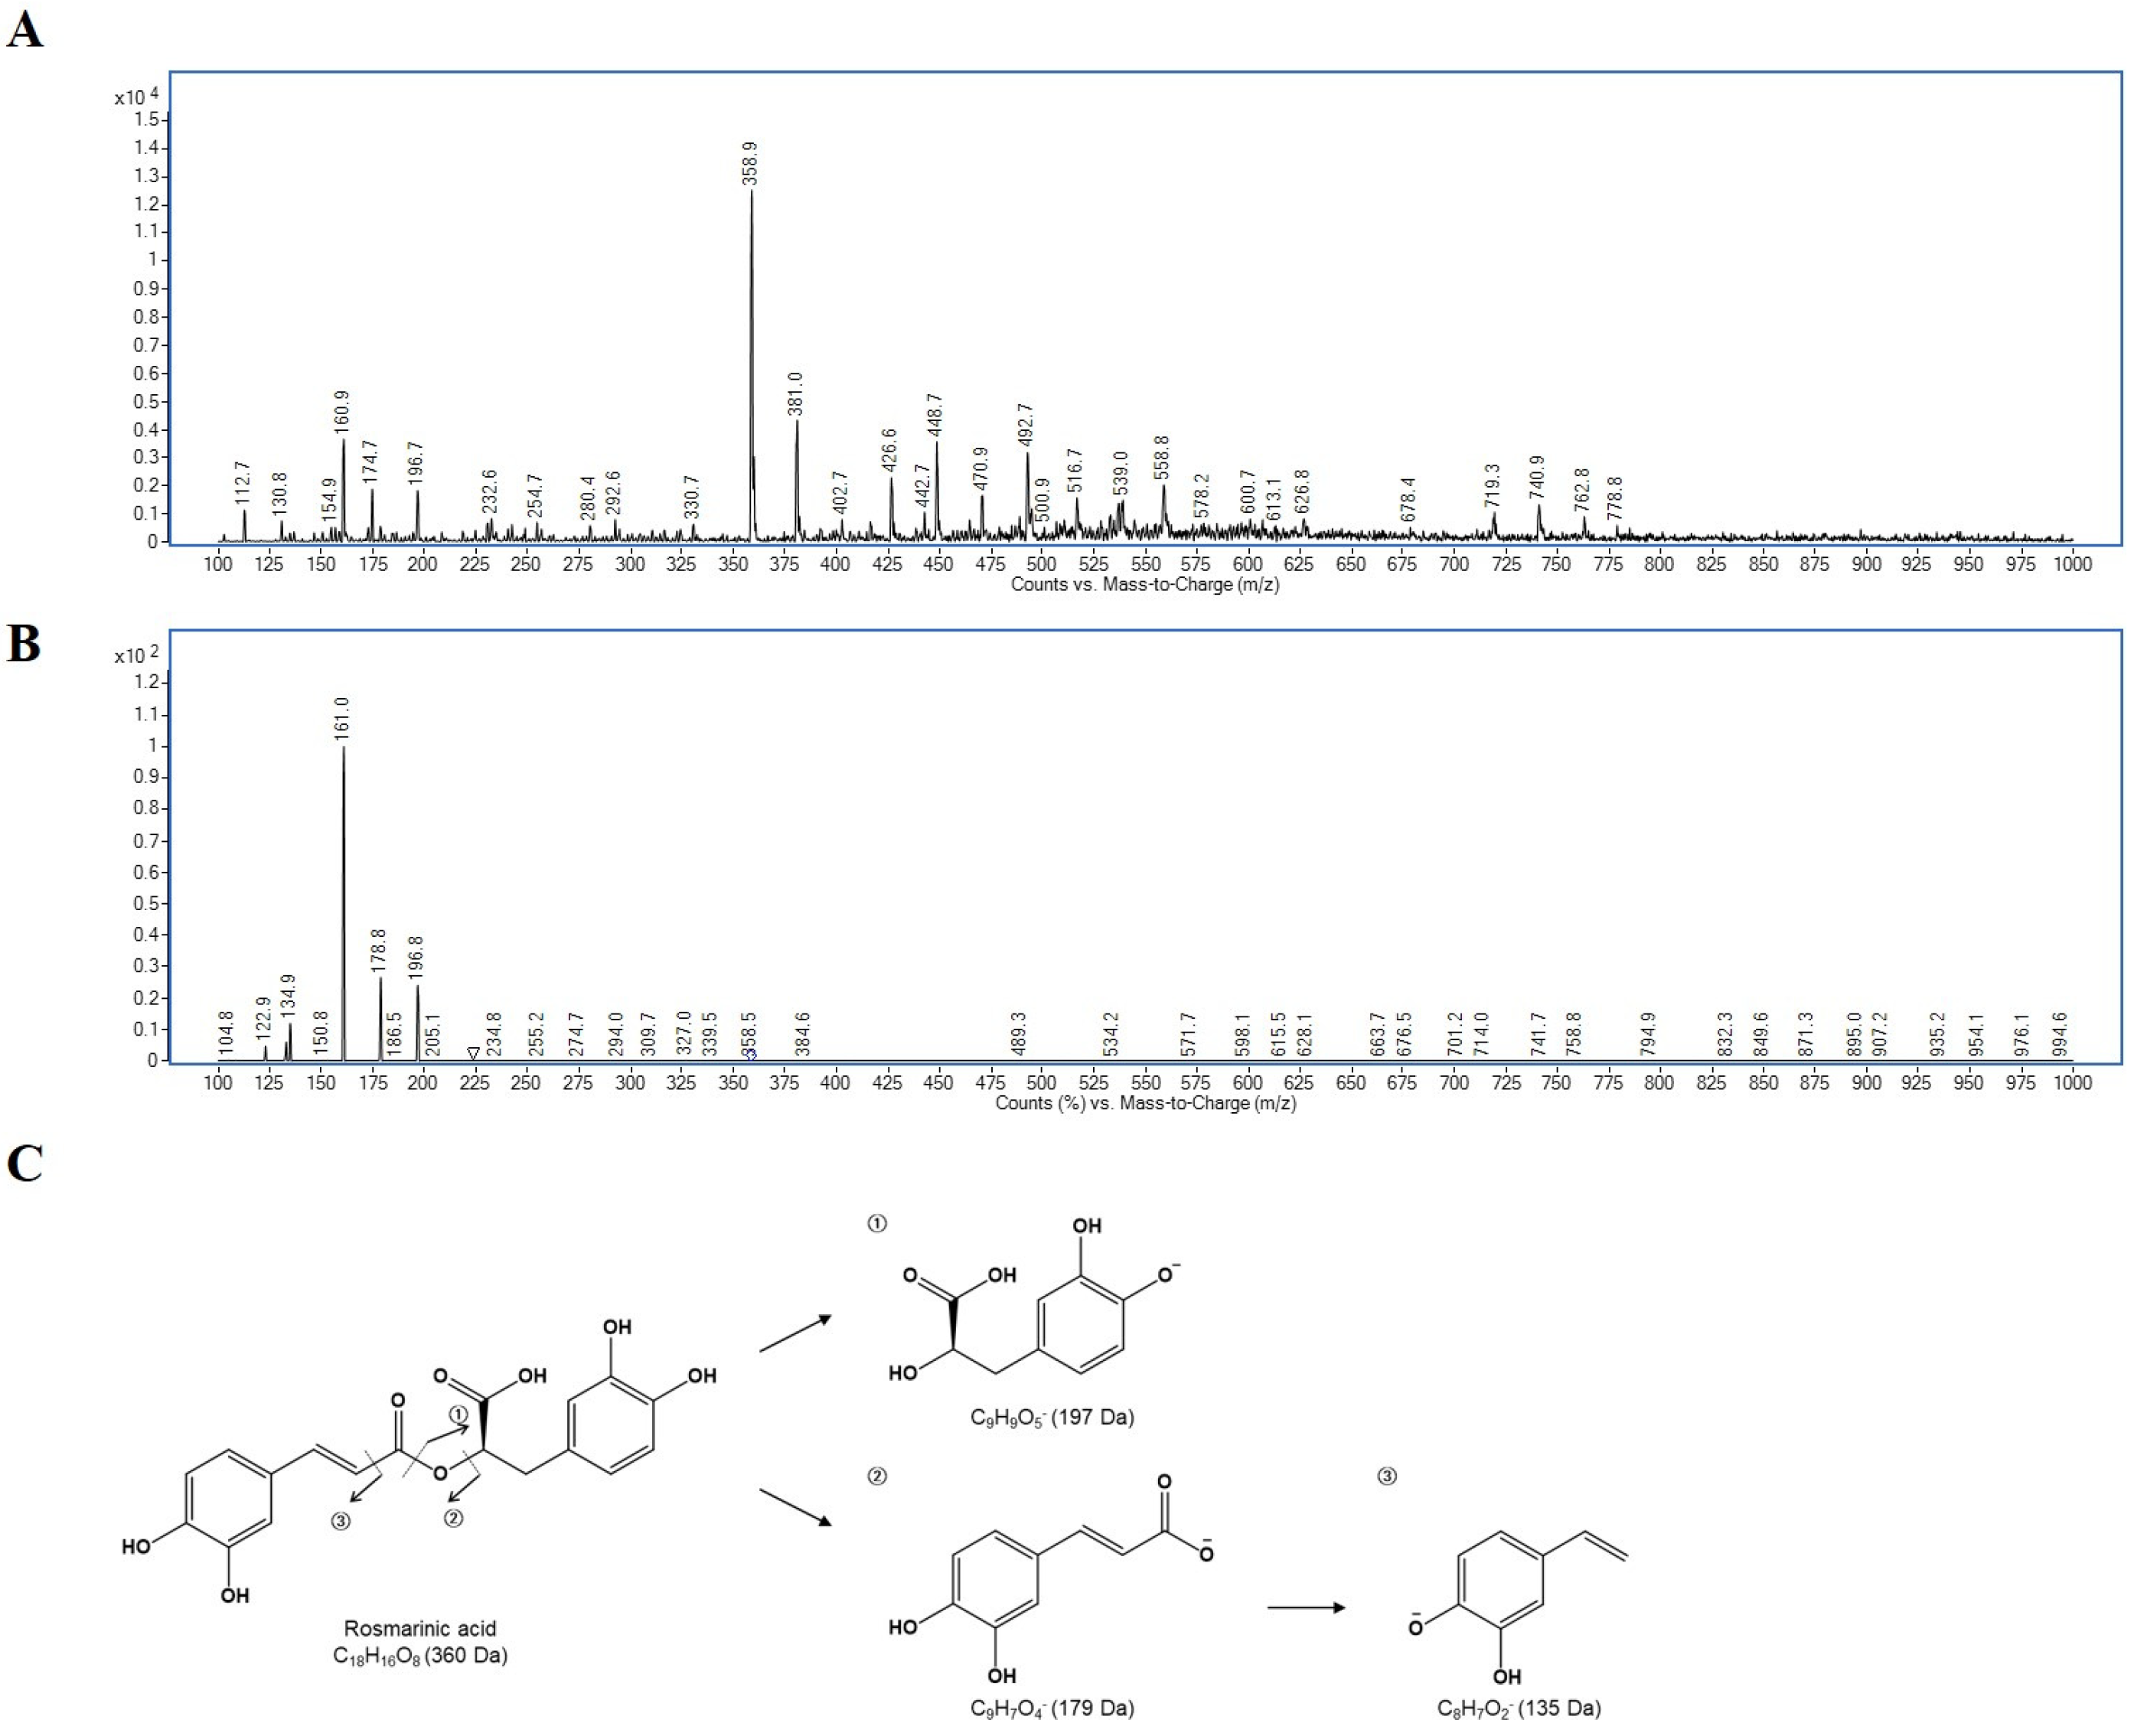
2.4. Identification of Rosmarinic Acid by Ultra-Performance Liquid Chromatography with Tandem MS (UPLC-MS/MS)
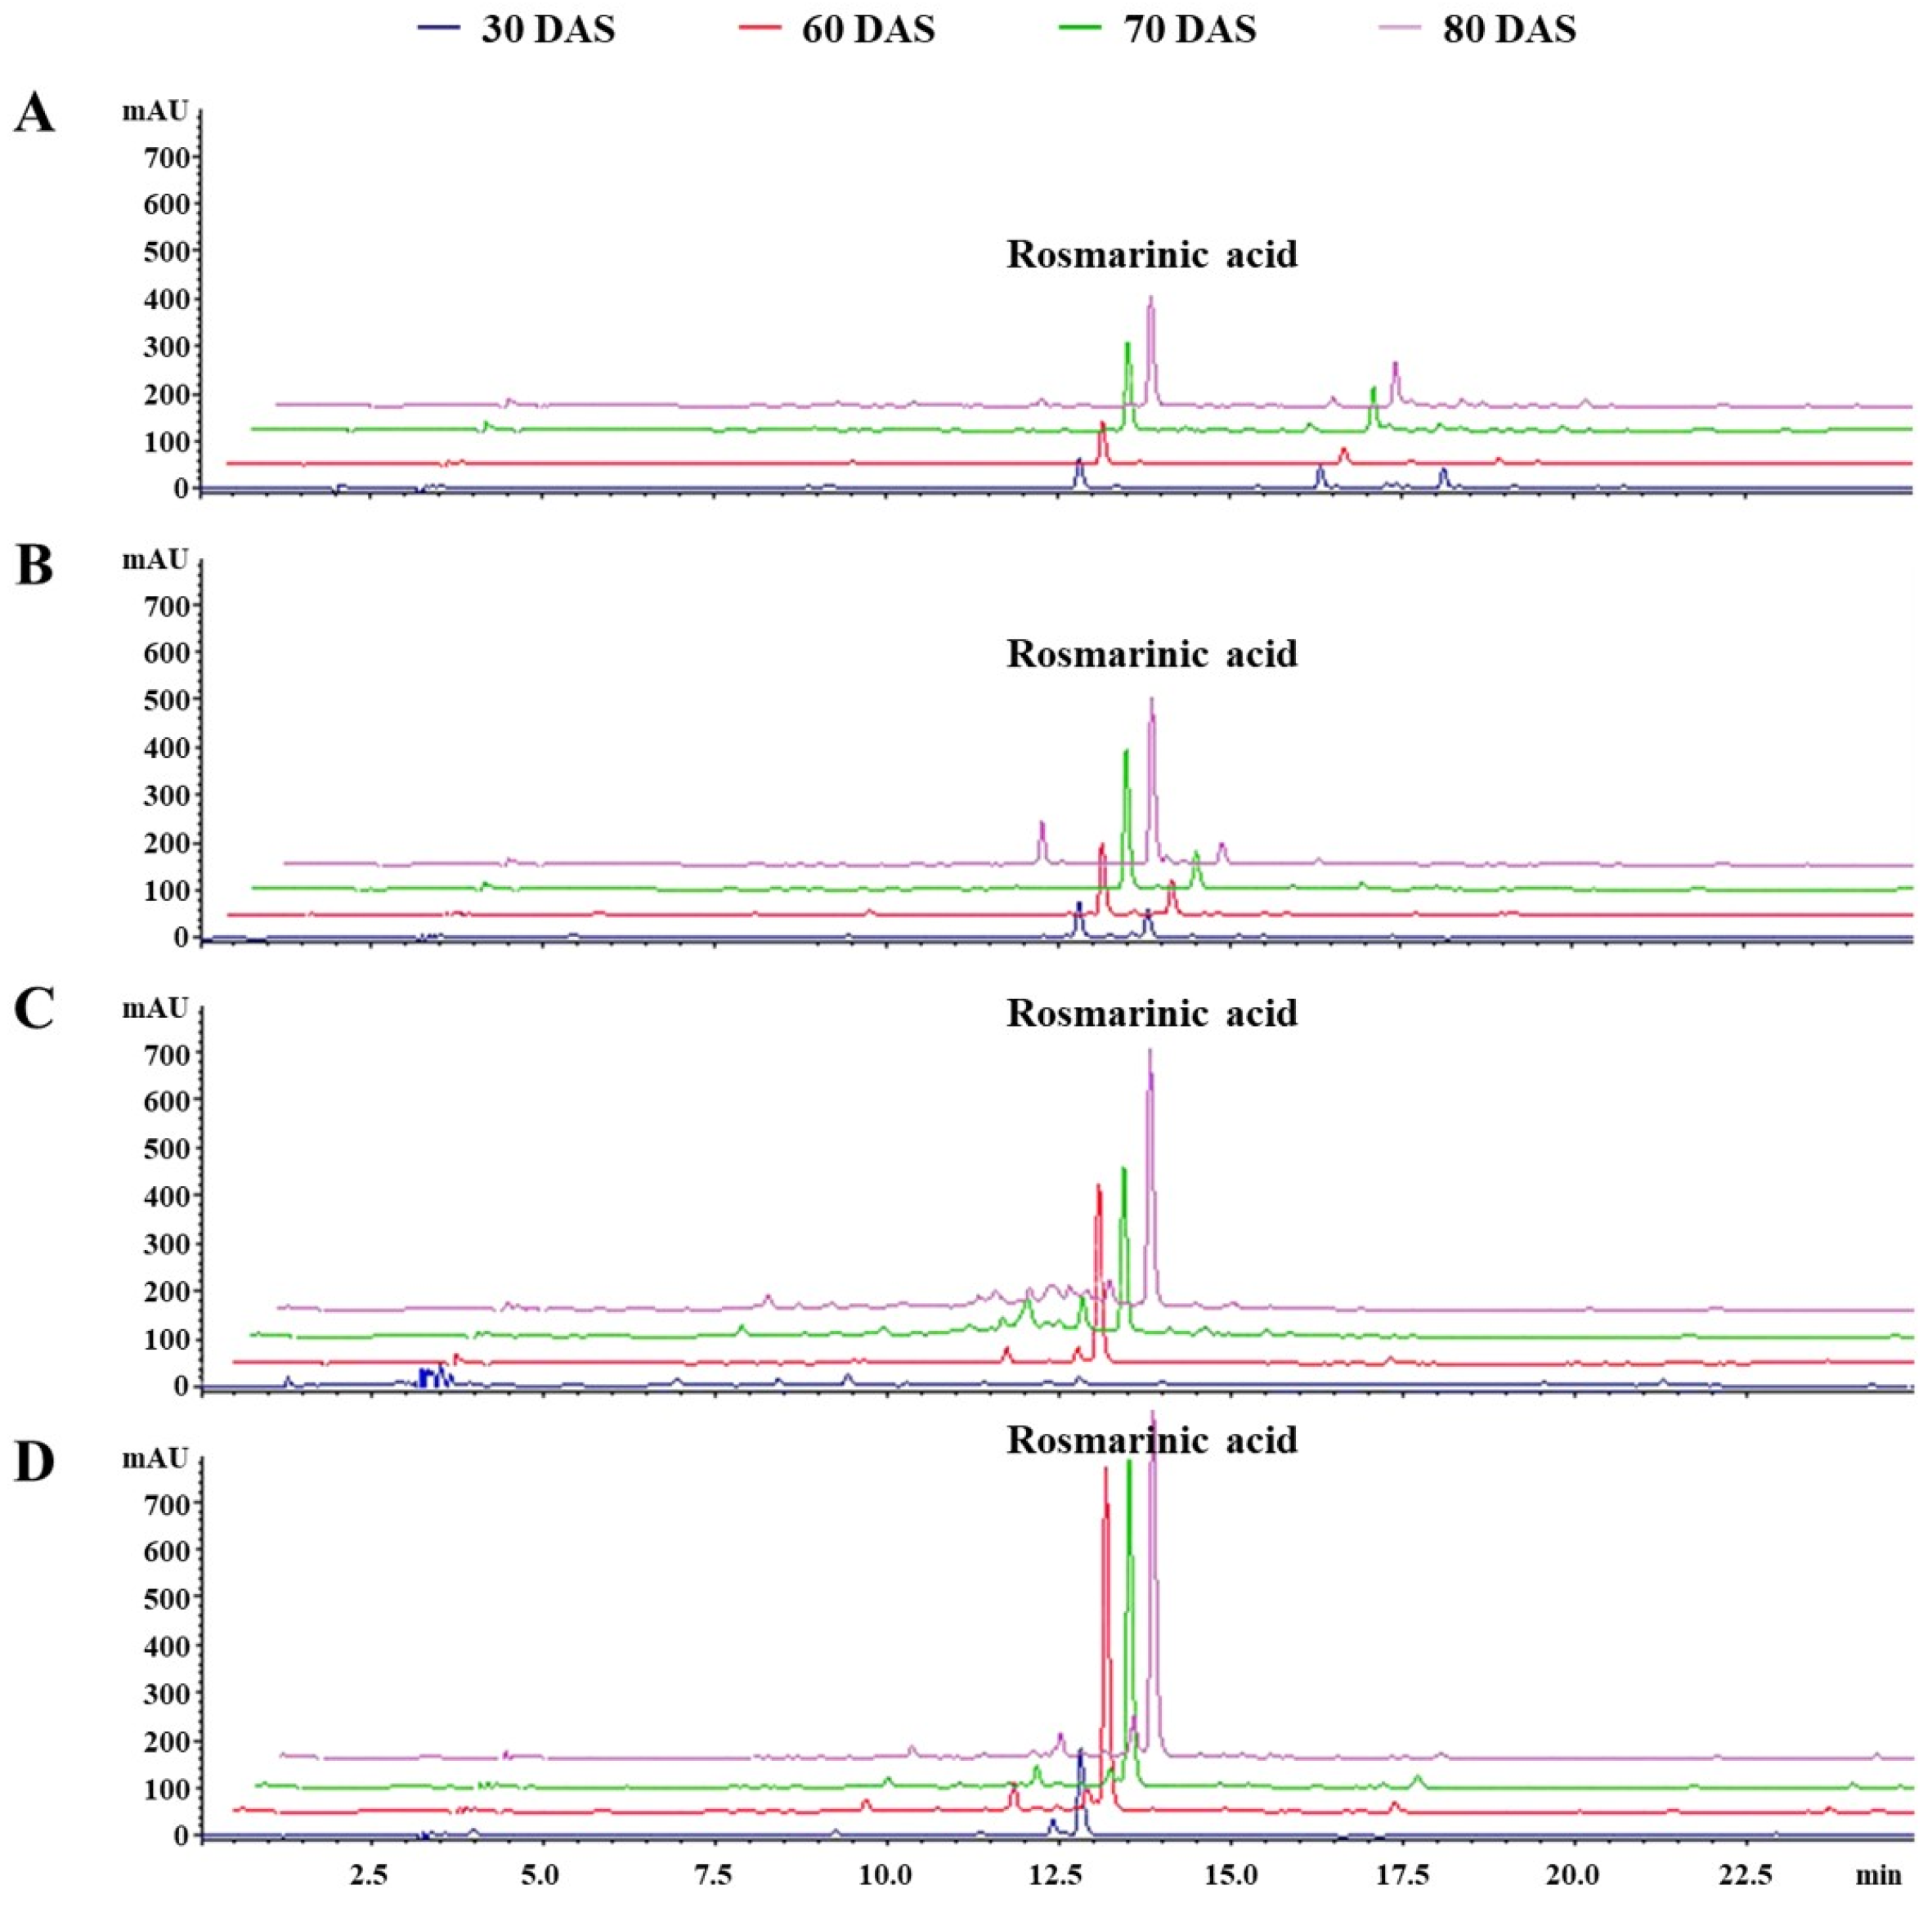
2.5. Quantitative Determination of Rosmarinic Acid
2.6. DPPH Radical Scavenging Activity
2.7. ABTS Radical Scavenging Activity
2.8. Analysis of VOCs Using Gas Chromatography Time-of-Flight Mass Spectrometry (GC-TOF-MS)
2.9. Statistical Analysis
3. Results and Discussion
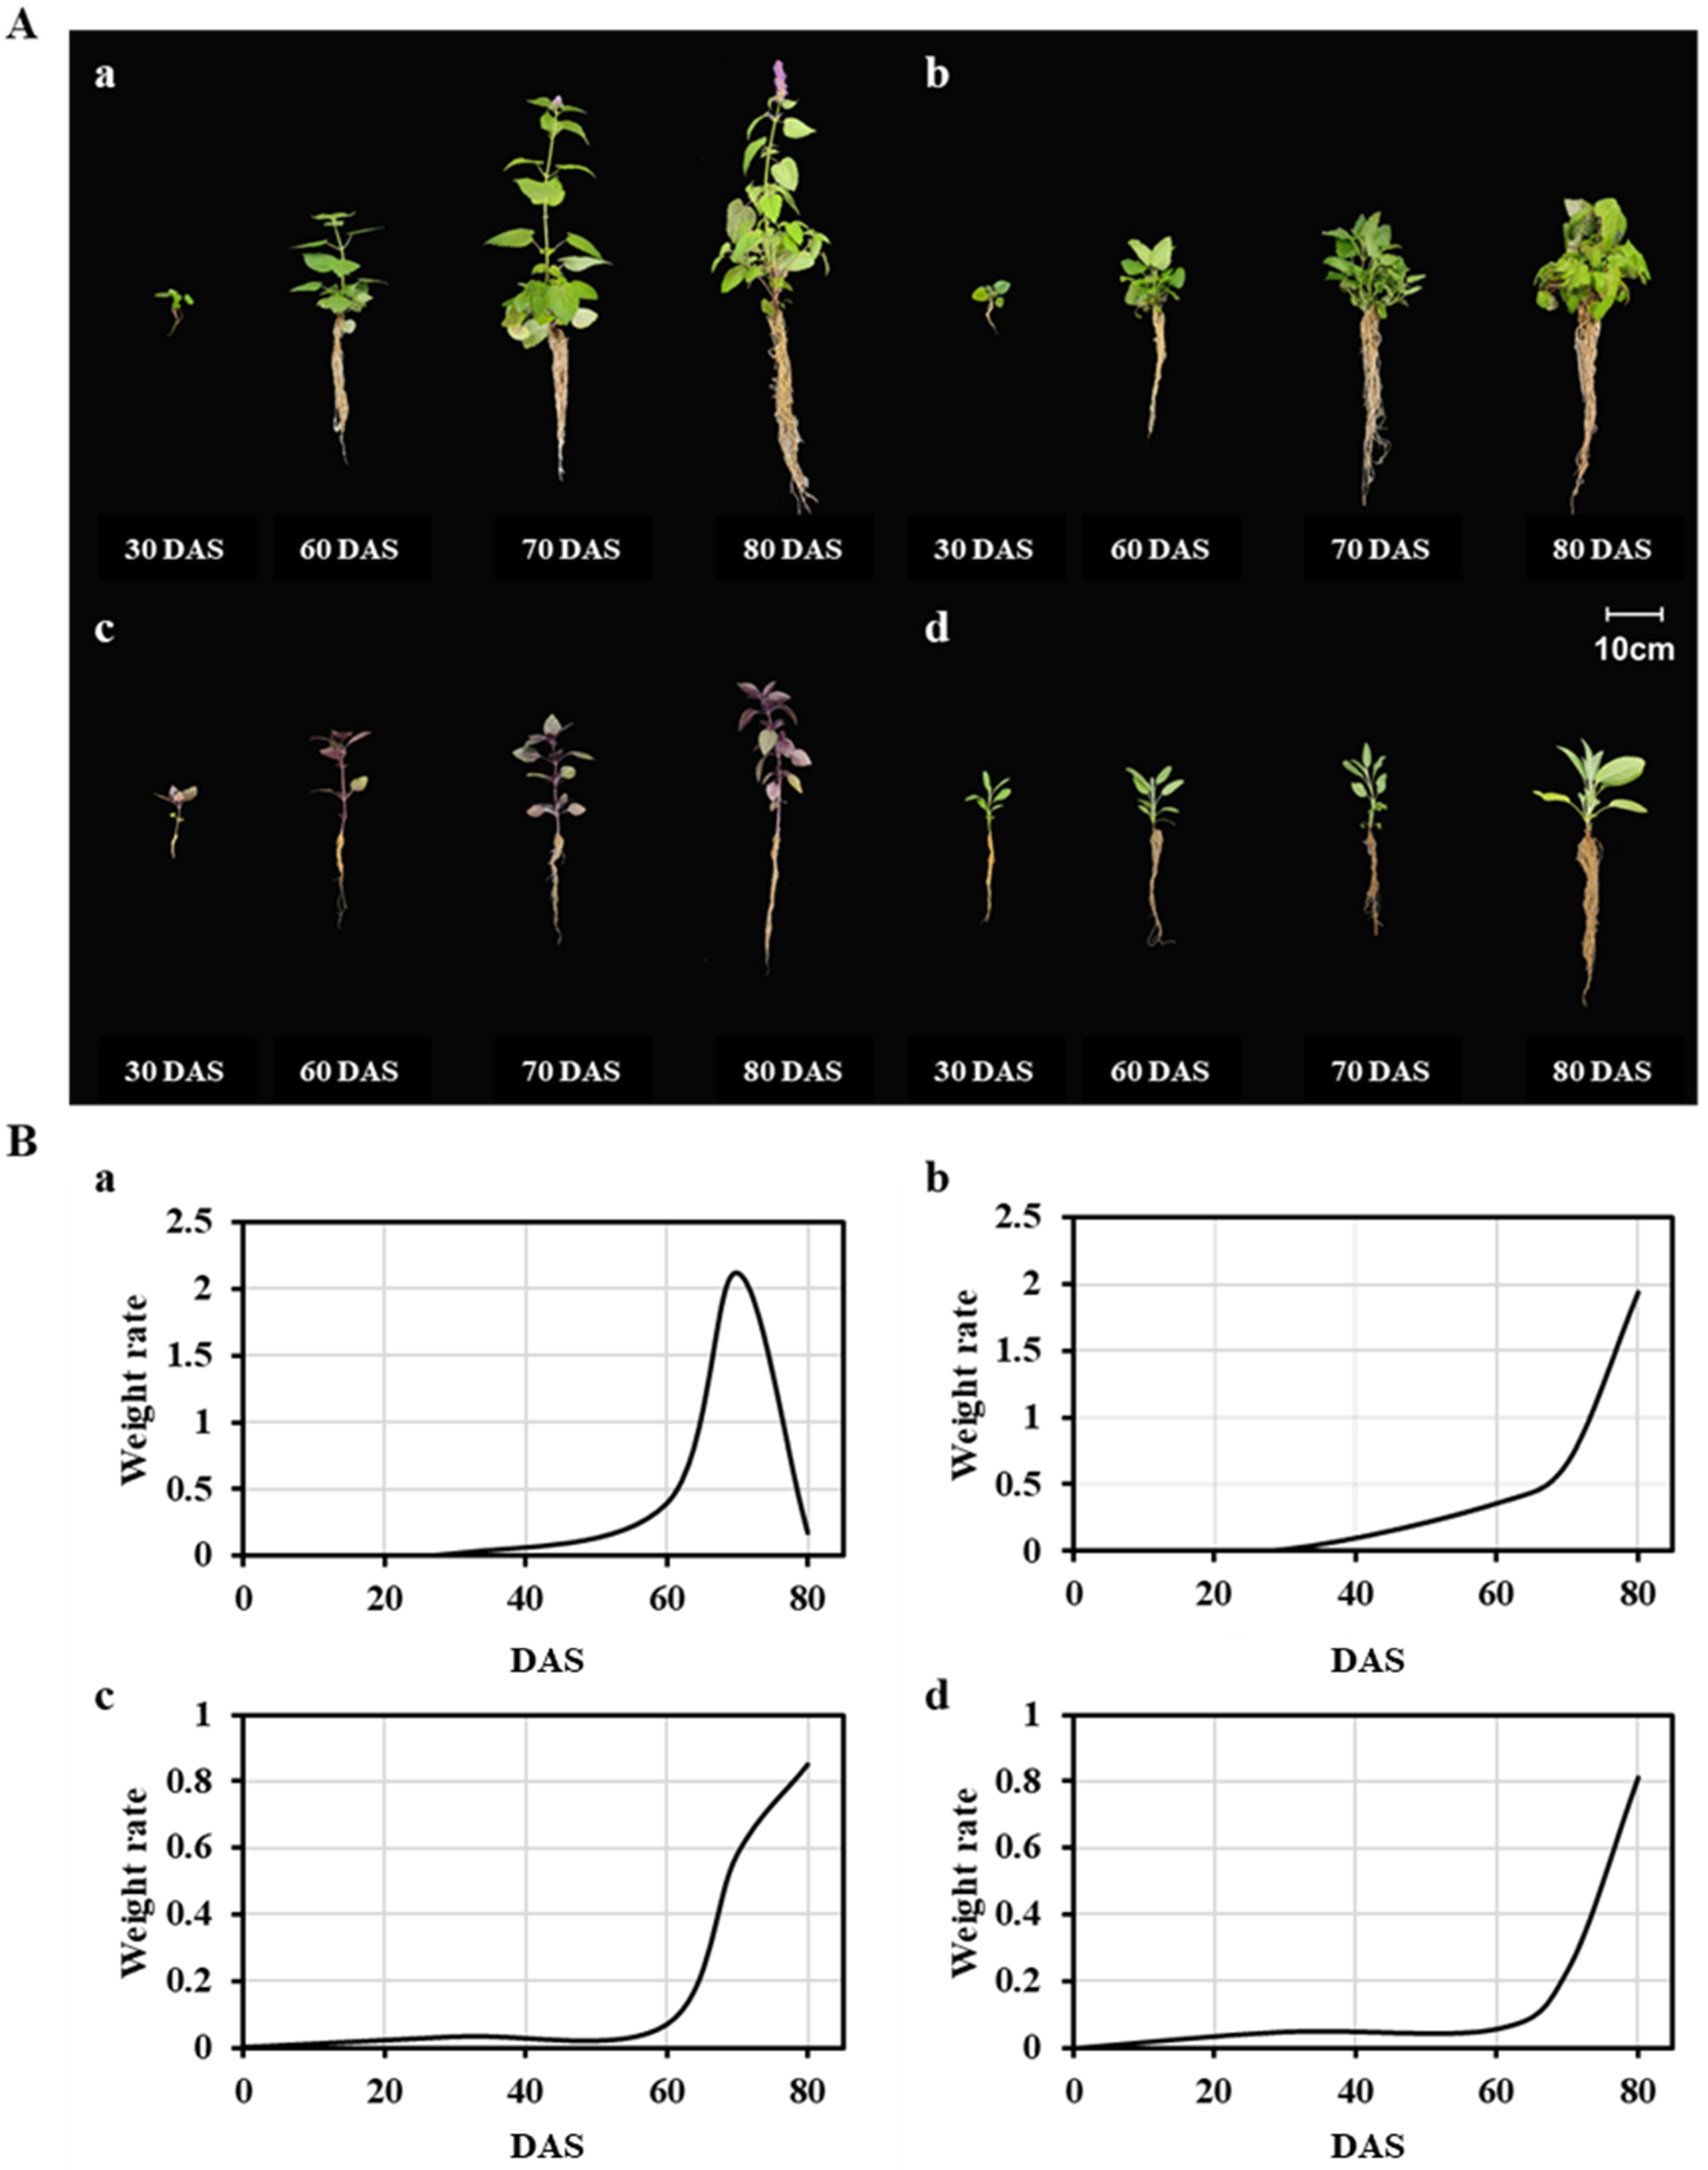
3.1. Selected Plant Growth Attributes
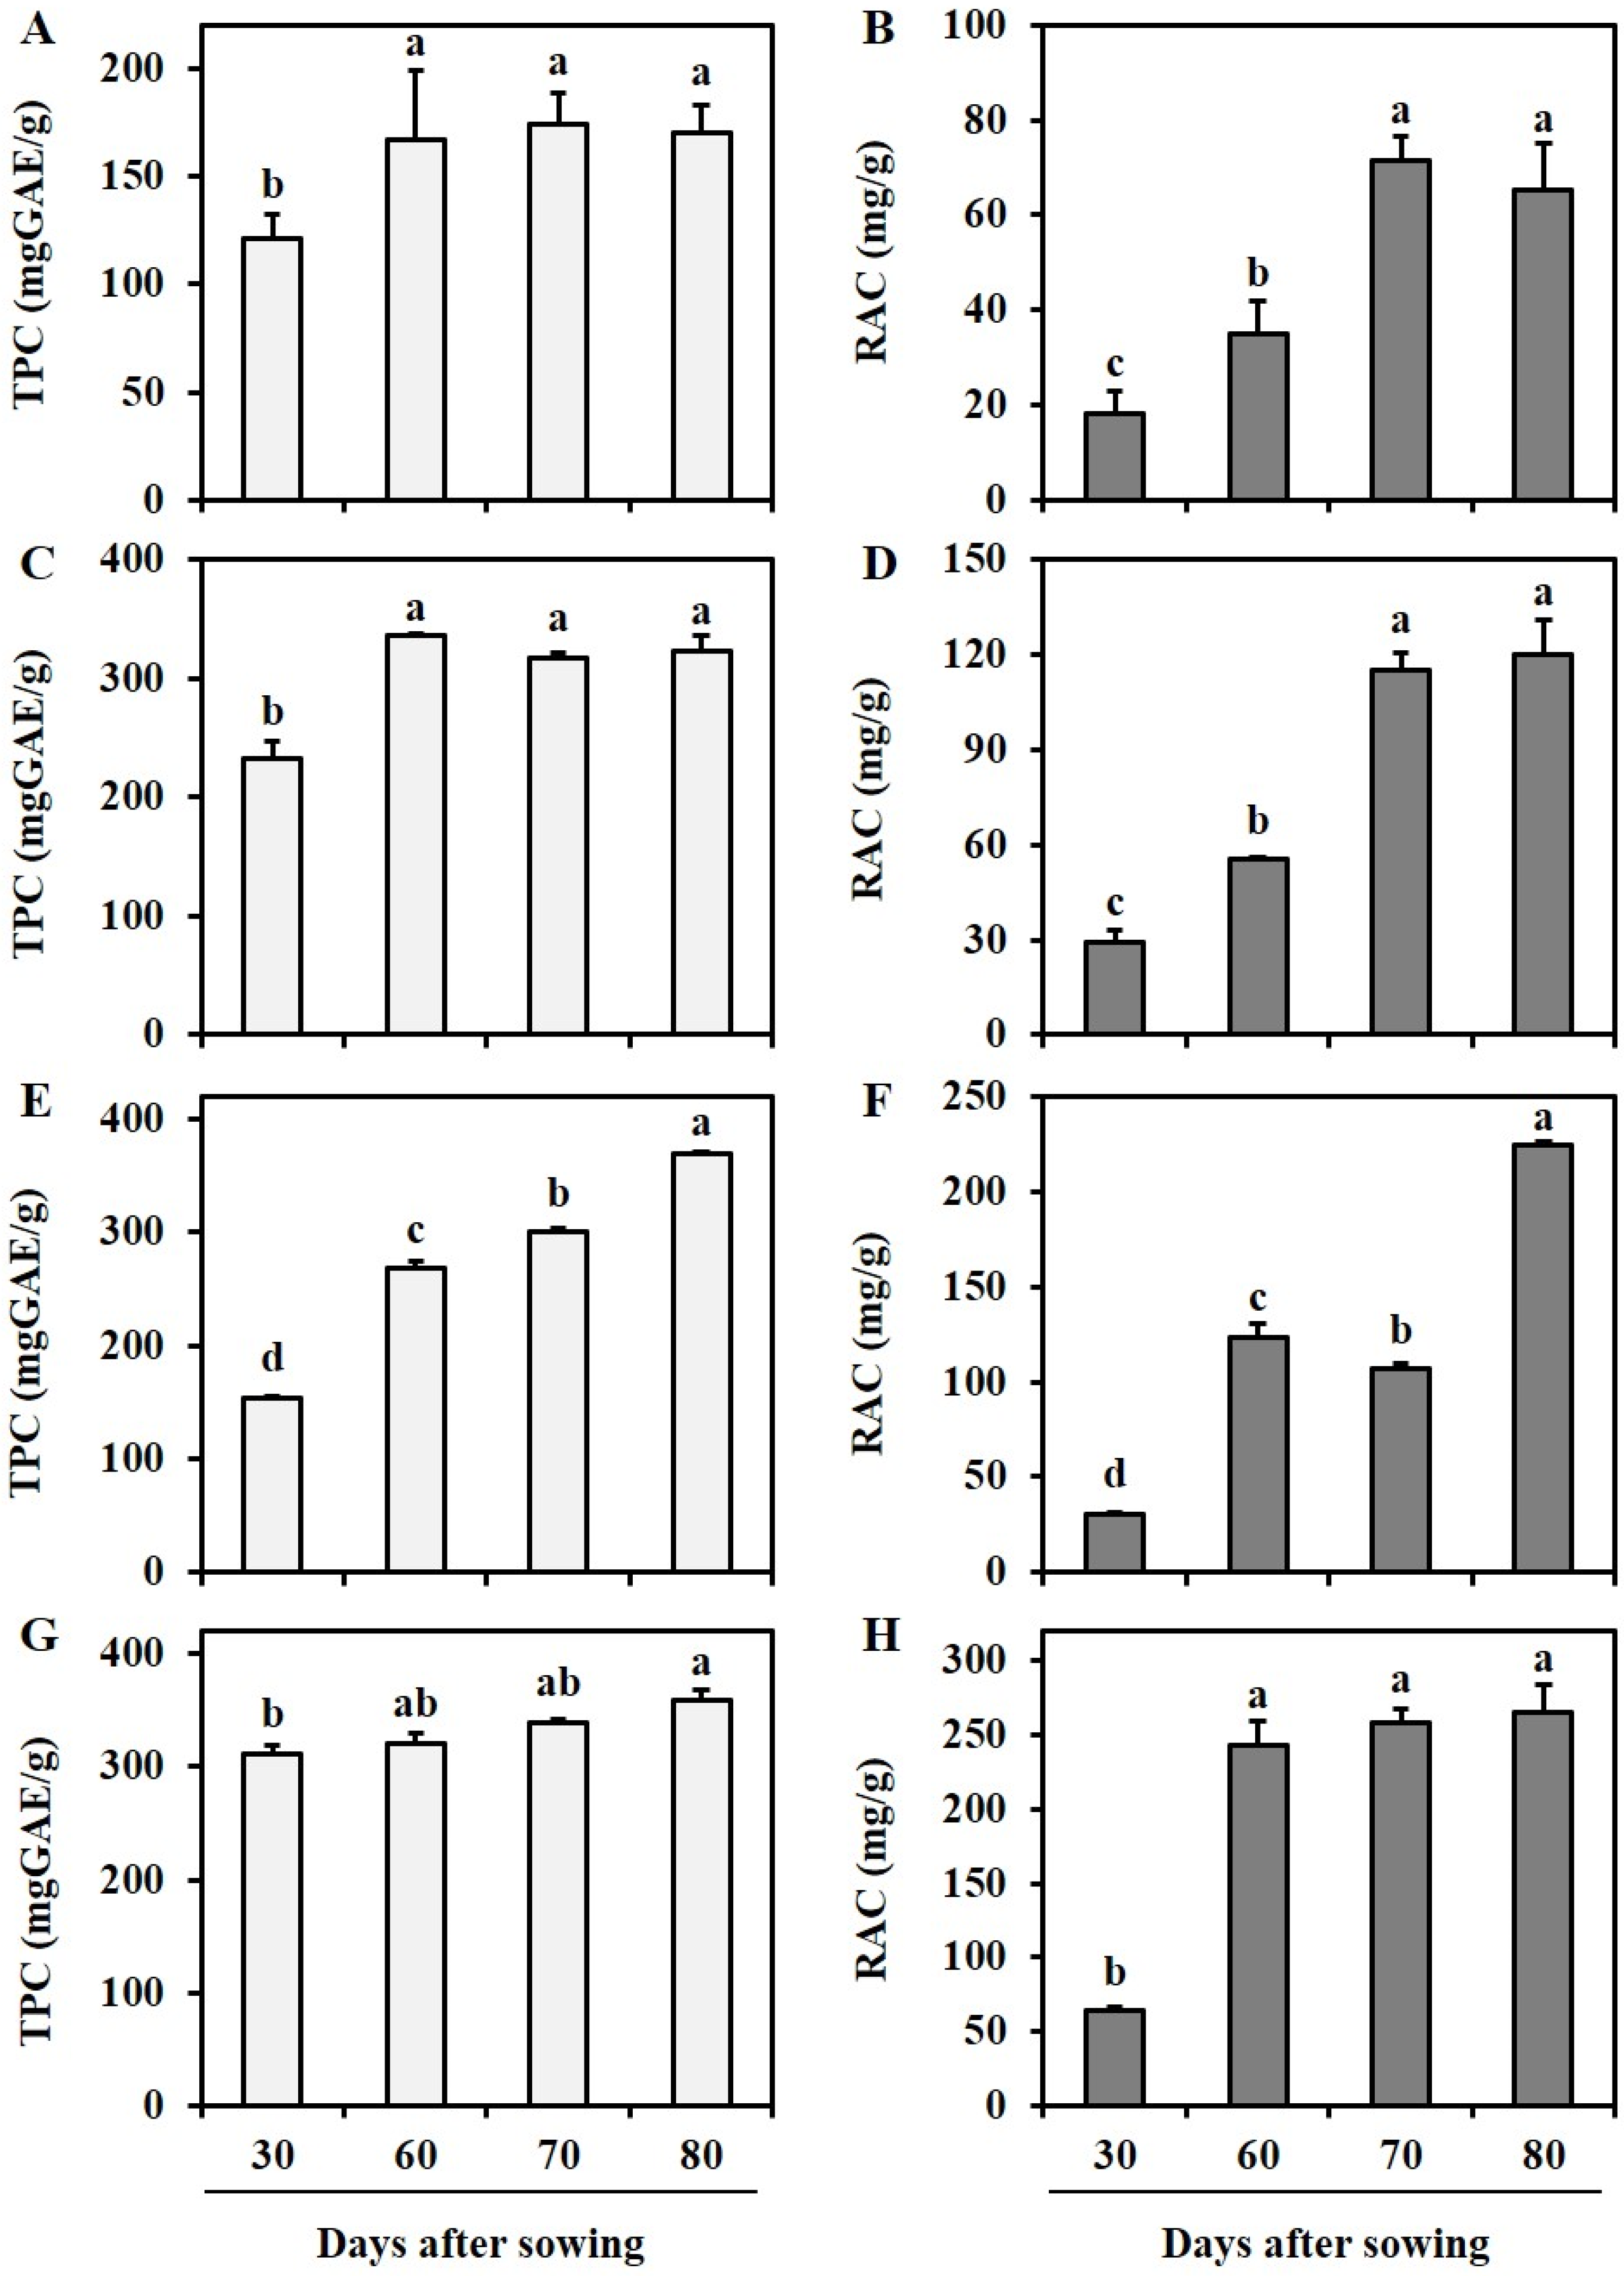
3.2. Estimation of Total Phenolics Content, Rosmarinic Acid Content, and Their Influence on Antioxidant Activity
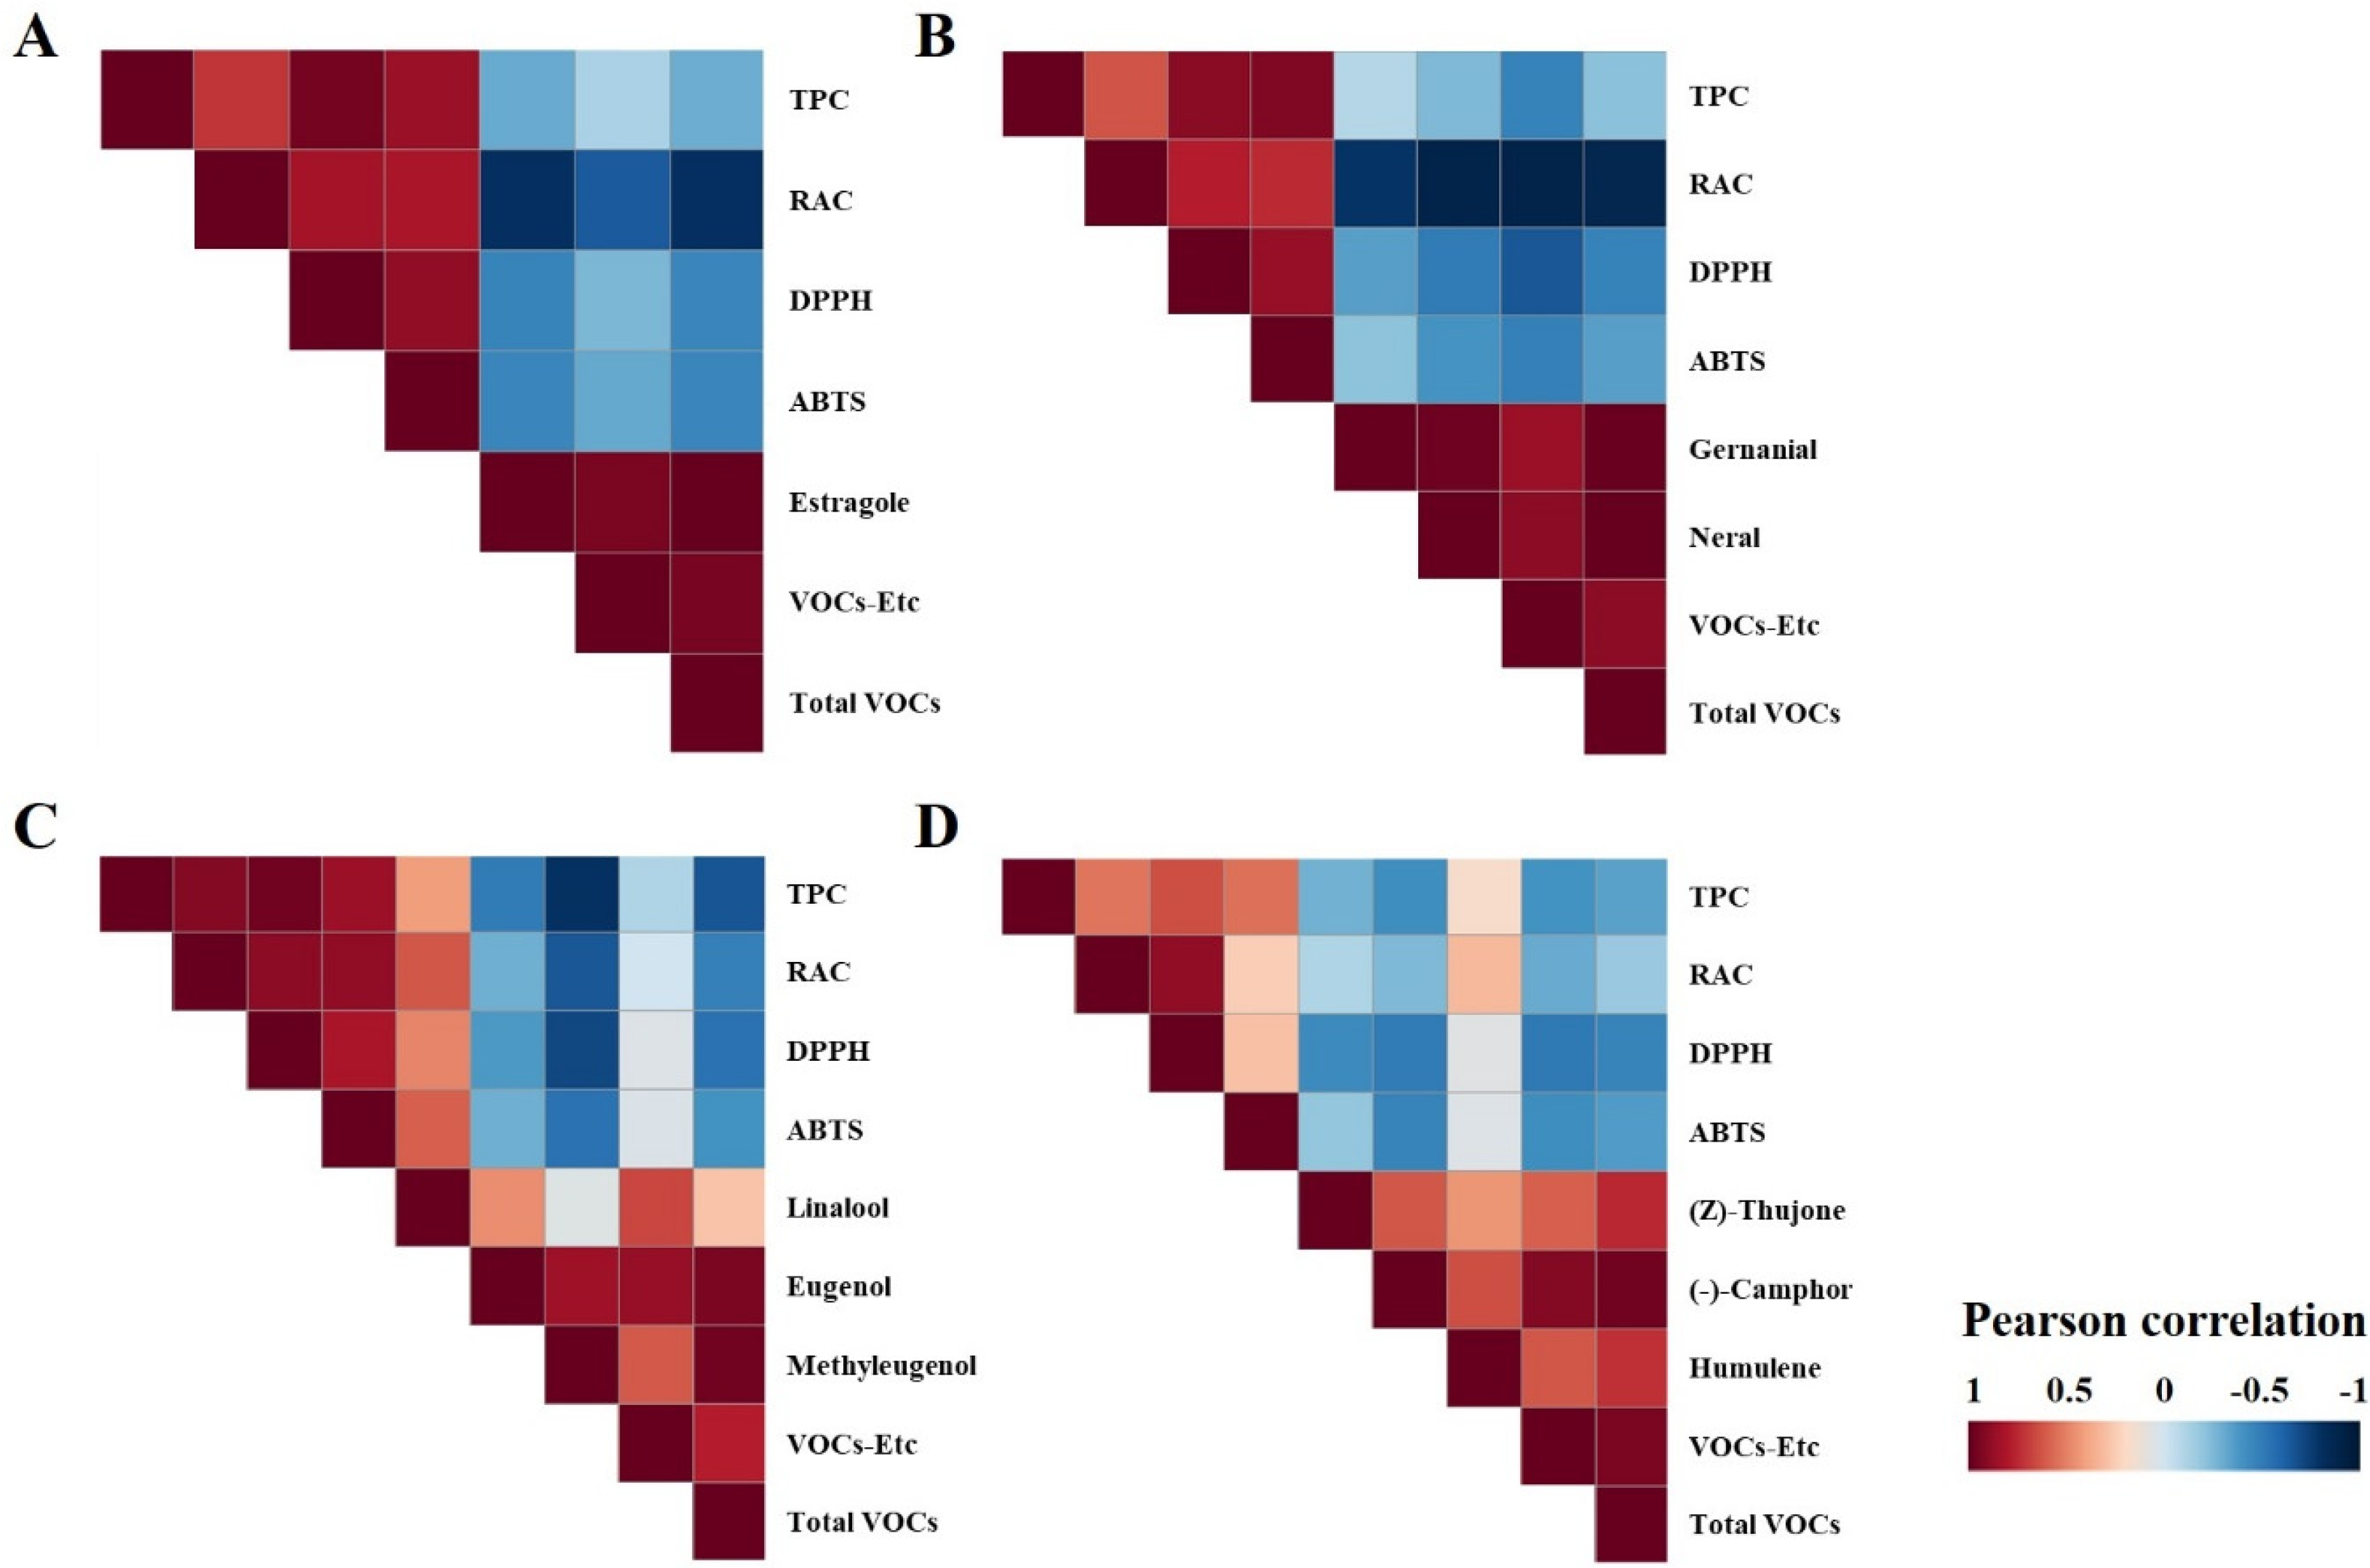
3.3. Profiling of VOCs and Their Distribution
4. Conclusions
Supplementary Materials
Author Contributions
Funding
Institutional Review Board Statement
Informed Consent Statement
Data Availability Statement
Acknowledgments
Conflicts of Interest
References
- Baser, K.; Kirimer, N. Essential Oils of Lamiaceae Plants of Turkey. In Proceedings of the I International Symposium on the Labiatae: Advances in Production, Biotechnology and Utilisation, Sanremo, Italy, 22–25 February 2006; Volume 723, pp. 163–172. [Google Scholar]
- Patil, A.S.; Patil, A.V.; Patil, A.H.; Patil, T.A.; Bhurat, M.; Barhate, S. A review on: Standerdization of herb in new era of cosmaceuticals: Herbal cosmetics. World J. Pharm. Res. 2017, 6, 303–320. [Google Scholar]
- Abdul Qadir, M.; Shahzadi, S.K.; Bashir, A.; Munir, A.; Shahzad, S. Evaluation of phenolic compounds and antioxidant and antimicrobial activities of some common herbs. Int. J. Anal. Chem. 2017, 2017, 3475738. [Google Scholar] [CrossRef] [PubMed]
- Justesen, U.; Knuthsen, P. Composition of flavonoids in fresh herbs and calculation of flavonoid intake by use of herbs in traditional Danish dishes. Food Chem. 2001, 73, 245–250. [Google Scholar] [CrossRef]
- Carović-StanKo, K.; PeteK, M.; Grdiša, M.; Pintar, J.; Bedeković, D.; Satovic, Z. Medicinal plants of the family Lamiaceae as functional foods—A review. Czech J. Food Sci. 2016, 34, 377–390. [Google Scholar] [CrossRef]
- Nezhadali, A.; Nabavi, M.; Rajabian, M.; Akbarpour, M.; Pourali, P.; Amini, F. Chemical variation of leaf essential oil at different stages of plant growth and in vitro antibacterial activity of Thymus vulgaris Lamiaceae, from Iran. Beni-Suef Univ. J. Basic Appl. Sci. 2014, 3, 87–92. [Google Scholar] [CrossRef]
- Liu, J.; Wan, Y.; Zhao, Z.; Chen, H. Determination of the content of rosmarinic acid by HPLC and analytical comparison of volatile constituents by GC-MS in different parts of Perilla frutescens (L.) Britt. Chem. Cent. J. 2013, 7, 61. [Google Scholar] [CrossRef]
- Sik, B.; Kapcsándi, V.; Székelyhidi, R.; Hanczné, E.L.; Ajtony, Z. Recent advances in the analysis of rosmarinic acid from herbs in the Lamiaceae family. Nat. Prod. Commun. 2019, 14, 1934578X19864216. [Google Scholar] [CrossRef]
- Shanaida, M.; Jasicka-Misiak, I.; Makowicz, E.; Stanek, N.; Shanaida, V.; Wieczorek, P.P. Development of high-performance thin layer chromatography method for identification of phenolic compounds and quantification of rosmarinic acid content in some species of the Lamiaceae family. J. Pharm. BioAllied Sci. 2020, 12, 139. [Google Scholar] [CrossRef]
- Nadeem, M.; Imran, M.; Aslam Gondal, T.; Imran, A.; Shahbaz, M.; Muhammad Amir, R.; Wasim Sajid, M.; Batool Qaisrani, T.; Atif, M.; Hussain, G. Therapeutic potential of rosmarinic acid: A comprehensive review. Appl. Sci. 2019, 9, 3139. [Google Scholar] [CrossRef]
- Cocan, I.; Alexa, E.; Danciu, C.; Radulov, I.; Galuscan, A.; Obistioiu, D.; Morvay, A.A.; Sumalan, R.M.; Poiana, M.A.; Pop, G. Phytochemical screening and biological activity of Lamiaceae family plant extracts. Exp. Ther. Med. 2018, 15, 1863–1870. [Google Scholar] [CrossRef]
- Trivellini, A.; Lucchesini, M.; Maggini, R.; Mosadegh, H.; Villamarin, T.S.S.; Vernieri, P.; Mensuali-Sodi, A.; Pardossi, A. Lamiaceae phenols as multifaceted compounds: Bioactivity, industrial prospects and role of “positive-stress”. Ind. Crops Prod. 2016, 83, 241–254. [Google Scholar] [CrossRef]
- Lee, C.-J.; Chen, L.-G.; Chang, T.-L.; Ke, W.-M.; Lo, Y.-F.; Wang, C.-C. The correlation between skin-care effects and phytochemical contents in Lamiaceae plants. Food Chem. 2011, 124, 833–841. [Google Scholar] [CrossRef]
- Shiga, T.; Shoji, K.; Shimada, H.; Hashida, S.-n.; Goto, F.; Yoshihara, T. Effect of light quality on rosmarinic acid content and antioxidant activity of sweet basil, Ocimum basilicum L. Plant Biotechnol. 2009, 26, 255–259. [Google Scholar] [CrossRef]
- Netshimbupfe, M.H.; Berner, J.; Van Der Kooy, F.; Oladimeji, O.; Gouws, C. Influence of Drought and Heat Stress on Mineral Content, Antioxidant Activity and Bioactive Compound Accumulation in Four African Amaranthus Species. Plants 2023, 12, 953. [Google Scholar] [CrossRef]
- Meng, L.; Lozano, Y.F.; Gaydou, E.M.; Li, B. Antioxidant activities of polyphenols extracted from Perilla frutescens varieties. Molecules 2009, 14, 133–140. [Google Scholar] [CrossRef] [PubMed]
- Canadanovic-Brunet, J.; Cetkovic, G.; Djilas, S.; Tumbas, V.; Bogdanović, G.; Mandic, A.; Markov, S.; Cvetkovic, D.; Canadanovic, V. Radical scavenging, antibacterial, and antiproliferative activities of Melissa officinalis L. extracts. J. Med. Food 2008, 11, 133–143. [Google Scholar] [CrossRef]
- Xiang, H.; Zhang, L.; Xi, L.; Yang, Y.; Wang, X.; Lei, D.; Zheng, X.; Liu, X. Phytochemical profiles and bioactivities of essential oils extracted from seven Curcuma herbs. Ind. Crops Prod. 2018, 111, 298–305. [Google Scholar] [CrossRef]
- Semeniuc, C.A.; Socaciu, M.-I.; Socaci, S.A.; Mureșan, V.; Fogarasi, M.; Rotar, A.M. Chemometric comparison and classification of some essential oils extracted from plants belonging to Apiaceae and Lamiaceae families based on their chemical composition and biological activities. Molecules 2018, 23, 2261. [Google Scholar] [CrossRef] [PubMed]
- Hussain, A.I.; Anwar, F.; Iqbal, T.; Bhatti, I.A. Antioxidant attributes of four Lamiaceae essential oils. Pak. J. Bot. 2011, 43, 1315–1321. [Google Scholar]
- Lakušić, B.; Ristić, M.; Slavkovska, V.; Stojanović, D.; Lakušić, D. Variations in essential oil yields and compositions of Salvia officinalis (Lamiaceae) at different developmental stages. Bot. Serbica 2013, 37, 127–139. [Google Scholar]
- Lee, S.-W.; Kim, J.-B.; Kim, K.-S.; Kim, M.-S. Changes of growth characteristics, rosmarinic acid and essential oil contents according to harvest time in Agastache rugosa O. Kuntze. Korean J. Med. Crop Sci. 1999, 7, 83–88. [Google Scholar]
- Hassanzadeh, K.; Aliniaeifard, S.; Farzinia, M.M.; Ahmadi, M. Effect of Phenological Stages on Essential Oil Content, Composition and Rosmarinic Acid in Rosmarinus officinalis L. Int. J. Hortic. Sci. Technol. 2017, 4, 251–258. [Google Scholar] [CrossRef]
- Yosr, Z.; Hnia, C.; Rim, T.; Mohamed, B. Changes in essential oil composition and phenolic fraction in Rosmarinus officinalis L. var. typicus Batt. organs during growth and incidence on the antioxidant activity. Ind. Crops Prod. 2013, 43, 412–419. [Google Scholar] [CrossRef]
- Rutkowska, M.; Balcerczak, E.; Świechowski, R.; Dubicka, M.; Olszewska, M.A. Seasonal variation in phenylpropanoid biosynthesis and in vitro antioxidant activity of Sorbus domestica leaves: Harvesting time optimisation for medicinal application. Ind. Crops Prod. 2020, 156, 112858. [Google Scholar] [CrossRef]
- Arrebola, M.L.; Navarro, M.C.; Jiménez, J.; Ocaña, F.A. Yield and composition of the essential oil of Thymus serpylloides subsp. serpylloides. Phytochemistry 1994, 36, 67–72. [Google Scholar] [CrossRef]
- Abu-Darwish, M.S.; Alu’datt, M.H.; Al-Tawaha, A.R.; Ereifej, K.; Almajwal, A.; Odat, N.; Al Khateeb, W. Seasonal variation in essential oil yield and composition from Thymus vulgaris L. during different growth stages in the south of Jordan. Nat. Prod. Res. 2012, 26, 1310–1317. [Google Scholar] [CrossRef] [PubMed]
- Béjaoui, A.; Chaabane, H.; Jemli, M.; Boulila, A.; Boussaid, M. Essential oil composition and antibacterial activity of Origanum vulgare subsp. glandulosum Desf. at different phenological stages. J. Med. Food 2013, 16, 1115–1120. [Google Scholar] [CrossRef]
- Grevsen, K.; Fretté, X.; Christensen, L.P. Content and composition of volatile terpenes, flavonoids and phenolic acids in Greek oregano (Origanum vulgare L. ssp. hirtum) at different development stages during cultivation in cool temperate climate. Eur. J. Hortic. Sci. 2009, 74, 193–203. [Google Scholar]
- De Martino, L.; De Feo, V.; Nazzaro, F. Chemical composition and in vitro antimicrobial and mutagenic activities of seven Lamiaceae essential oils. Molecules 2009, 14, 4213–4230. [Google Scholar] [CrossRef]
- Bozin, B.; Mimica-Dukic, N.; Simin, N.; Anackov, G. Characterization of the volatile composition of essential oils of some Lamiaceae spices and the antimicrobial and antioxidant activities of the entire oils. J. Agric. Food Chem. 2006, 54, 1822–1828. [Google Scholar] [CrossRef]
- Shekarchi, M.; Hajimehdipoor, H.; Saeidnia, S.; Gohari, A.R.; Hamedani, M.P. Comparative study of rosmarinic acid content in some plants of Labiatae family. Pharmacogn. Mag. 2012, 8, 37. [Google Scholar] [PubMed]
- Benedec, D.; Hanganu, D.; Oniga, I.; Tiperciuc, B.; Olah, N.-K.; Raita, O.; Bischin, C.; Silaghi-Dumitrescu, R.; Vlase, L. Assessment of rosmarinic acid content in six Lamiaceae species extracts and their antioxidant and antimicrobial potential. Pak. J. Pharm. Sci. 2015, 28, 2297–2303. [Google Scholar]
- Albayrak, S.; Aksoy, A.; Albayrak, S.; Sagdic, O. In Vitro antioxidant and antimicrobial activity of some Lamiaceae species. Iran. J. Sci. Technol. (Sci.) 2013, 37, 1–9. [Google Scholar]
- Shahrajabian, M.H.; Sun, W.; Cheng, Q. Chemical components and pharmacological benefits of Basil (Ocimum basilicum): A review. Int. J. Food Prop. 2020, 23, 1961–1970. [Google Scholar] [CrossRef]
- Park, K.; Jung, D.; Jin, Y.; Kim, J.H.; Geum, J.H.; Lee, J. Establishment and validation of an analytical method for quality control of health functional foods derived from Agastache rugosa. Anal. Sci. Technol. 2019, 32, 96–104. [Google Scholar]
- Peng, Y.; Niklas, K.J.; Sun, S. The relationship between relative growth rate and whole-plant C: N: P stoichiometry in plant seedlings grown under nutrient-enriched conditions. J. Plant Ecol. 2010, 4, 147–156. [Google Scholar] [CrossRef]
- Lozano-Fernández, J.; Orozco-Orozco, L.F.; Montoya-Munera, L.F. Effect of two environments and fertilization recommendations on the development and production of bell pepper (cv. Nathalie). Acta Agron. 2018, 67, 101–108. [Google Scholar] [CrossRef]
- Choi, Y.; Lee, S.; Chun, J.; Lee, H.; Lee, J. Influence of heat treatment on the antioxidant activities and polyphenolic compounds of Shiitake (Lentinus edodes) mushroom. Food Chem. 2006, 99, 381–387. [Google Scholar] [CrossRef]
- Park, M.J.; Ryu, D.H.; Cho, J.Y.; Ha, I.J.; Moon, J.S.; Kang, Y.-H. Comparison of the antioxidant properties and flavonols in various parts of Korean red onions by multivariate data analysis. Hortic. Environ. Biotechnol. 2018, 59, 919–927. [Google Scholar] [CrossRef]
- Re, R.; Pellegrini, N.; Proteggente, A.; Pannala, A.; Yang, M.; Rice-Evans, C. Antioxidant activity applying an improved ABTS radical cation decolorization assay. Free Radic. Biol. Med. 1999, 26, 1231–1237. [Google Scholar] [CrossRef]
- Xu, J.L.; Kim, T.J.; Kim, J.-K.; Choi, Y. Simultaneous roasting and extraction of green coffee beans by pressurized liquid extraction. Food Chem. 2019, 281, 261–268. [Google Scholar] [CrossRef]
- Avci, A.B.; Giachino, R.R.A. Harvest stage effects on some yield and quality characteristics of lemon balm (Melissa officinalis L.). Ind. Crops Prod. 2016, 88, 23–27. [Google Scholar] [CrossRef]
- Pegoraro, R.F.; Souza, B.A.M.d.; Maia, V.M.; Amaral, U.d.; Pereira, M.C.T. Growth and production of irrigated Vitória pineapple grown in semi-arid conditions. Rev. Bras. Frutic. 2014, 36, 693–703. [Google Scholar] [CrossRef]
- Nicolai, M.; Pereira, P.; Vitor, R.F.; Reis, C.P.; Roberto, A.; Rijo, P. Antioxidant activity and rosmarinic acid content of ultrasound-assisted ethanolic extracts of medicinal plants. Measurement 2016, 89, 328–332. [Google Scholar] [CrossRef]
- Mustafa, R.; Hamid, A.A.; Mohamed, S.; Bakar, F.A. Total phenolic compounds, flavonoids, and radical scavenging activity of 21 selected tropical plants. J. Food Sci. 2010, 75, C28–C35. [Google Scholar] [CrossRef]
- Dicko, M.H.; Gruppen, H.; Traoré, A.S.; van Berkel, W.J.; Voragen, A.G. Evaluation of the effect of germination on phenolic compounds and antioxidant activities in sorghum varieties. J. Agric. Food Chem. 2005, 53, 2581–2588. [Google Scholar] [CrossRef]
- Rice-Evans, C.A.; Miller, N.J.; Paganga, G. Structure-antioxidant activity relationships of flavonoids and phenolic acids. Free Radic. Biol. Med. 1996, 20, 933–956. [Google Scholar] [CrossRef] [PubMed]
- Yeo, H.J.; Park, C.H.; Park, Y.E.; Hyeon, H.; Kim, J.K.; Lee, S.Y.; Park, S.U. Metabolic profiling and antioxidant activity during flower development in Agastache rugosa. Physiol. Mol. Biol. Plants 2021, 27, 445–455. [Google Scholar] [CrossRef]
- Zielińska, S.; Dryś, A.; Piątczak, E.; Kolniak-Ostek, J.; Podgórska, M.; Oszmiański, J.; Matkowski, A. Effect of LED illumination and amino acid supplementation on phenolic compounds profile in Agastache rugosa in vitro cultures. Phytochem. Lett. 2019, 31, 12–19. [Google Scholar] [CrossRef]
- Kim, S.; Bok, G.; Park, J. Analysis of antioxidant content and growth of Agastache rugosa as affected by LED light qualities. J. Bio-Environ. Control 2018, 27, 260–268. [Google Scholar] [CrossRef]
- An, J.H.; Yuk, H.J.; Kim, D.-Y.; Nho, C.W.; Lee, D.; Ryu, H.W.; Oh, S.-R. Evaluation of phytochemicals in Agastache rugosa (Fisch. & CA Mey.) Kuntze at different growth stages by UPLC-QTof-MS. Ind. Crops Prod. 2018, 112, 608–616. [Google Scholar] [CrossRef]
- Park, C.H.; Yeo, H.J.; Baskar, T.B.; Park, Y.E.; Park, J.S.; Lee, S.Y.; Park, S.U. In Vitro antioxidant and antimicrobial properties of flower, leaf, and stem extracts of Korean mint. Antioxidants 2019, 8, 75. [Google Scholar] [CrossRef] [PubMed]
- Ben Farhat, M.; Jordan, M.J.; Chaouech-Hamada, R.; Landoulsi, A.; Sotomayor, J.A. Variations in essential oil, phenolic compounds, and antioxidant activity of tunisian cultivated Salvia officinalis L. J. Agric. Food Chem. 2009, 57, 10349–10356. [Google Scholar] [CrossRef]
- Generalić, I.; Skroza, D.; Šurjak, J.; Možina, S.S.; Ljubenkov, I.; Katalinić, A.; Šimat, V.; Katalinić, V. Seasonal variations of phenolic compounds and biological properties in sage (Salvia officinalis L.). Chem. Biodivers. 2012, 9, 441–457. [Google Scholar] [CrossRef] [PubMed]
- Bettaieb, I.; Hamrouni-Sellami, I.; Bourgou, S.; Limam, F.; Marzouk, B. Drought effects on polyphenol composition and antioxidant activities in aerial parts of Salvia officinalis L. Acta Physiol. Plant. 2011, 33, 1103–1111. [Google Scholar] [CrossRef]
- Cuvelier, M.E.; Berset, C.; Richard, H. Antioxidant constituents in sage (Salvia officinalis). J. Agric. Food Chem. 1994, 42, 665–669. [Google Scholar] [CrossRef]
- Farhat, M.B.; Chaouch-Hamada, R.; Sotomayor, J.A.; Landoulsi, A.; Jordán, M.J. Antioxidant potential of Salvia officinalis L. residues as affected by the harvesting time. Ind. Crops Prod. 2014, 54, 78–85. [Google Scholar] [CrossRef]
- Lu, Y.; Yeap Foo, L. Antioxidant activities of polyphenols from sage (Salvia officinalis). Food Chem. 2001, 75, 197–202. [Google Scholar] [CrossRef]
- Arceusz, A.; Wesolowski, M. Quality consistency evaluation of Melissa officinalis L. commercial herbs by HPLC fingerprint and quantitation of selected phenolic acids. J. Pharm. Biomed. Anal. 2013, 83, 215–220. [Google Scholar] [CrossRef]
- Cunha, F.; Tintino, S.R.; Figueredo, F.; Barros, L.; Duarte, A.E.; Vega Gomez, M.C.; Coronel, C.C.; Rolón, M.; Leite, N.; Sobral-Souza, C.E. HPLC-DAD phenolic profile, cytotoxic and anti-kinetoplastidae activity of Melissa officinalis. Pharm. Biol. 2016, 54, 1664–1670. [Google Scholar] [CrossRef]
- Yoo, G.; Lee, I.K.; Park, S.; Kim, N.; Park, J.H.; Kim, S.H. Optimization of extraction conditions for phenolic acids from the leaves of Melissa officinalis L. using response surface methodology. Pharmacogn. Mag. 2018, 14, 155. [Google Scholar] [CrossRef]
- Chen, J.H.; Ho, C.-T. Antioxidant activities of caffeic acid and its related hydroxycinnamic acid compounds. J. Agric. Food Chem. 1997, 45, 2374–2378. [Google Scholar] [CrossRef]
- Abdellatif, F.; Begaa, S.; Messaoudi, M.; Benarfa, A.; Ouakouak, H.; Hassani, A.; Sawicka, B.; Simal Gandara, J. HPLC–DAD Analysis, Antimicrobial and Antioxidant Properties of Aromatic Herb Melissa officinalis L., Aerial Parts Extracts. Food Anal. Methods 2023, 16, 45–54. [Google Scholar] [CrossRef]
- Spiridon, I.; Colceru, S.; Anghel, N.; Teaca, C.A.; Bodirlau, R.; Armatu, A. Antioxidant capacity and total phenolic contents of oregano (Origanum vulgare), lavender (Lavandula angustifolia) and lemon balm (Melissa officinalis) from Romania. Nat. Prod. Res. 2011, 25, 1657–1661. [Google Scholar] [CrossRef]
- Flanigan, P.M.; Niemeyer, E.D. Effect of cultivar on phenolic levels, anthocyanin composition, and antioxidant properties in purple basil (Ocimum basilicum L.). Food Chem. 2014, 164, 518–526. [Google Scholar] [CrossRef] [PubMed]
- Jakovljević, D.; Topuzović, M.; Stanković, M. Nutrient limitation as a tool for the induction of secondary metabolites with antioxidant activity in basil cultivars. Ind. Crops Prod. 2019, 138, 111462. [Google Scholar] [CrossRef]
- Phippen, W.B.; Simon, J.E. Anthocyanins in basil (Ocimum basilicum L.). J. Agric. Food Chem. 1998, 46, 1734–1738. [Google Scholar] [CrossRef]
- Strazzer, P.; Guzzo, F.; Levi, M. Correlated accumulation of anthocyanins and rosmarinic acid in mechanically stressed red cell suspensions of basil (Ocimum basilicum). J. Plant Physiol. 2011, 168, 288–293. [Google Scholar] [CrossRef] [PubMed]
- Karpiński, T.M. Essential oils of Lamiaceae family plants as antifungals. Biomolecules 2020, 10, 103. [Google Scholar] [CrossRef]
- Salehi, B.; Mishra, A.P.; Shukla, I.; Sharifi-Rad, M.; Contreras, M.d.M.; Segura-Carretero, A.; Fathi, H.; Nasrabadi, N.N.; Kobarfard, F.; Sharifi-Rad, J. Thymol, thyme, and other plant sources: Health and potential uses. Phytother. Res. 2018, 32, 1688–1706. [Google Scholar] [CrossRef]
- Sharma, Y.; Schaefer, J.; Streicher, C.; Stimson, J.; Fagan, J. Qualitative analysis of essential oil from French and Italian varieties of rosemary (Rosmarinus officinalis L.) grown in the Midwestern United States. Anal. Chem. Lett. 2020, 10, 104–112. [Google Scholar] [CrossRef]
- Wu, Z.; Tan, B.; Liu, Y.; Dunn, J.; Martorell Guerola, P.; Tortajada, M.; Cao, Z.; Ji, P. Chemical composition and antioxidant properties of essential oils from peppermint, native spearmint and scotch spearmint. Molecules 2019, 24, 2825. [Google Scholar] [CrossRef] [PubMed]
- Satmi, F.R.S.; Hossain, M.A. In vitro antimicrobial potential of crude extracts and chemical compositions of essential oils of leaves of Mentha piperita L native to the Sultanate of Oman. Pac. Sci. Rev. A Nat. Sci. Eng. 2016, 18, 103–106. [Google Scholar] [CrossRef]
- Andersen, R.A.; Hamilton-Kemp, T.R.; Hildebrand, D.F.; McCracken, C.T., Jr.; Collins, R.W.; Fleming, P.D. Structure-antifungal activity relationships among volatile C6 and C9 aliphatic aldehydes, ketones, and alcohols. J. Agric. Food Chem. 1994, 42, 1563–1568. [Google Scholar] [CrossRef]
- Perera, W.; Hewajulige, I.; Wijeratnam, W.; Ratnayake, R. The effect of coating with hexanal vapour on quality retention of mango (Mangifera indica L.). In Proceedings of the 15th Agricultural Research Symposium, Kuliyapitiya, Sri Lanka, 28–29 June 2016; pp. 234–238. [Google Scholar]
- Delory, B.M.; Delaplace, P.; du Jardin, P.; Fauconnier, M.-L. Barley (Hordeum distichon L.) roots synthesise volatile aldehydes with a strong age-dependent pattern and release (E)-non-2-enal and (E, Z)-nona-2, 6-dienal after mechanical injury. Plant Physiol. Biochem. 2016, 104, 134–145. [Google Scholar] [CrossRef]
- Harman, G.; Nedrow, B.; Clark, B.; Mattick, L. Association of Volatile Aldehyde Production During Germination with Poor Soybean and Pea Seed Quality. Crop Sci. 1982, 22, 712–716. [Google Scholar] [CrossRef]
- De Vincenzi, M.; Silano, M.; Maialetti, F.; Scazzocchio, B. Constituents of aromatic plants: II. Estragole. Fitoterapia 2000, 71, 725–729. [Google Scholar] [CrossRef]
- Charles, D.J.; Simon, J.E.; Widrlechner, M.P. Characterization of the essential oil of Agastache species. J. Agric. Food Chem. 1991, 39, 1946–1949. [Google Scholar] [CrossRef]
- Baik, J. Analysis, antibacterial, and insecticide effects on domestic native fragrant plants Elsholtzia ciliata and Agastache rugosa. J. Korean Soc. People Plants Environ. 2016, 19, 79–83. [Google Scholar] [CrossRef]
- Deschamps, C.; Gang, D.; Dudareva, N.; Simon, J.E. Developmental regulation of phenylpropanoid biosynthesis in leaves and glandular trichomes of basil (Ocimum basilicum L.). Int. J. Plant Sci. 2006, 167, 447–454. [Google Scholar] [CrossRef]
- Sharopov, F.S.; Wink, M.; Khalifaev, D.R.; Zhang, H.; Dosoky, N.S.; Setzer, W.N. Composition and bioactivity of the essential oil of Melissa officinalis L. growing wild in Tajikistan. Int. J. Tradit. Nat. Med. 2013, 2, 86–96. [Google Scholar]
- e Silva, G.d.S.; de Jesus Marques, J.N.; Linhares, E.P.M.; Bonora, C.M.; Costa, É.T.; Saraiva, M.F. Review of anticancer activity of monoterpenoids: Geraniol, nerol, geranial and neral. Chem.-Biol. Interact. 2022, 362, 109994. [Google Scholar] [CrossRef] [PubMed]
- Šovljanski, O.; Saveljić, A.; Aćimović, M.; Šeregelj, V.; Pezo, L.; Tomić, A.; Ćetković, G.; Tešević, V. Biological Profiling of Essential Oils and Hydrolates of Ocimum basilicum var. Genovese and var. Minimum Originated from Serbia. Processes 2022, 10, 1893. [Google Scholar] [CrossRef]
- Tan, K.H.; Nishida, R. Methyl eugenol: Its occurrence, distribution, and role in nature, especially in relation to insect behavior and pollination. J. Insect Sci. 2012, 12, 56. [Google Scholar] [CrossRef]
- Renu, I.K.; Haque, I.; Kumar, M.; Poddar, R.; Bandopadhyay, R.; Rai, A.; Mukhopadhyay, K. Characterization and functional analysis of eugenol O-methyltransferase gene reveal metabolite shifts, chemotype specific differential expression and developmental regulation in Ocimum tenuiflorum L. Mol. Biol. Rep. 2014, 41, 1857–1870. [Google Scholar] [CrossRef] [PubMed]
- Said-Al Ahl, H.; Hussein, M.S.; Gendy, A.S.; Tkachenko, K.G. Quality of sage (Salvia officinalis L.) essential oil grown in Egypt. Int. J. Plant Sci. Ecol. 2015, 1, 119–123. [Google Scholar]
- Stešević, D.; Ristić, M.; Nikolić, V.; Nedović, M.; Caković, D.; Šatović, Z. Chemotype diversity of indigenous Dalmatian sage (Salvia officinalis L.) populations in Montenegro. Chem. Biodivers. 2014, 11, 101–114. [Google Scholar] [CrossRef]
- Fincheira, P.; Parada, M.; Quiroz, A. Volatile organic compounds stimulate plant growing and seed germination of Lactuca sativa. J. Soil Sci. Plant Nutr. 2017, 17, 853–867. [Google Scholar] [CrossRef]
- Bracho-Nunez, A.; Welter, S.; Staudt, M.; Kesselmeier, J. Plant-specific volatile organic compound emission rates from young and mature leaves of Mediterranean vegetation. J. Geophys. Res. Atmos. 2011, 116, 1–13. [Google Scholar] [CrossRef]


| Cultivation Period | Date | Temperature | RH 1 (%) | CO2 Conc. (ppm) | ||
|---|---|---|---|---|---|---|
| Mean. (°C) | Max. (°C) | Min. (°C) | ||||
| 30–40 DAS | 12–21 February | 18.7 | 30.2 | 14.0 | 50.6 | 439.8 |
| 40–50 DAS | 22 February–31 March | 18.7 | 30.1 | 15.3 | 53.1 | 430.1 |
| 50–60 DAS | 4–13 March | 19.6 | 31.1 | 15.1 | 51.0 | 425.2 |
| 60–70 DAS | 14–23 March | 20.5 | 32.0 | 12.6 | 50.6 | 414.1 |
| 70–80 DAS | 24 March–2 April | 19.9 | 29.5 | 14.5 | 55.0 | 428.7 |
| Species | Harvest Time | Description | Stage | Plant Weight (g) | Plant Height (cm) |
|---|---|---|---|---|---|
| AR 1 | 30 DAS 5 | Seedling stage | S1 | 0.56 ± 0.01 d | 7.67 ± 0.33 d |
| 60 DAS | Vegetative stage | S2 | 12.33 ± 0.42 c | 63.33 ± 1.76 c | |
| 70 DAS | Pre-flowering stage | S3 | 33.57 ± 0.41 b | 80.00 ± 1.15 b | |
| 80 DAS | Flowering stage | S4 | 35.30 ± 0.10 a | 88.33 ± 0.88 a | |
| MO 2 | 30 DAS | Seedling | S1 | 0.41 ± 0.02 d | 11.33 ± 0.88 d |
| 60 DAS | Vegetative stage | S2-1 | 11.24 ± 0.20 c | 40.33 ± 1.45 c | |
| 70 DAS | Vegetative stage | S2-2 | 17.91 ± 1.27 b | 61.33 ± 0.88 b | |
| 80 DAS | Vegetative stage | S2-3 | 37.33 ± 1.19 a | 66.00 ± 1.15 a | |
| OBP 3 | 30 DAS | Seedling | S1 | 0.95 ± 0.01 d | 13.50 ± 0.29 d |
| 60 DAS | Vegetative stage | S2-1 | 3.00 ± 0.17 c | 34.33 ± 1.20 c | |
| 70 DAS | Vegetative stage | S2-2 | 8.81 ± 0.18 b | 50.00 ± 1.15 b | |
| 80 DAS | Pre-flowering stage | S3 | 17.33 ± 0.33 a | 55.33 ± 1.45 a | |
| SO 4 | 30 DAS | Seedling | S1 | 1.49 ± 0.04 d | 27.00 ± 0.58 c |
| 60 DAS | Vegetative stage | S2-1 | 3.23 ± 0.03 c | 29.67 ± 1.33 c | |
| 70 DAS | Vegetative stage | S2-2 | 5.57 ± 0.07 b | 34.67 ± 1.45 b | |
| 80 DAS | Vegetative stage | S2-3 | 13.67 ± 0.67 a | 47.00 ± 1.73 a |
| No. | Compound | RI 1 | Classification | DAS 2 | |||
|---|---|---|---|---|---|---|---|
| 30 | 60 | 70 | 80 | ||||
| 1 | (E)-2-Hexanal | 857 | Aldehyde | 1.52 ± 0.26 a | 0.16 ± 0.02 b | 0.23 ± 0.06 b | 0.19 ± 0.04 b |
| 2 | 1-Octen-3-ol | 981 | Fatty alcohol | 0.13 ± 0.03 b | 0.27 ± 0.02 ab | 0.23 ± 0.01 ab | 0.32 ± 0.05 a |
| 3 | Limonene | 1031 | Monoterpene | 0.50 ± 0.07 ab | 1.10 ± 0.39 a | 0.16 ± 0.01 b | 0.23 ± 0.03 ab |
| 4 | 4-Methyl benzaldehyde | 1079 | Aldehydes | 0.51 ± 0.04 a | 0.44 ± 0.11 a | 0.02 ± 0.00 b | 0.03 ± 0.01 b |
| 5 | Linalool | 1101 | Terpene alcohol | ND 2 | 0.10 ± 0.00 ab | 0.15 ± 0.04 a | 0.02 ± 0.00 b |
| 6 | Isopulegone | 1179 | Monoterpene | 0.04 ± 0.00 a | 0.04 ± 0.01 a | 0.02 ± 0.00 a | 0.03 ± 0.00 a |
| 7 | Estragole | 1198 | Phenylpropene | 202.55 ± 7.88 a | 234.33 ± 11.97 a | 69.99 ± 4.21 b | 92.05 ± 6.40 b |
| 8 | (Z)-Neral | 1243 | Monoterpene | ND | 0.84 ± 0.11 a | 0.16 ± 0.04 b | 0.16 ± 0.01 b |
| 9 | p-Chavicol | 1257 | Phenylpropene | 0.04 ± 0.00 a | 0.02 ± 0.00 b | ND | ND |
| 10 | Geranial | 1271 | Monoterpene | ND | 1.46 ± 0.19 a | 0.29 ± 0.09 b | 0.26 ± 0.02 b |
| 11 | Anethole | 1289 | Phenylpropene | 1.14 ± 0.31 b | 2.20 ± 0.04 a | 0.20 ± 0.02 c | 0.31 ± 0.04 c |
| 12 | Methyleugenol | 1408 | Phenylpropene | 0.04 ± 0.01 b | 0.04 ± 0.00 b | 0.09 ± 0.01 a | 0.06 ± 0.01 ab |
| 13 | Caryophyllene | 1423 | Sesquiterpene | 0.42 ± 0.05 ab | 1.07 ± 0.20 a | 0.10 ± 0.03 b | 0.48 ± 0.27 ab |
| 14 | (E)-β-Famesene | 1459 | Sesquiterpene | 0.07 ± 0.04 | ND | ND | ND |
| 15 | δ-Cadinene | 1527 | Sesquiterpene | 0.12 ± 0.01 ab | 0.23 ± 0.04 a | 0.05 ± 0.01 b | 0.10 ± 0.04 b |
| 16 | Spathulenol | 1579 | Terpene alcohol | 0.07 ± 0.00 a | 0.07 ± 0.01 a | ND | ND |
| Total | 207.13 ± 14.31 a | 242.37 ± 21.31 a | 71.71 ± 6.97 b | 94.24 ± 11.65 b | |||
| No. | Compound | RI 1 | Classification | DAS | |||
|---|---|---|---|---|---|---|---|
| 30 | 60 | 70 | 80 | ||||
| 1 | (E)-2-Hexanal | 857 | Aldehyde | 0.31 ± 0.07 a | 0.25 ± 0.02 ab | 0.14 ± 0.02 ab | 0.08 ± 0.00 b |
| 2 | 1-Octen-3-ol | 981 | Fatty alcohol | 0.03 ± 0.01 b | 0.04 ± 0.00 b | 0.07 ± 0.02 b | 0.13 ± 0.01 a |
| 3 | 6-Methyl-5-hepten-2-one | 986 | Ketones | 0.26 ± 0.00 ab | 0.47 ± 0.09 a | 0.19 ± 0.04 b | 0.13 ± 0.02 b |
| 4 | (E,E)-2,4-Heptadienal | 1016 | Aldehyde | 0.04 ± 0.01 c | 0.02 ± 0.00 c | 0.16 ± 0.02 b | 0.27 ± 0.03 a |
| 5 | 4-Methyl benzaldehyde | 1079 | Aldehyde | 1.33 ± 0.33 a | 0.42 ± 0.01 b | 0.04 ± 0.00 b | 0.05 ± 0.00 b |
| 6 | Linalool | 1101 | Terpene alcohol | 0.25 ± 0.03 a | 0.11 ± 0.01 b | 0.03 ± 0.00 c | 0.02 ± 0.01 c |
| 7 | Isoneral | 1165 | Monoterpene | 0.37 ± 0.01 a | 0.49 ± 0.10 a | 0.11 ± 0.01 b | 0.14 ± 0.01 b |
| 8 | Rose furan oxide | 1178 | Furans | 0.37 ± 0.01 a | 0.49 ± 0.10 a | 0.02 ± 0.01 b | 0.01 ± 0.00 b |
| 9 | Estragole | 1198 | Phenylpropene | 2.14 ± 0.22 a | 1.01 ± 0.11 a | 0.08 ± 0.01 a | 1.66 ± 1.43 a |
| 10 | (Z)-Neral | 1243 | Monoterpene | 40.46 ± 0.30 b | 64.96 ± 6.69 a | 10.56 ± 2.21 c | 5.79 ± 1.74 c |
| 11 | (E)-Nerol | 1258 | Terpene alcohol | 1.65 ± 0.32 ab | 2.40 ± 0.73 a | 0.72 ± 0.13 ab | 0.06 ± 0.01 b |
| 12 | Methyl citronellate | 1262 | Esters | ND 2 | ND | ND | 0.01 ± 0.01 |
| 13 | Geranial | 1272 | Monoterpene | 118.38 ± 2.69 a | 143.62 ± 11.78 a | 22.85 ± 5.01 b | 12.10 ± 3.74 b |
| 14 | Methyl geraniate | 1325 | Monoterpene | 0.05 ± 0.00 b | 0.34 ± 0.04 a | 0.05 ± 0.01 b | 0.04 ± 0.01 b |
| 15 | Caryophyllene | 1423 | Sesquiterpene | 0.19 ± 0.01 b | 0.83 ± 0.11 a | 0.05 ± 0.00 b | ND |
| 16 | (E)-α-Ionone | 1426 | Ketones | 0.07 ± 0.01 b | 0.02 ± 0.00 b | 0.17 ± 0.01 a | 0.04 ± 0.01 b |
| 17 | Nerolidol | 1557 | Terpene alcohol | 0.03 ± 0.00 b | 0.08 ± 0.01 a | ND | ND |
| 18 | γ-Dodecalactone | 1678 | Lactones | 0.03 ± 0.01 a | 0.03 ± 0.01 a | 0.01 ± 0.00 a | 0.02 ± 0.00 a |
| Total | 165.95 ± 4.21 a | 215.58 ± 34.08 a | 35.24 ± 12.63 b | 20.56 ± 11.08 b | |||
| No. | Compound | RI 1 | Classification | DAS | |||
|---|---|---|---|---|---|---|---|
| 30 | 60 | 70 | 80 | ||||
| 1 | (Z)-3-Hexenal | 802 | Aldehyde | 0.04 ± 0.01 | ND | ND | ND |
| 2 | (E)-2-Hexenal | 857 | Aldehyde | 0.45 ± 0.02 a | 0.32 ± 0.06 a | 0.05 ± 0.01 b | 0.07 ± 0.04 b |
| 3 | (E,E)-2,4-Hexadienal | 913 | Aldehyde | 0.04 ± 0.00 | ND | ND | ND |
| 4 | 1-Octen-3-ol | 981 | Fatty alcohol | 0.06 ± 0.01 b | 0.11 ± 0.01 a | 0.02 ± 0.00 c | 0.04 ± 0.00 bc |
| 5 | β-Pinene | 983 | Monoterpene | ND 2 | 0.12 ± 0.01 a | ND | 0.02 ± 0.01 b |
| 6 | β-Myrcene | 993 | Monoterpene | ND | 0.13 ± 0.05 a | ND | 0.02 ± 0.01 b |
| 7 | L-Limonene | 1030 | Monoterpene | ND | 0.14 ± 0.03 | ND | ND |
| 8 | Eucalyptol | 1033 | Monoterpene | 1.61 ± 0.25 b | 5.64 ± 1.34 a | 0.09 ± 0.01 b | 1.22 ± 0.41 b |
| 9 | cis-4-Thujanol | 1072 | Terpene alcohol | 0.11 ± 0.01 a | 0.17 ± 0.03 a | ND | ND |
| 10 | 4-Methyl benzaldehyde | 1079 | Aldehyde | 2.24 ± 0.34 a | ND | 0.33 ± 0.04 b | 0.32 ± 0.04 b |
| 11 | Linalool | 1101 | Terpene alcohol | 4.15 ± 0.46 b | 15.30 ± 1.55 a | 0.85 ± 0.55 b | 15.26 ± 6.71 a |
| 12 | (Z)-Thujone | 1105 | Monoterpene | 0.11 ± 0.02 | ND | ND | ND |
| 13 | L-camphor | 1146 | Monoterpene | 0.18 ± 0.03 b | 0.40 ± 0.02 a | ND | ND |
| 14 | δ-Terpineol | 1167 | Terpene alcohol | 0.24 ± 0.01 a | 0.38 ± 0.06 a | 0.36 ± 0.18 a | 0.14 ± 0.04 a |
| 15 | endo-Borneol | 1169 | Terpene alcohol | ND | ND | 0.05 ± 0.01 a | 0.03 ± 0.01 ab |
| 16 | Terpinen-4-ol | 1179 | Terpene alcohol | 0.05 ± 0.00 b | 0.13 ± 0.03 a | 0.03 ± 0.01 b | 0.04 ± 0.01 b |
| 17 | α-Terpineol | 1192 | Terpene alcohol | 1.26 ± 0.07 b | 2.24 ± 0.30 a | 0.28 ± 0.10 c | 0.78 ± 0.23 bc |
| 18 | Estragole | 1197 | Phenylpropene | 0.22 ± 0.02 b | 3.10 ± 0.22 a | ND | 0.26 ± 0.03 b |
| 19 | (Z)-Neral | 1243 | Monoterpene | ND | 0.58 ± 0.02 a | ND | 0.10 ± 0.09 b |
| 20 | (E)-Neral | 1270 | Monoterpene | ND | 1.04 ± 0.06 a | ND | 0.19 ± 0.17 b |
| 21 | Estragole | 1199 | Terpene alcohol | 0.07 ± 0.01 b | 0.61 ± 0.13 a | ND | 0.04 ± 0.02 b |
| 22 | Eugenol | 1359 | Phenylpropene | 39.38 ± 8.02 a | 54.49 ± 8.44 a | 4.42 ± 3.3 b | 17.06 ± 2.75 b |
| 23 | Methyleugenol | 1409 | Phenylpropene | 165.91 ± 22.84 a | 150.64 ± 33.20 a | 4.42 ± 2.5 b | 5.61 ± 2.56 b |
| 24 | Caryophyllene | 1423 | Sesquiterpene | 0.17 ± 0.07 b | 1.12 ± 0.52 a | ND | 0.17 ± 0.12 b |
| 25 | trans-α-Bergamotene | 1437 | Sesquiterpene | 1.96 ± 0.63 b | 14.78 ± 3.10 a | 0.03 ± 0.01 b | 4.56 ± 2.28 b |
| 26 | (E)-β-Famesene | 1459 | Sesquiterpene | 0.35 ± 0.08 b | 2.19 ± 0.61 a | ND | 0.17 ± 0.05 b |
| 27 | Humulene | 1459 | Sesquiterpene | 0.25 ± 0.12 b | 0.73 ± 0.26 a | ND | 0.16 ± 0.06 b |
| 28 | Methylisoeugenol | 1492 | Phenylpropene | 0.29 ± 0.12 a | 0.31 ± 0.02 a | ND | ND |
| 29 | Guaiene | 1493 | Sesquiterpene | ND | 0.59 ± 0.14 | ND | ND |
| 30 | trans-Calamenene | 1530 | Sesquiterpene | ND | 0.15 ± 0.01 a | ND | 0.03 ± 0.01 b |
| 31 | Nerolidol | 1557 | Terpene alcohol | 0.08 ± 0.02 b | 0.18 ± 0.03 a | ND | 0.05 ± 0.01 bc |
| 32 | T-cadinol | 1643 | Terpene alcohol | 0.89 ± 0.22 b | 2.45 ± 0.37 a | 0.11 ± 0.03 c | 1.49 ± 0.37 b |
| Total | 221.6 ± 17.2 b | 259.0 ± 14.9 a | 11.1 ± 3.8 d | 48.5 ± 7.3 c | |||
| No. | Compound | RI 1 | Classification | DAS | |||
|---|---|---|---|---|---|---|---|
| 30 | 60 | 70 | 80 | ||||
| 1 | (E)-2-Hexenal | 857 | Aldehyde | 0.61 ± 0.17 a | 0.50 ± 0.18 a | 0.11 ± 0.02 b | 0.14 ± 0.05 b |
| 2 | α-Pinene | 939 | Monoterpene | 0.66 ± 0.05 a | 0.25 ± 0.19 b | 0.11 ± 0.07 b | 0.11 ± 0.08 b |
| 3 | Camphene | 953 | Monoterpene | 0.51 ± 0.11 a | 0.31 ± 0.17 b | 0.14 ± 0.07 b | 0.09 ± 0.07 b |
| 4 | 1-Octen-3-ol | 981 | Fatty alcohol | 0.06 ± 0.01 ab | 0.08 ± 0.01 a | 0.03 ± 0.00 b | 0.04 ± 0.02 b |
| 5 | β-Pinene | 983 | Monoterpene | 0.59 ± 0.12 a | 0.48 ± 0.23 ab | 0.17 ± 0.11 b | 0.22 ± 0.12 ab |
| 6 | β-Myrcene | 993 | Monoterpene | 0.49 ± 0.01 a | 0.06 ± 0.02 b | 0.06 ± 0.08 b | 0.11 ± 0.07 b |
| 7 | α-Phellandrene | 1007 | Monoterpene | 0.02 ± 0.00 a | 0.03 ± 0.00 a | 0.03 ± 0.02 a | 0.03 ± 0.04 a |
| 8 | (E,E)-2,4-Heptadienal | 1016 | Aldehyde | 0.01 ± 0.00 a | 0.02 ± 0.00 a | 0.02 ± 0.00 a | 0.03 ± 0.01 a |
| 9 | α-Terpinene | 1019 | Monoterpene | 0.05 ± 0.00 a | 0.05 ± 0.00 a | ND 2 | ND |
| 10 | o-Cymene | 1025 | Monoterpene | 0.05 ± 0.01 a | 0.04 ± 0.01 ab | 0.02 ± 0.01 b | 0.03 ± 0.01 b |
| 11 | Limonene | 1030 | Monoterpene | 0.71 ± 0.09 a | 0.13 ± 0.05 a | 0.09 ± 0.08 a | 0.68 ± 0.61 a |
| 12 | Eucalyptol | 1033 | Monoterpene | 7.40 ± 0.53 a | 5.87 ± 0.79 ab | 2.36 ± 0.33 c | 3.84 ± 2.15 bc |
| 13 | cis-Sabinene hydrate | 1076 | Monoterpene | 0.16 ± 0.01 a | 0.18 ± 0.01 a | 0.06 ± 0.01 b | 0.08 ± 0.03 b |
| 14 | 4-Methyl benzaldehyde | 1079 | Aldehyde | 0.19 ± 0.07 c | 1.49 ± 0.09 a | 0.67 ± 0.18 b | 0.64 ± 0.30 bc |
| 15 | α-Terpinolene | 1089 | Monoterpene | 0.43 ± 0.05 a | 0.31 ± 0.03 b | 0.13 ± 0.01 c | 0.14 ± 0.03 c |
| 16 | Linalool | 1101 | Terpene alcohol | 0.50 ± 0.12 b | 1.18 ± 0.29 a | 0.44 ± 0.07 b | 0.46 ± 0.19 b |
| 17 | (Z)-Thujone | 1105 | Monoterpene | 30.83 ± 4.68 ab | 36.53 ± 3.38 a | 22.81 ± 1.28 b | 32.72 ± 5.40 ab |
| 18 | (E)-Thujone | 1116 | Monoterpene | 7.60± 1.71 a | 4.57 ± 1.06 b | 3.09 ± 0.26 b | 4.06 ± 0.72 b |
| 19 | (+)-Sabinol | 1145 | Terpene alcohol | 0.26 ± 0.06 a | 0.23 ± 0.06 a | 0.13 ± 0.03 a | 0.27 ± 0.08 a |
| 20 | L-camphor | 1146 | Monoterpene | 24.55 ± 2.14 b | 37.77 ± 4.63 a | 9.63 ± 3.37 c | 11.79 ± 1.89 c |
| 21 | Isothujol | 1168 | Terpene alcohol | 0.52 ± 0.24 a | 0.74 ± 0.24 a | 2.47 ± 3.07 a | 0.33 ± 0.04 a |
| 22 | endo-Borneol | 1169 | Terpene alcohol | 0.94 ± 0.12 ab | 2.11 ± 1.22 a | 0.48 ± 0.10 b | 0.45 ± 0.06 b |
| 23 | Terpinen-4-ol | 1179 | Terpene alcohol | 0.34 ± 0.09 b | 0.59 ± 0.07 a | 0.33 ± 0.10 b | 0.29 ± 0.11 b |
| 24 | p-Cymen-8-ol | 1185 | Terpene alcohol | 0.10 ± 0.01 ab | 0.11 ± 0.04 a | 0.04 ± 0.00 b | 0.04 ± 0.00 b |
| 25 | α-Terpineol | 1192 | Terpene alcohol | 0.40 ± 0.04 b | 0.64 ± 0.16 a | 0.20 ± 0.06 b | 0.26 ± 0.06 b |
| 26 | Estragole | 1198 | Phenylpropene | 0.66 ± 0.10 b | 3.24 ± 1.13 a | 1.06 ± 0.36 b | 0.58 ± 0.11 b |
| 27 | (E)-Carveol | 1219 | Terpene alcohol | 0.15 ± 0.01 ab | 0.18 ± 0.07 a | 0.04 ± 0.02 b | 0.07 ± 0.05 ab |
| 28 | (Z)-Neral | 1243 | Monoterpene | 0.23 ± 0.03 a | 0.18 ± 0.01 ab | 0.10 ± 0.07 bc | 0.03 ± 0.01 c |
| 29 | (E)-Neral | 1270 | Monoterpene | 0.52 ± 0.07 a | 0.40 ± 0.04 a | 0.19 ± 0.11 b | 0.03 ± 0.00 b |
| 30 | (−)-Bornyl acetate | 1286 | Terpene alcohol | 2.11 ± 0.70 a | 2.70 ± 0.57 a | 0.60 ± 0.17 b | 0.43 ± 0.10 b |
| 31 | Methyleugenol | 1409 | Phenylpropene | ND | 0.36 ± 0.08 a | 0.11 ± 0.03 b | 0.06 ± 0.03 b |
| 32 | Caryophyllene | 1423 | Sesquiterpene | 1.18 ± 0.10 a | 1.86 ± 0.42 a | 1.48 ± 0.28 a | 1.41 ± 0.16 a |
| 33 | Humulene | 1459 | Sesquiterpene | 8.34 ± 1.07 a | 16.13 ± 6.26 a | 7.83 ± 0.63 a | 10.43 ± 0.91 a |
| 34 | (+)-Viridiflorol | 1595 | Terpene alcohol | 3.26 ± 0.43 b | 9.15 ± 0.62 a | 6.48 ± 2.01 ab | 6.00 ± 1.34 ab |
| Total | 94.45 ± 7.54 a | 128.47 ± 8.49 a | 61.51 ± 3.38 b | 75.89 ± 12.75 b | |||
Disclaimer/Publisher’s Note: The statements, opinions and data contained in all publications are solely those of the individual author(s) and contributor(s) and not of MDPI and/or the editor(s). MDPI and/or the editor(s) disclaim responsibility for any injury to people or property resulting from any ideas, methods, instructions or products referred to in the content. |
© 2023 by the authors. Licensee MDPI, Basel, Switzerland. This article is an open access article distributed under the terms and conditions of the Creative Commons Attribution (CC BY) license (https://creativecommons.org/licenses/by/4.0/).
Share and Cite
Ryu, D.-H.; Cho, J.-Y.; Yang, S.-H.; Kim, H.-Y. Effects of Harvest Timing on Phytochemical Composition in Lamiaceae Plants under an Environment-Controlled System. Antioxidants 2023, 12, 1909. https://doi.org/10.3390/antiox12111909
Ryu D-H, Cho J-Y, Yang S-H, Kim H-Y. Effects of Harvest Timing on Phytochemical Composition in Lamiaceae Plants under an Environment-Controlled System. Antioxidants. 2023; 12(11):1909. https://doi.org/10.3390/antiox12111909
Chicago/Turabian StyleRyu, Da-Hye, Jwa-Yeong Cho, Seung-Hoon Yang, and Ho-Youn Kim. 2023. "Effects of Harvest Timing on Phytochemical Composition in Lamiaceae Plants under an Environment-Controlled System" Antioxidants 12, no. 11: 1909. https://doi.org/10.3390/antiox12111909
APA StyleRyu, D.-H., Cho, J.-Y., Yang, S.-H., & Kim, H.-Y. (2023). Effects of Harvest Timing on Phytochemical Composition in Lamiaceae Plants under an Environment-Controlled System. Antioxidants, 12(11), 1909. https://doi.org/10.3390/antiox12111909