1. Introduction
Acid dissociation constants (K
a, pK
a = −log K
a) are crucial physico-chemical quantities that impact chemical, environmental, and biochemical research [
1,
2,
3,
4,
5,
6]. Biochemical kinetic and thermodynamic studies involving acids require the calculation of molar fractions or Gibbs free energies of reaction at physiological pH for which aqueous pK
a values are necessary [
7,
8,
9,
10,
11]. Accurate predictions of aqueous pK
a values can also be used to predict pK
a values in non-aqueous environments [
12]. The quest for determining reliable aqueous pK
a values for complex phenolic compounds, including cannabinoids, has been motivated by our antioxidant studies on this family of compounds.
Choosing the best methods for obtaining reliable experimental pK
a values can be challenging (due to low solubility, difficulty isolating, high reactivity, and variable ionic strength solutions) and time consuming [
13,
14,
15]. Hence, theoretical calculations are a promising alternative. A traditional methodology uses thermodynamic cycles [
14,
15,
16,
17,
18,
19], which combine experimental or calculated ab initio gas phase Gibbs free energies with calculated solution Gibbs free energies. Another approach uses the dissociation equilibrium, HA
(aq) ⇌ A
−(aq) + H
+(aq), and requires experimental data for H
+, which is quite variable [
14,
15,
20,
21]. Other acid-base equilibria can be applied as well, relative to a reference acid whose experimental pK
a is required [
22,
23]. Alternatively, various linear correlations between calculated properties (in the gas phase or in solution) and experimental pK
a values have shown to have important predictive value [
24,
25,
26,
27,
28]. The application of density functional theory methods combined with continuum solvation methods such as SMD (solvent model based on density) or PCM (polarizable continuum model) is a practical approach for estimating properties in solution. However, in some cases explicit solute molecules are required in addition to the continuum, especially around charged species, to achieve good results [
29,
30,
31].
Phenolic molecules are ubiquitous in the human body, as well as in nature [
32]. Examples of endogenous phenolic molecules that play a crucial role are the neurotransmitters serotonin and dopamine and the thyroid hormones and estradiol [
33,
34]. Other phenolic natural products have made it into the modern-day pharmacopeia: aspirin is sourced from the bark of the willow tree [
35], and morphine is an alkaloid present in the opium poppy [
36]. Other classes of phenolic molecules include cannabinoids, flavonoids, catechins, and polyphenols, which have shown promising pharmacological properties, including antioxidant activity [
32,
37].
Previous theoretical studies have focused on the aqueous pK
a determination of phenols [
23,
31,
38]. Thapa and Schlegel’s best results include three explicit water molecules surrounding the –OH and –O
– groups in the acids and conjugate bases, respectively (HA∙3H
2O
(aq) ⇌ A
−∙3H
2O
(aq) + H
+(aq)), while working at the B3LYP(SMD)/6-311++G(d,p) level of theory [
31]. They achieved mean absolute (MAE) and signed errors (MSE) of 0.45 and −0.02 pK
a units, respectively. It is important to note that the set of twenty-five phenols they considered (with pK
a values ranging from 7.66 to 10.30) does not include nitrophenols nor 2-substituted phenols, which are compounds we are interested in studying. An earlier study by Galano’s group in 2011 focused on four large phenolic derivatives (acetaminophen, profadol, tapentadol, and ketobemidone) and explored calculations using twenty-two reaction schemes and nine functionals combined with the PCM solvation method (applied through single-point energy calculations) with up to seven explicit solvent molecules [
23]. They recommended the reaction scheme HA + OH
− (3H
2O) ⇌ A
− (H
2O) + 3H
2O, and their best results were obtained with the PBE0 (MAE = 0.77), TPSS (MAE = 0.82), BHandHLYP (MAE = 0.82), and B3LYP (MAE = 0.86) functionals, using the Gaussian03’s PCM implementation in single-point calculations. In the absence of experimental values, calculations were tested relative to theoretical predictions made with the ACD/Laboratories Software [
39]. In a newer publication, that came to our attention after our calculations had finished, Galano et al. reported an extensive study (also considering carboxylic acids and amines) that applied 74 levels of theory (all with the SMD solvation model) to a set of twenty simple phenols covering a pK
a range from 6.33 to 10.31. Their recommended predictive approach requires the Gibbs energy difference between an acid and its conjugate base and can produce MAE less than 0.35 pK
a units for 98.6% of the ten simple phenols they tested [
38]. The correlation equations reported, which they have applied in several studies [
40,
41], are yet to be evaluated with phenols that are more complex for which experimental data exist. We will be referring to the results obtained by these studies and will test their predictive capabilities alongside our work.
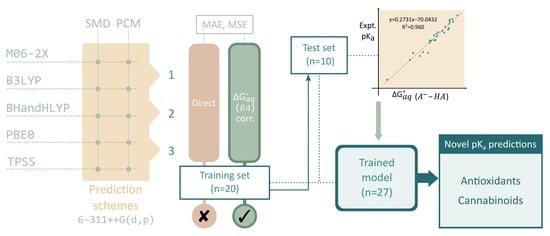
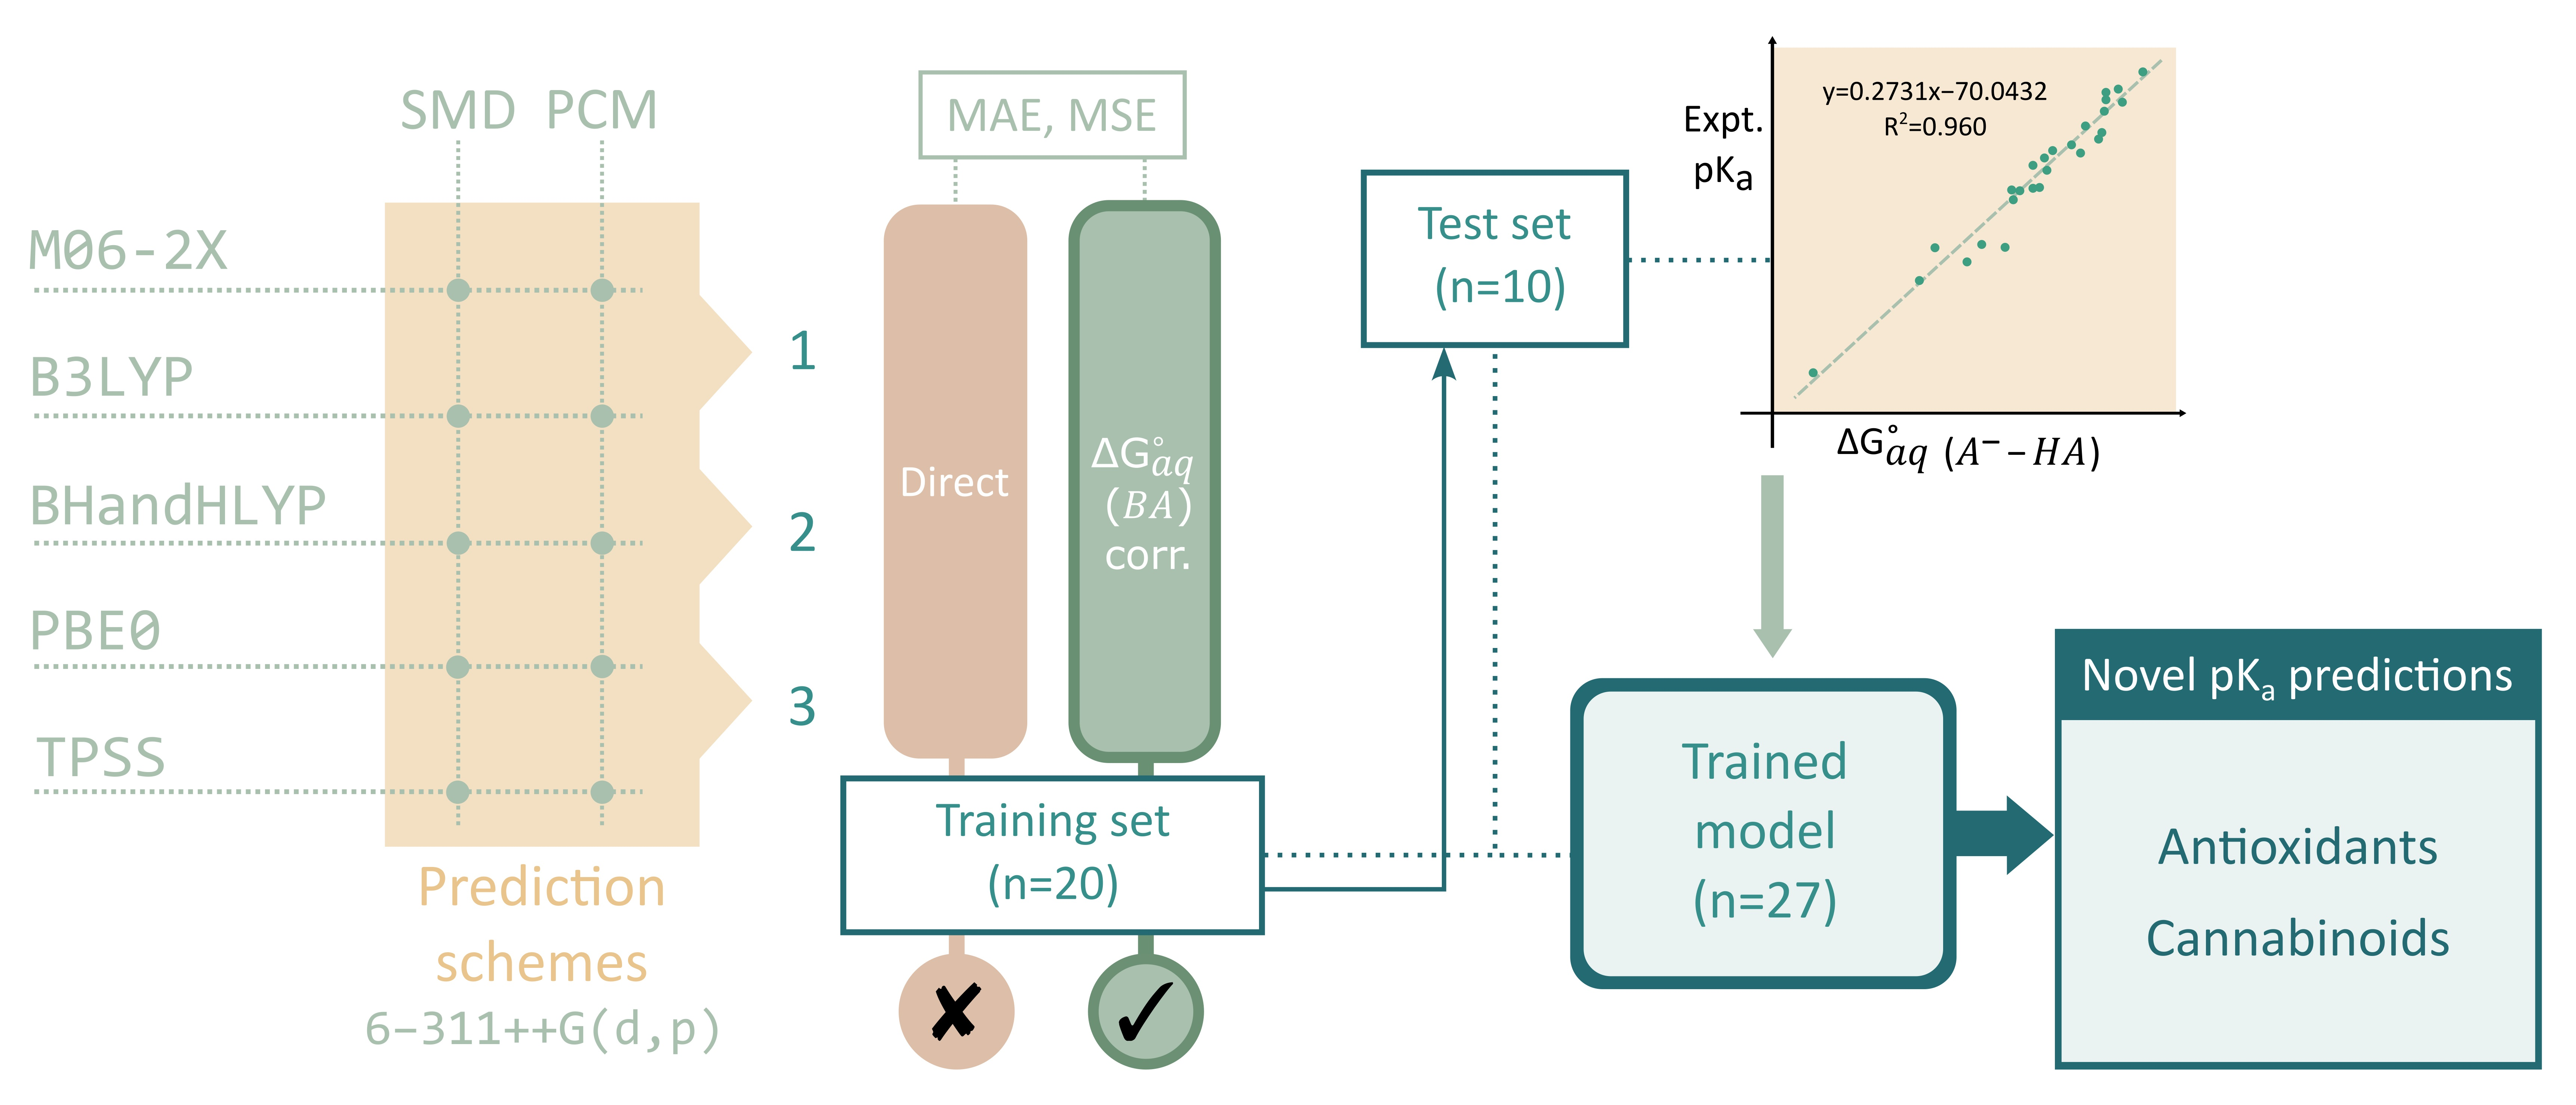
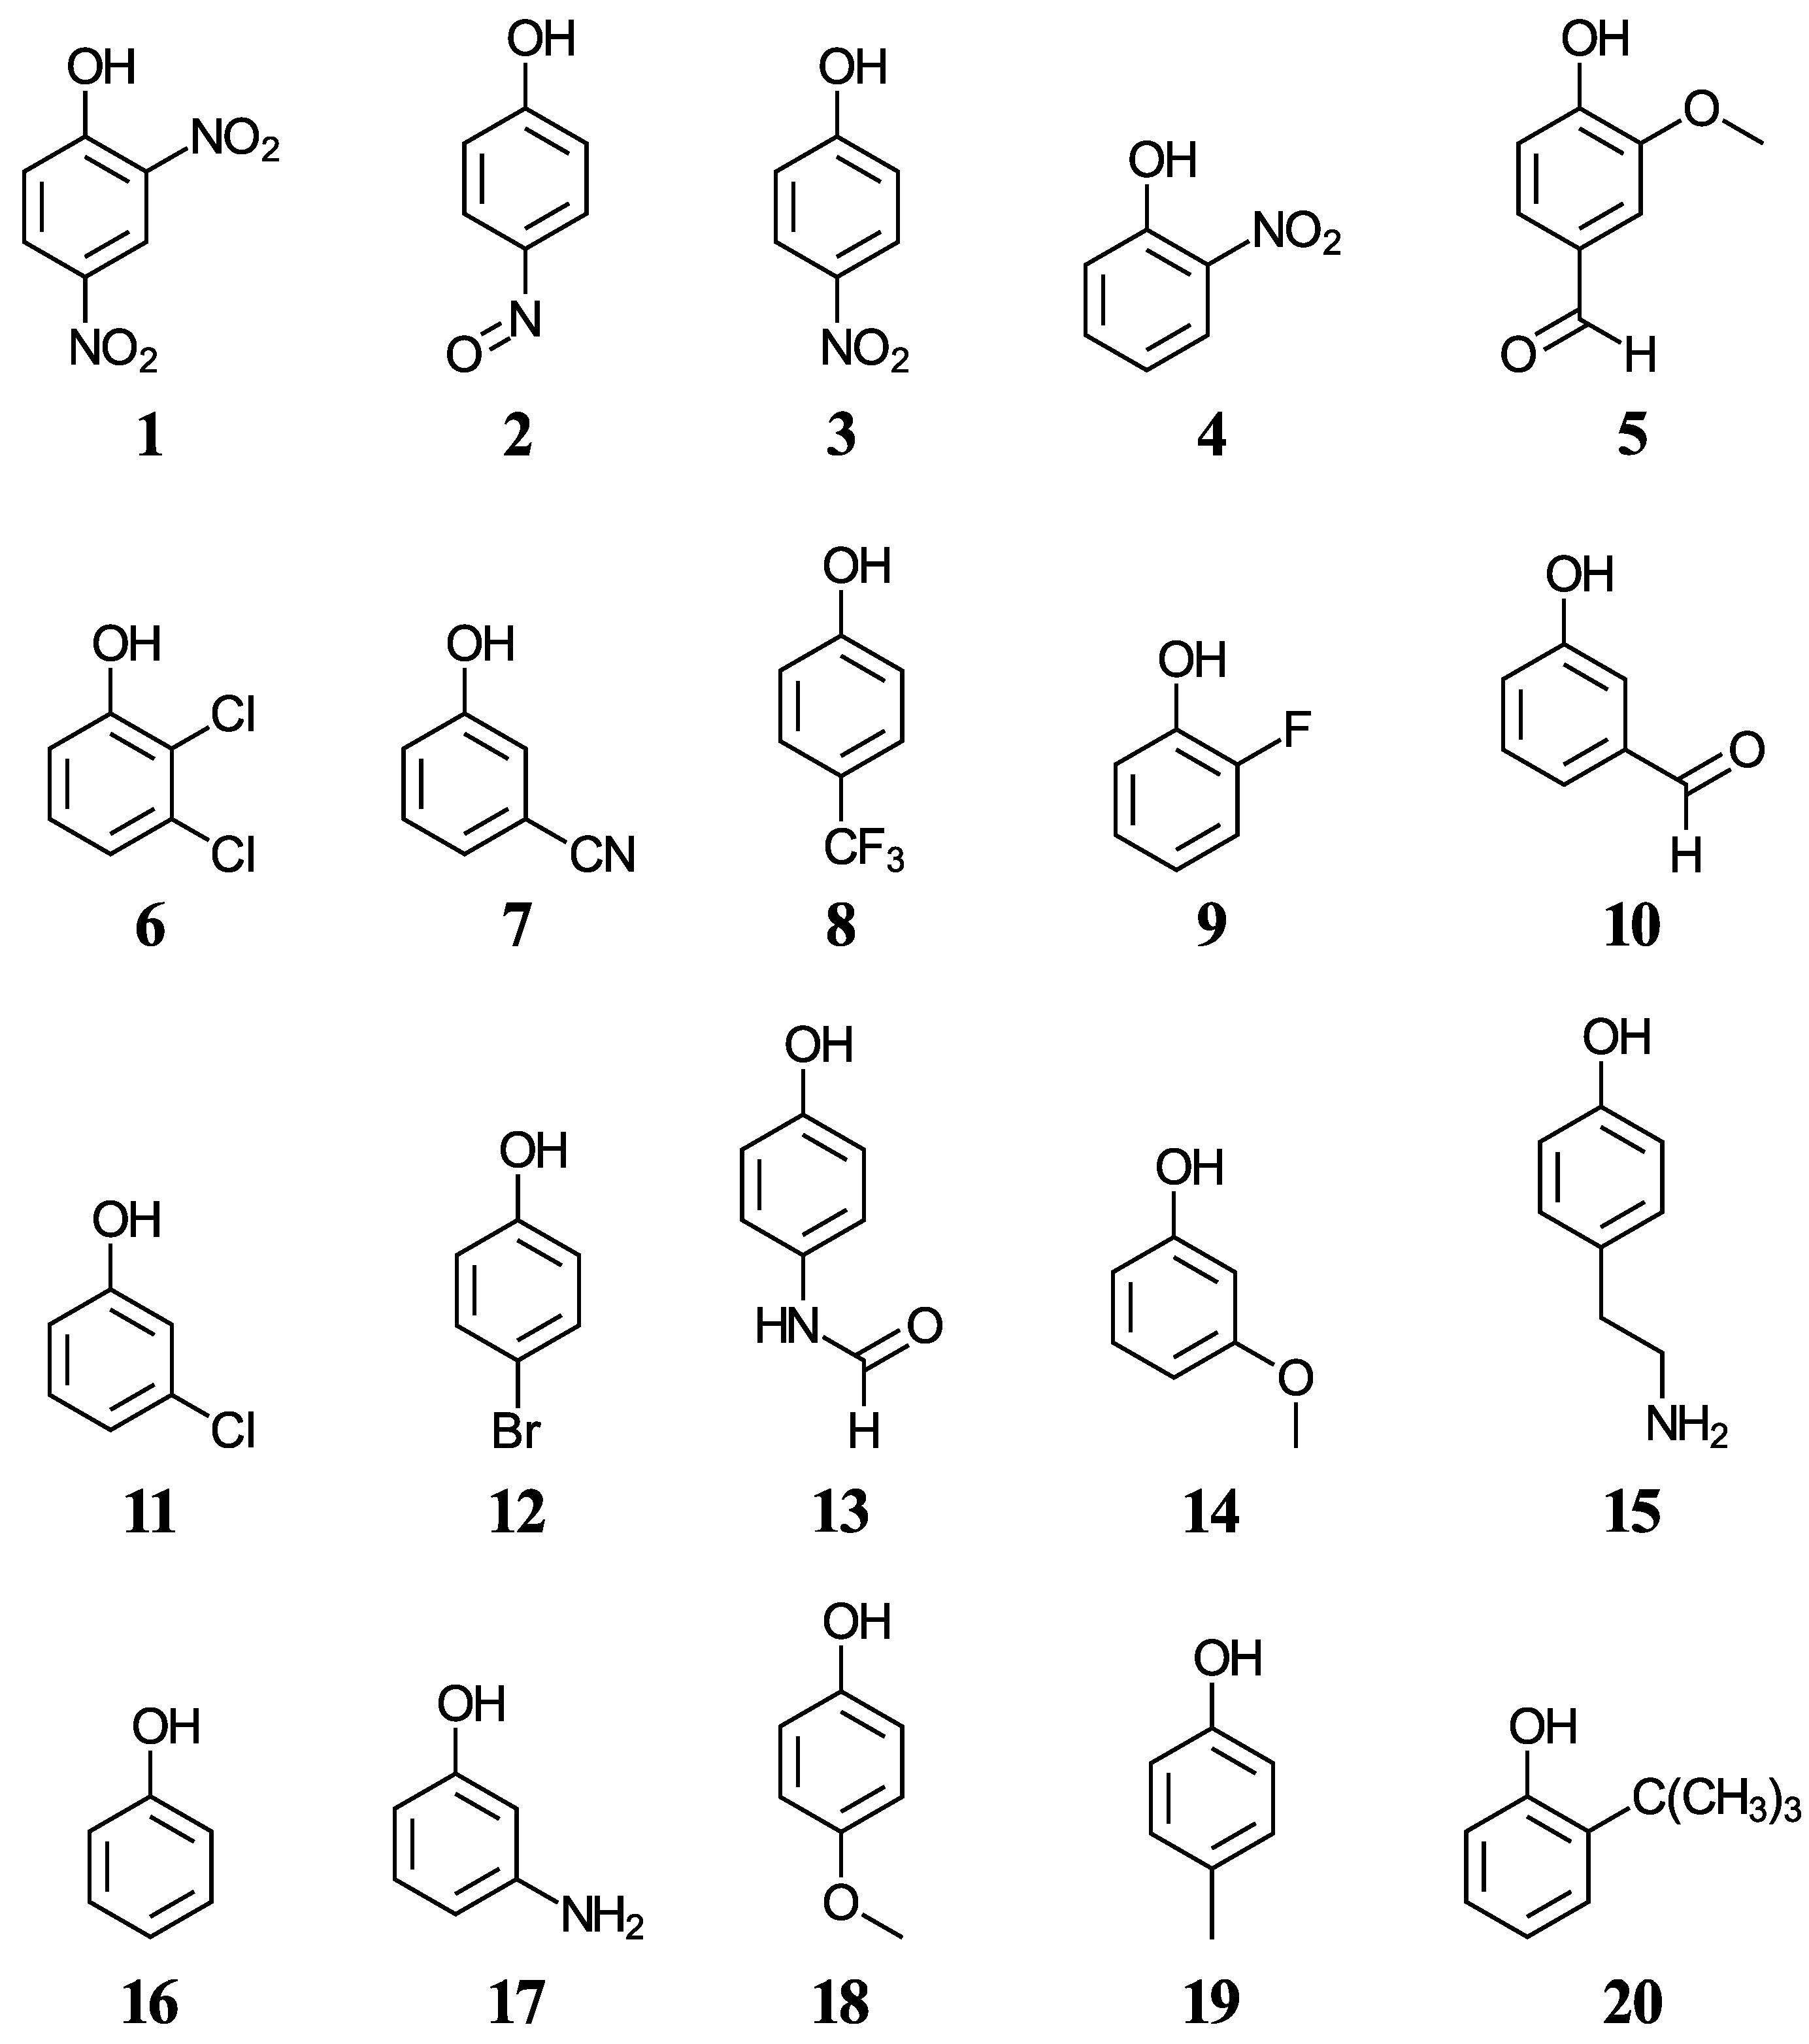
We have selected twenty simple phenols ((
1–
20), displayed in
Figure 1) containing a variety of functional groups with experimental aqueous pK
a values in the range from 4.07 to 10.62 [
42,
43,
44], with the objective to develop a methodology for the accurate pK
a determination of more complex phenols including cannabinoids. Five functionals, two solvation methods, and three acid-base dissociation equilibria will help us test the accuracy of the direct aqueous pK
a calculations. Various correlations to experimental data will also be considered.
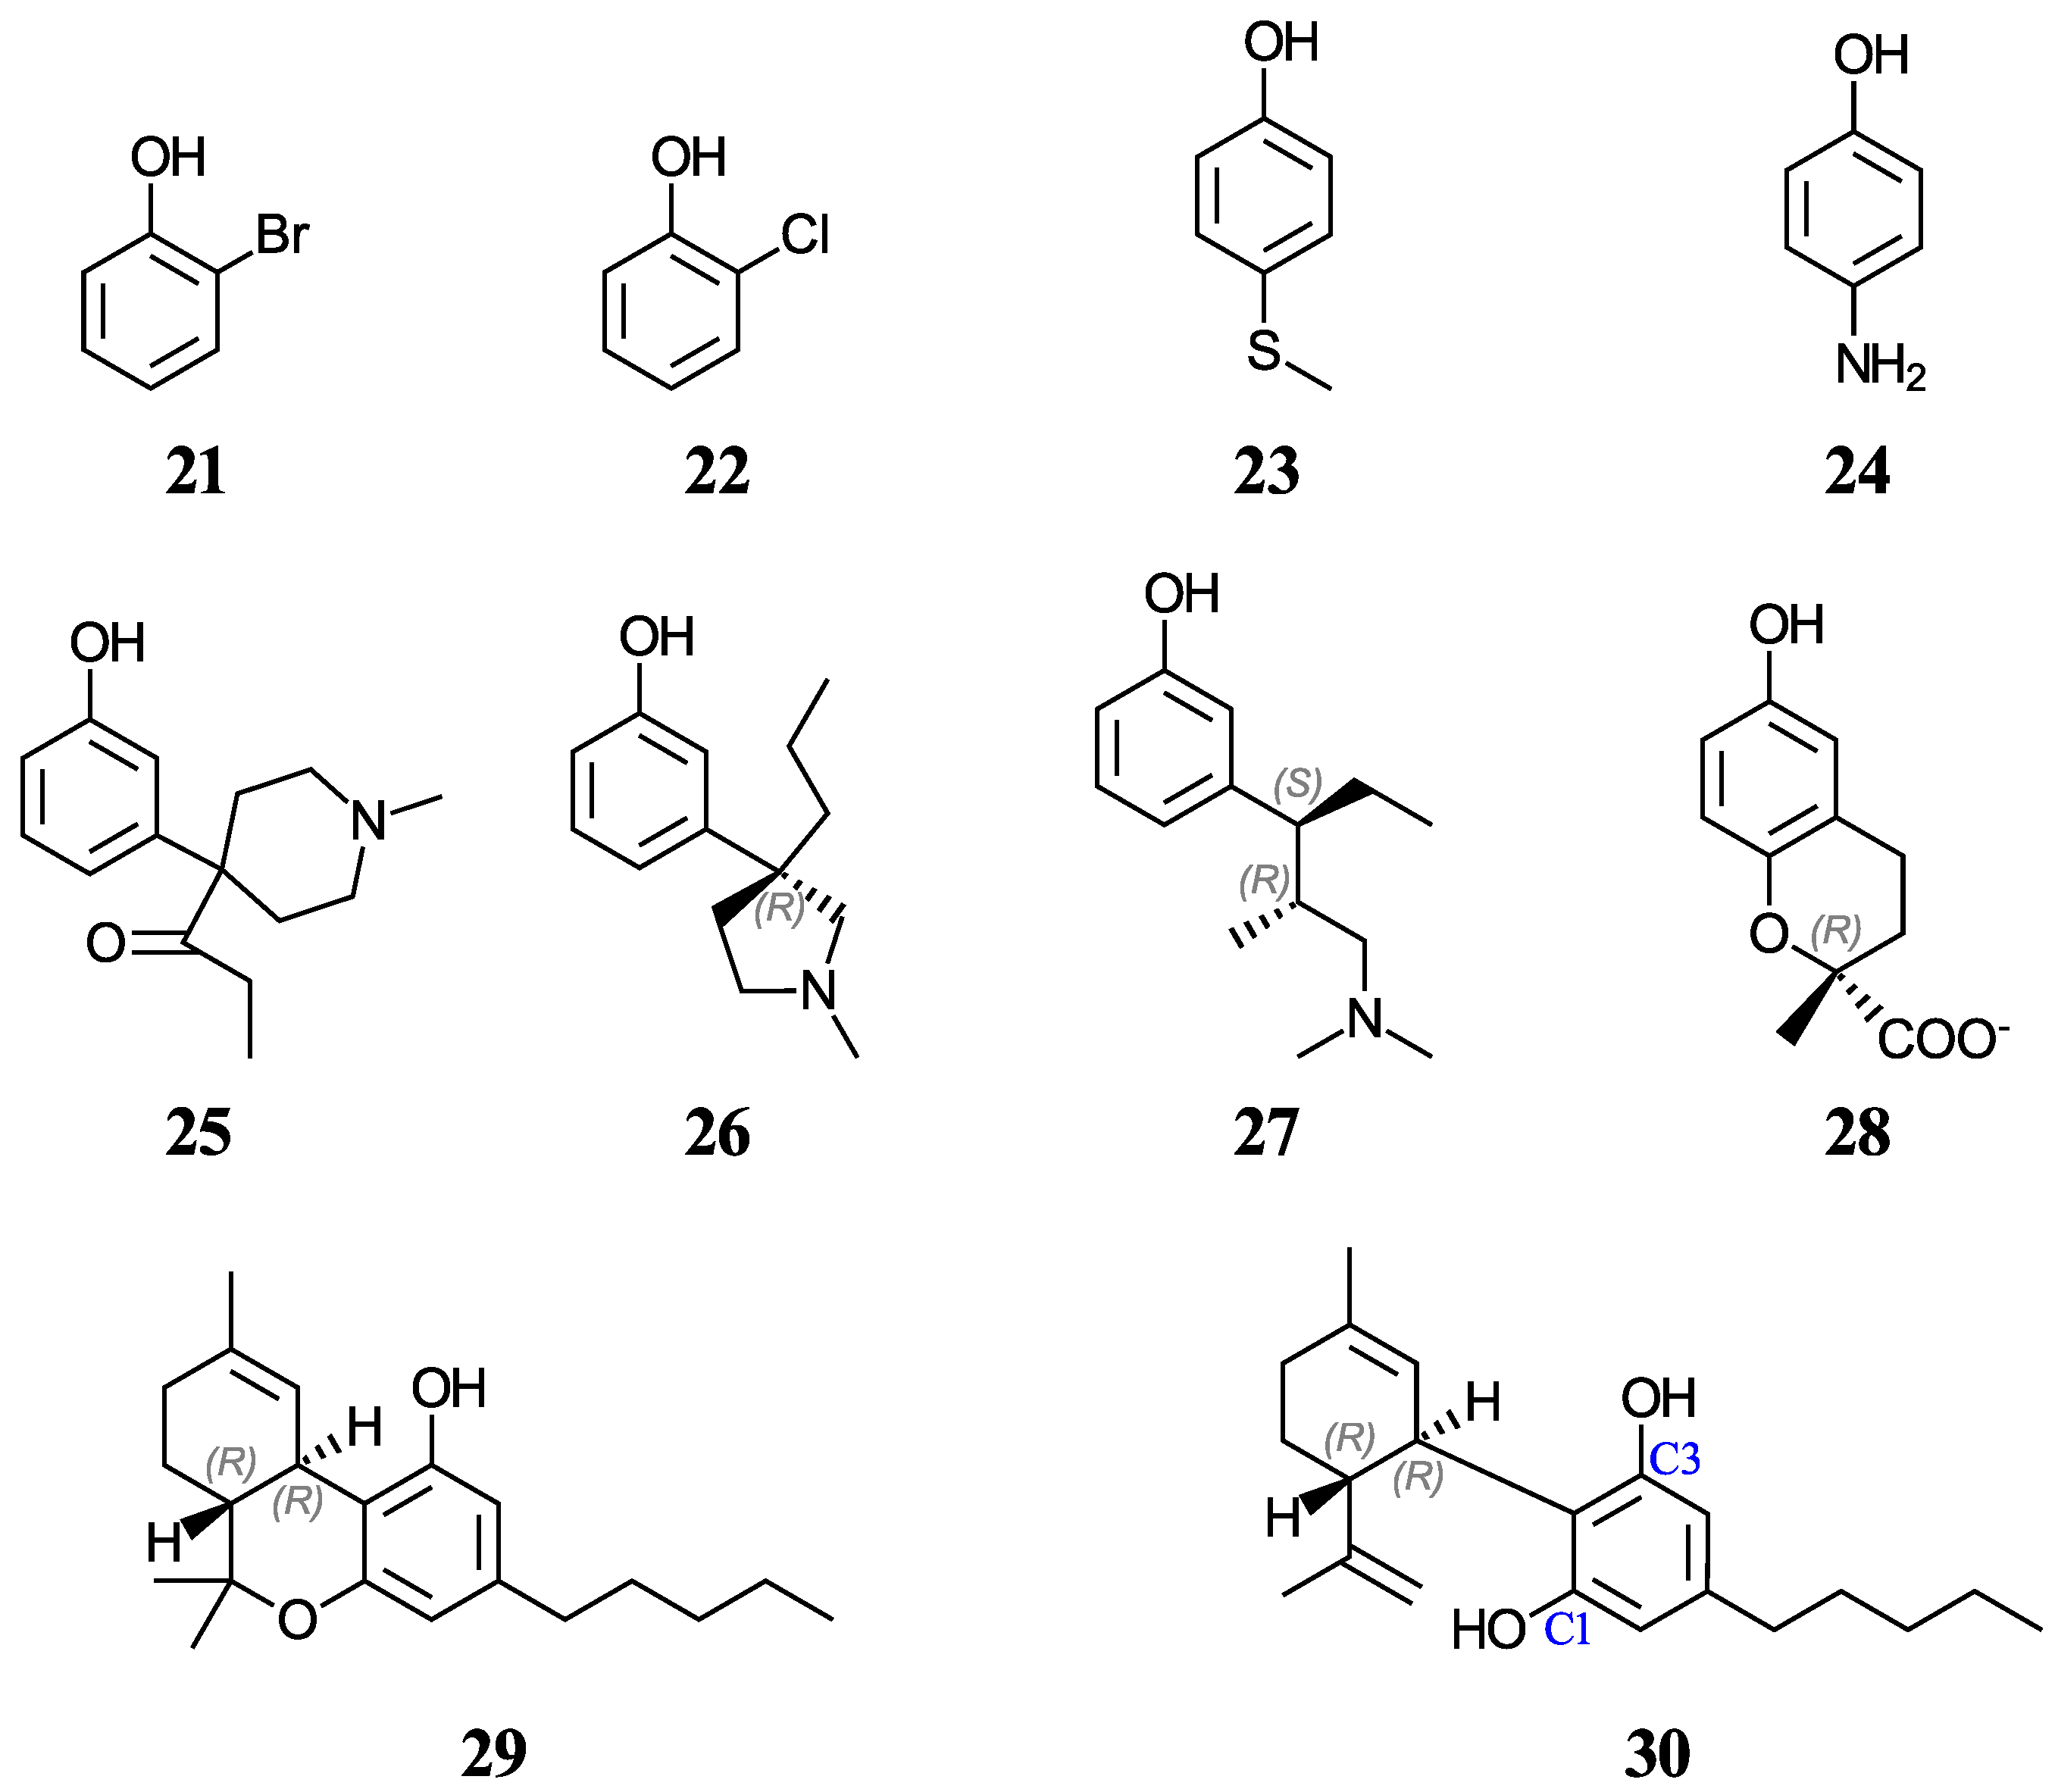
Another group of ten phenols ((
21–
30), displayed in
Figure 2) is used as an independent test set to compare our predictions to previously reported experimental or theoretical aqueous pK
a values. This test group includes six complex phenols. The best methodologies are later used to predict the aqueous pK
a values of complex phenols with potential antioxidant properties that are currently under study by our group [
45,
46,
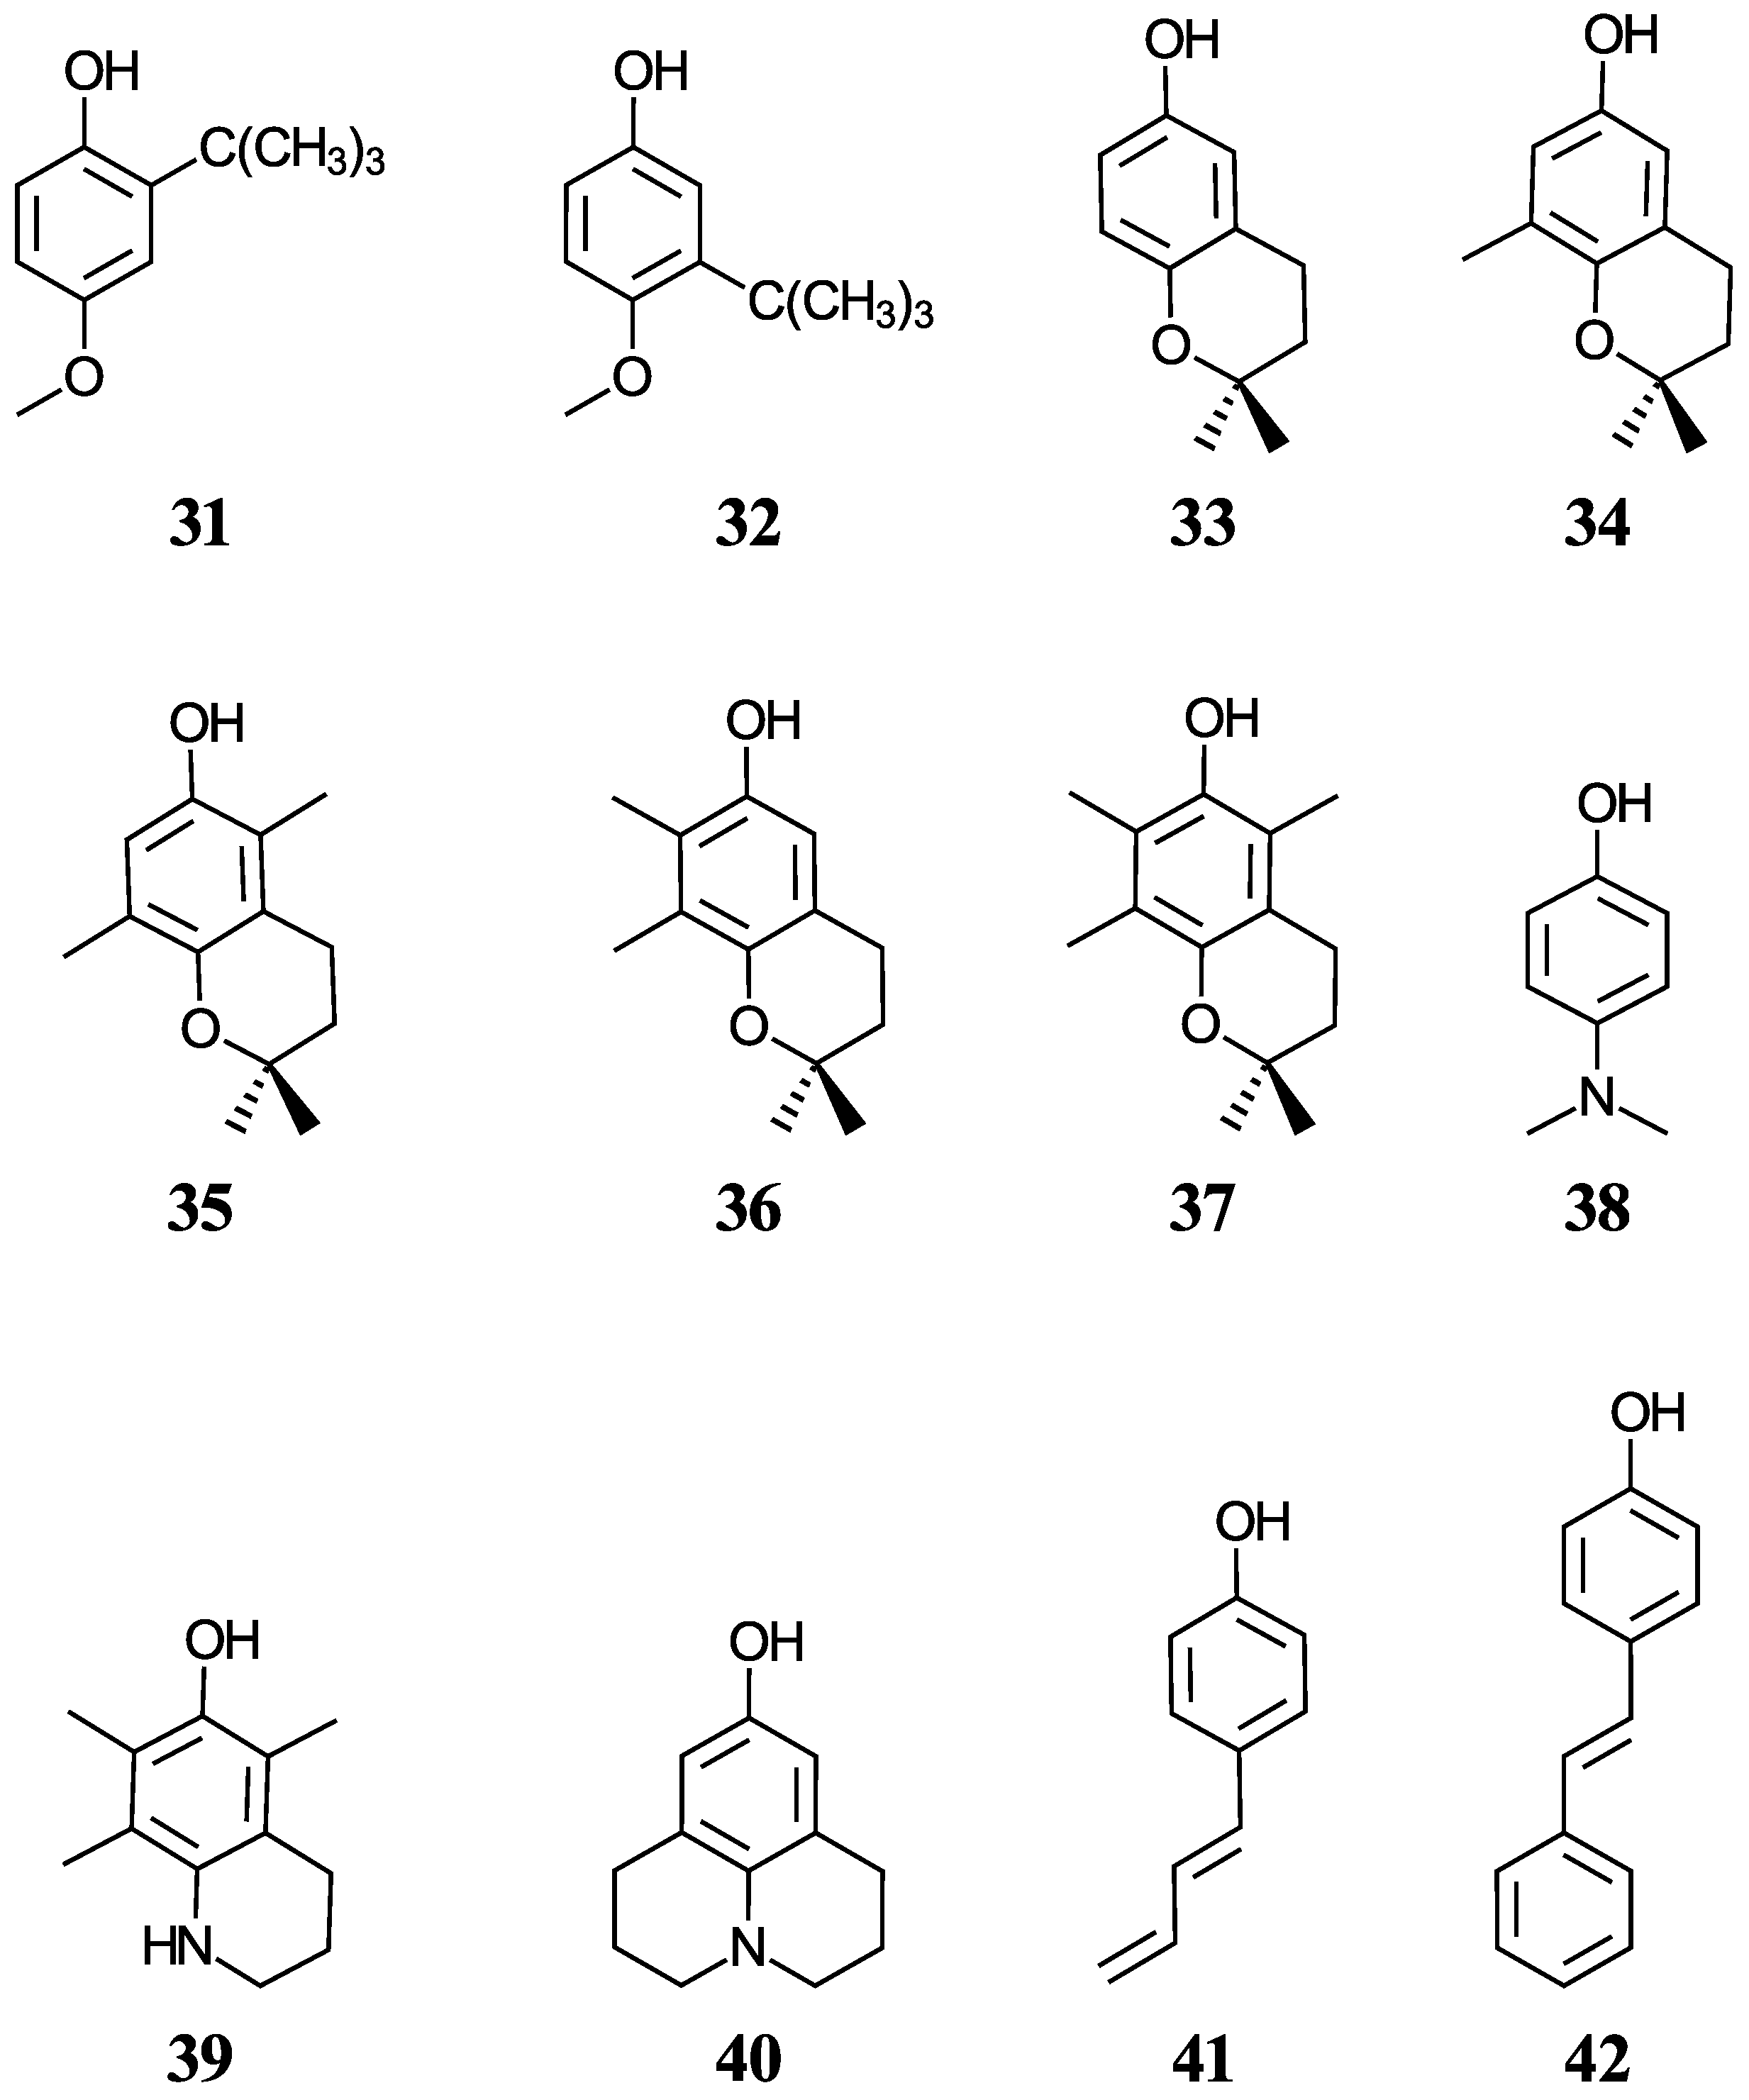
47]. This group of compounds ((
31–
42), shown in
Figure 3) includes food additives (
31 and
32) [
48], vitamin E analogues (
33–
37) which have a methyl group in place of the phytyl tail (C
16H
33) due to the tail’s small impact on local properties such as acidity [
49], aminophenols (
38–
40) used in cosmetics, dyes, and photographic developers [
50,
51], and stilbenes related to resveratrol (
41 and
42) [
49].
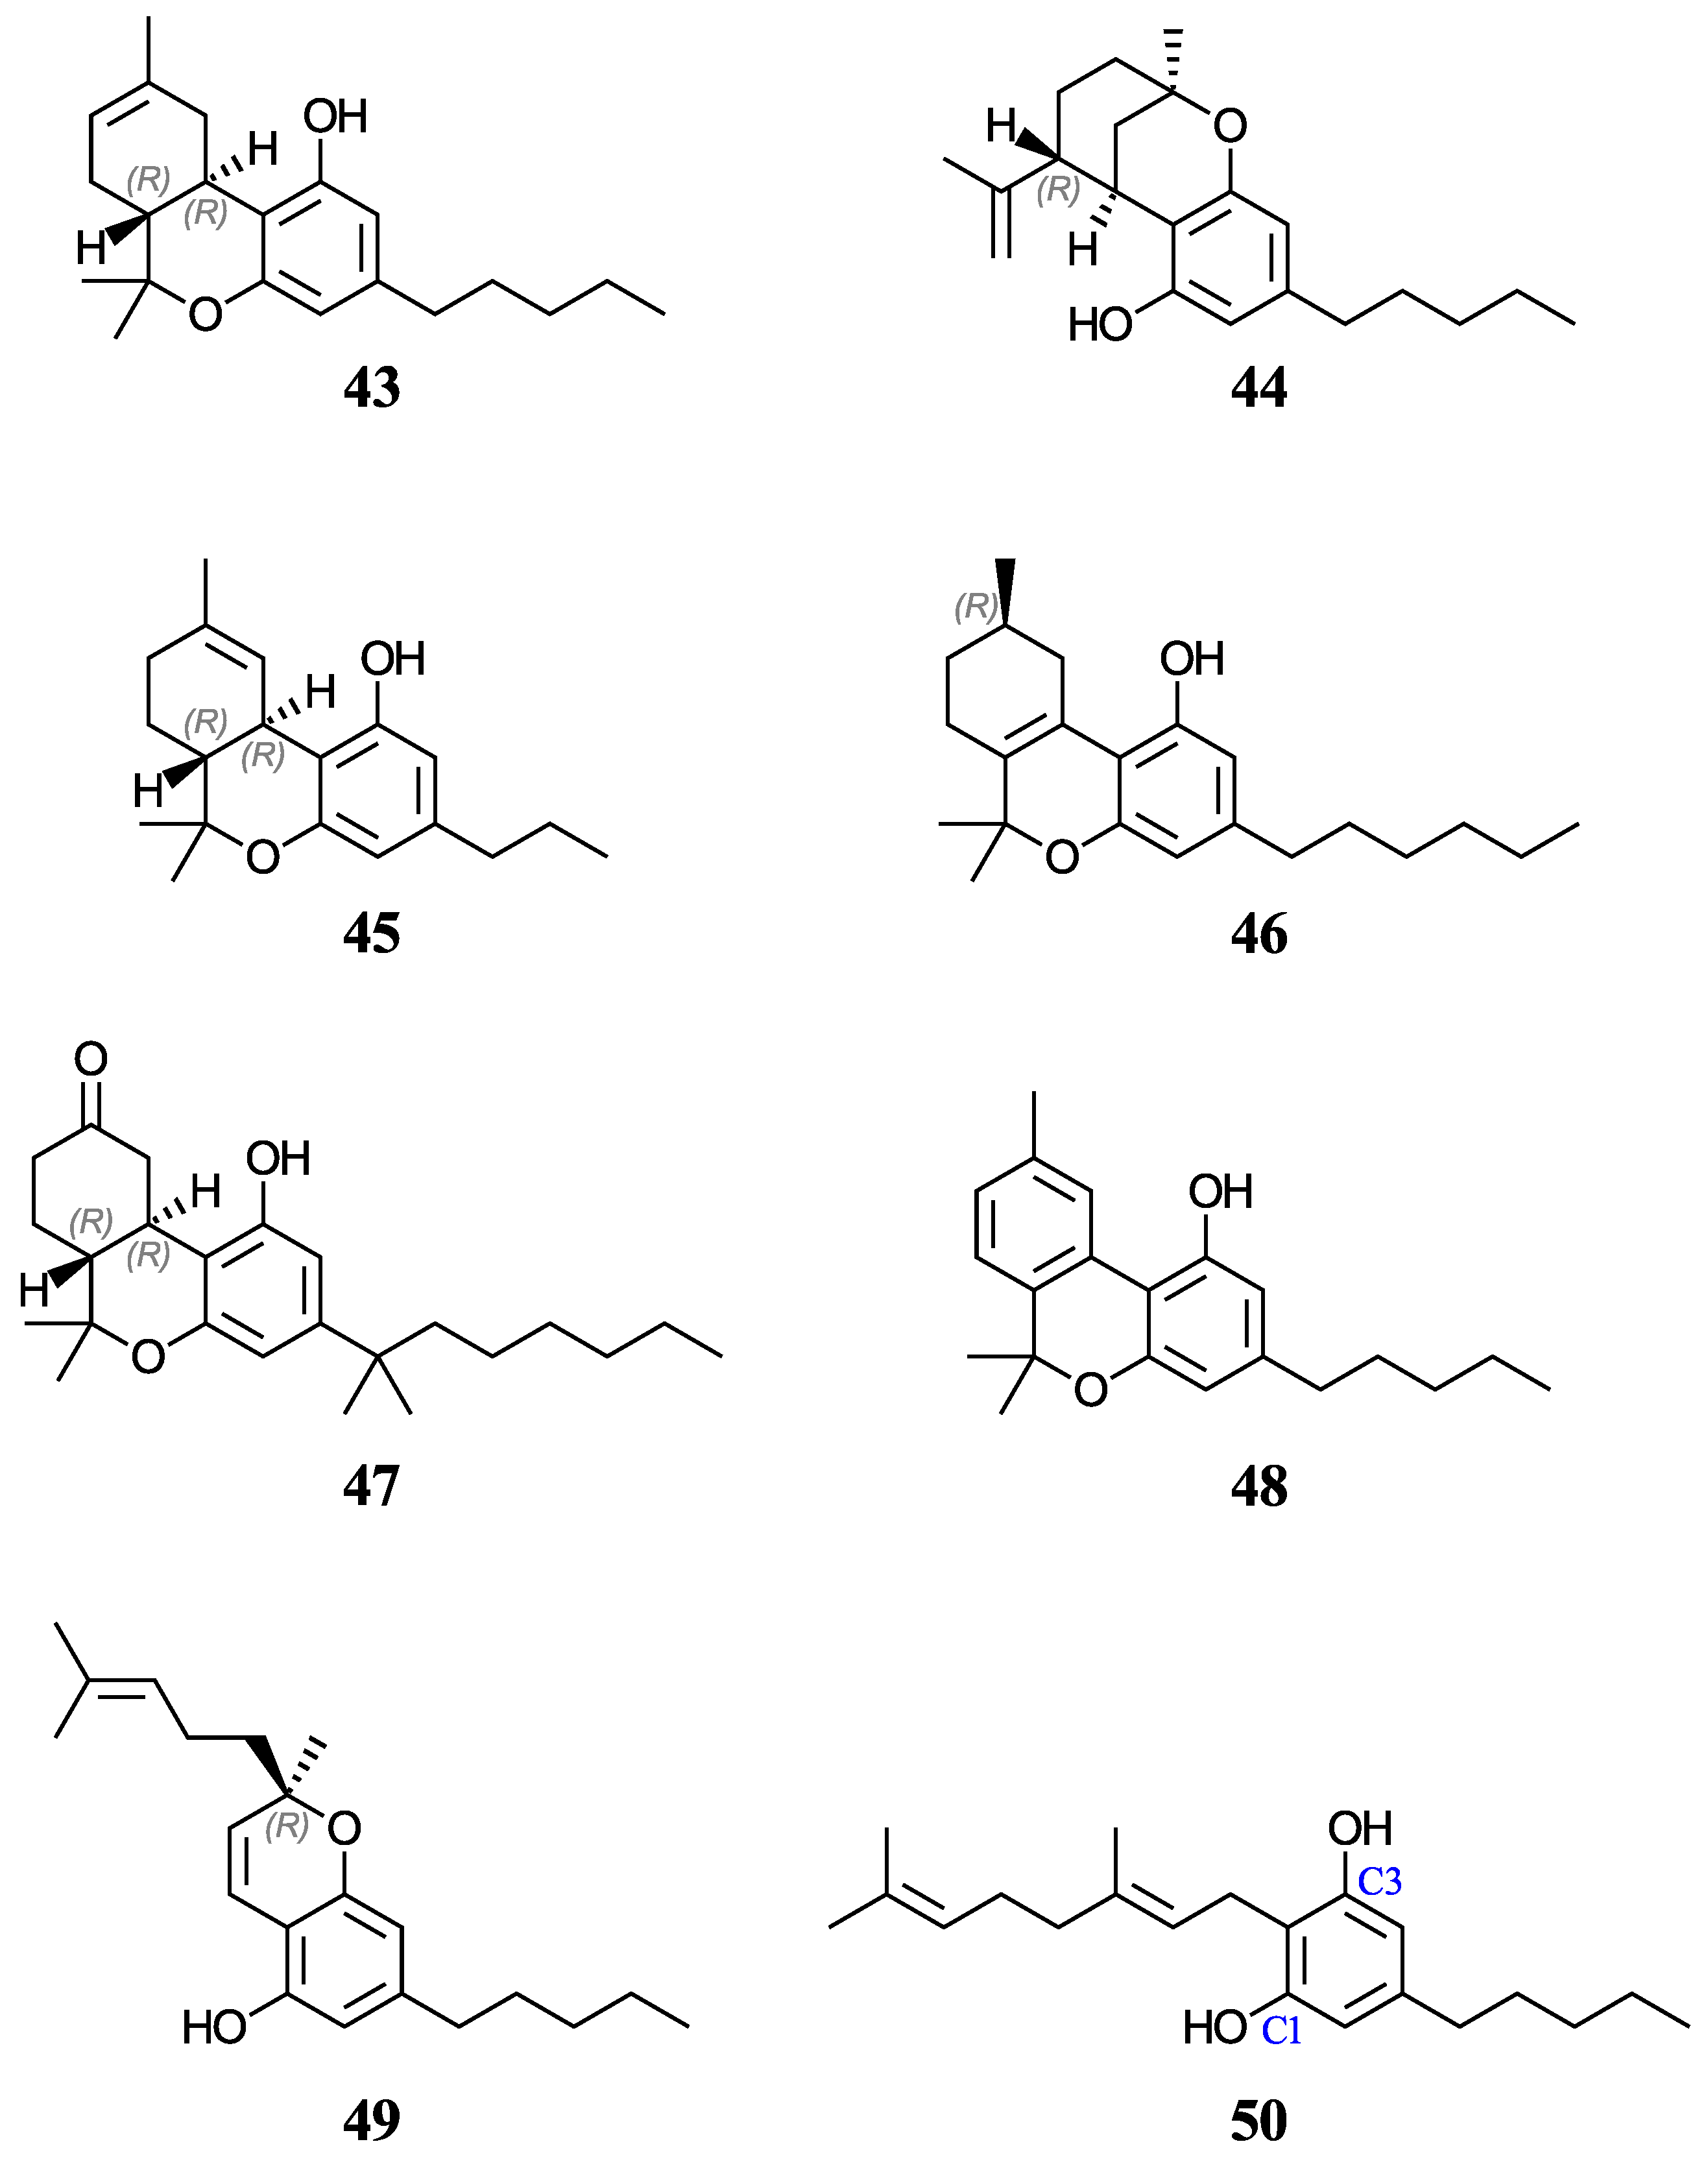
Furthermore, aqueous pK
a predictions will also be made for of a set of nine cannabinoids displayed in
Figure 4. Cannabinoids are phytochemicals found in the Cannabis plant [
52]; nevertheless, this term is also used for any substance which interacts with the endocannabinoid system, including drugs that bear no resemblance to plant-derived cannabinoids [
53]. Given the current pharmacological interest, inherent legalities, and little data available for cannabinoids, we thought that it would be appropriate to investigate these molecules that also have a phenol ring in their basic structure. Increasing evidence indicates that certain cannabinoids are effective antioxidants, in addition to their therapeutic uses [
54,
55,
56,
57,
58,
59]. For this study, we have chosen eight phytocannabinoids (
29,
30,
43–
45, and
48–
50), which are important components in the
Cannabis sativa plant, and two synthetic cannabinoids (
46 and
47), all of which are being investigated for potential therapeutic uses. The test set includes ∆
9-tetrahydrocannabinol (∆
9-THC,
29) and cannabidiol (CBD,
30), which have an experimental and a predicted aqueous pK
a value reported, respectively. For molecules with stereocenters, labels have been added to identify the stereoisomer used in each case (see
Figure 2 and
Figure 4), although the calculated pK
a is not affected by this.
2. Computational Methodology
Calculations were performed with the Gaussian16 software package [
60]. Five DFT functionals were applied with the 6-311++G(d,p) basis set: M06-2X, B3LYP, BHandHLYP, PBE0, and TPSSTPSS (referred to as TPSS). These functionals were chosen based on their performance in previous pK
a studies of phenols [
23,
31,
38]. The aqueous environment was modelled by two widely used continuum methods, the Integral Equation Formalism Polarizable Continuum Model [
61,
62,
63,
64] (IEFPCM, with the solute cavities built by the united atom for Hartree–Fock model; radii = UAHF) [
65] and the Solvation Model based on Density (SMD) [
66]. The default implementation of IEFPCM (referred to as PCM) in Gaussian16, unlike SMD, neglects explicit non-electrostatic energy contribution terms (e.g., cavity formation, dispersion, and repulsion terms).
Geometry optimizations were followed by a frequency calculation, both including solvent effects, at the same level of theory to determine the nature of the stationary points, and all structures were confirmed to be local minima in which no imaginary frequencies were present. Given that the conformation used for an acid and its conjugate base can greatly affect the calculated pK
a value [
67], every effort was made to ensure the most stable conformer was optimized in each case. For example, in 2-substituted halogen groups (molecules
6,
9,
21, and
22), SMD typically favoured the OH facing the halogen while PCM favoured the opposite case. Additionally, the pK
a of the (amino) protonated form of molecules
15,
17, and
24–
27 was computed to assess the possibility of concurrent microequilibria, of which none were considered significant. The optimized structures of all the species considered in this study at the M06-2X(SMD)/6-311++G(d,p) level of theory are provided in the Supporting Information. The absolute aqueous Gibbs free energies of the different species considered in this study at the various levels of theory at 298.15 K are reported in
Tables S1–S5 of the Supporting Information.
This study explores three aqueous acid-base dissociation equilibria (Reactions (R1)–(R3), shown below as (R1)–(R3)) for calculating the absolute pK
a value of an acid, HA, whose conjugate base is A
−. Reactions (R1) and (R3) are standard ones used in theoretical pK
a determinations and, together with Reaction (R2), have produced reasonable results for phenolic molecules [
23].
Reaction (R1) requires an experimental aqueous Gibbs free energy value for H
+ to be combined with the calculated aqueous
values of HA and A
−. Even though several values have been reported and used in calculations, we have chosen to work with −270.29 kcal/mol [
20,
23,
30,
31,
38], because it has been corrected for the 1 M reference state and it has sometimes led to a good reproducibility of experimental aqueous pK
a values.
Reaction (R2) includes explicit water molecules solvating the anions, which attempts to simulate the solute–solvent interactions that are not fully modelled in the implicit solvation models used. Hydrogen bonding between a water molecule and the conjugate base in A
− (H
2O) can significantly stabilize the charged species. The species OH
− (3H
2O) is the OH
− ion solvated by three water molecules, while the species indicated as 3H
2O is a water cluster of three molecules. The concentration of water used is 55.55 mol/L [
23].
Reaction (R3) involves a reference acid similar in structure to the acid studied for which a reliable pKa value is available. For all molecules except phenol, phenol was used as the reference acid (experimental pKa = 9.99). For the determination of phenol, 3-methoxyphenol was used as the reference acid (experimental pKa = 9.65).
The uneven distribution of charges across the equilibrium of Reaction (R1) makes this approach more prone to errors. Reactions (R2) and (R3) do not encounter this difficulty since both sides of their equilibria are balanced in terms of charges, thus contributing to better results due to the cancellation of errors. Reactions (R1)–(R3) contain the same number of computed reactant and product species; thus, reference state conversions are not needed.
Molecules
30 and
50 both contain two equivalent deprotonation sites through rotation of the sigma bond connecting the benzene ring to its substituent. As a result, the acid equilibrium constant should be doubled [
68]. Accordingly, pK
a values for molecules
30 and
50 must be corrected by subtracting log(2) from their respective calculated values using Reactions (R1)–(R3) or the correlation equations [
38]. The deprotonation of both sites was tested, and the most stable conformer was used in each case.
4. Conclusions
Working with an initial training set of eleven structurally simple phenols, which was later expanded to twenty molecules, direct aqueous pK
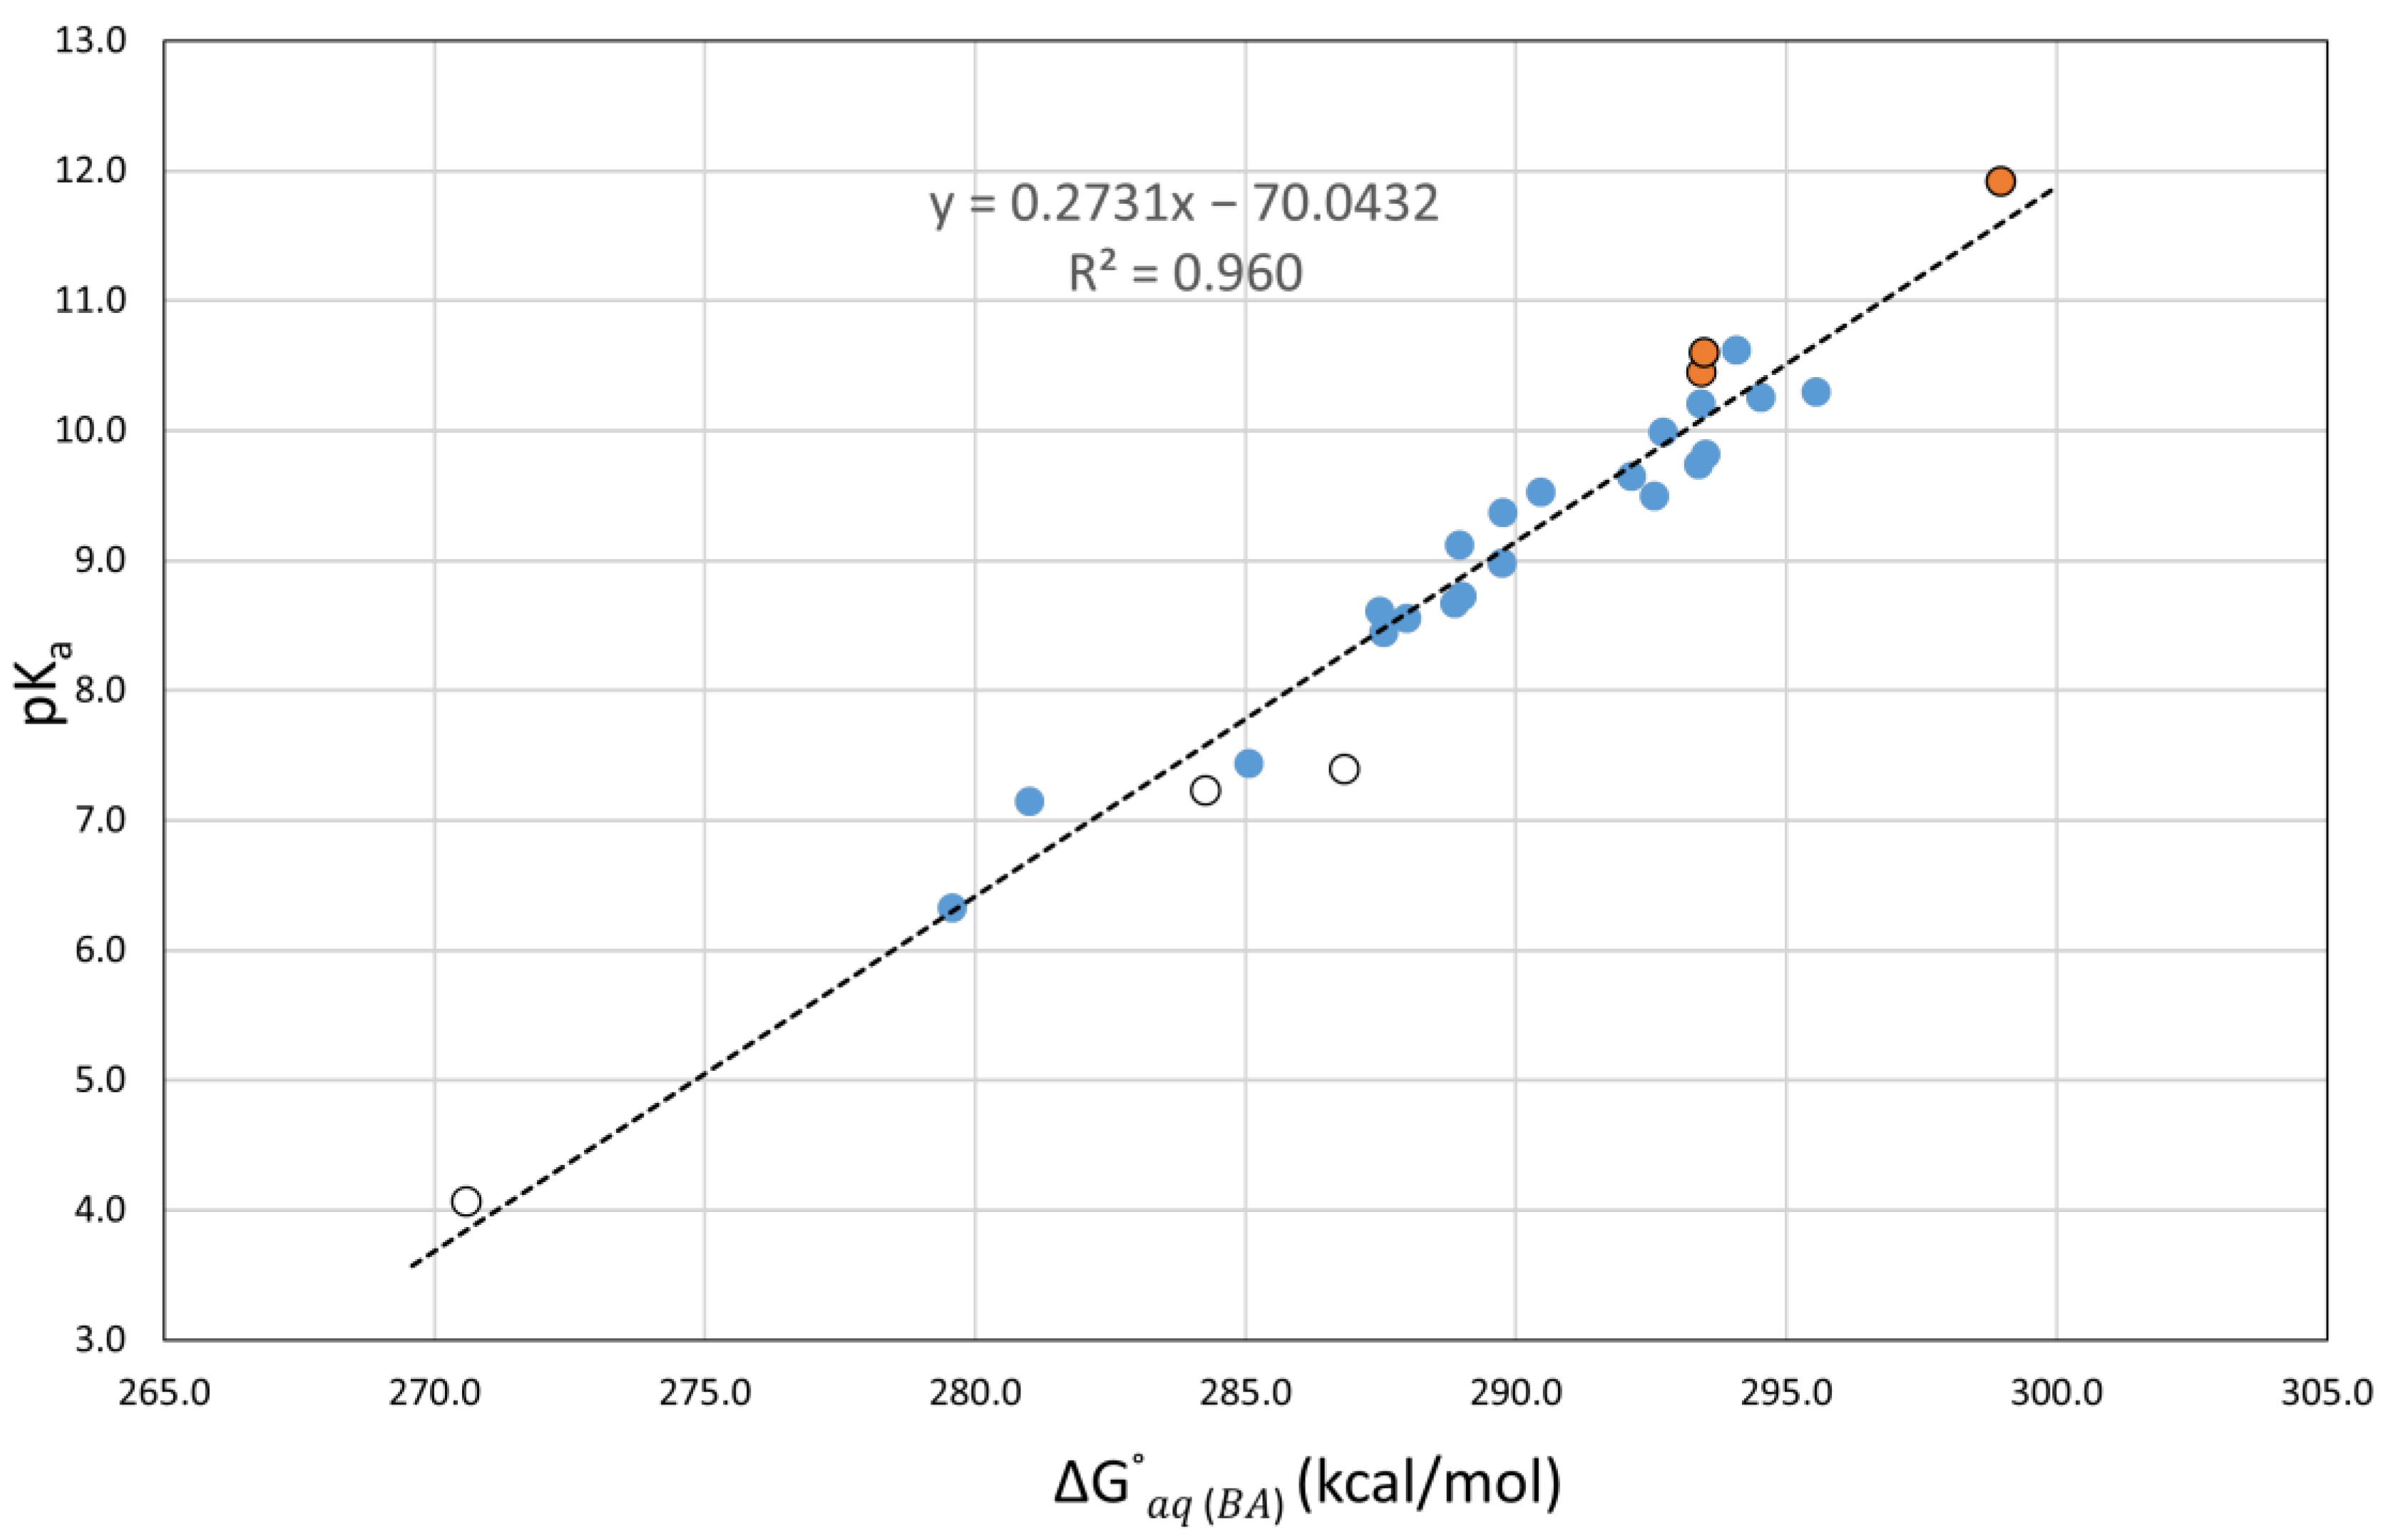
a calculations (using three acid dissociation equilibria) were perform with of five DFT functionals (M06-2X, B3LYP, BHandHLYP, PBE0, and TPSS), using the 6-311++G(d,p) basis set and the SMD and PCM solvent models. Much better and more consistent results were produced from the correlations between the calculated Gibbs energy difference between each acid and its conjugate base,
, and the experimental aqueous pK
a values, as previously reported [
38]. The correlations using SMD (PCM) produced MAEs between 0.22 and 0.27 (0.28 and 0.40) and R
2s between 0.947 and 0.975 (0.898 and 0.946). In general, the correlations using twenty phenols with SMD produced more accurate results than PCM.
A new set of ten phenols of varying complexities with experimental and/or predicted pK
a values (separated accordingly) was used to test the performance of our correlations. In this case, PCM performed significantly better than SMD and the theoretical methodologies previously reported [
31,
38] for the entire test set and when the complex phenols were isolated. The best performance (for the set with experimental pK
a values) was achieved by B3LYP(PCM) with an MAE (MSE) of 0.23 (−0.08) pK
a units. The best performance for the complex phenols with experimental values were achieved by B3LYP(PCM), BHandHLYP(PCM), and TPSS(PCM) with MAE values of 0.28, 0.29, and 0.27 pK
a units, respectively. These three functionals are expected to produce the most accurate pK
a predictions when combined with the PCM solvent model; however, we have included the remaining levels of theory to form a range of predicted values. Furthermore, we developed new correlations, including the seven molecules from the training set (working with twenty-seven phenols in total) to increase the statistical value of our work. The best MAE for the new correlations was shared by M06-2X(PCM), B3LYP(SMD), and BHandHLYP(PCM) with an MAE of 0.26 and R
2s between 0.955 and 0.960 (see
Table 4).
Our correlations were used to predict the pK
a values of twelve molecules with potential antioxidant activity and of nine phenolic cannabinoids. The average prediction range with the PCM (SMD) solvation model was 0.15 (0.21) and 0.25 (0.34) pK
a units, respectively, which indicates a very good agreement between our methodologies. These aqueous pK
a predictions could be used as reference values for predictions in other solvents [
12]. In the future, when more experimental data are available, it would be ideal to extend these correlations to a larger set of complex phenolic molecules to create an even better pK
a predictive tool.


