
Prevention of Sunlight-Induced Cell Damage by Selective Blue-Violet-Light-Filtering Lenses in A2E-Loaded Retinal Pigment Epithelial Cells

 ,
,
Abstract
:1. Introduction
2. Materials and Methods
2.1. Cell Model
2.2. Tailor-Made Adjustable Light Device
2.3. Blue-Light-Filtering Optical Lenses
2.4. Light Exposure
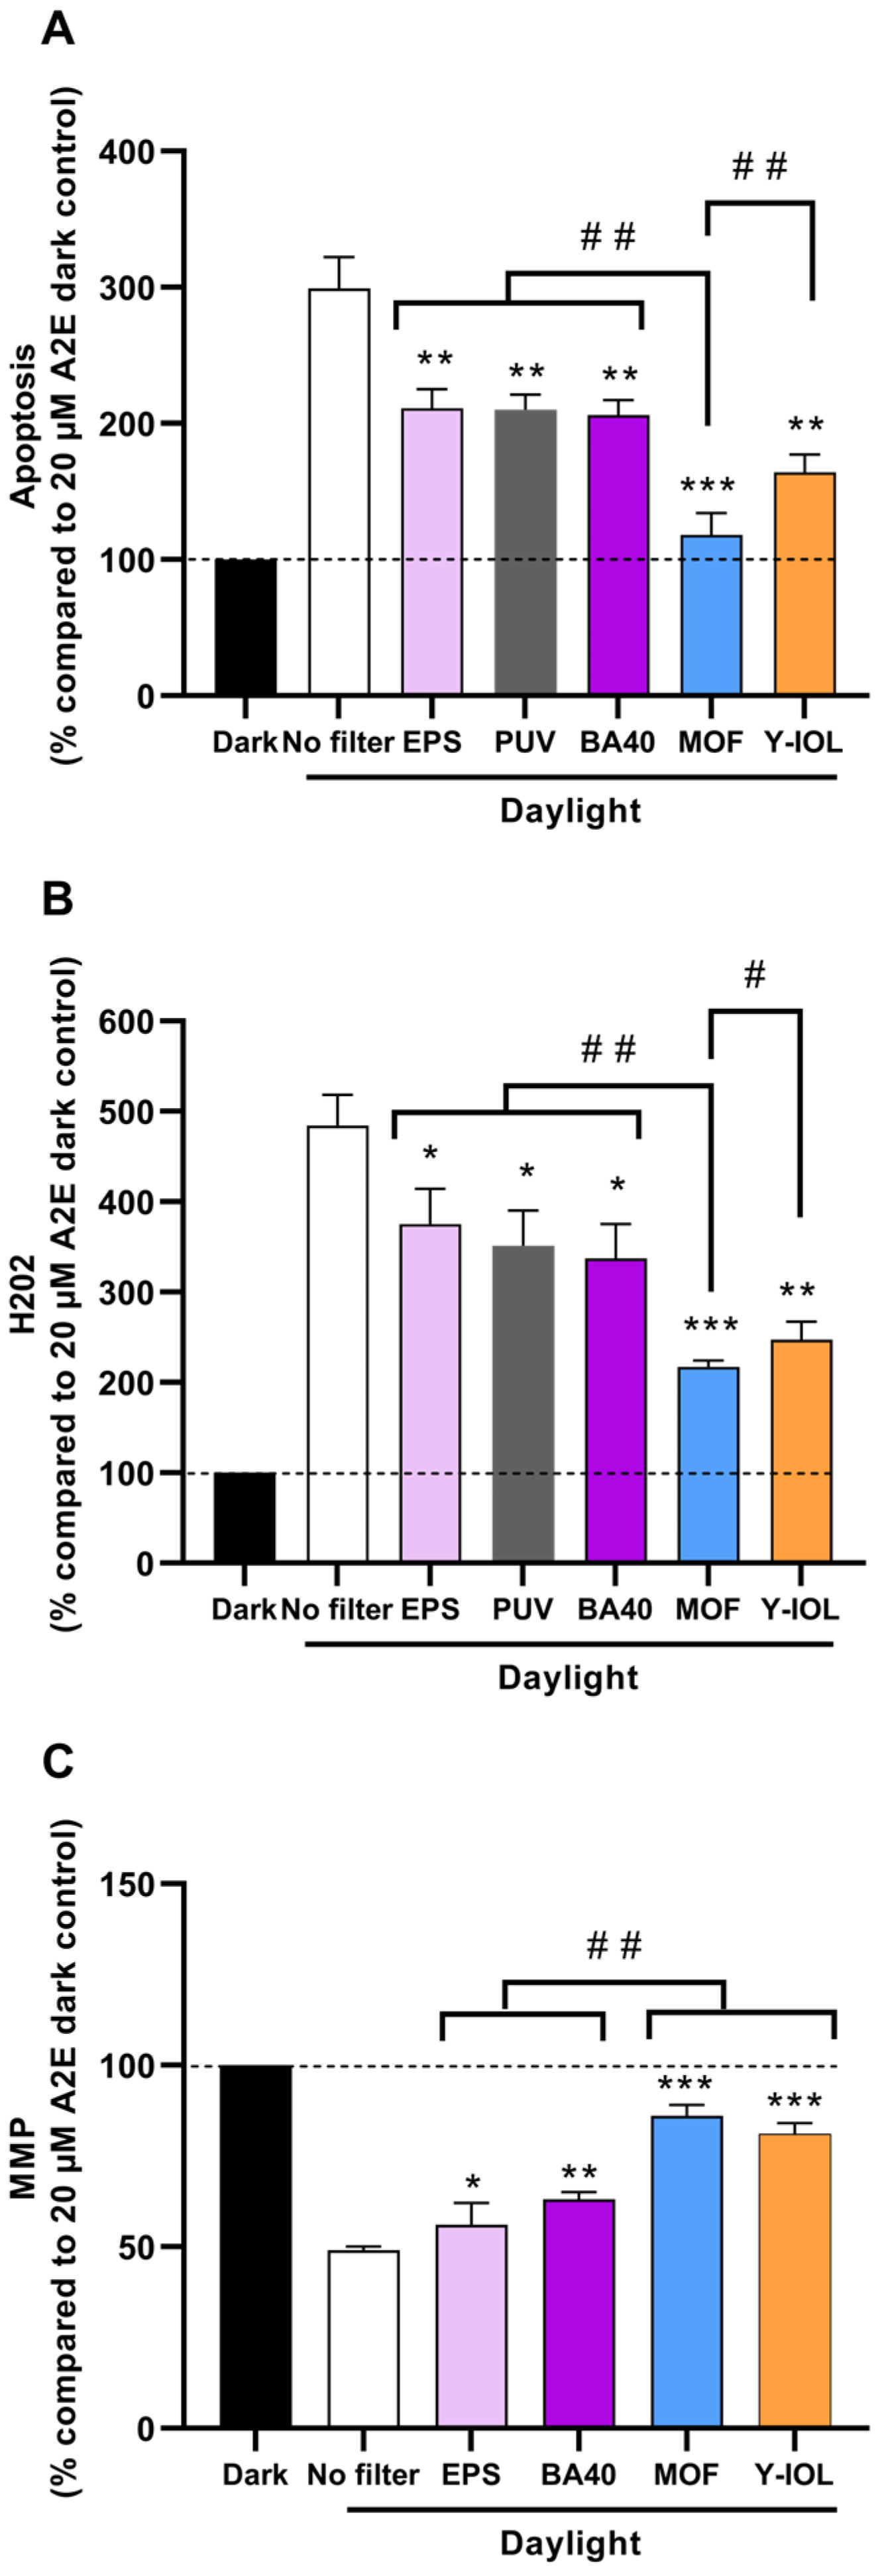
2.5. Apoptosis
2.6. Hydrogen Peroxide
2.7. Mitochondrial Membrane Potential
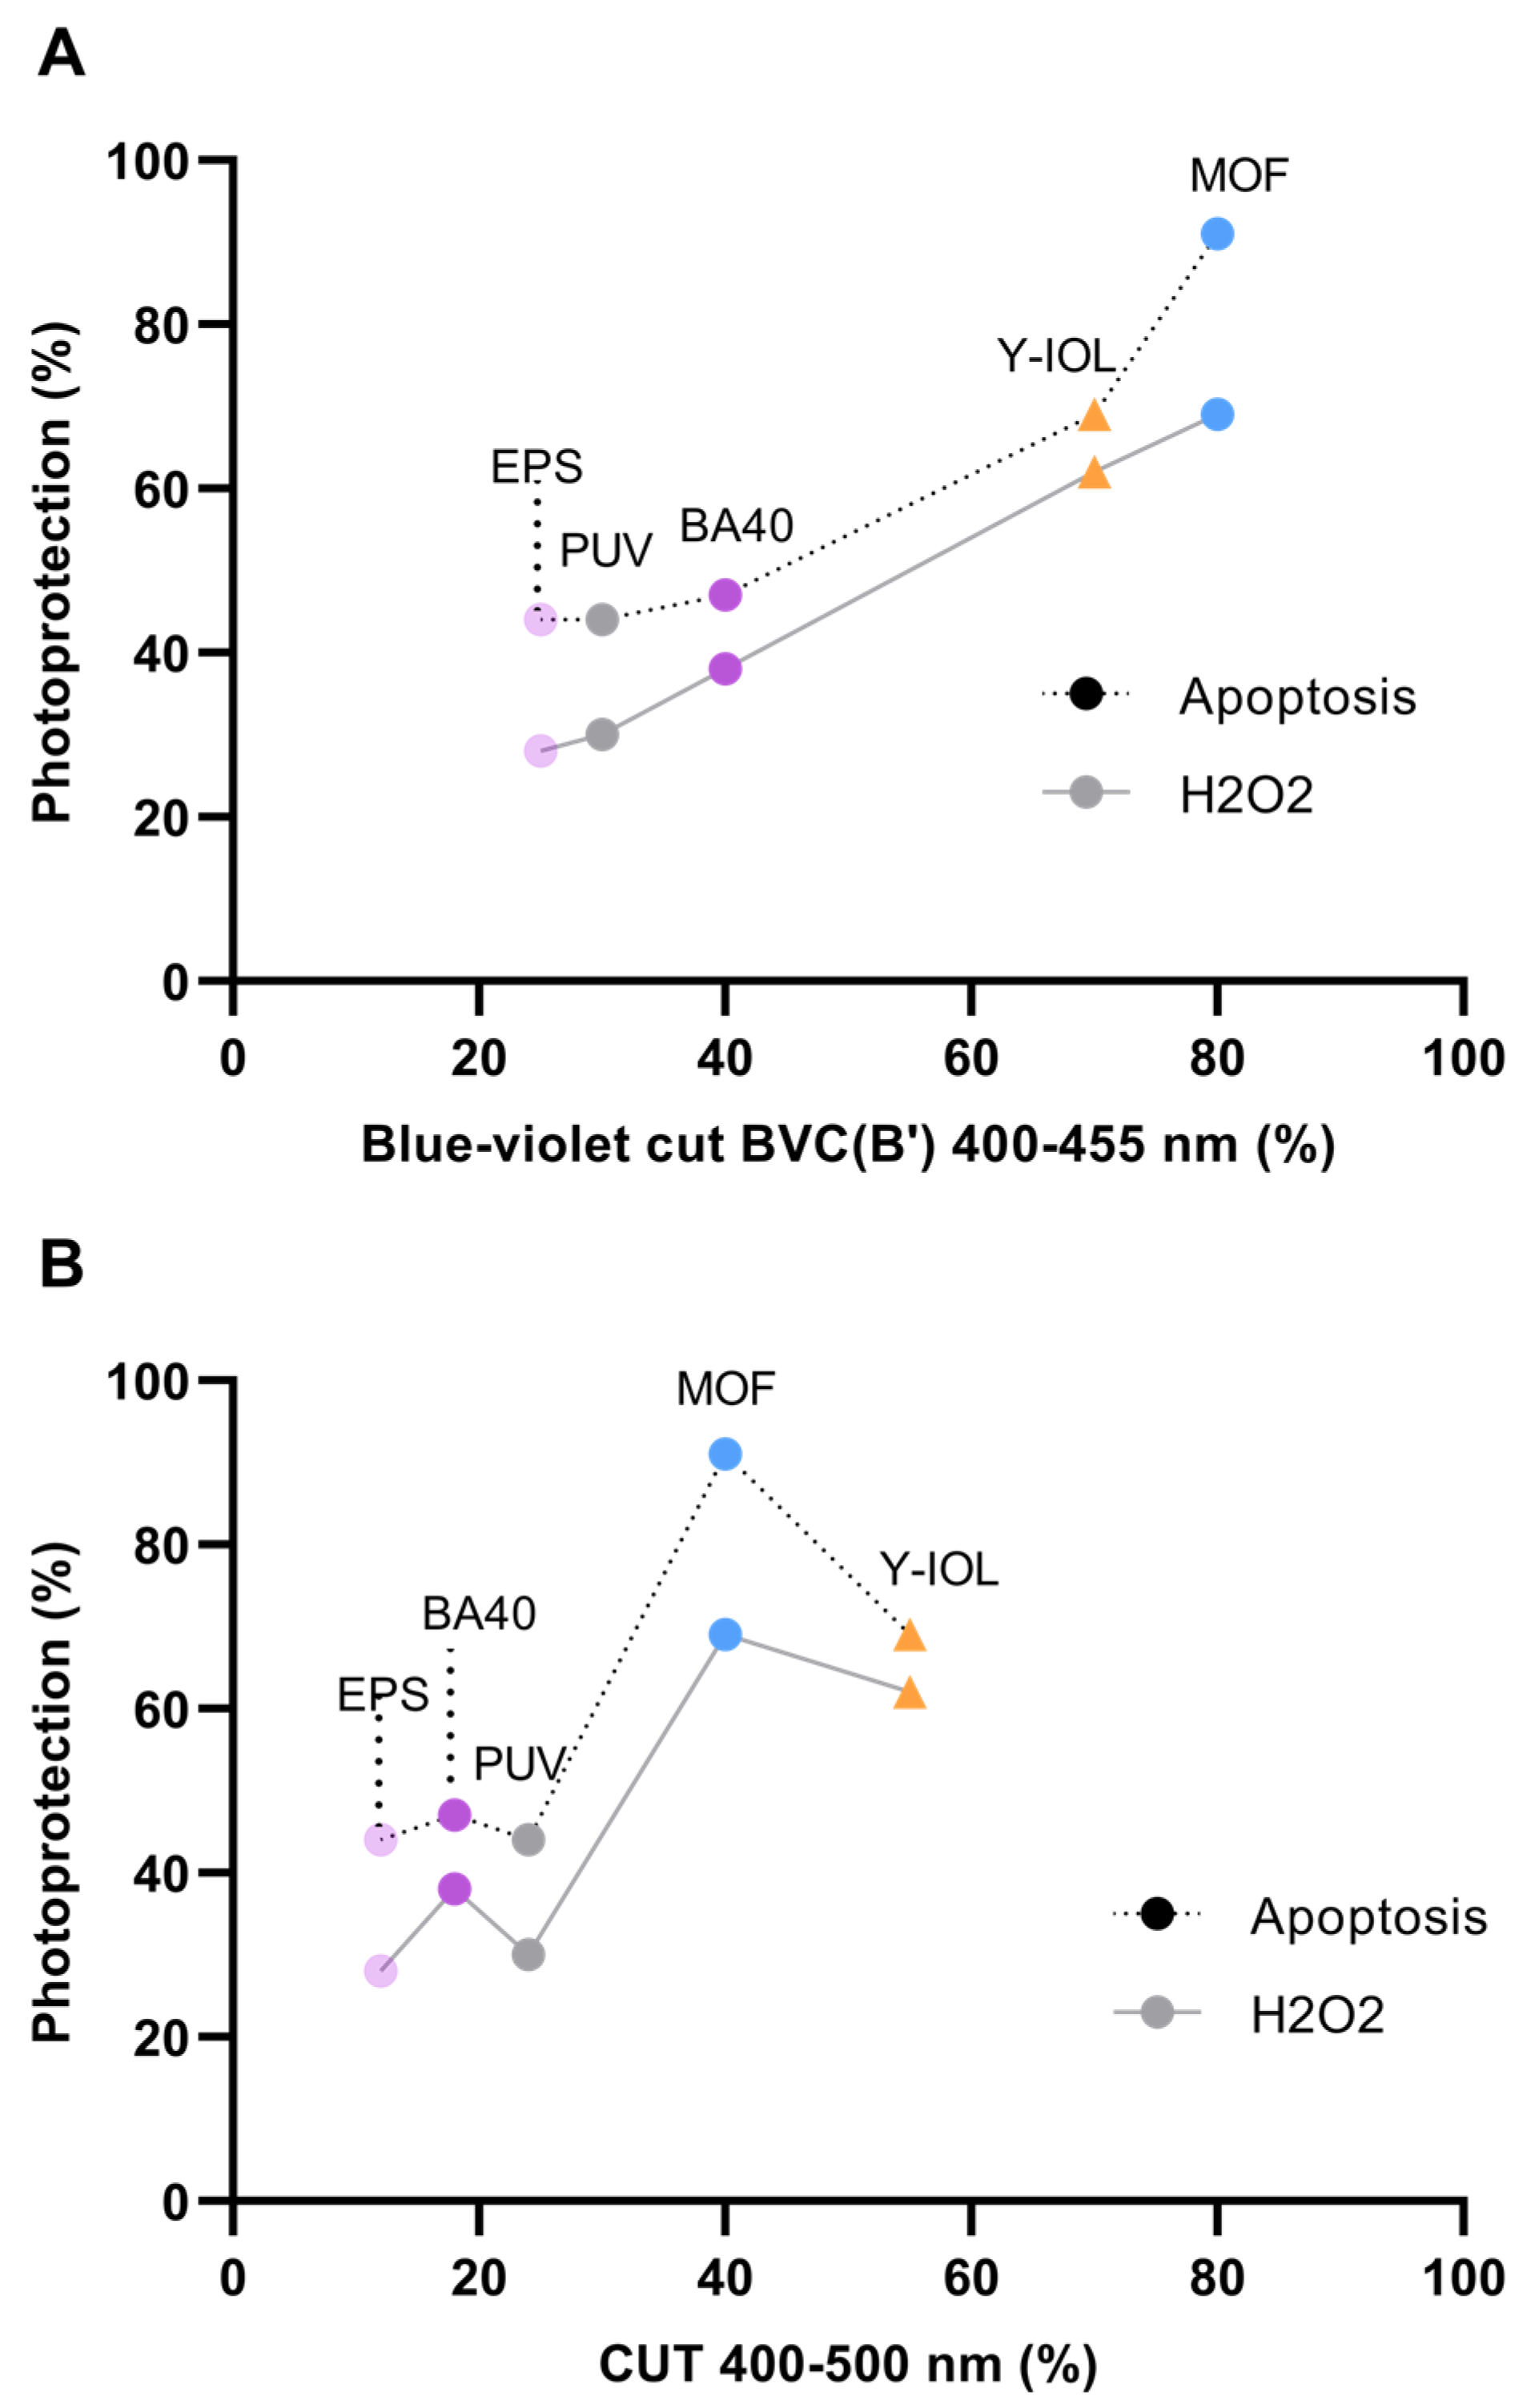
2.8. Photoprotection Potency of Filters
2.9. Statistical Analysis
3. Results
3.1. Tailored Light Set-Up for Simulating Sunlight Exposure at the Retinal Level
3.2. Sunlight-Induced Toxicity in A2E-Loaded RPE Cells
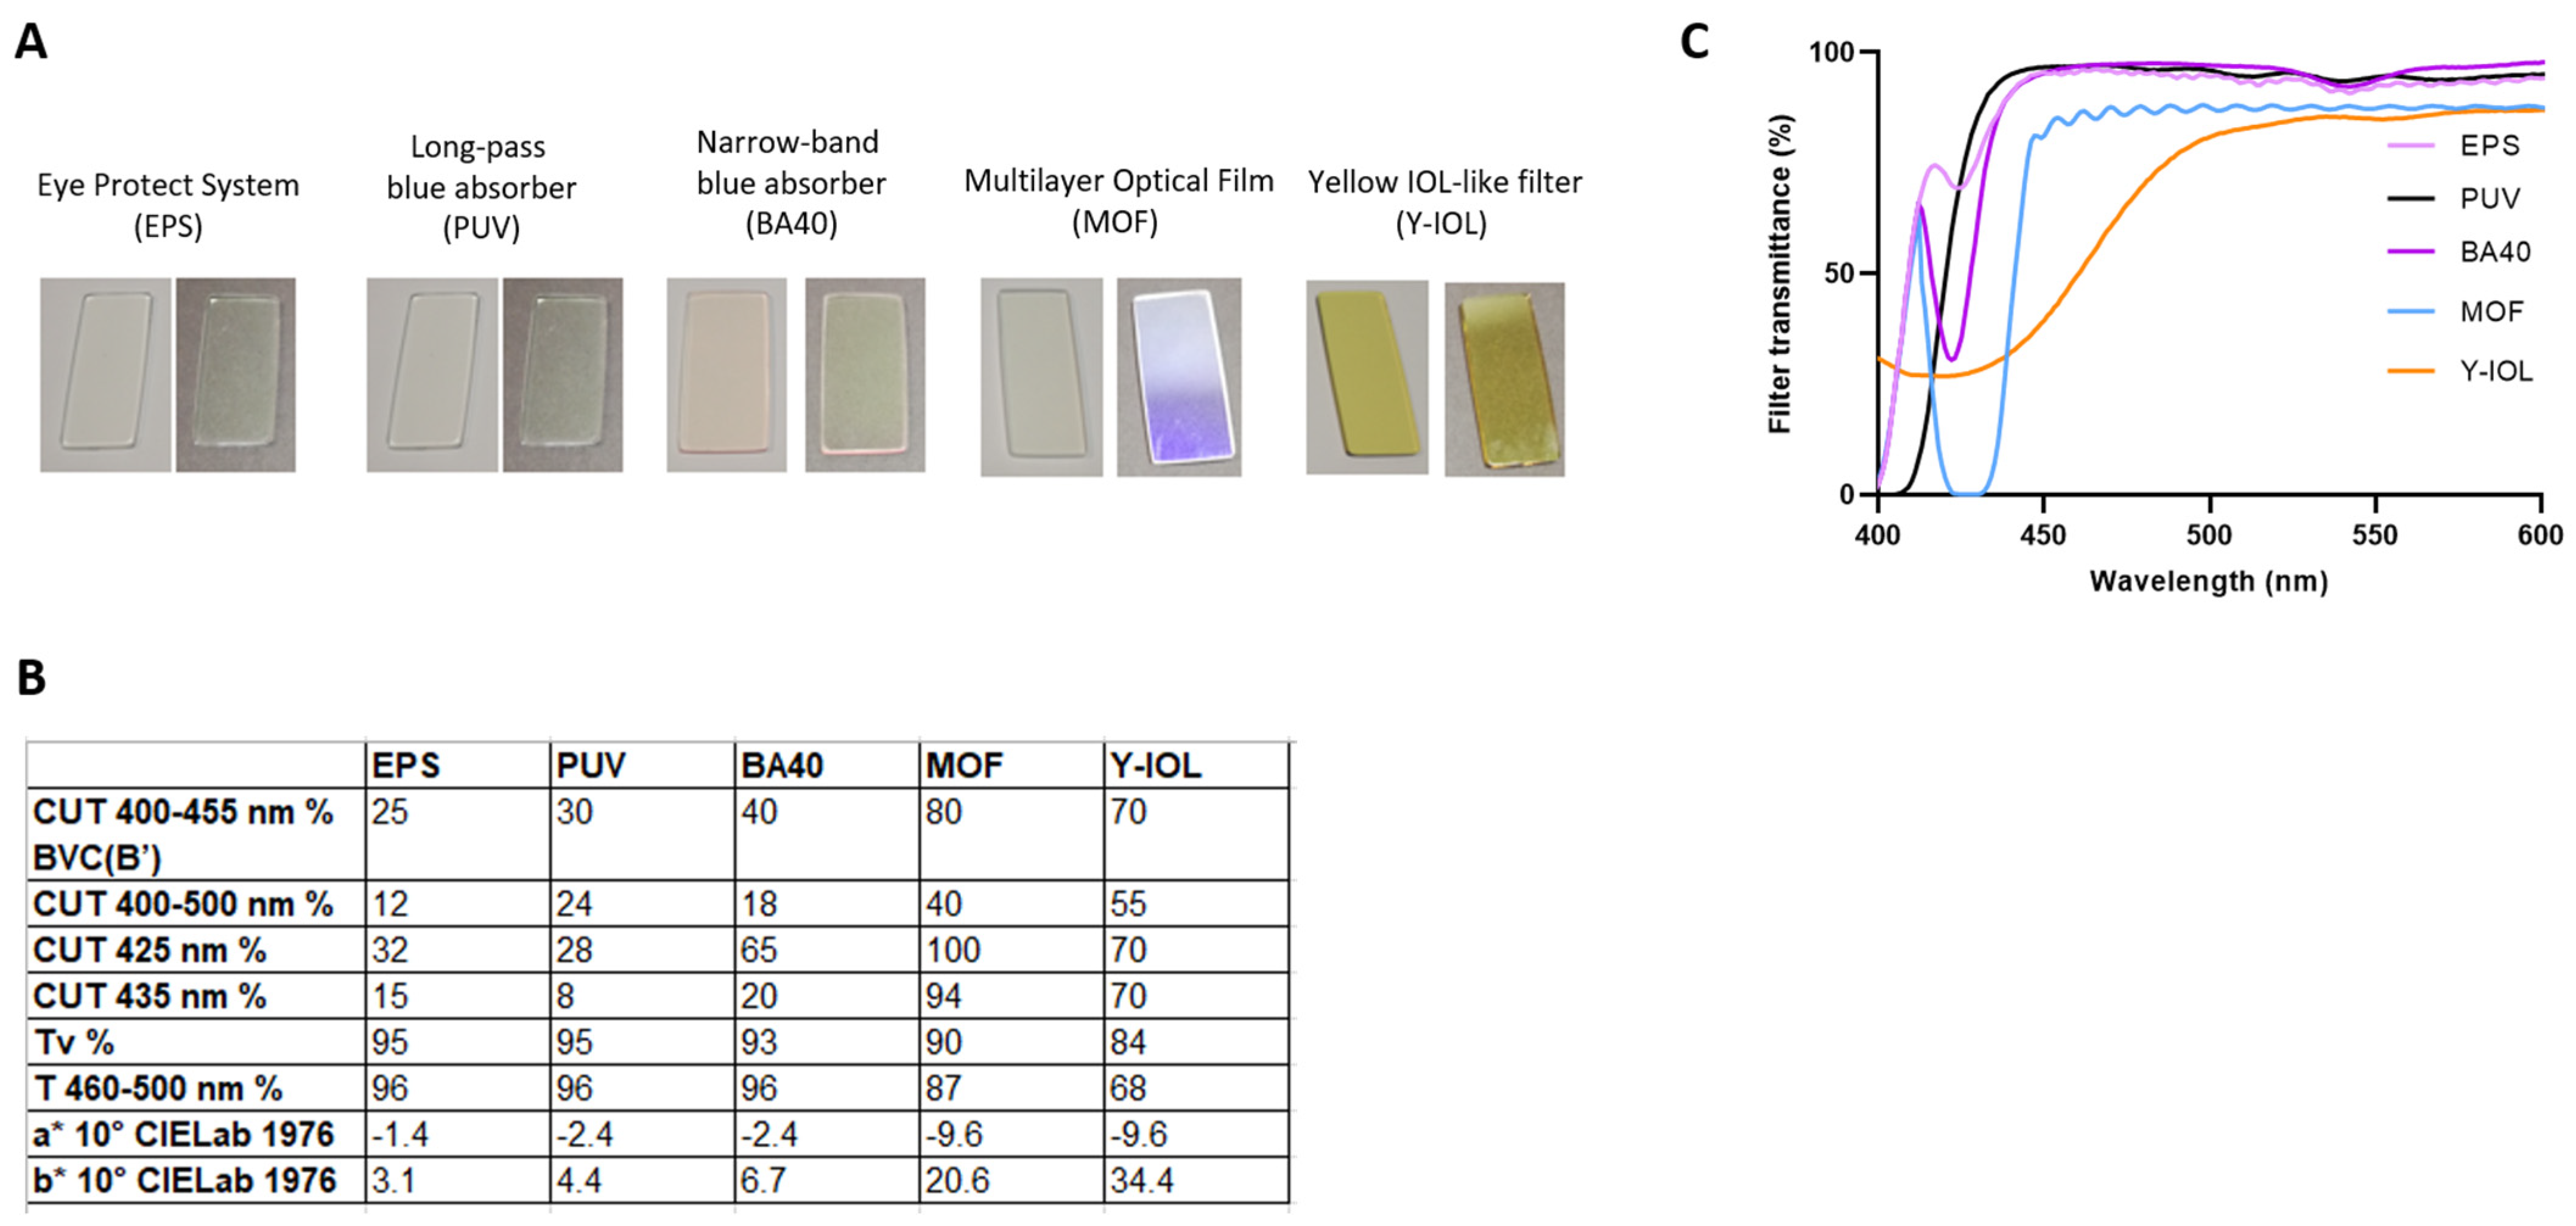
3.3. Blue-Light-Filtering Optical Lenses
3.4. Photoprotection by Blue-Light-Filtering Lenses
4. Discussion
5. Conclusions
6. Patents
Author Contributions
Funding
Institutional Review Board Statement
Informed Consent Statement
Data Availability Statement
Conflicts of Interest
References
- Schick, T.; Ersoy, L.; Lechanteur, Y.T.; Saksens, N.T.; Hoyng, C.B.; den Hollander, A.I.; Kirchhof, B.; Fauser, S. History of Sunlight Exposure Is a Risk Factor for Age-Related Macular Degeneration. Retina 2016, 36, 787–790. [Google Scholar] [CrossRef] [PubMed]
- Sui, G.Y.; Liu, G.C.; Liu, G.Y.; Gao, Y.Y.; Deng, Y.; Wang, W.Y.; Tong, S.H.; Wang, L. Is sunlight exposure a risk factor for age-related macular degeneration? A systematic review and meta-analysis. Br. J. Ophthalmol. 2013, 97, 389–394. [Google Scholar] [CrossRef] [PubMed]
- Cruickshanks, K.J.; Klein, R.; Klein, B.E. Sunlight and age-related macular degeneration. The Beaver Dam Eye Study. Arch. Ophthalmol. 1993, 111, 514–518. [Google Scholar] [CrossRef] [PubMed]
- Taylor, H.R.; Munoz, B.; West, S.; Bressler, N.M.; Bressler, S.B.; Rosenthal, F.S. Visible light and risk of age-related macular degeneration. Trans. Am. Ophthalmol. Soc. 1990, 88, 163–173; discussion 168–173. [Google Scholar]
- Augood, C.A.; Vingerling, J.R.; de Jong, P.T.; Chakravarthy, U.; Seland, J.; Soubrane, G.; Tomazzoli, L.; Topouzis, F.; Bentham, G.; Rahu, M.; et al. Prevalence of age-related maculopathy in older Europeans: The European Eye Study (EUREYE). Arch. Ophthalmol. 2006, 124, 529–535. [Google Scholar] [CrossRef]
- Lund, D.; Marshall, J.; Mellerio, J.; Okuno, T.; Schulmeister, K.; Sliney, D.; Söderberg, P.; Stuck, B.; Van Norren, D.; Zuclich, J. A computerized approach to transmission and absorption characteristics of the human eye. In Proceedings of the CIE, Cambridge, UK, 18–23 June 2012; pp. 1–66. [Google Scholar]
- Wing, G.L.; Blanchard, G.C.; Weiter, J.J. The topography and age relationship of lipofuscin concentration in the retinal pigment epithelium. Investig. Ophthalmol. Vis. Sci. 1978, 17, 601–607. [Google Scholar]
- Wielgus, A.R.; Chignell, C.F.; Ceger, P.; Roberts, J.E. Comparison of A2E cytotoxicity and phototoxicity with all-trans-retinal in human retinal pigment epithelial cells. Photochem. Photobiol. 2010, 86, 781–791. [Google Scholar] [CrossRef]
- Boulton, M.; Rozanowska, M.; Rozanowski, B. Retinal photodamage. J. Photochem. Photobiol. B 2001, 64, 144–161. [Google Scholar] [CrossRef]
- Rozanowska, M.; Pawlak, A.; Rozanowski, B.; Skumatz, C.; Zareba, M.; Boulton, M.E.; Burke, J.M.; Sarna, T.; Simon, J.D. Age-related changes in the photoreactivity of retinal lipofuscin granules: Role of chloroform-insoluble components. Investig. Ophthalmol. Vis. Sci. 2004, 45, 1052–1060. [Google Scholar] [CrossRef]
- Schutt, F.; Davies, S.; Kopitz, J.; Boulton, M.; Holz, F.G. A retinoid constituent of lipofuscin, A2-E, is a photosensitizer in human retinal pigment epithelial cells. Ophthalmologe 2000, 97, 682–687. [Google Scholar] [CrossRef]
- Sparrow, J.R.; Nakanishi, K.; Parish, C.A. The lipofuscin fluorophore A2E mediates blue light-induced damage to retinal pigmented epithelial cells. Investig. Ophthalmol. Vis. Sci. 2000, 41, 1981–1989. [Google Scholar]
- Davies, S.; Elliott, M.H.; Floor, E.; Truscott, T.G.; Zareba, M.; Sarna, T.; Shamsi, F.A.; Boulton, M.E. Photocytotoxicity of lipofuscin in human retinal pigment epithelial cells. Free Radic. Biol. Med. 2001, 31, 256–265. [Google Scholar] [CrossRef] [PubMed]
- Westlund, B.S.; Cai, B.; Zhou, J.; Sparrow, J.R. Involvement of c-Abl, p53 and the MAP kinase JNK in the cell death program initiated in A2E-laden ARPE-19 cells by exposure to blue light. Apoptosis 2009, 14, 31–41. [Google Scholar] [CrossRef] [PubMed]
- Feng, J.; Chen, X.; Sun, X.; Wang, F.; Sun, X. Expression of endoplasmic reticulum stress markers GRP78 and CHOP induced by oxidative stress in blue light-mediated damage of A2E-containing retinal pigment epithelium cells. Ophthalmic Res. 2014, 52, 224–233. [Google Scholar] [CrossRef] [PubMed]
- Zhao, Z.; Sun, T.; Jiang, Y.; Wu, L.; Cai, X.; Sun, X.; Sun, X. Photooxidative damage in retinal pigment epithelial cells via GRP78 and the protective role of grape skin polyphenols. Food Chem. Toxicol. 2014, 74, 216–224. [Google Scholar] [CrossRef]
- Brandstetter, C.; Mohr, L.K.; Latz, E.; Holz, F.G.; Krohne, T.U. Light induces NLRP3 inflammasome activation in retinal pigment epithelial cells via lipofuscin-mediated photooxidative damage. J. Mol. Med. 2015, 93, 905–916. [Google Scholar] [CrossRef]
- Arnault, E.; Barrau, C.; Nanteau, C.; Gondouin, P.; Bigot, K.; Vienot, F.; Gutman, E.; Fontaine, V.; Villette, T.; Cohen-Tannoudji, D.; et al. Phototoxic action spectrum on a retinal pigment epithelium model of age-related macular degeneration exposed to sunlight normalized conditions. PLoS ONE 2013, 8, e71398. [Google Scholar] [CrossRef]
- Schutt, F.; Bergmann, M.; Holz, F.G.; Kopitz, J. Isolation of intact lysosomes from human RPE cells and effects of A2-E on the integrity of the lysosomal and other cellular membranes. Graefes Arch. Clin. Exp. Ophthalmol. 2002, 240, 983–988. [Google Scholar] [CrossRef]
- Fletcher, E.L.; Chung, S.T.; Downie, L.E.; Guymer, R.H.; Vingrys, A.J. Age-related macular degeneration: What’s new and on the horizon. Optom. Vis. Sci. 2014, 91, 816–818. [Google Scholar] [CrossRef]
- Marie, M.; Bigot, K.; Angebault, C.; Barrau, C.; Gondouin, P.; Pagan, D.; Fouquet, S.; Villette, T.; Sahel, J.A.; Lenaers, G.; et al. Light action spectrum on oxidative stress and mitochondrial damage in A2E-loaded retinal pigment epithelium cells. Cell Death Dis. 2018, 9, 287. [Google Scholar] [CrossRef]
- Salceda, R. Light Pollution and Oxidative Stress: Effects on Retina and Human Health. Antioxidants 2024, 13, 362. [Google Scholar] [CrossRef] [PubMed]
- Shin, C.Y.; Lee, M.H.; Kim, H.M.; Chung, H.C.; Kim, D.U.; Lee, J.H.; Jeong, K.W. Protective Effect of Ribes nigrum Extract against Blue Light-Induced Retinal Degeneration In Vitro and In Vivo. Antioxidants 2022, 11, 832. [Google Scholar] [CrossRef] [PubMed]
- Lee, S.J.; Roh, Y.J.; Kim, J.E.; Jin, Y.J.; Song, H.J.; Seol, A.; Park, S.H.; Douangdeuane, B.; Souliya, O.; Choi, S.I.; et al. Protective Effects of Dipterocarpus tuberculatus in Blue Light-Induced Macular Degeneration in A2E-Laden ARPE19 Cells and Retina of Balb/c Mice. Antioxidants 2023, 12, 329. [Google Scholar] [CrossRef] [PubMed]
- Clementi, M.E.; Maulucci, G.; Bianchetti, G.; Pizzoferrato, M.; Sampaolese, B.; Tringali, G. Cytoprotective Effects of Punicalagin on Hydrogen-Peroxide-Mediated Oxidative Stress and Mitochondrial Dysfunction in Retinal Pigment Epithelium Cells. Antioxidants 2021, 10, 192. [Google Scholar] [CrossRef]
- Park, C.; Cha, H.J.; Kim, M.Y.; Bang, E.; Moon, S.K.; Yun, S.J.; Kim, W.J.; Noh, J.S.; Kim, G.Y.; Cho, S.; et al. Phloroglucinol Attenuates DNA Damage and Apoptosis Induced by Oxidative Stress in Human Retinal Pigment Epithelium ARPE-19 Cells by Blocking the Production of Mitochondrial ROS. Antioxidants 2022, 11, 2353. [Google Scholar] [CrossRef]
- Ouyang, X.; Yang, J.; Hong, Z.; Wu, Y.; Xie, Y.; Wang, G. Mechanisms of blue light-induced eye hazard and protective measures: A review. Biomed. Pharmacother. 2020, 130, 110577. [Google Scholar] [CrossRef]
- Yang, J.; Luo, J.; Tian, X.; Zhao, Y.; Li, Y.; Wu, X. Progress in Understanding Oxidative Stress, Aging, and Aging-Related Diseases. Antioxidants 2024, 13, 394. [Google Scholar] [CrossRef]
- Kushwah, N.; Bora, K.; Maurya, M.; Pavlovich, M.C.; Chen, J. Oxidative Stress and Antioxidants in Age-Related Macular Degeneration. Antioxidants 2023, 12, 1379. [Google Scholar] [CrossRef]
- ISO/CIE 11664-2:2022|EN ISO/CIE 11664-2:2022; Colorimetry—Part 2: CIE Standard Illuminants. International Organisation for Standardisation: Geneva, Switzerland, 2022.
- Marie, M.; Forster, V.; Fouquet, S.; Berto, P.; Barrau, C.; Ehrismann, C.; Sahel, J.A.; Tessier, G.; Picaud, S. Phototoxic damage to cone photoreceptors can be independent of the visual pigment: The porphyrin hypothesis. Cell Death Dis. 2020, 11, 711. [Google Scholar] [CrossRef]
- Lee, Y.H.; Kuk, M.U.; So, M.K.; Song, E.S.; Lee, H.; Ahn, S.K.; Kwon, H.W.; Park, J.T.; Park, S.C. Targeting Mitochondrial Oxidative Stress as a Strategy to Treat Aging and Age-Related Diseases. Antioxidants 2023, 12, 934. [Google Scholar] [CrossRef]
- Rozanowska, M.B. Lipofuscin, Its Origin, Properties, and Contribution to Retinal Fluorescence as a Potential Biomarker of Oxidative Damage to the Retina. Antioxidants 2023, 12, 2111. [Google Scholar] [CrossRef] [PubMed]
- Chamorro, E.; Bonnin-Arias, C.; Perez-Carrasco, M.J.; Munoz de Luna, J.; Vazquez, D.; Sanchez-Ramos, C. Effects of light-emitting diode radiations on human retinal pigment epithelial cells in vitro. Photochem. Photobiol. 2013, 89, 468–473. [Google Scholar] [CrossRef]
- Cougnard-Gregoire, A.; Merle, B.M.J.; Aslam, T.; Seddon, J.M.; Aknin, I.; Klaver, C.C.W.; Garhofer, G.; Layana, A.G.; Minnella, A.M.; Silva, R.; et al. Blue Light Exposure: Ocular Hazards and Prevention-A Narrative Review. Ophthalmol. Ther. 2023, 12, 755–788. [Google Scholar] [CrossRef] [PubMed]
- Wang, L.; Yu, X.; Zhang, D.; Wen, Y.; Zhang, L.; Xia, Y.; Chen, J.; Xie, C.; Zhu, H.; Tong, J.; et al. Long-term blue light exposure impairs mitochondrial dynamics in the retina in light-induced retinal degeneration in vivo and in vitro. J. Photochem. Photobiol. B 2023, 240, 112654. [Google Scholar] [CrossRef] [PubMed]
- Zhou, J.; Sparrow, J.R. Light filtering in a retinal pigment epithelial cell culture model. Optom. Vis. Sci. 2011, 88, 759–765. [Google Scholar] [CrossRef] [PubMed]
- Park, S.I.; Jang, Y.P. The Protective Effect of Brown-, Gray-, and Blue-Tinted Lenses against Blue LED Light-Induced Cell Death in A2E-Laden Human Retinal Pigment Epithelial Cells. Ophthalmic Res. 2017, 57, 118–124. [Google Scholar] [CrossRef]
- van Norren, D.; Vos, J.J. Light damage to the retina: An historical approach. Eye 2016, 30, 169–172. [Google Scholar] [CrossRef]
- Hecht, I.; Kanclerz, P.; Achiron, A.; Elbaz, U.; Tuuminen, R. The Effect of Blue-Light Filtering Intraocular Lenses on the Development and Progression of Glaucoma. J. Glaucoma 2023, 32, 451–457. [Google Scholar] [CrossRef]
- Yu, W.Y.; Shan, S.S.W.; Lakshmanan, Y.; Wong, F.S.Y.; Choi, K.Y.; Chan, H.H.L. Selective blue-filtering spectacle lens protected primary porcine RPE cells against light emitting diode-induced cell damage. PLoS ONE 2022, 17, e0268796. [Google Scholar] [CrossRef]
- Hammond, B.R. Attenuating Photostress and Glare Disability in Pseudophakic Patients through the Addition of a Short-Wave Absorbing Filter. J. Ophthalmol. 2015, 2015, 607635. [Google Scholar] [CrossRef]
- Obana, A.; Gohto, Y.; Asaoka, R. Macular pigment changes after cataract surgery with yellow-tinted intraocular lens implantation. PLoS ONE 2021, 16, e0248506. [Google Scholar] [CrossRef] [PubMed]
- Abdouh, M.; Lu, M.; Chen, Y.; Goyeneche, A.; Burnier, J.V.; Burnier, M.N., Jr. Filtering blue light mitigates the deleterious effects induced by the oxidative stress in human retinal pigment epithelial cells. Exp. Eye Res. 2022, 217, 108978. [Google Scholar] [CrossRef] [PubMed]
- Sparrow, J.R.; Miller, A.S.; Zhou, J. Blue light-absorbing intraocular lens and retinal pigment epithelium protection in vitro. J. Cataract. Refract. Surg. 2004, 30, 873–878. [Google Scholar] [CrossRef] [PubMed]
- Yanagi, Y.; Inoue, Y.; Iriyama, A.; Jang, W.D. Effects of yellow intraocular lenses on light-induced upregulation of vascular endothelial growth factor. J. Cataract. Refract. Surg. 2006, 32, 1540–1544. [Google Scholar] [CrossRef]
- ISO/TR 20772; Spectacle Lenses–Short Wavelength Visible Solar Radiation and the Eye. Ophthalmic Optics. British Standards Institute: London, UK, 2018.


| EPS | PUV | BA40 | MOF | Y-IOL | |
|---|---|---|---|---|---|
| Blue-violet cut BVC(B’) CUT 400–455 nm % | 25 | 30 | 40 | 80 | 70 |
| CUT 400–500 nm % | 12 | 24 | 18 | 40 | 55 |
| CUT 425 nm % | 32 | 28 | 65 | 100 | 70 |
| CUT 435 nm % | 15 | 8 | 20 | 94 | 70 |
| PHOTOPROTECTION % (calculated as described in Section 2) | |||||
| For apoptosis | 44 | 44 | 47 | 91 | 69 |
| For H2O2 | 28 | 30 | 38 | 69 | 62 |
| For PMM | 14 | Not tested | 27 | 73 | 63 |
Disclaimer/Publisher’s Note: The statements, opinions and data contained in all publications are solely those of the individual author(s) and contributor(s) and not of MDPI and/or the editor(s). MDPI and/or the editor(s) disclaim responsibility for any injury to people or property resulting from any ideas, methods, instructions or products referred to in the content. |
© 2024 by the authors. Licensee MDPI, Basel, Switzerland. This article is an open access article distributed under the terms and conditions of the Creative Commons Attribution (CC BY) license (https://creativecommons.org/licenses/by/4.0/).
Share and Cite
Barrau, C.; Marie, M.; Ehrismann, C.; Gondouin, P.; Sahel, J.-A.; Villette, T.; Picaud, S. Prevention of Sunlight-Induced Cell Damage by Selective Blue-Violet-Light-Filtering Lenses in A2E-Loaded Retinal Pigment Epithelial Cells. Antioxidants 2024, 13, 1195. https://doi.org/10.3390/antiox13101195
Barrau C, Marie M, Ehrismann C, Gondouin P, Sahel J-A, Villette T, Picaud S. Prevention of Sunlight-Induced Cell Damage by Selective Blue-Violet-Light-Filtering Lenses in A2E-Loaded Retinal Pigment Epithelial Cells. Antioxidants. 2024; 13(10):1195. https://doi.org/10.3390/antiox13101195
Chicago/Turabian StyleBarrau, Coralie, Mélanie Marie, Camille Ehrismann, Pauline Gondouin, José-Alain Sahel, Thierry Villette, and Serge Picaud. 2024. "Prevention of Sunlight-Induced Cell Damage by Selective Blue-Violet-Light-Filtering Lenses in A2E-Loaded Retinal Pigment Epithelial Cells" Antioxidants 13, no. 10: 1195. https://doi.org/10.3390/antiox13101195