Article

8-OxoG-Dependent Regulation of Global Protein Responses Leads to Mutagenesis and Stress Survival in Bacillus subtilis

by
Lissett E. Martínez
1,
Gerardo Gómez
1,
Norma Ramírez
1,
Bernardo Franco
1,
Eduardo A. Robleto
2 and
Mario Pedraza-Reyes
1,*
1
Department of Biology, Division of Natural and Exact Sciences, University of Guanajuato, Guanajuato 36050, Mexico
2
School of Life Sciences, University of Nevada, Las Vegas, NV 89557, USA
*
Author to whom correspondence should be addressed.
Antioxidants 2024, 13(3), 332; https://doi.org/10.3390/antiox13030332
Submission received: 31 January 2024 / Revised: 27 February 2024 / Accepted: 5 March 2024 / Published: 8 March 2024

Abstract

:
The guanine oxidized (GO) system of Bacillus subtilis, composed of the YtkD (MutT), MutM and MutY proteins, counteracts the cytotoxic and genotoxic effects of the oxidized nucleobase 8-OxoG. Here, we report that in growing B. subtilis cells, the genetic inactivation of GO system potentiated mutagenesis (HPM), and subsequent hyperresistance, contributes to the damaging effects of hydrogen peroxide (H2O2) (HPHR). The mechanism(s) that connect the accumulation of the mutagenic lesion 8-OxoG with the ability of B. subtilis to evolve and survive the noxious effects of oxidative stress were dissected. Genetic and biochemical evidence indicated that the synthesis of KatA was exacerbated, in a PerR-independent manner, and the transcriptional coupling repair factor, Mfd, contributed to HPHR and HPM of the ΔGO strain. Moreover, these phenotypes are associated with wider pleiotropic effects, as revealed by a global proteome analysis. The inactivation of the GO system results in the upregulated production of KatA, and it reprograms the synthesis of the proteins involved in distinct types of cellular stress; this has a direct impact on (i) cysteine catabolism, (ii) the synthesis of iron–sulfur clusters, (iii) the reorganization of cell wall architecture, (iv) the activation of AhpC/AhpF-independent organic peroxide resistance, and (v) increased resistance to transcription-acting antibiotics. Therefore, to contend with the cytotoxic and genotoxic effects derived from the accumulation of 8-OxoG, B. subtilis activates the synthesis of proteins belonging to transcriptional regulons that respond to a wide, diverse range of cell stressors.

Graphical Abstract

1. Introduction

Microorganisms have evolved mechanisms to counteract the noxious effects promoted by oxidative stress [1,2,3]. Reactive oxygen species (ROS), including the superoxide anion (O2•−) and the hydroxyl radical (HO), are byproducts generated during aerobic bacterial growth. They have the potential to modify the chemical structure of proteins, lipids, and nucleic acids [4,5]. Alterations to transition metals’ homeostasis also contributes to oxidative stress in bacteria, as hydrogen peroxide (H2O2) can elicit the autocatalytic production of HO from reduced Fe(II) and Cu(I) via redox cycling with cellular reductants [6,7,8,9,10]. Therefore, the ability of microorganisms to rapidly detect and counteract ROS is critical for their survival. ROS-induced damage to cellular components activates specific and general stress responses in bacteria [5,11]. In some cases, oxygen and nitrogen radicals which act as secondary messengers (signals) are responsible for activating stress regulons that counteract and/or to adapt to the deleterious effects of oxidative stress [11]. In Bacillus subtilis, the transcriptional reprogramming that occurs in response to peroxide stress is carried out by the general stress response sigma factor, (σB), and two transcriptional repressors, OhrR and PerR [12,13].
During the transition from exponential growth to the stationary phase of growth, B. subtilis activates the synthesis of σB; this alternative sigma factor regulates the transcription of ~200 genes encoding general stress proteins (GSP). Examples of ROS-protecting proteins/enzymes under σB regulation include KatB, KatX, Dps, OhrB, and TxrA [13,14]. In B. subtilis, PerR controls the expression of genes required for ROS and iron detoxification, including, katA, ahpCF, hemAXCDL, mrgA and pfeT; notably, PerR also controls its own synthesis and that from the Fur protein [15]. OhrR specifically senses organic peroxides and is a repressor of a gene encoding a thiol peroxidase (OhrA) [16]. These regulons have been elucidated by experiments examining how cells respond to exposure to oxidants; these include hydrogen peroxide, paraquat, organic peroxides, and diamide [17].
During ROS attacks on DNA, a wide variety of oxidized bases are produced; however, guanine is more prone to oxidation due to its low redox potential [18,19,20]. The resulting 8-hydroxyguanine (8-OxoG) lesion, which can also be incorporated into DNA with the 8-Oxo-dGTP precursor, impacts the cells via its mutagenic and cytotoxic properties across the three domains of life [21,22,23]. In bacteria, the mutagenic effect of this lesion is counteracted by the proteins MutT, MutM, and MutY; altogether, this is called the guanine oxidized (GO) system [24]. This prevention/repair system constitutes an error-avoidance pathway that avoids the mutagenic effects of 8-OxoG, which can pair not only with cytosine (C), but also with adenine (A) during replication, resulting in a G:C to T:A transversion mutation [24,25,26].
In B. subtilis, the GO system is composed of YtkD (MutTA) encoding a nucleotide diphosphohydrolase (NUDIX) protein that transforms 8-oxo-dGTP into 8-oxo-dGMP, which can no longer function as a substrate for DNA polymerase, thus preventing its incorporation into DNA [27,28]. Two DNA glycosylases, MutM and MutY, complete the GO system in this bacterium. MutM removes 8-OxoG paired with cytosine from DNA, and MutY removes any adenine that is erroneously incorporated opposite to 8-OxoG [29,30].
Several lines of evidence associate the GO system with distinct cellular processes of B. subtilis, including stress-associated mutagenesis (SAM), transcriptional mutagenesis, and sporulation [31,32,33,34]. The inactivation of this system increases by 5–6 log orders, with regard to the production of His+ and Met+ (but not Leu+) prototrophs in nutritionally stressed cells of B. subtilis YB955 (hisC952, metB5, leuC427) [32]. Furthermore, experiments showed that Leu+ mutants in the strain YB955 are derived from the error-prone processing of 8-OxoG:A, A:G, and A:C mismatches caused by MutY in starved YB955 B. subtilis cells [31]. A recent report revealed that 8-OxoG lesions induce the generation of His+, Met+, and Leu+ revertants in strain YB955, and that such mutational events are mediated by the transcriptional factors Mfd and GreA [33]. In addition to its mutagenic effects, 8-OxoG was shown to affect developmental pathways in B. subtilis. Accordingly, a recent report showed that the processing of 8-OxoG through Mfd activated a RecA-dependent checkpoint that regulates the sporulation onset in this microorganism [34].
In this work, we report that growing B. subtilis cells deficient for a GO system increase by 3–4 orders of magnitude in terms of spontaneous RifR mutation frequency; intriguingly, this mutant strain exhibited an unusual hyperresistance to the noxious effects of the oxidizing agent hydrogen peroxide (i.e., hyperresistance to H2O2 phenotype, HPHR).
Overall, our results unveil a novel role for 8-OxoG, beyond oxidative-induced mutagenesis; it contributes to cell fitness by reprograming the synthesis of proteins from regulons that respond to a wide diversity of cell stressors, and it confers adaptive advantages to B. subtilis, including hyperresistance to peroxides and transcription-acting antibiotics.

2. Materials and Methods

2.1. Bacterial Strains, Culture Conditions, and Reagents

The strain B. subtilis PS832 (Wild-type trp+ revertant of strain 168 [35]), and its derivative, PERM603 (ytkD::neo mutM::tet mutY::sp. NeoR TcR SpR ∆GO; [34]), were employed in this study. The routinely used growth medium was the Luria–Bertani (LB) medium. When required, neomycin (Neo) (10 μg·mL−1), tetracycline (Tet) (10 μg·mL−1), spectinomycin (Sp) (100 μg·mL−1), chloramphenicol (Cm) (5 μg·mL−1), kanamycin (Kan) (25 μg·mL−1), erythromycin (Ery) (5 μg·mL−1), or rifampin (Rif) (10 μg·mL−1) was added to the medium. Liquid cultures were incubated with vigorous aeration (shaking at 250 rpm) at 37 °C. Cultures on solid media were grown at 37 °C. The optical density, at 600 nm (OD600), of liquid cultures was monitored with a Pharmacia Ultrospec 2000 spectrophotometer (Pharmacia, Peapack, NJ, USA).

2.2. Cell Harvesting and Protein Extraction

B. subtilis strains, WT and ∆GO, were propagated in a Luria–Bertani (LB) medium to an OD600 of 1.0. At this point, the strain cultures were split into two subcultures; one of the subcultures was left untreated, whereas the other was supplemented with a lethal dose (fifty (LD50)) of hydrogen peroxide (H2O2) that was experimentally determined for each genetic background. The subcultures were incubated for an additional time of 30 min. The cultures were centrifuged at 10,000× g for 10 min, washed two times, and then resuspended in 10 mL of 1 X Spizizen Minimal Salts (SMS) [36]. Cell lysis was carried out by initially boiling the sample, followed by repeated freeze/thaw cycles, combined with mechanical disruption using glass beads in aqueous medium; cell debris and beads were removed by centrifugation (16,000× g for 10 min at 4 °C). The protein content in the cell-free extract was determined using the bicinchoninic acid method, using the Micro BCA Protein Assay Kit (Thermo Scientific; Waltham, MA, USA). Eight μg samples of each cell extract were analyzed in duplicate, using 10% sodium dodecyl (SDS), polyacrylamide gels (PAGE) that were stained with Coomassie R-250 blue dye [37]. We pooled a total of 50 μg of protein from three biological triplicates for each condition and subjected them to enzymatic digestion, following previously described protocols [38]. For LC-MS/MS, we analyzed two independent biological replicates.

2.3. Protein Identification and Quantitation with Mass Spectrometry Analysis LC-ESI-HDMSE

An aliquot from a stock solution of alcohol dehydrogenase (ADH1, Waters, Milford, MA, USA) of Saccharomyces cerevisiae (UniProt accession: P00330), predigested with trypsin, was added as an internal standard to all peptide samples to obtain a final concentration of 25 fmol·μL−1, as previously reported [39]. The resulting peptides were injected into the mass spectrometer Synapt G2-Si (Waters, Milford, MA, USA), in MSE mode, to calculate the area under the curve (AUC) of the total ion chromatogram (TIC). The samples were normalized prior to injecting them into the nanoUPLC. The same number of tryptic peptides in each condition were loaded into a Symmetry C18 Trap V/M precolumn (180 μm × 20 mm, 100 Å pore size, 5 μm particle size), and they were desalted via mobile phase A (0.1% formic acid (FA) in H2O), and mobile phase B (0.1% FA in acetonitrile (ACN)) under the following isocratic gradient: 99.9% mobile phase A and 0.1% of mobile phase B at a flow of 5 μL·min−1 over 3 min. Afterwards, peptides were loaded and separated on an HSS T3 C18 column (75 μm × 150 mm, 100 Å pore size, 1.8 μm particle size). This process used an UPLC ACQUITY M-Class with the same mobile phases under the following gradient: 0 min 7% B, 121.49 min 40% B, 123.15 to 126.46 min 85% B, 129 to 130 min 7% B, at a flow of 400 nL·min−1 and 45 °C. The spectra data were acquired using a mass spectrometer with nanoelectrospray ionization (nanoESI) and ion mobility separation (IM-MS), via a data-independent acquisition (DIA) approach through HDMSE mode (Waters, Milford, MA, USA). At the tune page, for the ionization source, parameters were set with the following values: 2.75 kV in the sampler capillar, 30 V in the sampling cone, 30 V in the source offset, 70 °C for the source temperature, 0.5 bar for the nano flow gas, and 150 L h−1 for the purge gas flow. Two chromatograms (low and high energy chromatograms) were acquired in positive mode, in a range of m/z 50–2000, with a scan time of 500 ms. The low collision energy applied was 4 eV to obtain the low-energy chromatogram, and for the high-energy chromatograms, we used a 19–55 ev collision ramp to fragment the precursor during the transfer phase.
Generated *.raw files containing MS and MS/MS spectra were deconvoluted using Progenesis QI for Proteomics v4.2 software (Waters), and they were compared with B. subtilis (strain 168) (downloaded from Uniprot (https://uniprot.org/, accessed on 1 May 2022), proteome ID UP000001570, 4269 proteins, 1 May 2022). Parameters used for database searching were as follows: trypsin as the cut enzyme with one missed cleavage allowed and carbamidomethyl (C) as a fixed modification, where oxidation (M), amidation (C-terminal), deamidation (Q, N), or phosphorylation (S, T, Y) were variable modifications. For the default peptide and fragment tolerance (maximum normal distribution of 10 and 20 ppm, respectively), we used 2 minimum fragment ion matches per peptide, 5 minimum fragment ion matches per protein, 1 minimum peptide match per protein, and a false discovery rate of ≤4%. Synapt G2-Si was calibrated with [Glu1]-fibrinopeptide, [M + 2H]2+ = 785.84261 at less than 1.5 ppm. The three most reliable peptides per protein (Top3) were used for absolute quantitation, according to a previously described method [40,41]. We used a Log2 Fold Change value of ±0.585, equivalent to an absolute fold change of least ±1.5 [42]. The ratio was calculated based on the absolute quantification (ng on column) of each characterized protein. The mass spectrometry proteomics data are provided as a Supplementary Materials in this manuscript.

2.4. Treatment of Vegetative Cells with Oxidizing Agents

Strains were propagated in a liquid LB medium at 37 °C to reach an OD600 of 1.0. Then, cultures were exposed to increasing doses of H2O2 or tert-Butyl hydroperoxide (t-BHP) for an additional period of 0.5 h. We measured cell survival by plating serial dilutions in SS 1X, comprising cells that were either unexposed or exposed to the oxidizing agents on the LB medium agar. Colonies were counted after overnight incubation at 37 °C, and CFU were determined in appropriately diluted plated samples (30 to 300 CFU). Data were reported as LD50 or LD90 values; namely, the concentrations of the oxidizing agent that killed 50% or 90% of the bacterial population. The LD values were calculated from dose–response curves (Figures S1–S3), and the experiments were repeated at least three times for each strain.

2.5. Determination of Mutation Frequencies

Spontaneous or H2O2-induced mutation frequencies were determined, as previously described [34]. Cells were propagated in an LB medium at 37 °C to an OD600 of 1.0, and they were split into two subcultures. One of the subcultures was left untreated to determine spontaneous mutagenesis, and the other was supplemented with a lethal dose 25 (LD25) of H2O2. The cultures were incubated at 37 °C for an additional period of 12 h. Subsequently, the cells were harvested via centrifugation (4800× g/10 min) at room temperature, they were washed 2 times, and resuspended in 1X SS. Cell samples (0.1 mL) were plated on six plates of LB medium and supplemented with Rif (10 μg/mL). The RifR colonies that grew after 24 h were counted. The number of cells in the bacterial culture was determined by serial dilution and the viable count on LB medium plates. The mutation frequency was reported as the average number of RifR colonies per 109 viable cells. These experiments were repeated at least three times for each strain.

2.6. Bioinformatic Analysis

Label-free intensity analysis was selected for each individual sample. A two-sample Student’s t test, based on the triplicate of each sample group, was performed on log2-transformed intensity values. To classify proteins as variant and non-variant in a scatter plot, the Student’s t test difference >1 (twofold change) and p value < 0.05 were chosen as criteria. A heat map of the protein profiles detected in the two strains, in the absence and presence of H2O2, was performed; furthermore, an analysis was made in the “PANTHER” database (available online: http://pantherdb.org/, accessed on 1 May 2022) to classify the function of the proteins detected.
Interactions between proteins of interest were analyzed using the STRING database (https://string-db.org/, accessed on 1 May 2022).

2.7. Statistical Analyses

Statistical analyses to compare the results of susceptibility with oxidizing agents and mutation frequencies between the mutant and wild-type strains were performed using one-way analysis of variance (ANOVA), followed by Tukey’s multiple comparison test, p < 0.05.

3. Results

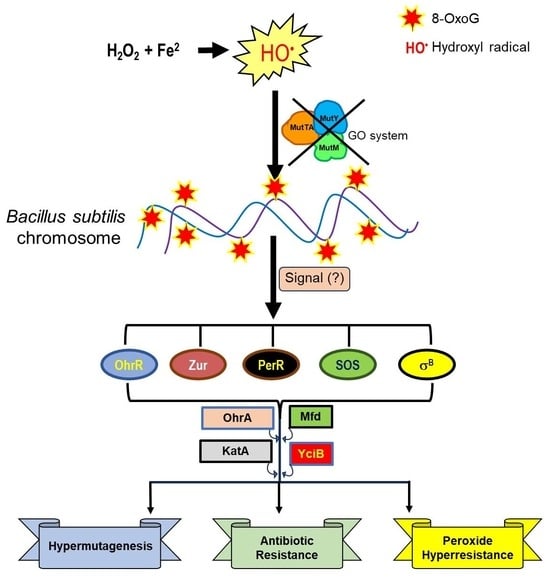
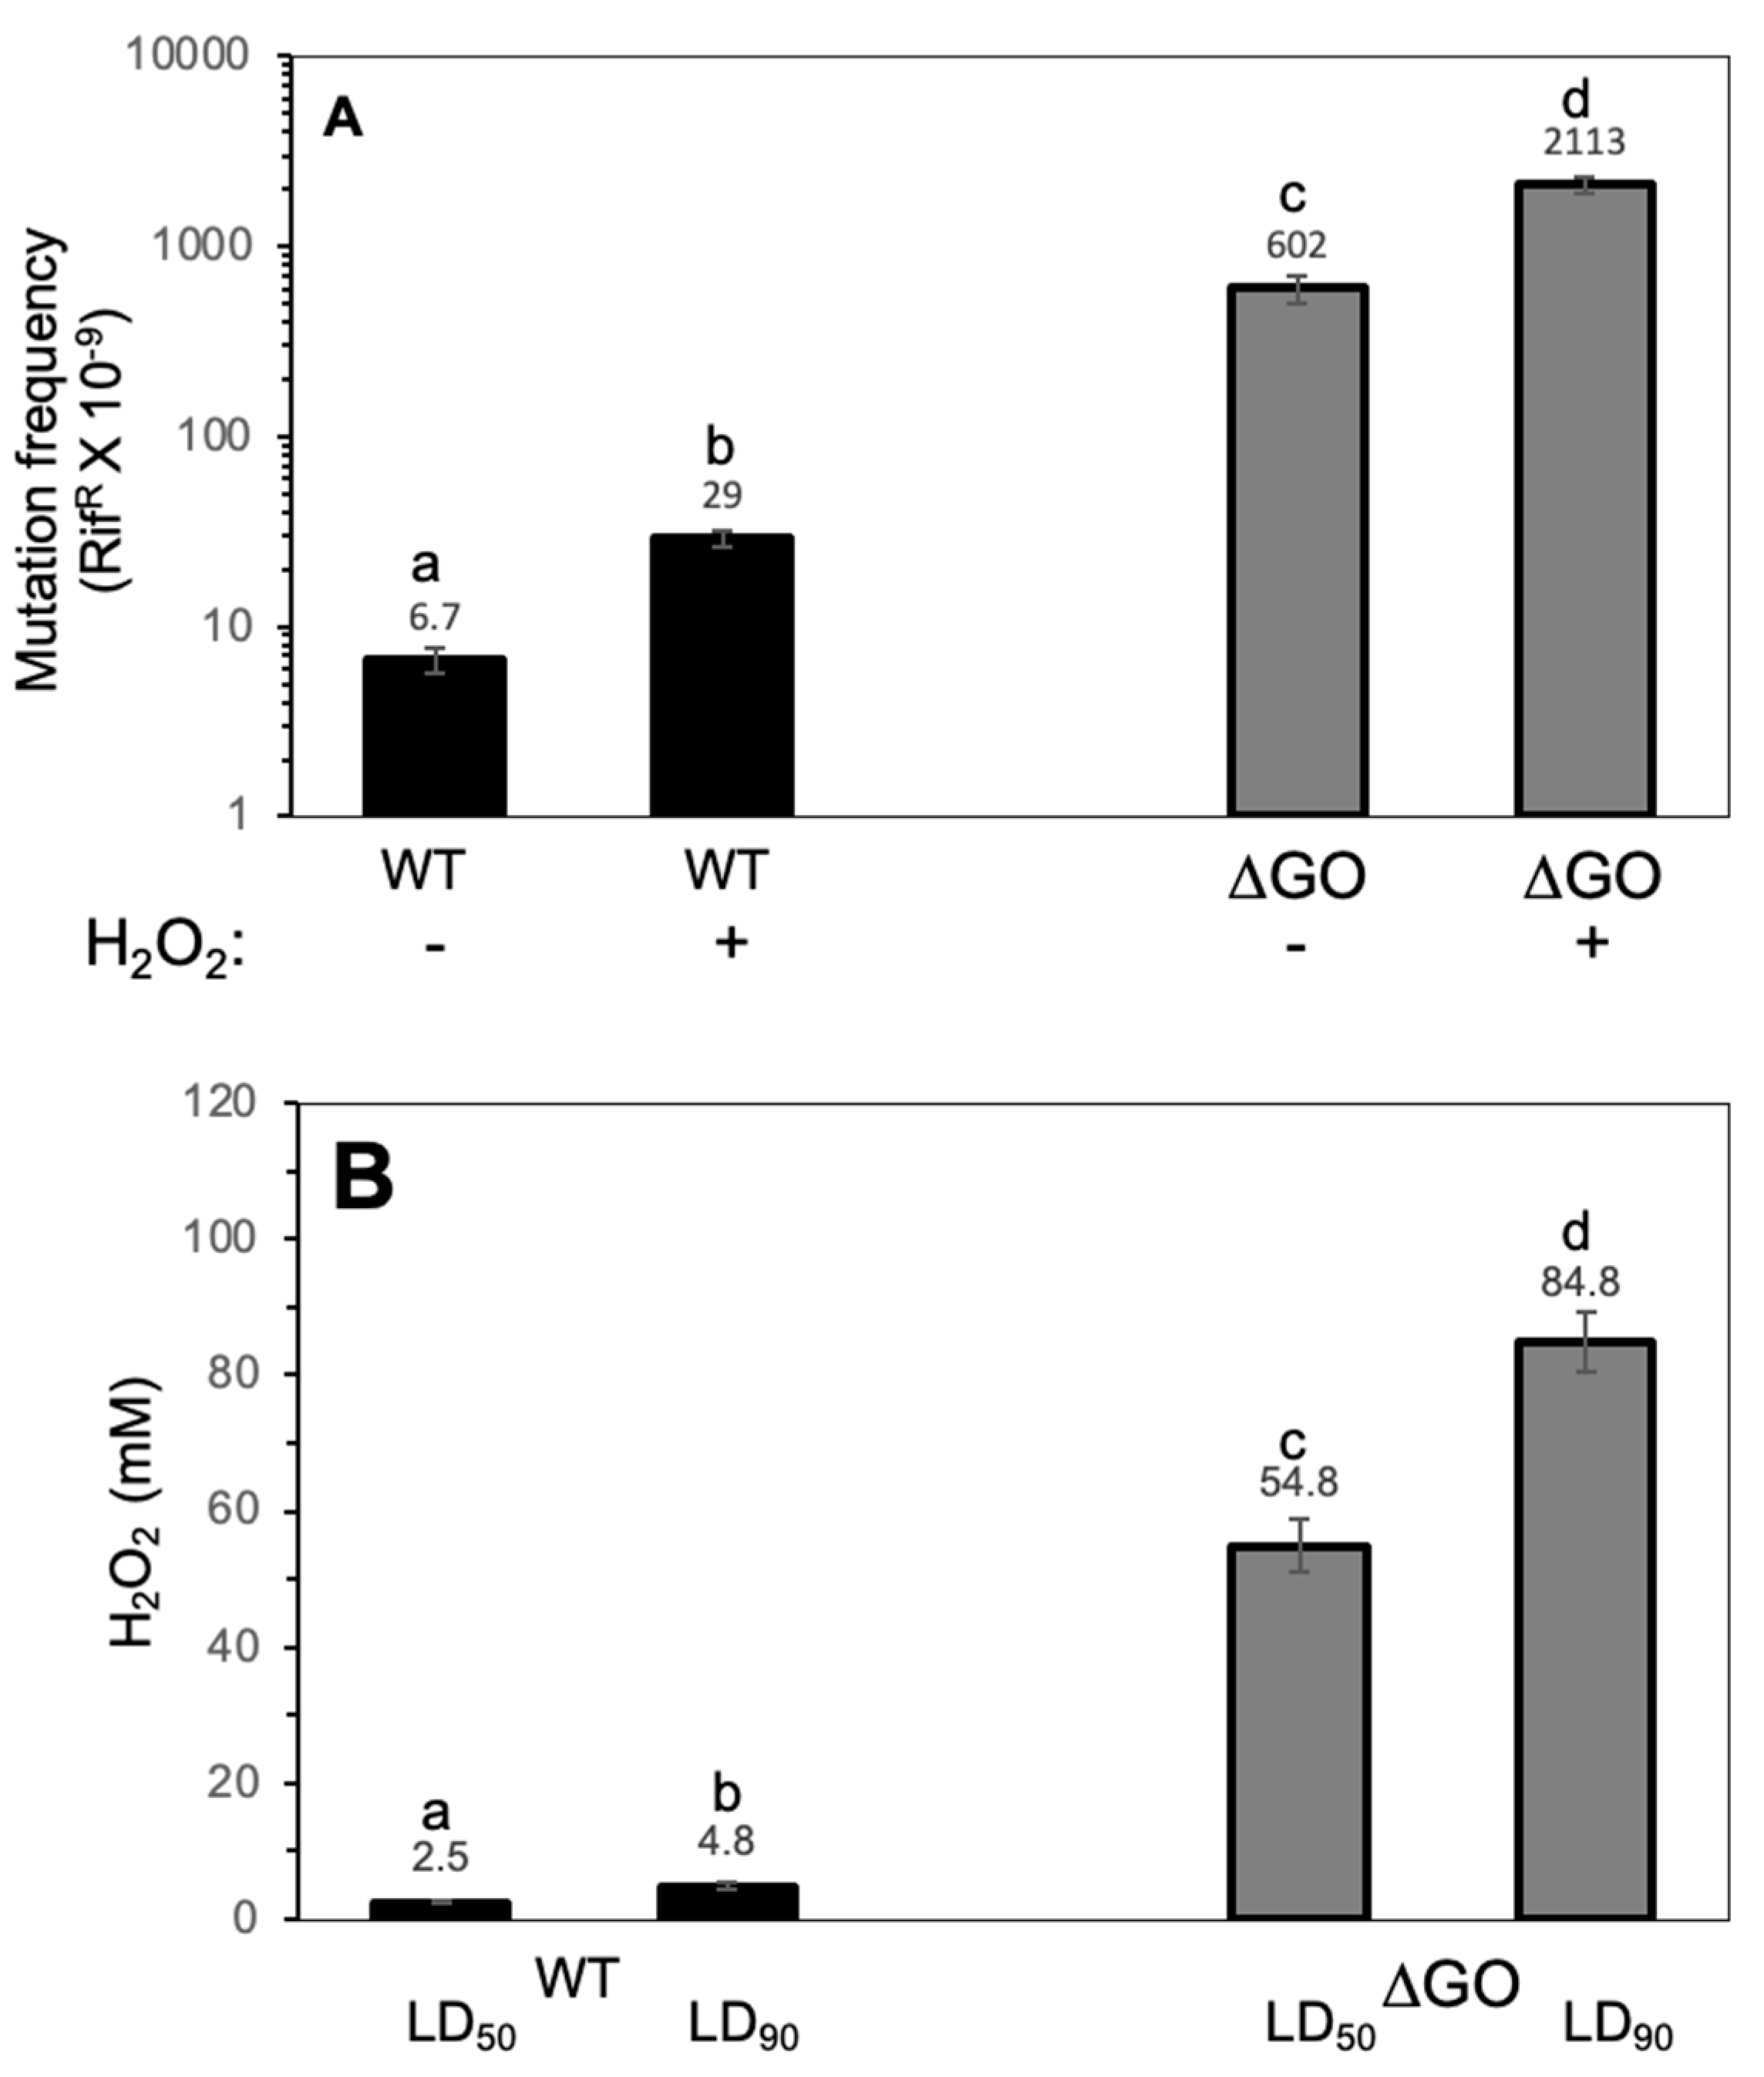
3.1. The Absence of the GO System Promotes Hypermutagenesis (HPM) and Hydrogen Peroxide Hyperresistance (HPHR) in Vegetative B. subtilis Cells

A previous study revealed that the simultaneous disruption of mutM, mutY, and ytkD (mutTA) increases the reversion frequencies of defective amino acid biosynthesis genes by 3–4 orders of magnitude in the stationary phase of starved B. subtilis cells [31,32]. In this work, we determined the impact of 8-OxoG accumulation in the growth-associated mutagenesis of B. subtilis. Our results demonstrated that in reference to the WT parental strain, the genetic inactivation of the GO system increases the spontaneous and H2O2-promoted mutation frequencies to RifR in growing B. subtilis by ~90 and ~70 fold, respectively (Figure 1A). We next investigated the ability of B. subtilis cells to survive the noxious effects of H2O2. Surprisingly, the lethal concentrations of H2O2 that killed 50 and 90% of the population were much higher in the GO mutant than in the parental strain. The LD90 value of H2O2 in the GO mutant increased by ~18 fold compared with the parental strain (i.e., 84.8 ± 8 vs. 2.5 ± 0.2) (Figure 1B). Altogether, these results indicate that the increased ability to withstand exposure to H2O2 is associated with increased mutagenesis in the GO mutant strain of B. subtilis.

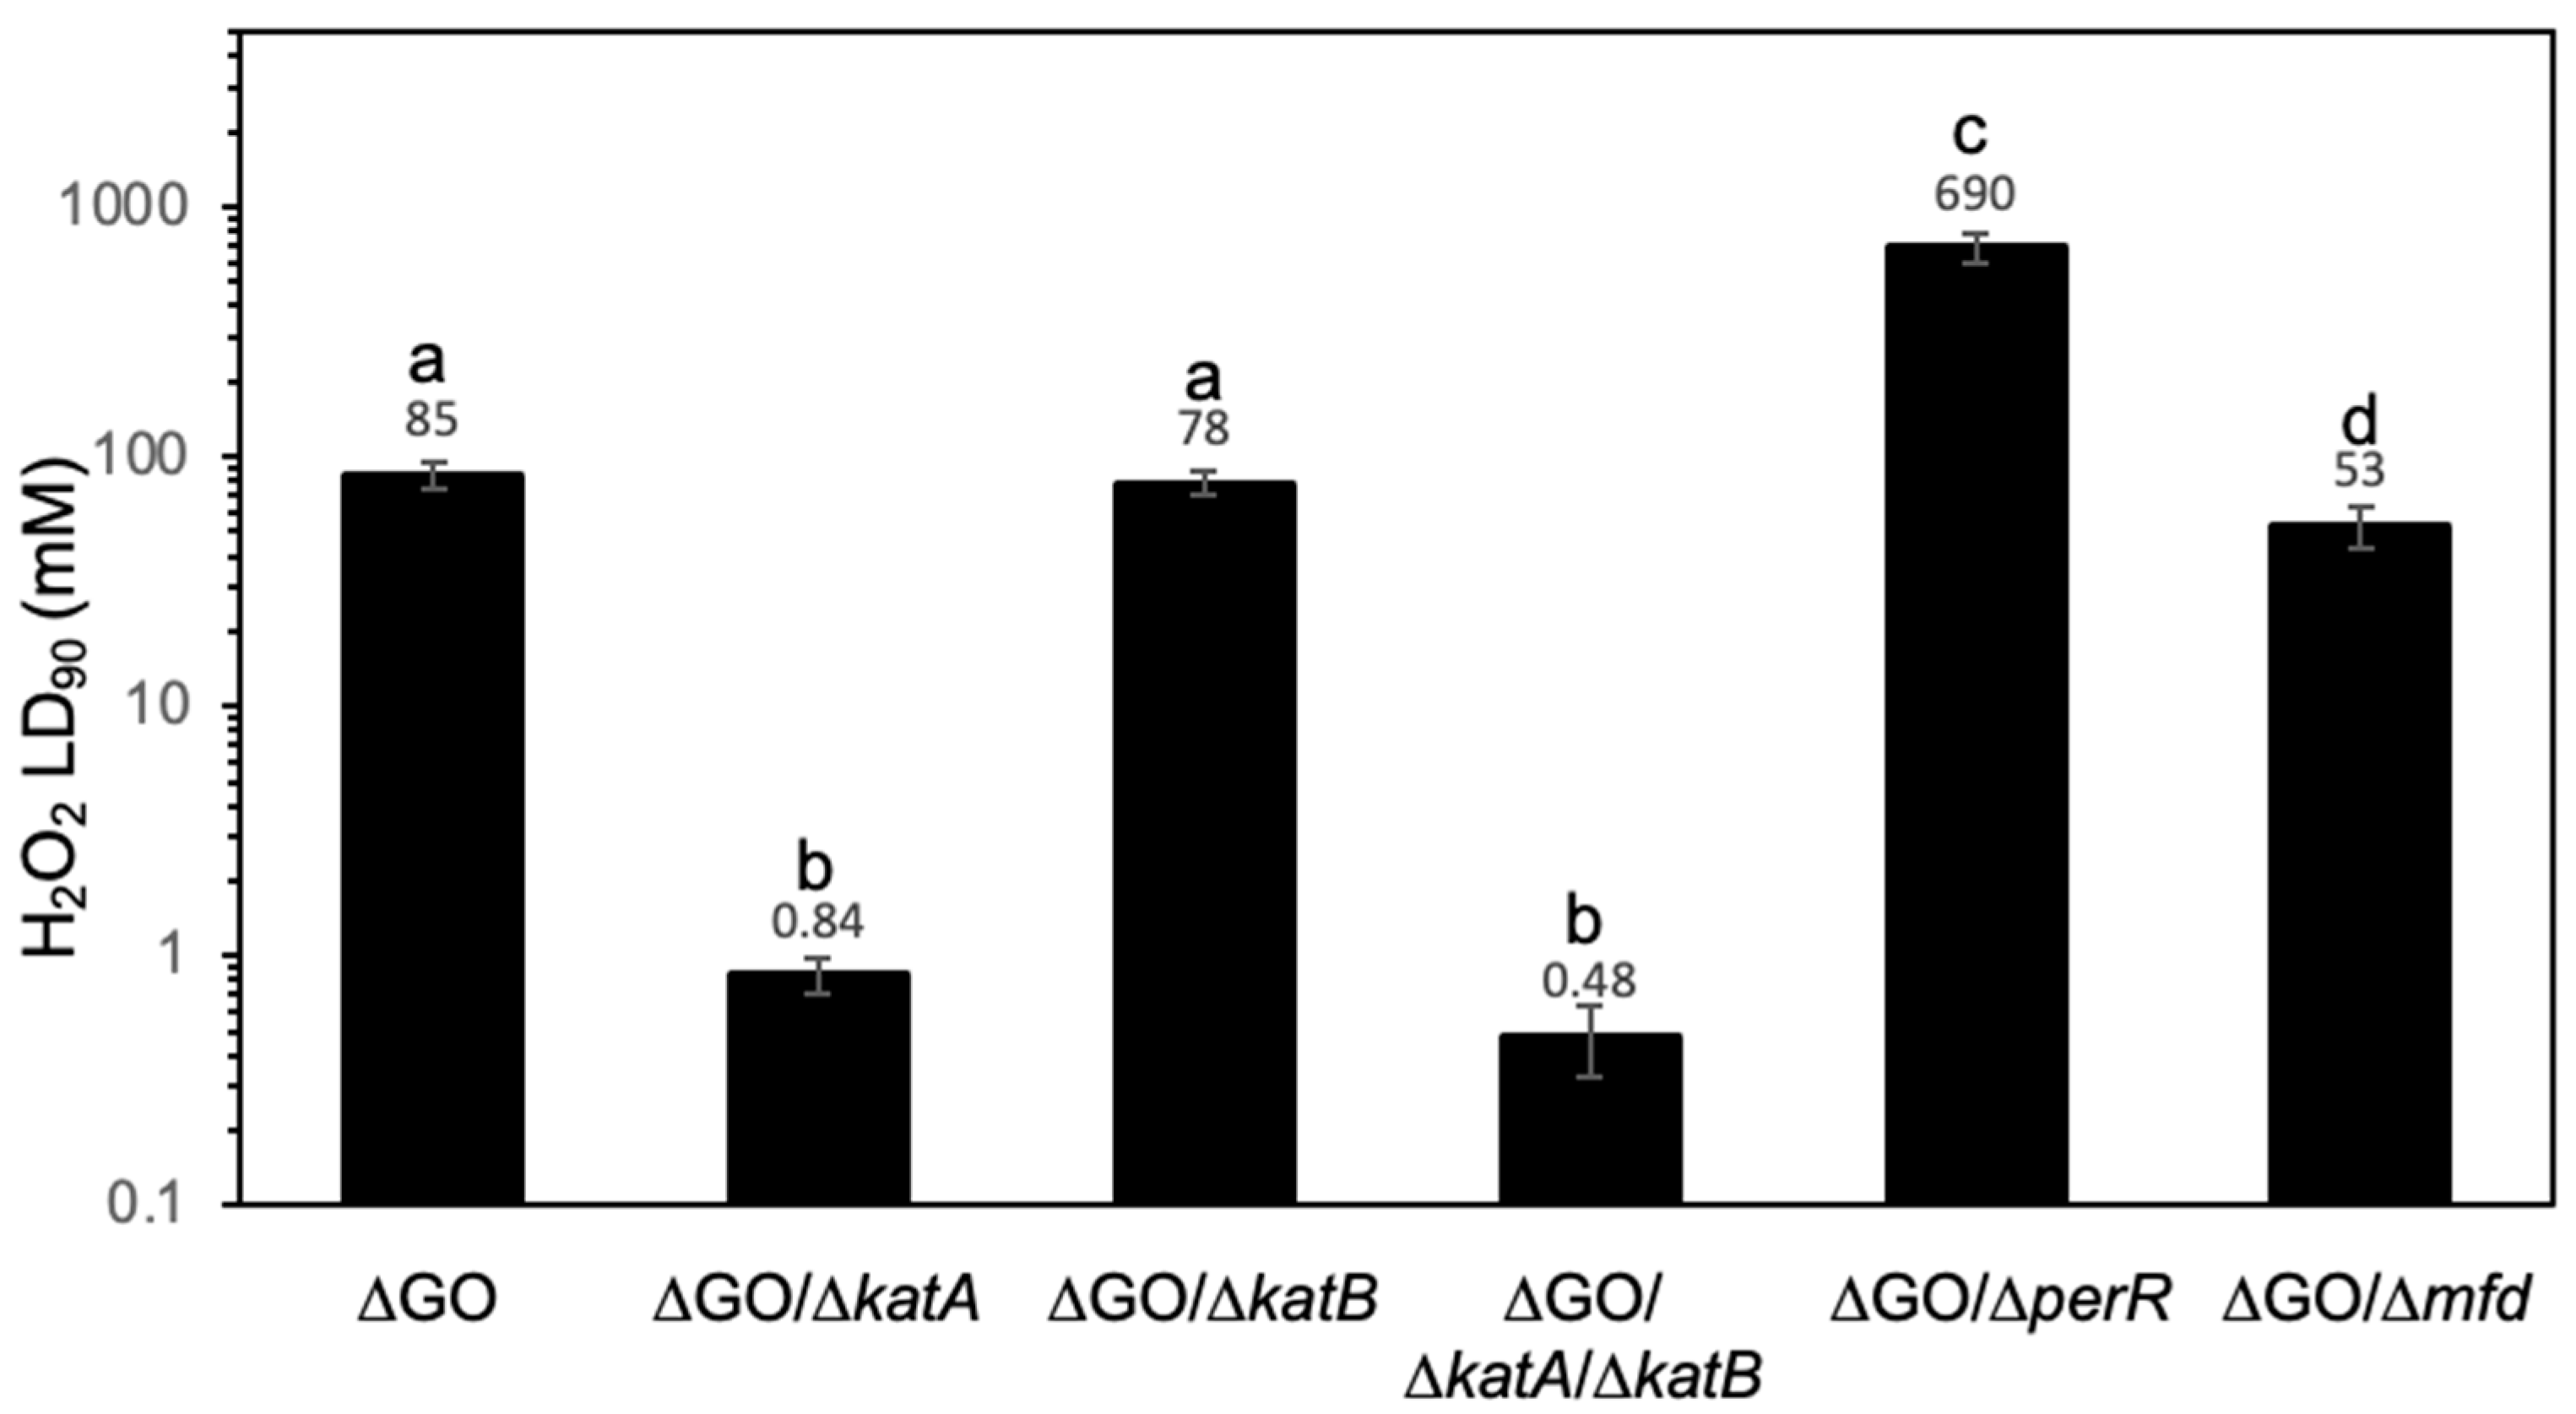
3.2. The HPHR of the ΔGO Strain Is katA Dependent, but perR Independent, and Influenced by Mfd

Hydrogen peroxide is detoxified in exponentially growing B. subtilis cells, primarily by KatA, which is encoded by the katA gene; the expression of this gene is controlled by the PerR repressor [12,15]. However, this microorganism also possesses KatB, whose encoding gene is regulated by the general stress sigma factor, σB [14,43]. Therefore, we first investigated the contribution of katA and KatB to the H2O2-HPHR of the ∆GO strain. To this end, katA, katB, or both were disrupted in the genetic background of ΔGO, and the resulting strains, ∆GO/∆katA, ∆GO/∆katB, and ∆GO/∆katA/∆katB were tested for their resistance to H2O2. The results showed that ∆GO KatA and ∆GO KatA KatB, but not ∆GO KatB cells, exhibited a reduced tolerance to H2O2 compared with ∆GO cells (Figure 2).
As noted above, katA belongs to the PerR regulon and it responds to oxidative stress. However, PerR controls the expression of other genes involved in peroxide resistance, including ahpC-ahpF, mrgA, spx, and perR [6,15]; this prompted us to investigate the contribution of all the genes in the PerR regulon to the H2O2 HPHR in the GO-deficient strain. Then, we challenged a deficient strain in both the GO system and PerR with increasing concentrations of hydrogen peroxide. As expected, the inactivation of perR led to the ∆GO strain exhibiting significantly increased resistance to H2O2, the LD90 value of this strain was 690 ± 18 compared with 85 ± 8 in the PerR replete ∆GO strain (Figure 2). Furthermore, the increased resistance to H2O2 is significantly higher in the ∆GO/ΔperR compared with the ∆GO/ΔkatA strain.
These results strongly suggest that in the GO-deficient strain (i) PerR is not fully activated, (ii) the KatA effects are PerR-independent, and (iii) additional factors may be involved in granting it high resistance to H2O2.
The Mfd protein was recently shown to modulate B. subtilis SAM and prevent genetic damage promoted by lesions of an oxidative nature [33,44,45,46]. Here, we found that this factor influences the H2O2-HPHR of the ∆GO strain, the ∆GO ∆mfd cells exhibited a significant reduction in the LD90 to H2O2, with respect to that determined in the GO-deficient strain (53 ± 2.7 vs. 85 ± 0.7, respectively) (Figure 2).

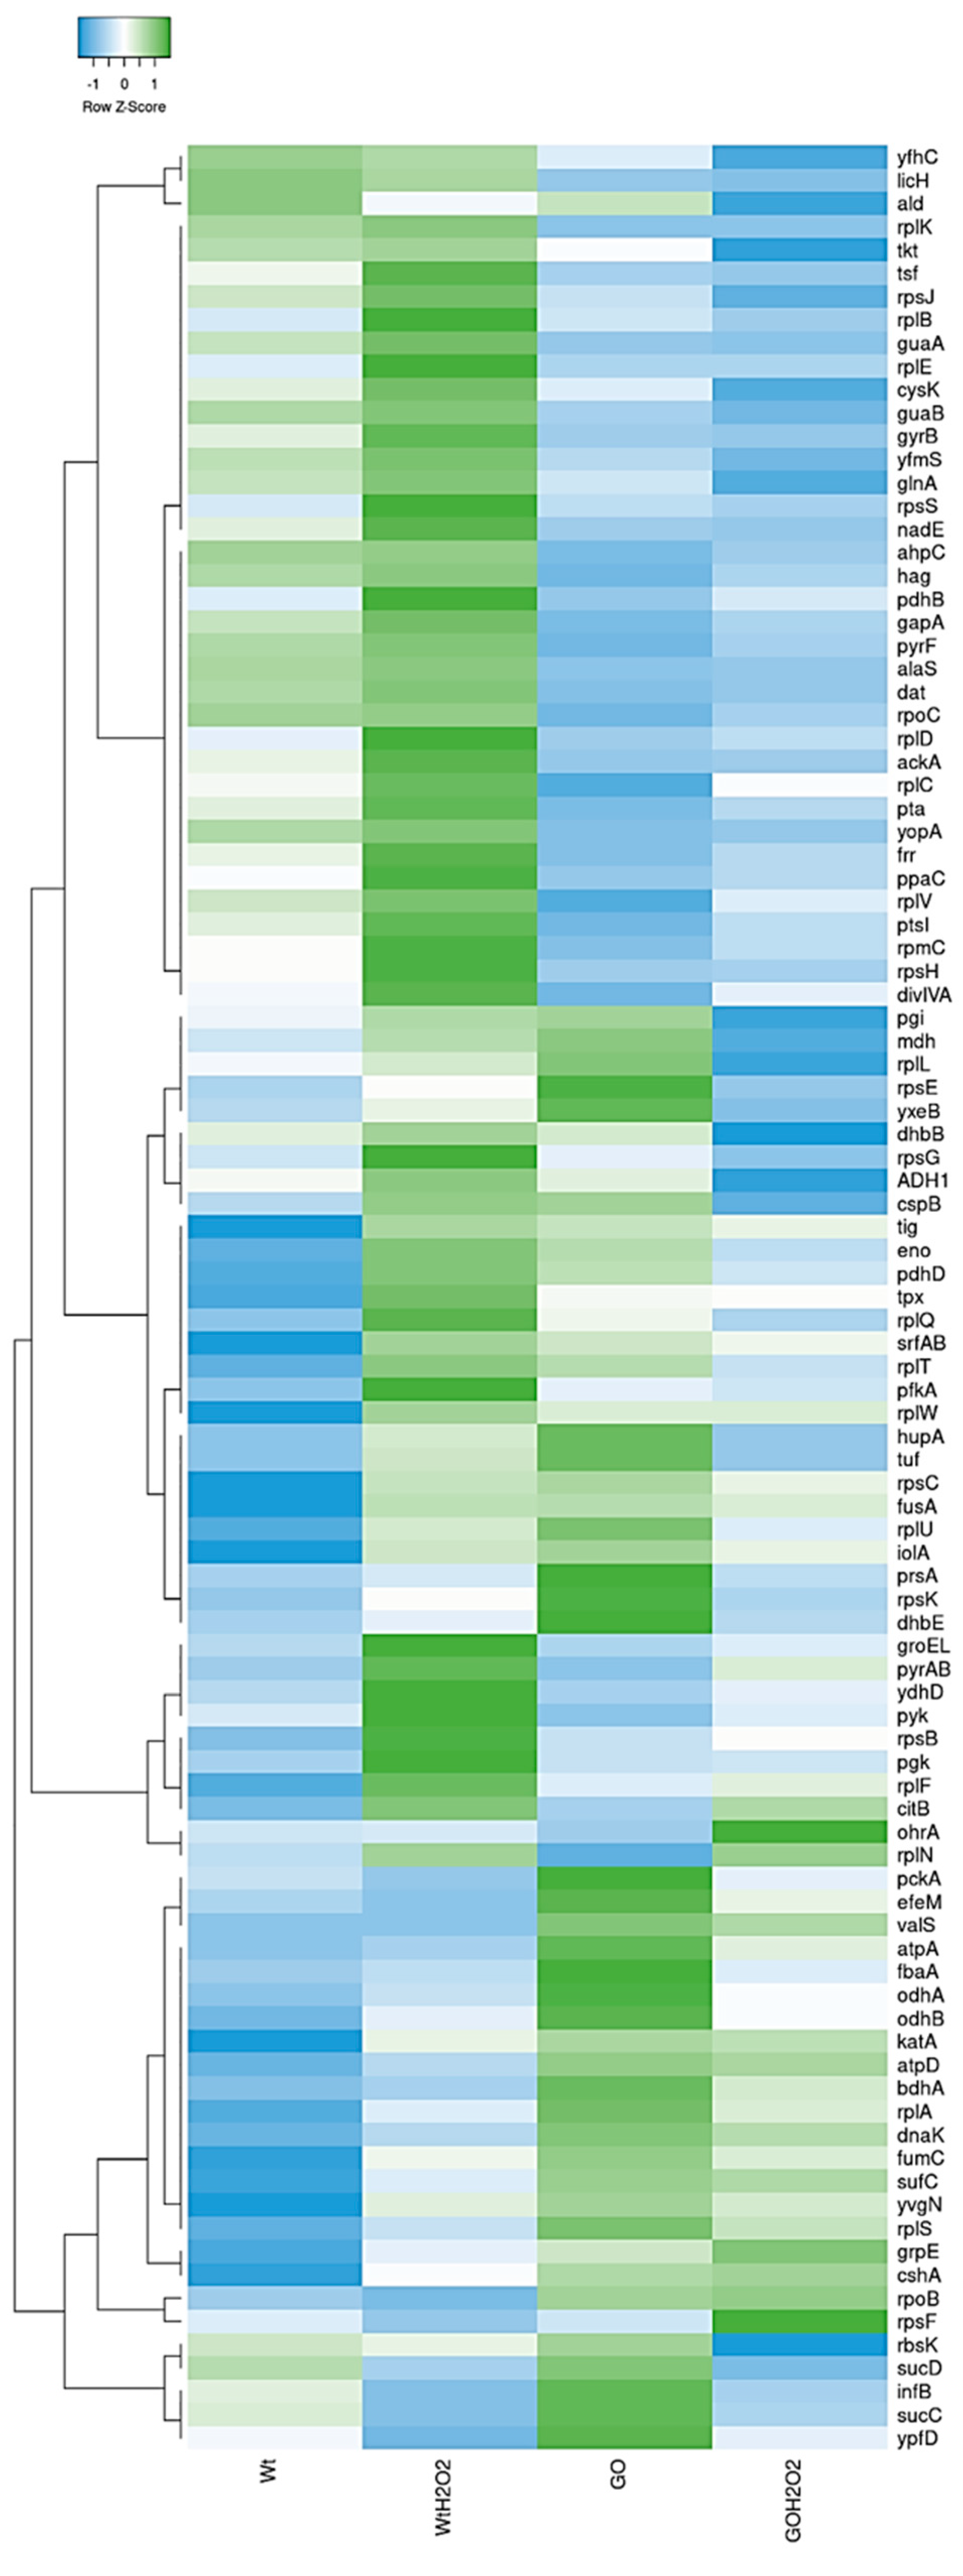
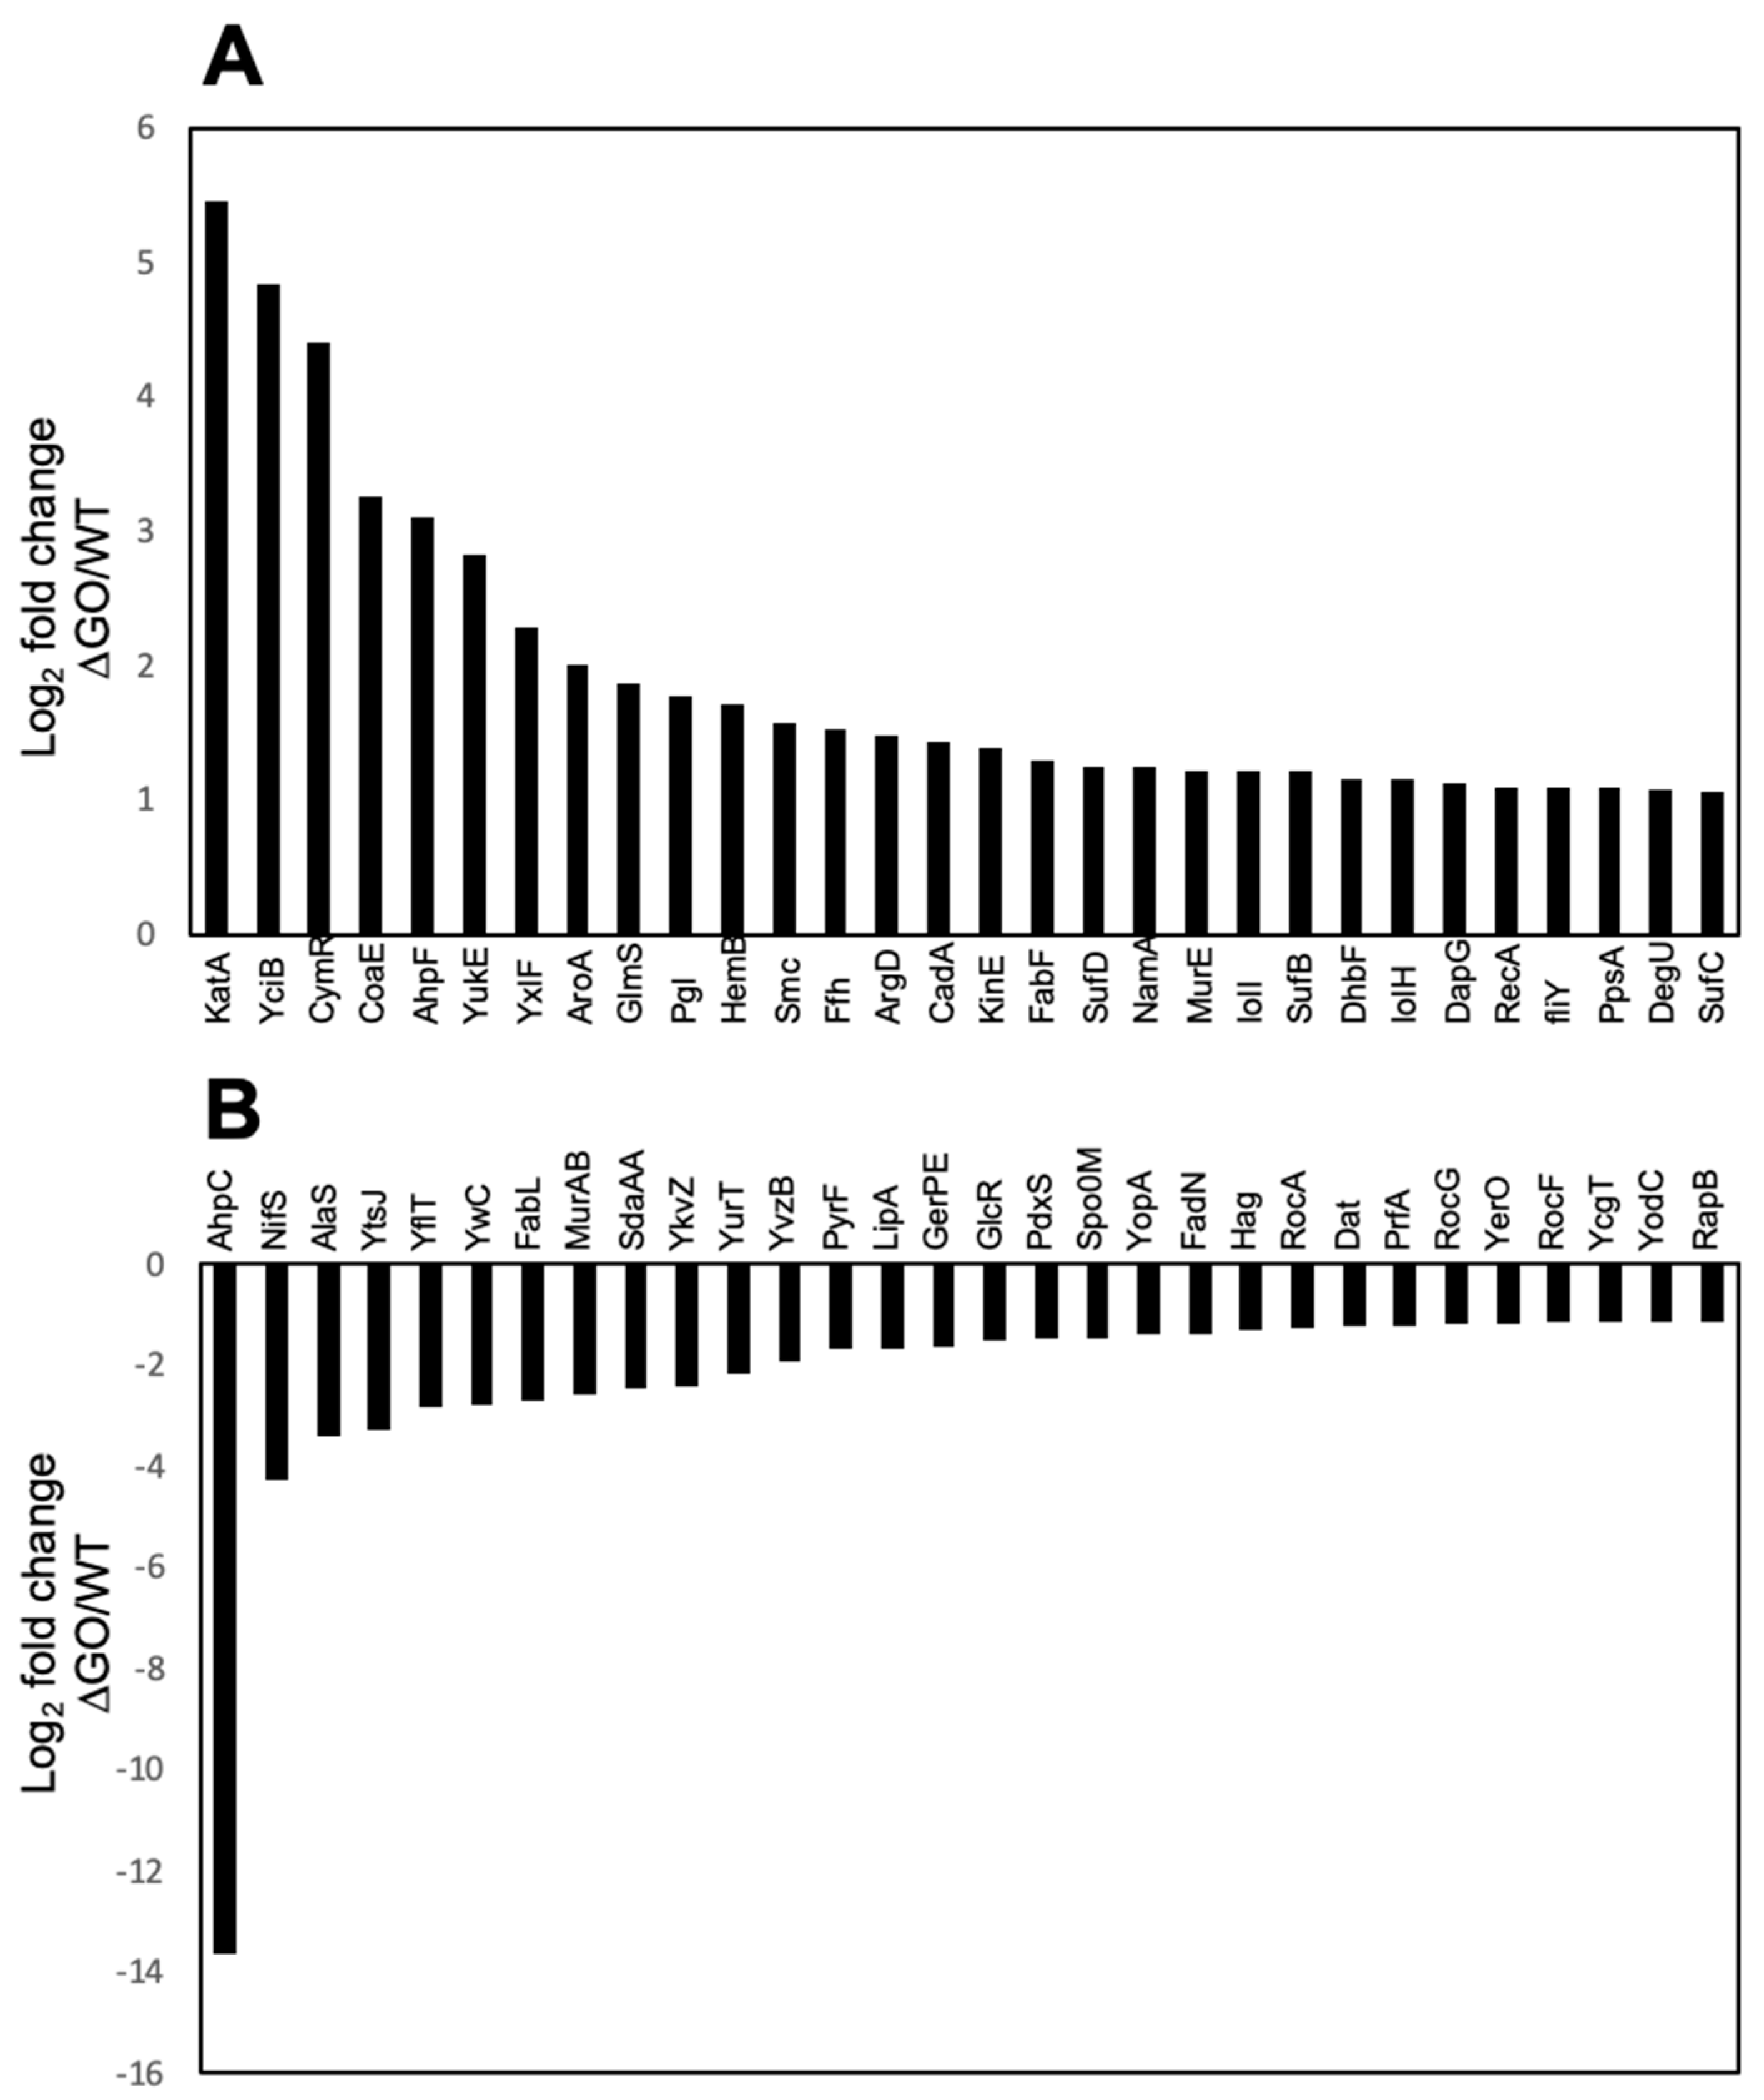
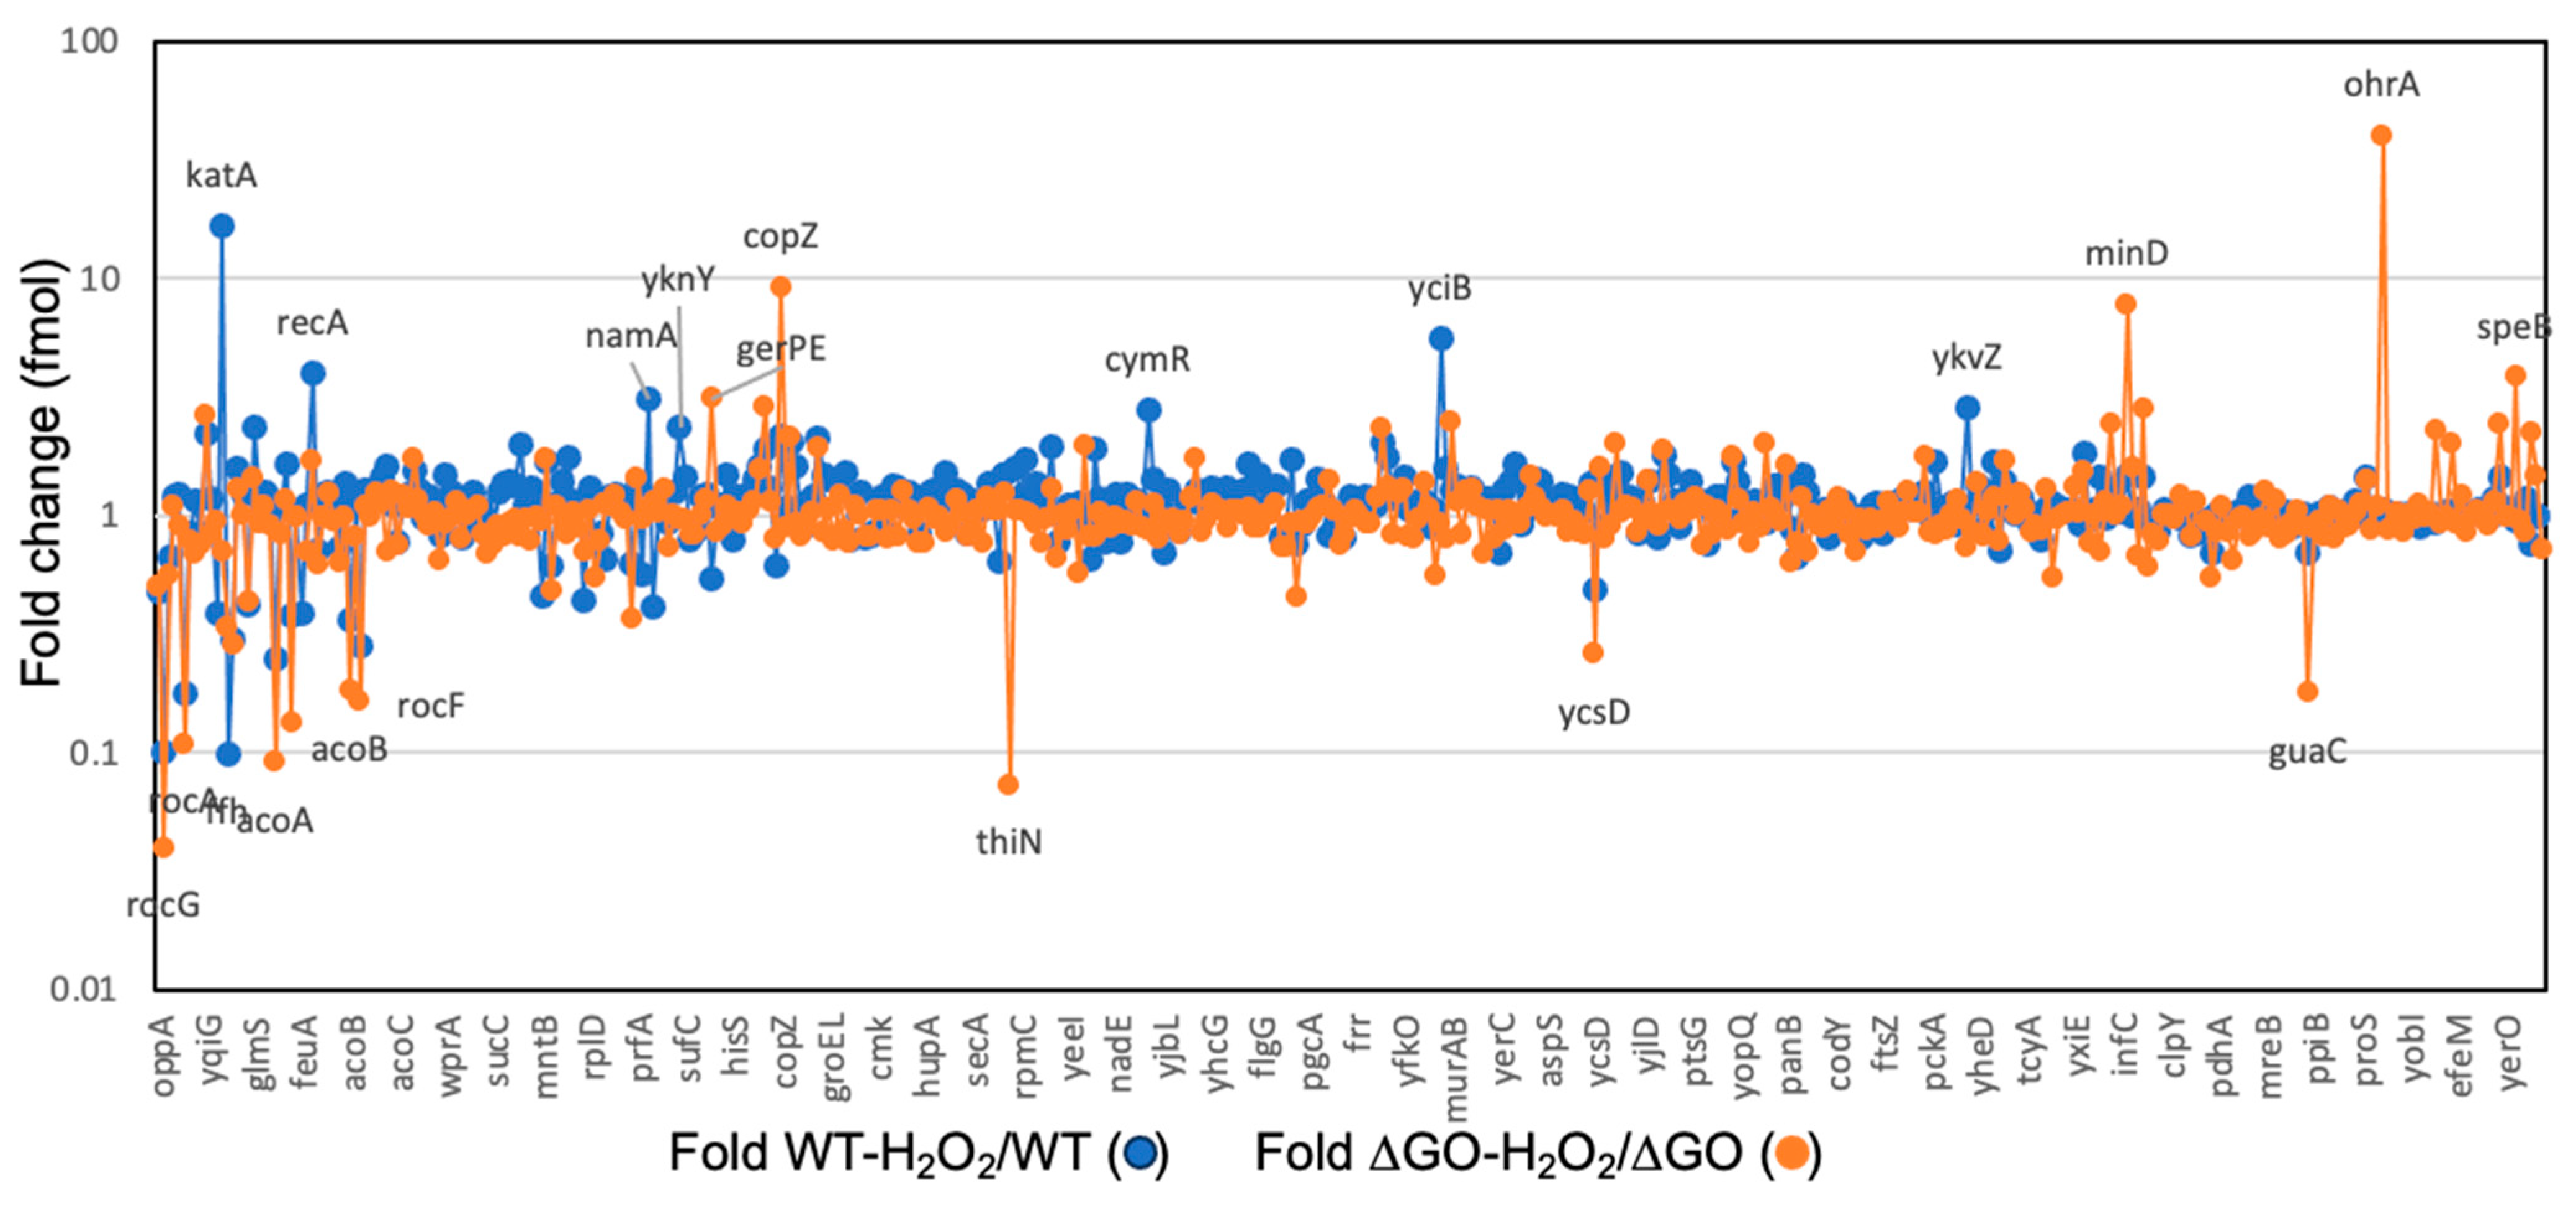
3.3. Global Protein Analysis Reveals Novel Factors Contributing to the HPM and HPHR of the Strain B. subtilis ∆GO

To identify factors other than KatA, PerR, and Mfd which are involved in the HPM and HPHR of the strain B. subtilis ∆GO, we analyzed the global protein profile of this strain under conditions of normal growth or following exposure to H2O2. Thus, we grew cultures to the exponential phase of this mutant and its WT parental strain and treat them or not with LD50s of H2O2, and we incubated them for an additional period of 30 min. The protein profiles from H2O2-treated and untreated cultures, extracted via the mechanical disruption of cells were resolved with SDS-PAGE (Supplementary Figure S4).
The extracted proteins from each culture were analyzed via LC-MS/MS, as described in Materials and Methods. We used B. subtilis global databases [47,48] and identified ~500 proteins. The PANTHER database revealed that proteins involved in metabolite interconversion were numerically dominant (58%), followed by proteins of the translation machinery (17%), transporter proteins (5%), and proteins with unrelated functions (Supplementary Figure S5). Furthermore, a heat map based on protein-fold changes revealed dissimilar global protein profiles between the WT and GO-deficient strain, and between H2O2-treated and control cells in both strains (Supplementary Figure S6).
We focused our analysis on the 100 proteins with the strongest dysregulation between the WT and ∆GO strains that were either treated with H2O2 or not. A heat map based on the Log2 values of these proteins confirmed the existence of dissimilar protein profiles between the WT and ∆GO strains (Figure 3).
The fold change of the 30 proteins that exhibited the highest or the lowest synthesis in the ∆GO strain, with respect to the WT strain, were plotted and presented in Figure 4. These results revealed that proteins involved in oxidative stress, coenzyme A synthesis, cysteine metabolism, and peptidoglycan synthesis, respectively, were upregulated in the ∆GO strain (Figure 3 and Figure 4A). On the other hand, proteins involved in amino acid and lipid metabolism, as well as in general and peroxide stress, were down-regulated in the GO-deficient strain (Figure 4B).
Treatment with H2O2 elicited different protein profiles in the WT and ∆GO strains (Figure 3 and Supplementary Figure S6). Thus, proteins like KatA, AhpC/AhpF, and RecA, from the PerR and SOS response [15,49,50,51], were induced by H2O2 in the WT strain (Figure 5). On the other hand, OhrA and CopZ, whose encoding genes were under the transcriptional control of OhrR and CopR, respectively [16,52], were upregulated by H2O2 in the GO-deficient strain (Figure 5).
To further understand the atypical phenotypes of the ∆GO strain and its response to H2O2, we analyzed highly dysregulated proteins associated with different types of cellular stresses (Table 1). We found KatA to be the protein with the highest positive fold change in the GO-deficient strain (Figure 4A and Table 1). These results agreed with our assays measuring expression in a strain containing a lacZ fusion inserted in the katA locus; β-galactosidase activity was 18 times higher in the ∆GO strain than in the WT strain (namely, 312 ± 12.3 vs. 68 ± 7.9). Of note, although the levels of AhpF (one of the subunits of the PerR-regulated alkyl hydroperoxide reductase (AHPR) [15]) exhibited a high fold change value (i.e., 3.1), AhpC (the other subunit of this enzyme and the peroxide stress protein OhrA [16]) showed an opposite effect exhibiting lower Log2 folds; namely, −13.7 and −0.76, respectively (Table 1). These results suggest that the increased resistance to H2O2 in the GO-deficient strain does not require AhpC/AhpF-dependent AHPR to counteract the noxious effects of organic peroxides [53,54].
Further factors involved in redox and disulfide stresses, including CymR, SufA, SufB, and SufC, respectively, are upregulated at different levels in the ∆GO strain (Table 1). CymR is a repressor involved in the metabolism of cysteine [55], whereas SufA-C are scaffold proteins that play essential roles during the synthesis of iron–sulfur clusters [56].
Proteins like the putative peptidyl transferases, YciB, which are involved in peptidoglycan biosynthesis (PG) [57,58], and the DNA binding protein, HupA (Hbs), which regulates the compaction of the nucleoid [59,60], were also found to be upregulated in the ∆GO strain (Table 1). The TrxA, YceD, and SmC proteins, which are involved in distinct cell stress responses [61], were also dysregulated in the GO-deficient strain (Table 1). The expression of the gene-coding for these proteins is under the control of the SigB and Fur factors [62,63].
In the ∆GO strain, we compared the proteins with a dysregulated status in H2O2-treated and untreated cultures. Interestingly, H2O2 treatment causes KatA levels to decrease, but OhrA concentration increases compared with the untreated cells (Table 1). A similar response was observed for YciB and HupA in the ∆GO strain (Table 1); H2O2-treated cells displayed lower levels of these proteins than untreated cells. These results strongly suggest that in addition to KatA, proteins whose syntheses are controlled by Zur, Fur, RecA, and SigB factors, as well as the stringent response, are involved in the HPM and HPHR phenotypes of the ∆GO strain.

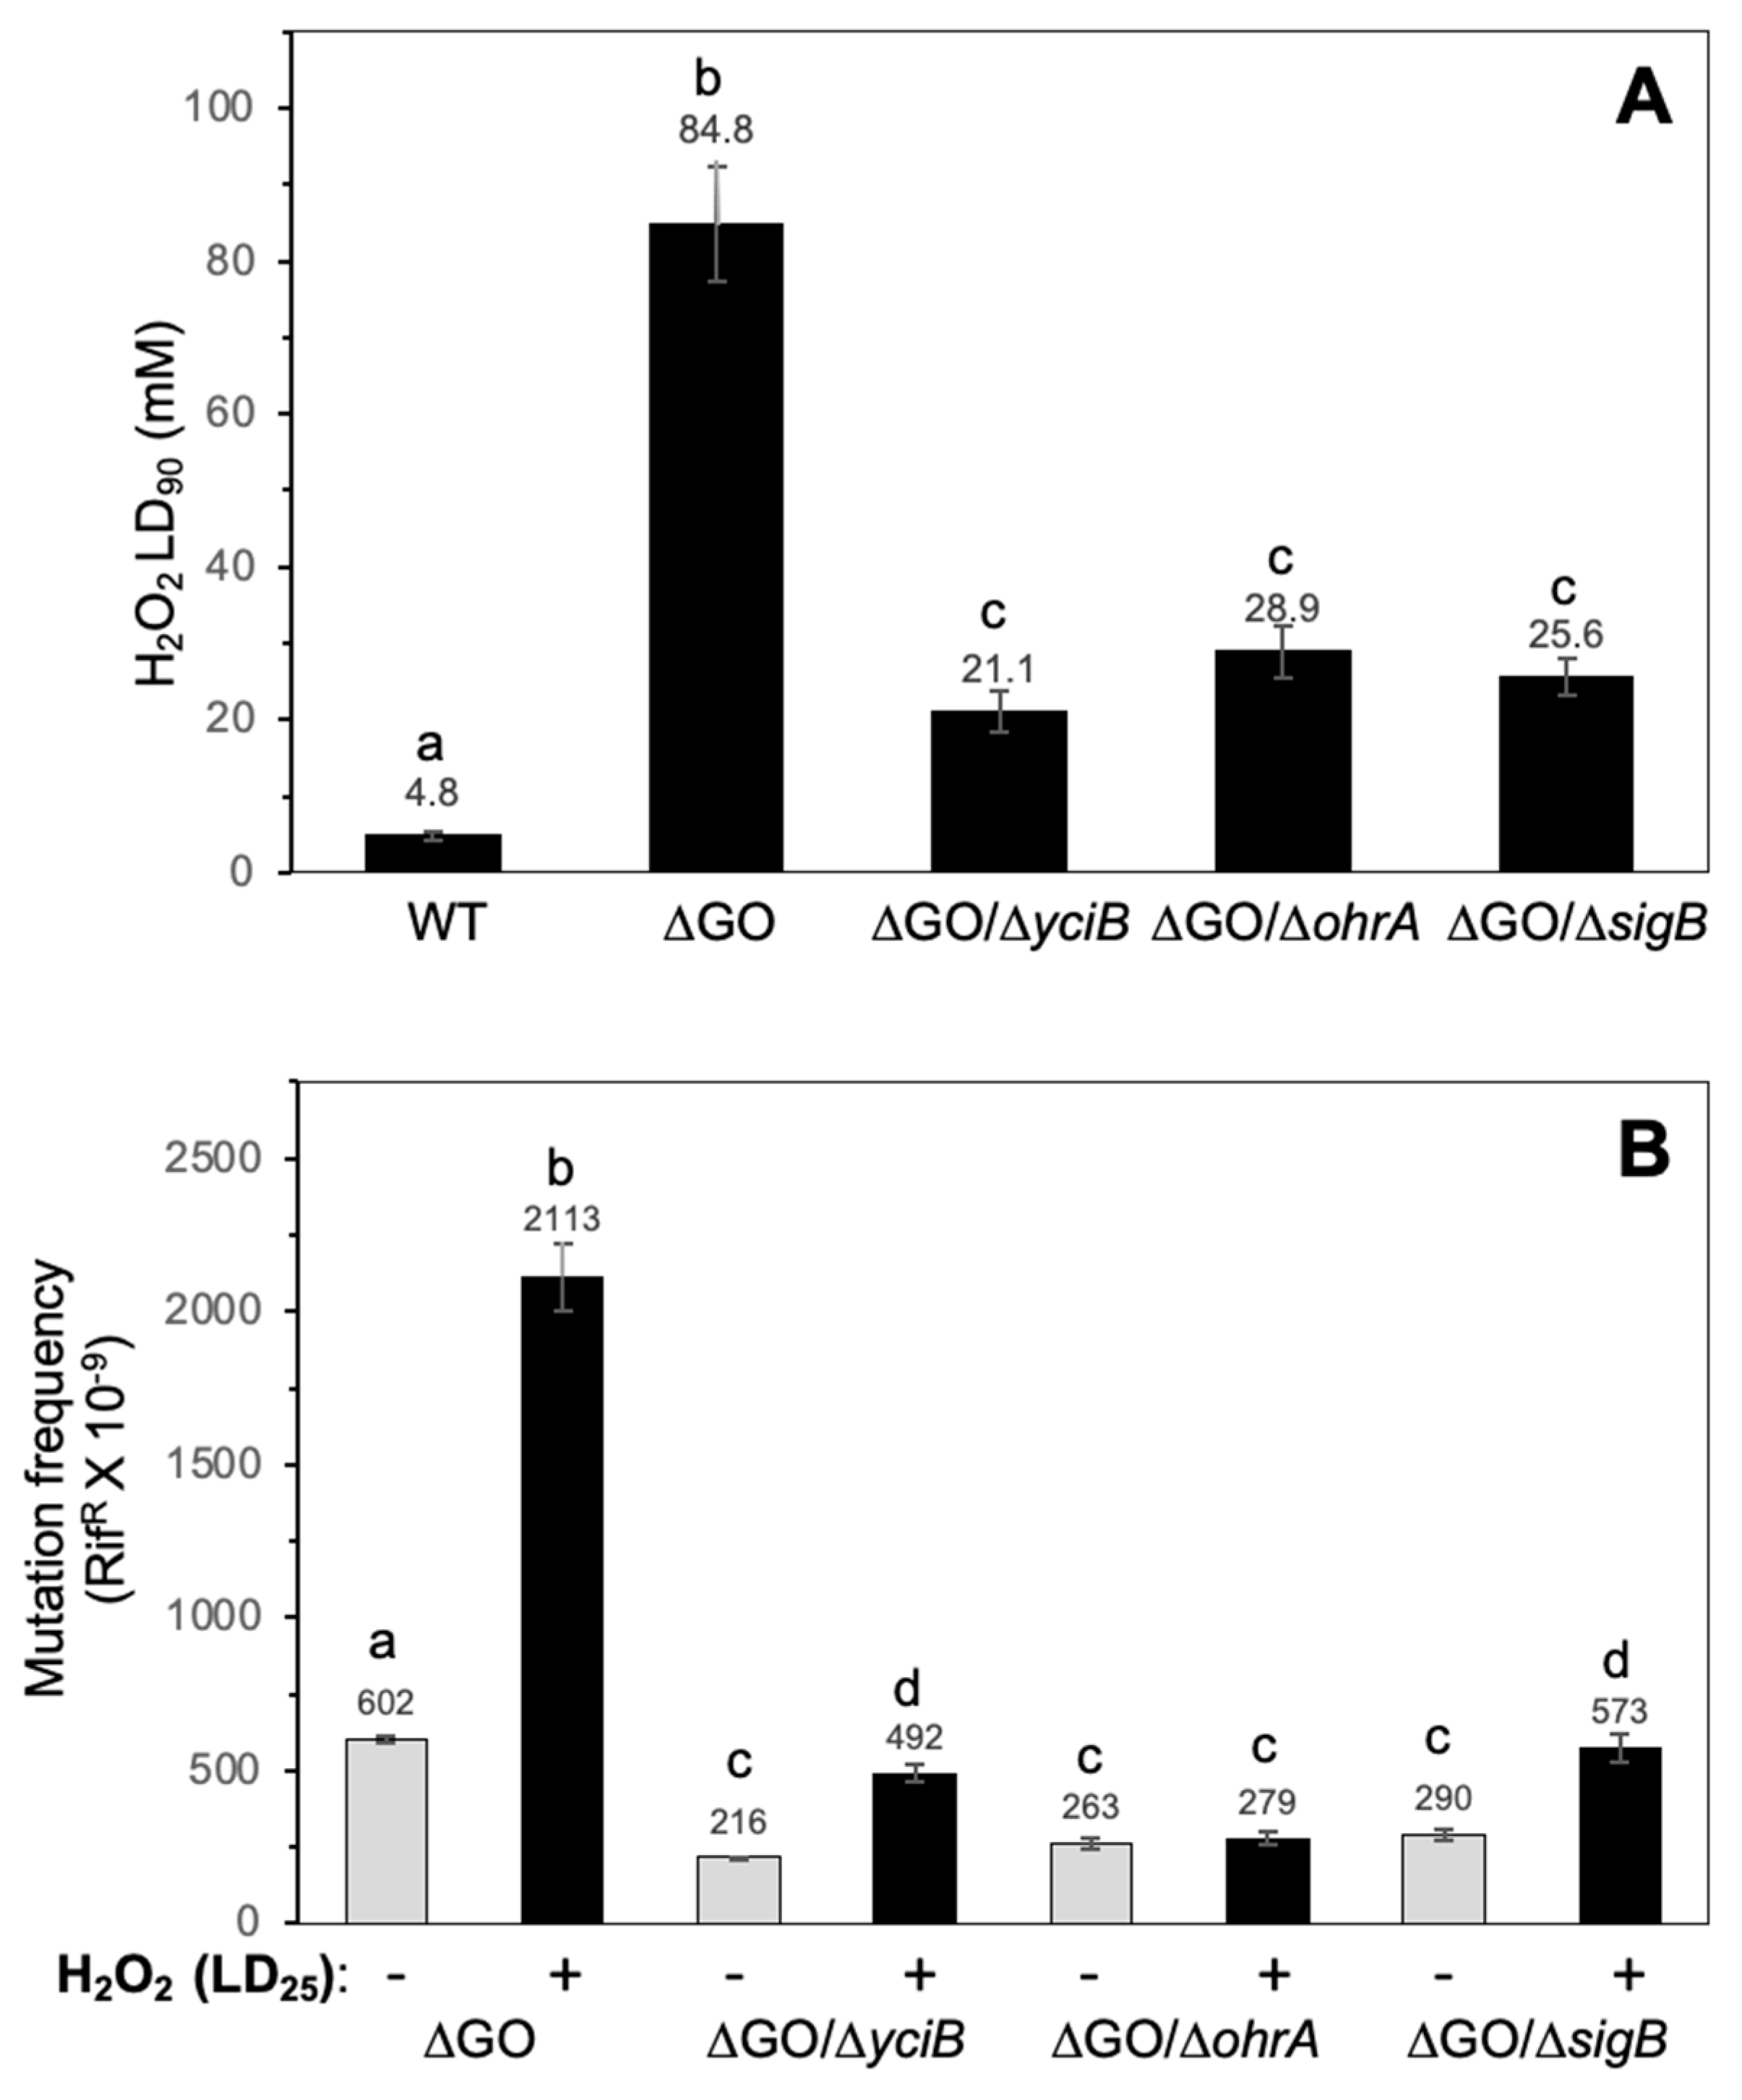
3.4. YciB, OhrA, and SigB Contribute to the HPM and HPHR of the Strain, B. subtilis ∆GO

The contribution of the peptidyl transferase, YciB, the organic peroxide reductase, OhrA, and the general stress sigma factor, SigB, to stress phenotypes of the GO-deficient strain, was measured in strains with disruptions to yciB, ohrA, and sigB. Results from inactivation curves, and the determination of lethal doses revealed that the disruption of yciB, ohrA, and sigB significantly reduces the H2O2-hyperresistence of B. subtilis ΔGO cells (Figure 6A). The ∆GO strain exhibited a LD90 of 84.8 ± 4.5, compared with 21.16 ± 2.3, 28.97 ± 4.3, and 25.6 ± 2.1 in the ∆GO/∆yciB, ∆GO/∆ohrA, and ∆GO/∆sigB strains, respectively (Figure 6A).
We also determined the spontaneous and hydrogen peroxide-promoted mutagenesis in strains that lacked the GO system, and disruptions in the genes yciB, ohrA, or sigB. In reference to the GO-deficient strain, the spontaneous RifR mutagenesis decreased ~3 times in the ∆GO/∆yciB, ∆GO/∆ohrA, and ∆GO/∆sigB mutants (Figure 6B). Furthermore, in reference to the ∆GO strain, the H2O2-induced mutagenesis decreased by 4.2, 7.5, and 3.7 times in the same background, with disruptions occurring in yciB, ohrA, or sigB, respectively (Figure 6B). Altogether, these results indicate that SigB, YciB, and OhrA contribute to the HPHR and HPM phenotypes of the ∆GO strain.

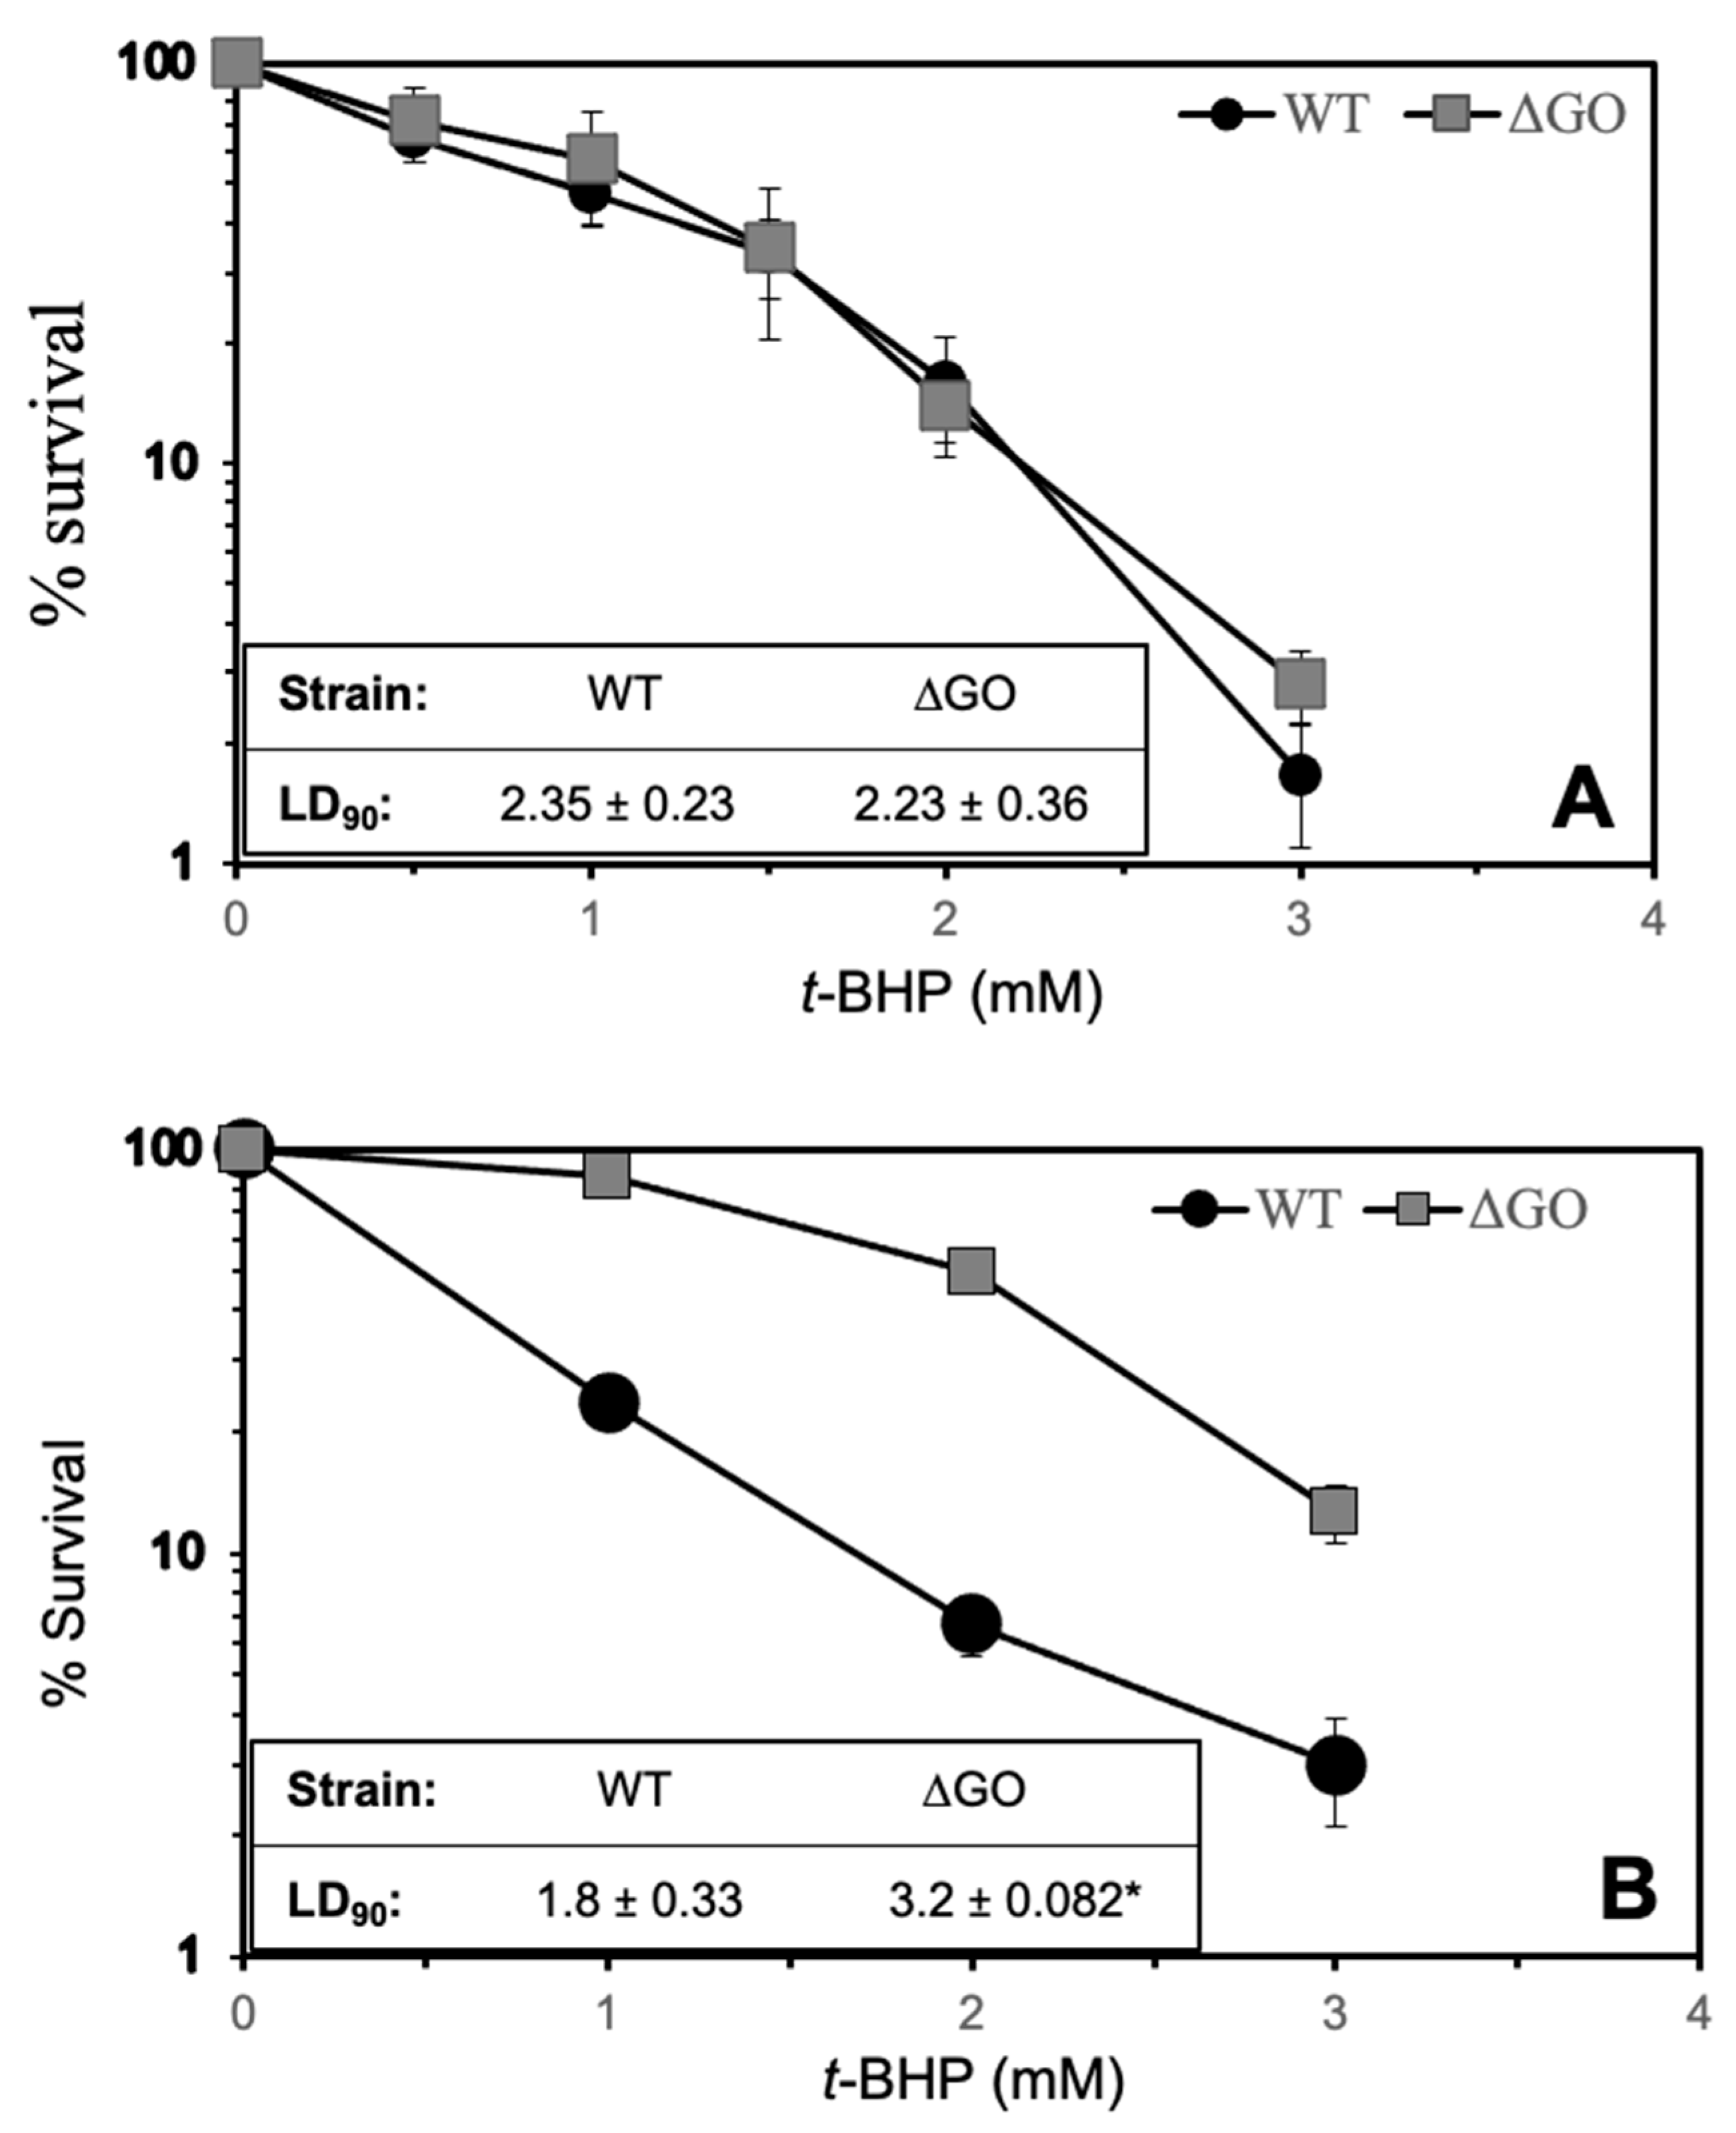
3.5. H2O2 Pretreatment Increases the Resistance of the GO-Deficient Strain to t-BHP

As noted above, the levels of AhpC and OhrA, which are key factors that confer protection from organic peroxides [16,53,54], are downregulated in B. subtilis cells that are deficient in the GO system; this result prompted us to test the ability of this strain to withstand treatment with other oxidants. To this end, growing cultures of the WT and the GO-deficient strains were treated with increasing doses of tert-butyl hydroperoxide (t-BHP). These assays revealed no significant differences between either strain, with regard to the harmful effects of this organic peroxide (Figure 7A). However, pretreatment of the ∆GO strain with H2O2, which upregulates OhrA (Table 1), increased its resistance to t-BHP compared with the WT strain (Figure 7B). It is possible that pretreatment with hydrogen peroxide inactivates the repressor effect of OhrR over ohrA, and increases the levels of its encoding product, OhrA.

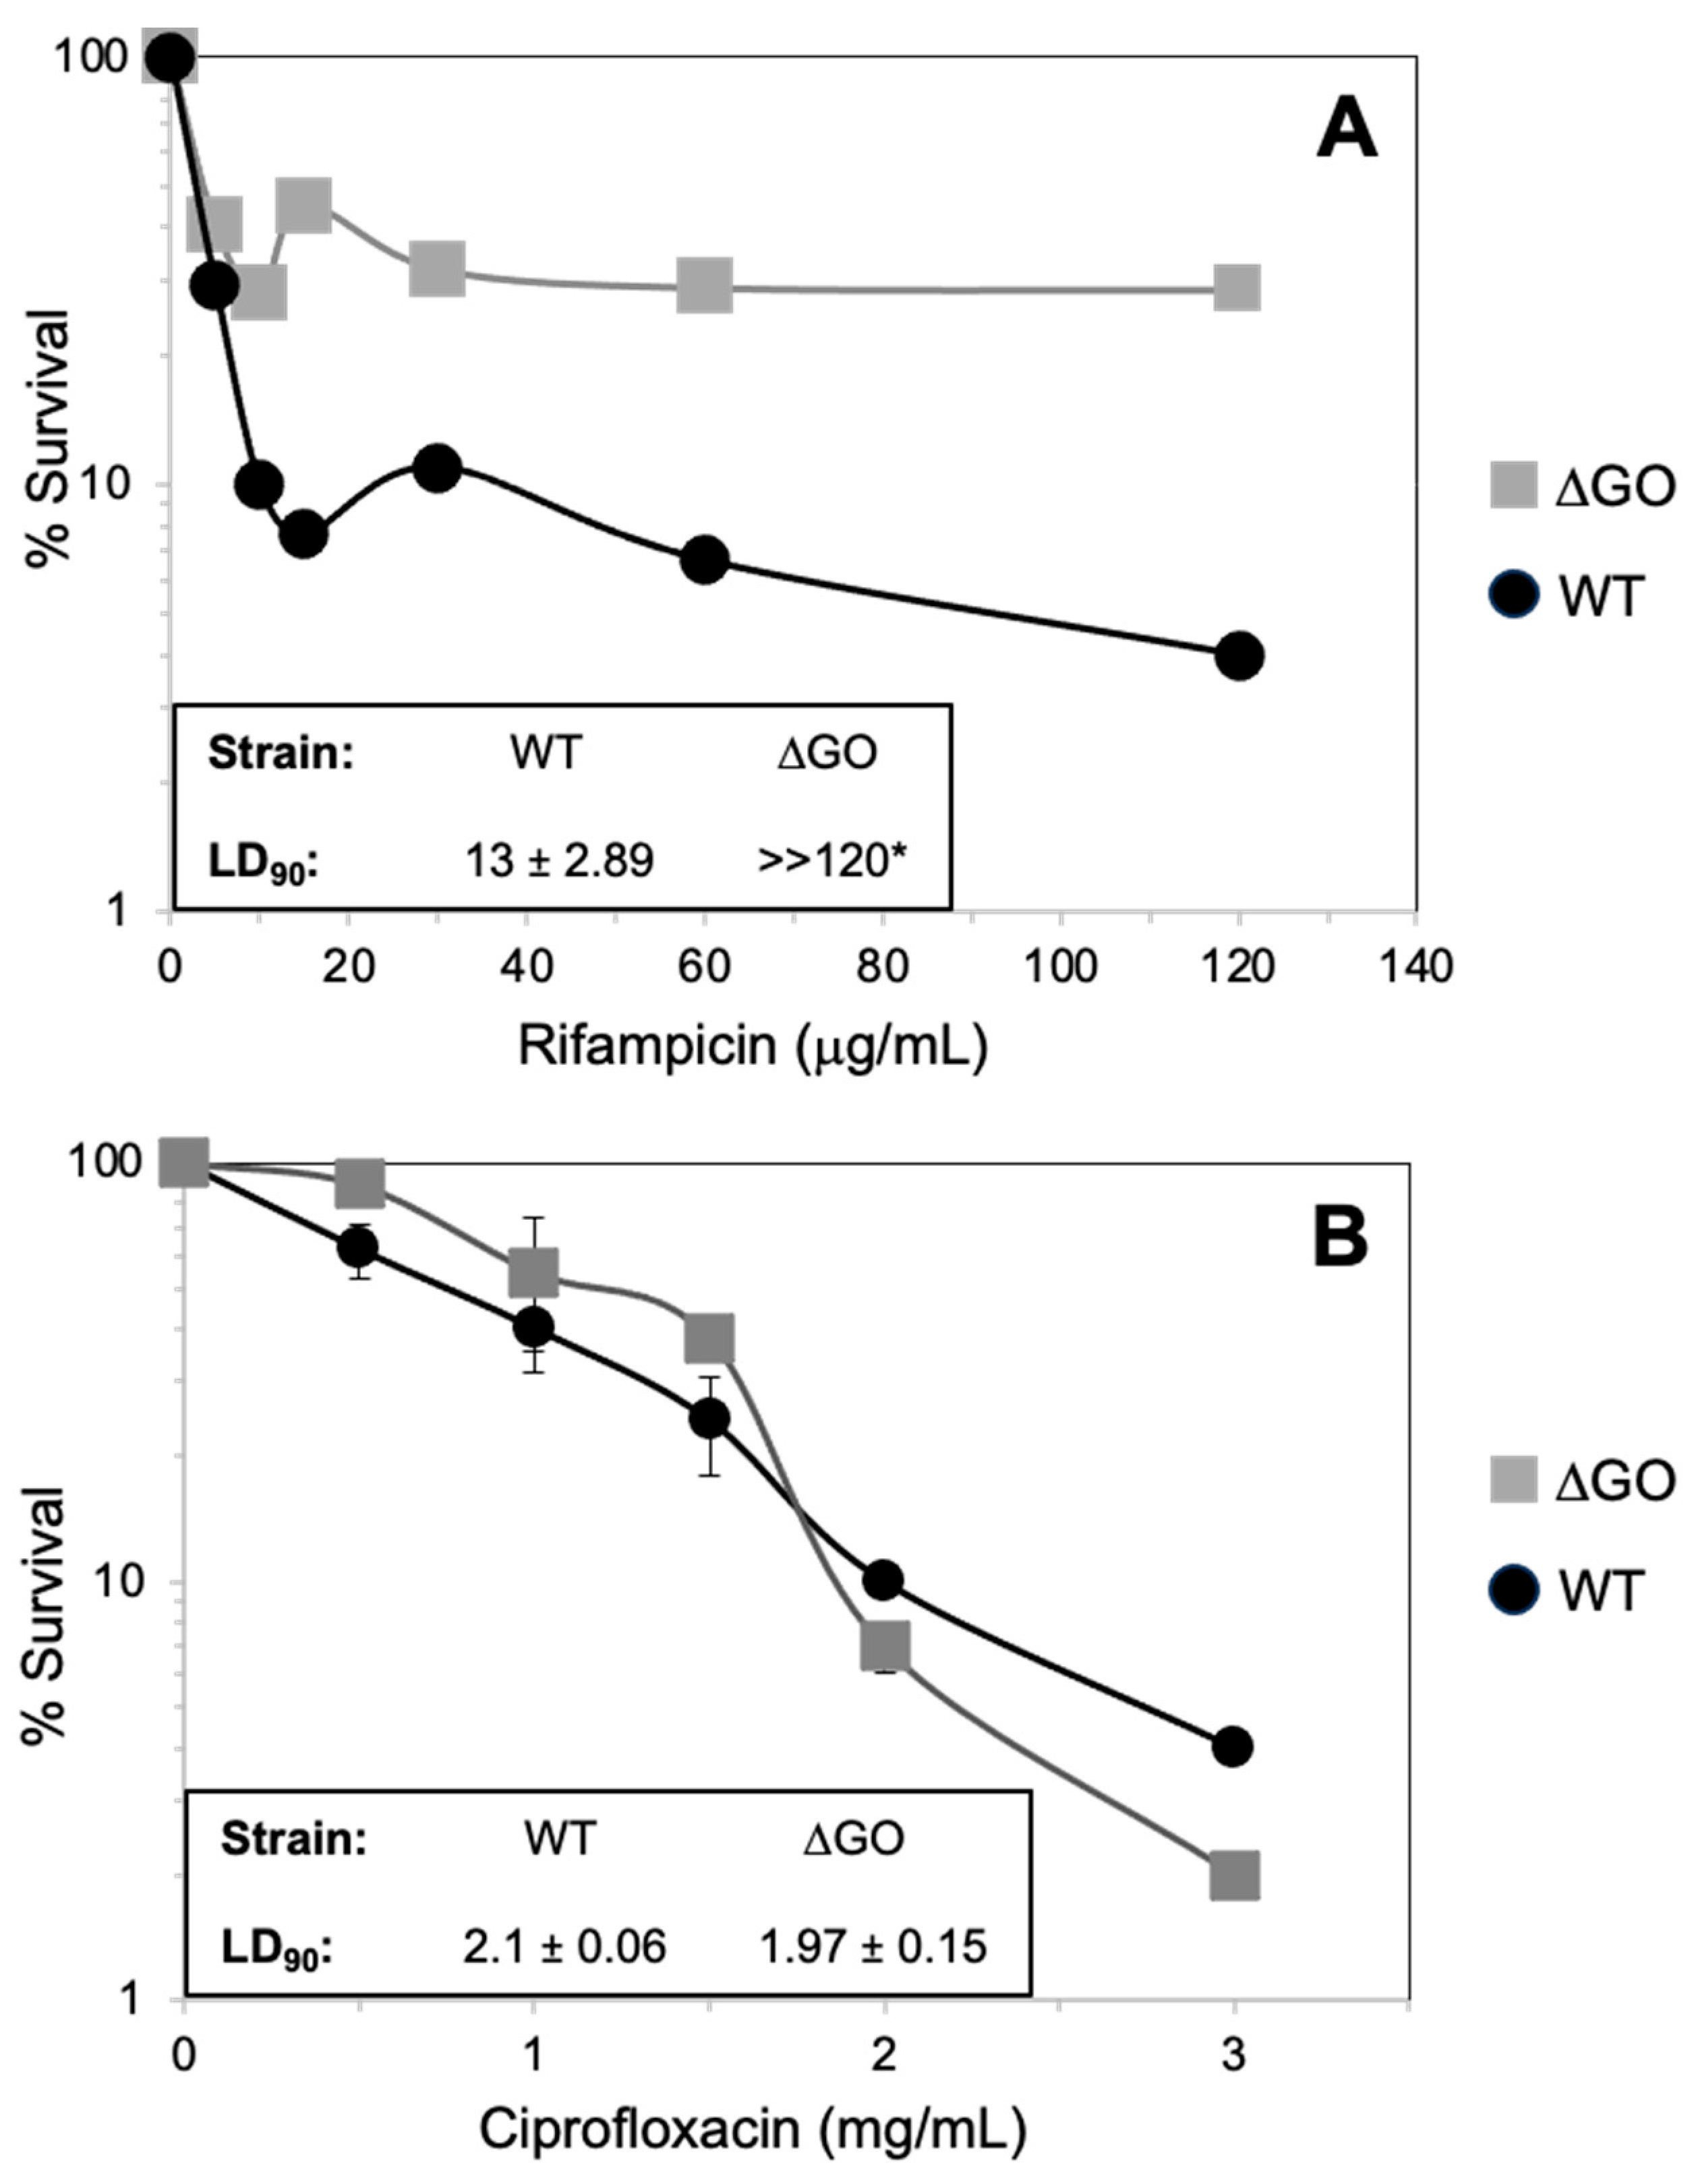
3.6. The Absence of a GO System Confers B. subtilis Resistance to Antibiotics That Target Transcription but Not DNA Replication

As shown in this work, the synthesis of factors that is expressed in response to different cell stress responses is dysregulated in the GO-deficient strain. We determined whether this atypical physiological status in the ∆GO strain is associated with antibiotic resistance. Exponentially growing cultures in the WT and GO-deficient strain were independently challenged with increasing concentrations of rifampicin (Rif) or ciprofloxacin (Cyp), and the fraction of surviving cells was determined by viable counts. The results revealed a marked resistance of the ∆GO strain to Rif, but not to Cyp, with respect to the WT parental strain (Figure 8). Ninety percent of the cell population of the parent strain was inactivated at a concentration of 13 ± 2.89; however, 30% the ∆GO cells were viable at a concentration of 120 μg/mL of this transcription targeting antibiotic (Figure 8A). Conversely, 90% of the cells in both strains were inhibited by similar Cyp concentrations (Figure 8B). Altogether, these results indicate that the inactivation of the GO system which leads to the accumulation of 8-OxoG [63] confers resistance to rifampicin in B. subtilis.

4. Discussion

Previous reports suggested that disabling the GO system increases genetic diversity in B. subtilis and the likelihood of escaping growth-limiting conditions [30,31,32]. In this work, we report that a B. subtilis strain that was deficient for the GO system, and prone to accumulating genomic 8-OxoG lesions [63], increased in terms of its spontaneous mutagenesis. It also exhibited an unusual hyperresistance to hydrogen peroxide and antibiotics that suppress RNA synthesis. Our proteomic and genetic analyses strongly suggest that these phenotypes are associated with the gratuitous activation of factors that counteract cellular responses controlled by the PerR, OhrA, Zur, and SigB regulators.
A previous report revealed that Tn10 insertions in ahpC, encoding one of the two subunits of the alkyl hydroperoxide reductase, activate the expression of the full PerR operon, including KatA. Based on zone inhibition assays, the authors reported a marked increase in H2O2 resistance in B. subtilis [54]. Here, we report a B. subtilis strain, that is defective in terms of its ability to process 8-OxoG lesions, exhibits increased KatA protein levels, via the increased transcription of katA, and it is highly resistant to hydrogen peroxide.
A marked increase in KatA synthesis was also reported in a B. subtilis strain bearing a PerR-null allele; however, all components of the PerR regulon were upregulated in this mutant strain [64]. In contrast, in the ∆GO strain, only AhpF (but not AhpC), HemB, and KatA, were found to be upregulated. Our results also revealed that in the GO-deficient strain, PerR is completely functional as the disruption of its encoding gene induces a dramatic increase in H2O2 resistance (Figure 2). Furthermore, the expression levels of a transcriptional katA-lacZ fusion, inserted in the katA locus, increased from 312 ± 12 to 658 ± 36.8 in the ∆GO strain, following the disruption of perR. Taken together, these results supported the following concepts: in the GO-deficient genetic background, (i) the PerR regulon is not gratuitously upregulated, (ii) additional factors are involved in its hyperresistance to H2O2, and (iii) a mechanism(s) that is independent of PerR, increases the expression of katA. In support of these notions, in addition to KatA, factors that are induced by distinct types of cell stress, including OhrA, YciB, HupA, YfiT, YceD, DnaK, and GrpE, were found to be dysregulated in the GO-deficient strain. YciB stands out among these factors because its increased synthesis was as pronounced as in KatA (Table 1). Distinct functions have been attributed to this putative D-L transpeptidase protein, whose coding gene belongs to the B. subtilis Zur regulon, including zink transport, cell wall biosynthesis and cellular division [57,58]. We speculate that the levels of YciB increased in response to the accumulation of 8-OxoG and ROS-induced damage [63], which impact the integrity of the cell wall. This hypothesis is supported by reports demonstrating that D-L transpeptidases, like YciB, play important roles in maintaining the homeostasis of the bacterial cell envelope during ROS-promoted stress or exposure to β-lactam antibiotics [65]. In the bacterium E. coli, expression of ldtD, the homologue of B. subtilis yciB, is controlled by the two-component system, Cpx/CpA, which is activated under conditions that cause stress to its cell envelopes [66,67]. Here, we found that the levels of YciB, but no other Zur-regulated proteins, is increased in B. subtilis cells that lack a functional GO system. These findings suggest that B. subtilis cells, which accumulate 8-OxoG, activate a yet-to-be defined mechanism that positively upregulates the levels of YciB.
In the GO-deficient strain, the increased synthesis of CymR, the transcriptional repressor for genes controlling cysteine homeostasis, was detected [55]. In B. subtilis, CymR negatively regulates the expression of genes required for the transport and synthesis of cystine and the assimilation of sulfonate [55]. It has been postulated that in the presence of cysteine, CymR and CysK (which is required for cysteine synthesis) [68] interact to establish a quaternary (Csk2/CymR2) complex that represses the expression of genes belonging to CymR regulon [55,68]. Here, we found that in reference to the WT strain, the concentration of CymR increased by ~20 times in the GO deficient strain (Table 1). Although no differences in CysK levels were found between either strain, the level in both strains was three times higher than those observed with CymR (Table 1). Therefore, the concentration of both proteins is sufficient to generate the active Csk2/CymR2 complex and increase resistance to H2O2 in the GO-deficient strain. In support of this notion, a recent report revealed that CymR deficiency increases B. subtilis sensitivity to oxidizing agents such as hydrogen peroxide, paraquat, and disulfide, and that it is promoted by tellurite [69]. In our work, it was also found that NifS (IcsC), an enzyme that transfers sulfur from cysteine to SH-carriers (like pyridoxal phosphate) in order to generate alanine, is down-regulated in the strain that lacks the GO system (Figure 4) [48]. Altogether, these observations strongly suggest that NifS down-regulation and the CymR-dependent repression of cysteine directs cysteine during CoA synthesis, presumably for the CoA-lation of OhrR. These reactions lead to the transcriptional derepression of the ohrA gene and increases in the levels of the organic peroxide reductase, OhrA.
As noted previously, the levels of AhpF, the large subunit of B. subtilis AHPR involved in detoxifying organic peroxides, was upregulated in the GO-deficient strain; remarkably, a dramatic reduction in the cellular concentration of the small subunit of this enzyme, AhpC, was detected in this mutant strain. Here, we showed that the protein levels of AhpC and AhpF increased in cultures exposed to H2O2 in the WT (Table 1), an expected result, as the genes encoding these proteins are under the control of the repressor, PerR [15,49]. Therefore, a non-described mechanism reduces the levels of AhpC, and consequently, reduces AhpC/AhpF-dependent AHPR activity in the ∆GO strain. Furthermore, the disparate levels in the AHPR subunits and decreased activity do not result in an increase in susceptibility to the organic peroxide, t-BHP (Figure 7A). It is possible that additional proteins possessing AHPR activity [70] can compensate for the divergent levels of AhpC and AhpF, and thus, prevent a drop in sensitivity to t-BHP.
Our proteomic analysis also revealed that CoaE, the enzyme that catalyzes the last step in the synthesis of Coenzyme A (CoA), was upregulated in the ∆GO strain (Figure 4 and Table 1). CoA is a key cofactor for cellular metabolic pathways, however, our work and previous evidence [71] note that this cofactor prevents oxidative damage in bacteria. Of note, the CoA factor carries S-thiolation over redox active cysteine residues of transcription factors like PerR, CtsR, and OhrR) which regulates gene expression during oxidative stress [71]. The consequences of CoA-lation were elucidated for B. subtilis OhrR, a protein that represses the transcription of ohrA, which encodes a thiol-dependent peroxidase that counteracts the toxicity of organic hydroperoxides like cumene- hydroperoxides (CMHP) and tert-butyl-hydroperoxide (t-BHP) [72]. Therefore, in the ∆GO strain, the higher levels of CoaE can be involved in increasing the concentration of CoA to prevent oxidative stress. Although the proteomic analysis did not detect differences in OhrA levels between the ∆GO and the parental WT strain, the presence of H2O2 in the culture medium increased the levels of OhrA in the former, but not in the latter (Table 1). In line with these observations, our results revealed that H2O2 pretreatment significantly increased the resistance of the GO-deficient strain to the noxious effects of t-BHP, with respect to the WT strain (Figure 7B).
Several factors belonging to the general stress regulon exhibited a dysregulated status in the ∆GO strain, including YceE and YcdE, which are required to survive ethanol stress and low temperatures [73,74]. Remarkably, Trx, another general stress protein that fulfills an essential role in cleaving CoA from proteins modified with this cofactor, including OhrR [75], was also upregulated in this mutant strain. Therefore, the deCoA-lation of OhrA, and possibly other protein targets of this posttranslational modification, is required to maintain the ability of the ∆GO strain to contend with the noxious effects of H2O2. Our results supported this notion as the disruption of the σB encoding gene reduced the HPHR of this mutant strain (Figure 6A).
Notably, the genetic inactivation of the GO system, which leads to the accumulation of 8-OxoG [63], conferred adaptive advantages to B. subtilis, including hyperresistance to the antibiotic, rifampicin. In line with this, it has been shown that 8-OxoG and other oxidized bases promote base substitutions in rpoB, giving rise to rifampicin resistance in E. coli and B. subtilis [76]. However, disruption to the GO system did not promote hyperresistance to fluoroquinolone in B. subtilis (Figure 8B), suggesting that DNA lesions other than 8-OxoG are associated with this phenotype. In support of this hypothesis, in Bacillus anthracis, the hyperresistance to ciprofloxacin is associated with base deamination events that generate cytosine from thymine, and facilitate guanine to adenine transitions in the gyrA gene [77]. Here, we found that RpoB, the core RNA polymerase subunit, was upregulated in the GO-deficient strain (Figure 3 and Table 1). Therefore, it is feasible that transcription-associated mutations occurring in rpoB can elicit alterations to the program of genetic expression in the ∆GO strain, thus positively impacting its ability to adapt to a diverse range of stress conditions [78,79,80].
Overall, the evidence presented in this work links the ROS-promoted lesion, 8-OxoG, with the differential synthesis of proteins belonging to distinct transcriptional regulons, allowing B. subtilis to contend with the noxious effects of ROS-generating factors. As shown in this work, these processes can be subjected to regulation with Mfd (Figure 2), a transcription factor commonly associated with the repair of bulky DNA lesions in bacteria [81]. However, recent evidence has revealed that Mfd functions as a global regulator of gene transcription and cell differentiation in B. subtilis [34,82]. Therefore, elucidating the Mfd-dependent mechanisms that cells employ to directly or indirectly regulate the expression of the factors associated with the HPM and HPHR phenotypes will contribute to understanding the novel aspects of bacterial physiology in stressed bacterial cells.
Although our work unveils a connection between the 8-OxoG lesion and the ability of B. subtilis to adapt to HPM and withstand peroxide and antibiotic stresses, the mechanism(s) involved in regulating this response remain to be discovered. Experiments aimed at investigating whether the chemical nature of 8-OxoG, the proteins involved in its recognition/repair, or the products concerning its processing, constitute the signal that activates the GO-regulon are required.

5. Conclusions

Experimental evidence shown in this report uncovers novel roles for the ROS-promoted 8-OxoG lesion, beyond oxidative stress-promoted mutagenesis in the Gram-positive microorganism B. subtilis, including (i) the activation of different stress-associated protein profiles to counteract the genotoxic and cytotoxic impact of organic peroxides, and (ii) the induction of increased resistance to transcription-acting antibiotics.

Supplementary Materials

The following supporting information can be downloaded at: https://www.mdpi.com/article/10.3390/antiox13030332/s1, Figures S1–S3: Hydrogen peroxide susceptibility of B. subtilis strains with distinct genotypes. Figure S4: SDS-PAGE analysis of protein cell extracts from strains B. subtilis WT and ∆GO. Figure S5: Functional distribution of differentially expressed class proteins between the WT and ∆GO B. subtilis strains subjected to hydrogen peroxide stress. Figure S6: Complete proteome differences between strains B. subtilis WT and ∆GO. Supplemental proteomic data. The mass spectrometry proteomics data are provided as supplementary material.

Author Contributions

Analyses and interpretation of data, M.P.-R., L.E.M., B.F. and E.A.R.; methodology, L.E.M., N.R. and G.G.; writing—original draft preparation, L.E.M. and M.P.-R.; writing—review and editing, M.P.-R. and E.A.R.; funding acquisition, M.P.-R. All authors have read and agreed to the published version of the manuscript.

Funding

This work was supported by the National Council of Science and Technology (CONACYT; Grants 221231 and A-1S-27116) of México, NIH grant GM131410 and the University of Guanajuato (Grants CIIC 023/2023 and 029/2024). L.E.M and G.V. were supported by a scholarship from CONACyT.

Institutional Review Board Statement

Not applicable.

Informed Consent Statement

Not applicable.

Data Availability Statement

All data are provided as Supplementary Materials.

Acknowledgments

The authors wish to acknowledge the excellent technical support of María J. Toledo.

Conflicts of Interest

The authors declare no conflict of interest.

References

  1. Imlay, J.A. Cellular defenses against superoxide and hydrogen peroxide. Ann. Rev. Biochem. 2008, 77, 755–776. [Google Scholar] [CrossRef]
  2. Imlay, J.A. Where in the world do bacteria experience oxidative stress? Environ. Microbiol. 2019, 21, 521–530. [Google Scholar] [CrossRef]
  3. Bonilla, C.Y. Generally Stressed Out Bacteria: Environmental Stress Response Mechanisms in Gram-Positive Bacteria. Integr. Comp. Biol. 2020, 60, 126–133. [Google Scholar] [CrossRef]
  4. Imlay, J.A. The molecular mechanisms and physiological consequences of oxidative stress: Lessons from a model bacterium. Nat. Rev. Microbiol. 2013, 11, 443–454. [Google Scholar] [CrossRef] [PubMed]
  5. Fasnacht, M.; Polacek, N. Oxidative stress in bacteria and the central dogma of molecular biology. Front. Mol. Biosci. 2021, 8, 671037. [Google Scholar] [CrossRef]
  6. Faulkner, M.J.; Helmann, J.D. Peroxide stress elicits adaptive changes in bacterial metal ion homeostasis. Antioxid. Redox. Signal 2011, 15, 175–189. [Google Scholar] [CrossRef]
  7. Henle, E.S.; Linn, S. Formation, prevention, and repair of DNA damage by iron/hydrogen peroxide. J. Biol. Chem. 1997, 272, 19095–19098. [Google Scholar] [CrossRef]
  8. Imlay, J.A. Iron-sulphur clusters and the problem with oxygen. Mol. Microbiol. 2006, 59, 1073–1082. [Google Scholar] [CrossRef]
  9. Keyer, K.; Imlay, J.A. Superoxide accelerates DNA damage by elevating free-iron levels. Proc. Natl. Acad. Sci. USA 1996, 93, 13635–13640. [Google Scholar] [CrossRef]
  10. Henle, E.S.; Han, Z.; Tang, N.; Rai, P.; Luo, Y.; Linn, S. Sequence-specific DNA cleavage by Fe2+-mediated fenton reactions has possible biological implications. J. Biol. Chem. 1999, 274, 962–971. [Google Scholar] [CrossRef]
  11. Sies, H.; Jones, D.P. Reactive oxygen species (ROS) as pleiotropic physiological signalling agents. Nat. Rev. Mol. Cell Biol. 2020, 21, 363–383. [Google Scholar] [CrossRef]
  12. Helmann, J.D.; Wu, M.F.W.; Gaballa, A.; Kobel, P.A.; Morshedi, M.M.; Fawcett, P.; Paddon, C. The global transcriptional response of Bacillus subtilis to peroxide stress is coordinated by three transcription factors. J. Bacteriol. 2003, 185, 60–70. [Google Scholar] [CrossRef] [PubMed]
  13. Price, C.W. General Stress Response. In Bacillus Subtilis and Its Closest Relatives: From Genes to Cells; American Society for Microbiology Press: Washington, DC, USA, 2014; pp. 369–384. [Google Scholar] [CrossRef]
  14. Nannapaneni, P.; Hertwig, F.; Depke, M.; Hecker, M.; Mäder, U.; Völker, U.; Steil, L.; van Hijum, S.A.F.T. Defining the structure of the general stress regulon of Bacillus subtilis using targeted microarray analysis and random forest classification. Microbiology 2012, 158, 696–707. [Google Scholar] [CrossRef] [PubMed]
  15. Pinochet-Barros, A.; Helmann, J.D. Redox sensing by Fe2+ in bacterial Fur family metalloregulators. Antioxid. Redox Signal. 2018, 29, 1858–1871. [Google Scholar] [CrossRef] [PubMed]
  16. Fuangthong, M.; Atichartpongkul, S.; Mongkolsuk, S.; Helmann, J.D. OhrR is a repressor of ohrA, a key organic hydroperoxide resistance determinant in Bacillus subtilis. J. Bacteriol. 2001, 183, 4134–4141. [Google Scholar] [CrossRef] [PubMed]
  17. Leichert, L.I.O.; Scharf, C.; Hecker, M. Global characterization of disulfide stress in Bacillus subtilis. J. Bacteriol. 2003, 185, 1967–1975. [Google Scholar] [CrossRef]
  18. Steenken, S.; Jovanovic, S.V. How easily oxidizable is DNA? One-electron reduction potentials of adenosine and guanosine radicals in aqueous solution. J. Am. Chem. Soc. 1997, 119, 617–618. [Google Scholar] [CrossRef]
  19. Kino, K.; Hirao-Suzuki, M.; Morikawa, M.; Sakaga, A.; Miyazawa, H. Generation, repair and replication of guanine oxidation products. Genes Environ. 2017, 39, 21. [Google Scholar] [CrossRef]
  20. Saito, I.; Nakamura, T.; Nakatani, K.; Yoshioka, Y.; Yamaguchi, K.; Sugiyama, H. Mapping of the hot spots for DNA Damage by one-electron oxidation: Efficacy of GG doublets and GGG triplets as a trap in long-range hole migration. J. Am. Chem. Soc. 1998, 120, 12686–12687. [Google Scholar] [CrossRef]
  21. Wood, M.L.; Dizdaroglu, M.; Gajewski, E.; Essigmann, J.M. Mechanistic studies of ionizing radiation and oxidative mutagenesis: Genetic effects of a single 8-hydroxyguanine (7-hydro-8-oxoguanine) residue inserted at a unique site in a viral genome. Biochemistry 1990, 29, 7024–7032. [Google Scholar] [CrossRef]
  22. Shibutani, S.; Takeshita, M.; Grollman, A.P. Insertion of specific bases during DNA synthesis past the oxidation-damaged base 8-oxodG. Nature 1991, 349, 431–434. [Google Scholar] [CrossRef]
  23. De Rosa, M.; Johnson, S.A.; Opresko, P.L. Roles for the 8-Oxoguanine DNA repair system in protecting telomeres from oxidative stress. Front. Cell Dev. Biol. 2021, 9, 758402. [Google Scholar] [CrossRef]
  24. Michaels, M.L.; Miller, J.H. The GO system protects organisms from the mutagenic effect of the spontaneous lesion 8-hydroxyguanine (7,8-dihydro-8-oxoguanine). J. Bacteriol. 1992, 174, 6321–6325. [Google Scholar] [CrossRef] [PubMed]
  25. Michaels, M.L.; Cruz, C.; Grollman, A.P.; Miller, J.H. Evidence that MutY and MutM combine to prevent mutations by an oxidatively damaged form of guanine in DNA. Proc. Natl. Acad. Sci. USA 1992, 89, 7022–7025. [Google Scholar] [CrossRef] [PubMed]
  26. Maki, H.; Sekiguchi, M. MutT protein specifically hydrolyses a potent mutagenic substrate for DNA synthesis. Nature 1992, 355, 273–275. [Google Scholar] [CrossRef]
  27. Ramírez, M.I.; Castellanos-Juárez, F.X.; Yasbin, R.E.; Pedraza-Reyes, M. The ytkD(mutTA) gene of Bacillus subtilis encodes a functional antimutator 8-Oxo-(dGTP/GTP)ase and is under dual control of Sigma A and Sigma F RNA polymerases. J. Bacteriol. 2004, 186, 1050–1059. [Google Scholar] [CrossRef] [PubMed]
  28. Castellanos-Juárez, F.X.; Álvarez-Álvarez, C.; Yasbin, R.E.; Setlow, B.; Setlow, P.; Pedraza-Reyes, M. YtkD and MutT protect vegetative cells but not spores of Bacillus subtilis from oxidative stress. J. Bacteriol. 2006, 188, 2285–2289. [Google Scholar] [CrossRef] [PubMed]
  29. Tajiri, T.; Maki, H.; Sekiguchi, M. Functional cooperation of MutT, MutM and MutY proteins in preventing mutations caused by spontaneous oxidation of guanine nucleotide in Escherichia coli. Mutat. Res. 1995, 336, 257–267. [Google Scholar] [CrossRef]
  30. Gómez-Marroquín, M.; Vidales, L.E.; Debora, B.N.; Santos-Escobar, F.; Obregón-Herrera, A.; Robleto, E.A.; Pedraza-Reyes, M. Role of Bacillus subtilis DNA glycosylase MutM in counteracting oxidatively induced DNA damage and in stationary-phase-associated mutagenesis. J. Bacteriol. 2015, 197, 1963–1971. [Google Scholar] [CrossRef]
  31. Debora, B.N.; Vidales, L.E.; Ramírez, R.; Ramírez, M.; Robleto, E.A.; Yasbin, R.E.; Pedraza-Reyes, M. Mismatch repair modulation of MutY activity drives Bacillus subtilis stationary-phase mutagenesis. J. Bacteriol. 2011, 193, 236–245. [Google Scholar] [CrossRef]
  32. Vidales, L.E.; Cárdenas, L.C.; Robleto, E.; Yasbin, R.E.; Pedraza-Reyes, M. Defects in the error prevention oxidized guanine system potentiate stationary-phase mutagenesis in Bacillus subtilis. J. Bacteriol. 2009, 191, 506–513. [Google Scholar] [CrossRef] [PubMed]
  33. Leyva-Sánchez, H.C.; Villegas-Negrete, N.; Abundiz-Yañez, K.; Yasbin, R.E.; Robleto, E.A.; Pedraza-Reyes, M. Role of Mfd and GreA in Bacillus subtilis base excision repair-dependent stationary-phase mutagenesis. J. Bacteriol. 2020, 202, e00807-19. [Google Scholar] [CrossRef]
  34. Suárez, V.P.; Martínez, L.E.; Leyva-Sánchez, H.C.; Valenzuela-García, L.I.; Lara-Martínez, R.; Jiménez-García, L.F.; Ramírez-Ramírez, N.; Obregon-Herrera, A.; Cuéllar-Cruz, M.; Robleto, E.A.; et al. Transcriptional coupling and repair of 8-OxoG activate a RecA-dependent checkpoint that controls the onset of sporulation in Bacillus subtilis. Sci. Rep. 2021, 11, 2513. [Google Scholar] [CrossRef]
  35. Bagyan, I.; Noback, M.; Bron, S.; Paidhungat, M.; Setlow, P. Characterization of yhcN, a new forespore-specific gene of Bacillus subtilis. Gene 1998, 212, 179–188. [Google Scholar] [CrossRef]
  36. Spizizen, J. Transformation of biochemically deficient strains of Bacillus subtilis by deoxyribonucleate. Proc. Natl. Acad. Sci. USA 1958, 44, 1072–1078. [Google Scholar] [CrossRef]
  37. Neuhoff, V.; Arold, N.; Taube, D.; Ehrhardt, W. Improved staining of proteins in polyacrylamide gels including isoelectric focusing gels with clear background at nanogram sensitivity using coomassie brilliant blue G-250 and R-250. Electrophoresis 1988, 9, 255–262. [Google Scholar] [CrossRef]
  38. Zuccoli, G.S.; Martins-de-Souza, D.; Guest, P.C.; Rehen, S.K.; Nascimento, J.M. Combining patient-reprogrammed neural cells and proteomics as a model to study psychiatric disorders. Proteomic Methods Neuropsychiatr. Res. 2017, 974, 279–287. [Google Scholar] [CrossRef]
  39. Ramírez-Flores, C.J.; Cruz-Mirón, R.; Mondragón-Castelán, M.E.; González-Pozos, S.; Ríos-Castro, E.; Mondragón-Flores, R. Proteomic and structural characterization of self-assembled vesicles from excretion/secretion products of Toxoplasma gondii. J. Proteom. 2019, 208, 103490. [Google Scholar] [CrossRef]
  40. Geromanos, S.J.; Hughes, C.; Golick, D.; Ciavarini, S.; Gorenstein, M.V.; Richardson, K.; Hoyes, J.B.; Vissers, J.P.; Langridge, J.I. Simulating and validating proteomics data and search results. Proteomics 2011, 11, 1189–1211. [Google Scholar] [CrossRef]
  41. Valentine, S.J.; Ewing, M.A.; Dilger, J.M.; Glover, M.S.; Geromanos, S.; Hughes, C.; Clemmer, D.E. Using ion mobility data to improve peptide identification: Intrinsic Amino acid size parameters. J. Proteome Res. 2011, 10, 2318–2329. [Google Scholar] [CrossRef]
  42. Skipp, P.J.S.; Hughes, C.; McKenna, T.; Edwards, R.; Langridge, J.; Thomson, N.R.; Clarke, I.N. Quantitative proteomics of the infectious and replicative forms of Chlamydia trachomatis. PLoS ONE 2016, 11, e0149011. [Google Scholar] [CrossRef]
  43. Engelmann, S.; Hecker, M. Impaired oxidative stress resistance of Bacillus subtilis sigB mutants and the role of katA and katE. FEMS Microbiol. Lett. 1996, 145, 63–69. [Google Scholar] [CrossRef]
  44. Pybus, C.; Pedraza-Reyes, M.; Ross, C.A.; Martin, H.; Ona, K.; Yasbin, R.E.; Robleto, E. Transcription-associated mutation in Bacillus subtilis cells under stress. J. Bacteriol. 2010, 192, 3321–3328. [Google Scholar] [CrossRef]
  45. Ross, C.; Pybus, C.; Pedraza-Reyes, M.; Sung, H.-M.; Yasbin, R.E.; Robleto, E. Novel role of mfd: Effects on stationary-phase mutagenesis in Bacillus subtilis. J. Bacteriol. 2006, 188, 7512–7520. [Google Scholar] [CrossRef]
  46. Martin, H.A.; Porter, K.E.; Vallin, C.; Ermi, T.; Contreras, N.; Pedraza-Reyes, M.; Robleto, E.A. Mfd protects against oxidative stress in Bacillus subtilis independently of its canonical function in DNA repair. BMC Microbiol. 2019, 19, 26. [Google Scholar] [CrossRef]
  47. Moszer, I.; Jones, L.M.; Moreira, S.; Fabry, C.; Danchin, A. SubtiList: The reference database for the Bacillus subtilis genome. Nucleic Acids Res. 2002, 30, 62–65. Available online: http://genolist.pasteur.fr/ (accessed on 1 May 2022). [CrossRef] [PubMed]
  48. Pedreira, T.; Elfmann, C.; Stülke, J. The current state of SubtiWiki, the database for the model organism Bacillus subtilis. Nucleic Acids Res. 2022, 50, 875–882. [Google Scholar] [CrossRef]
  49. Fuangthong, M.; Herbig, A.F.; Bsat, N.; Helmann, J.D. Regulation of the Bacillus subtilis fur and perR genes by PerR: Not all members of the PerR regulon are peroxide inducible. J. Bacteriol. 2002, 184, 3276–3286. [Google Scholar] [CrossRef]
  50. Cheo, D.L.; Bayles, K.W.; E Yasbin, R. Elucidation of regulatory elements that control damage induction and competence induction of the Bacillus subtilis SOS system. J. Bacteriol. 1993, 175, 5907–5915. [Google Scholar] [CrossRef] [PubMed]
  51. Au, N.; Kuester-Schoeck, E.; Mandava, V.; Bothwell, L.E.; Canny, S.P.; Chachu, K.; Colavito, S.A.; Fuller, S.N.; Groban, E.S.; Hensley, L.A.; et al. Genetic composition of the Bacillus subtilis SOS system. J. Bacteriol. 2005, 187, 7655–7666. [Google Scholar] [CrossRef] [PubMed]
  52. Smaldone, G.T.; Helmann, J.D. CsoR regulates the copper efflux operon copZA in Bacillus subtilis. Microbiology 2007, 153, 4123–4128. [Google Scholar] [CrossRef]
  53. Antelmann, H.; Engelmann, S.; Schmid, R.; Hecker, M. General and oxidative stress responses in Bacillus subtilis: Cloning, expression, and mutation of the alkyl hydroperoxide reductase operon. J. Bacteriol. 1996, 178, 6571–6578. [Google Scholar] [CrossRef]
  54. Bsat, N.; Chen, L.; Helmann, J.D. Mutation of the Bacillus subtilis alkyl hydroperoxide reductase (ahpCF) operon reveals compensatory interactions among hydrogen peroxide stress genes. J. Bacteriol. 1996, 178, 6579–6586. [Google Scholar] [CrossRef]
  55. Even, S.; Burguière, P.; Auger, S.; Soutourina, O.; Danchin, A.; Martin-Verstraete, I. Global control of cysteine metabolism by CymR in Bacillus subtilis. J. Bacteriol. 2006, 188, 2184–2197. [Google Scholar] [CrossRef]
  56. Esquilin-Lebron, K.; Dubrac, S.; Barras, F.; Boyd, J.M. Bacterial approaches for assembling iron-sulfur proteins. mBio 2021, 12, e0242521. [Google Scholar] [CrossRef]
  57. Gaballa, A.; Wang, T.; Ye, R.W.; Helmann, J.D. Functional analysis of the Bacillus subtilis Zur regulon. J. Bacteriol. 2002, 184, 6508–6514. [Google Scholar] [CrossRef]
  58. Bramkamp, M. The putative Bacillus subtilis L,D-transpeptidase YciB is a lipoprotein that localizes to the cell poles in a divisome-dependent manner. Arch. Microbiol. 2010, 192, 57–68. [Google Scholar] [CrossRef]
  59. Micka, B.; Groch, N.; Heinemann, U.; A Marahiel, M. Molecular cloning, nucleotide sequence, and characterization of the Bacillus subtilis gene encoding the DNA-binding protein HBsu. J. Bacteriol. 1991, 173, 3191–3198. [Google Scholar] [CrossRef]
  60. Karaboja, X.; Wang, X. HBsu Is Required for the Initiation of DNA Replication in Bacillus subtilis. J. Bacteriol. 2022, 204, e00119-22. [Google Scholar] [CrossRef]
  61. Price, C.W.; Fawcett, P.; Cérémonie, H.; Su, N.; Murphy, C.K.; Youngman, P. Genome-wide analysis of the general stress response in Bacillus subtilis. Mol. Microbiol. 2001, 41, 757–774. [Google Scholar] [CrossRef]
  62. Baichoo, N.; Wang, T.; Ye, R.; Helmann, J.D. Global analysis of the Bacillus subtilis Fur regulon and the iron starvation stimulon. Mol. Microbiol. 2002, 45, 1613–1629. [Google Scholar] [CrossRef]
  63. Santos-Escobar, F.; Gutiérrez-Corona, J.F.; Pedraza-Reyes, M. Role of Bacillus subtilis error prevention oxidized guanine system in counteracting hexavalent chromium-promoted oxidative DNA damage. Appl. Environ. Microbiol. 2014, 80, 5493–5502. [Google Scholar] [CrossRef]
  64. Faulkner, M.J.; Ma, Z.; Fuangthong, M.; Helmann, J.D. Derepression of the Bacillus subtilis PerR peroxide stress response leads to iron deficiency. J. Bacteriol. 2012, 194, 1226–1235. [Google Scholar] [CrossRef]
  65. Aliashkevich, A.; Cava, F. LD-transpeptidases: The great unknown among the peptidoglycan cross-linkers. FEBS J. 2022, 289, 4718–4730. [Google Scholar] [CrossRef]
  66. Bernal-Cabas, M.; Ayala, J.A.; Raivio, T.L. The Cpx envelope stress response modifies peptidoglycan cross-linking via the L,D-transpeptidase LdtD and the novel protein YgaU. J. Bacteriol. 2015, 197, 603–614. [Google Scholar] [CrossRef]
  67. Delhaye, A.; Collet, J.-F.; Laloux, G. Fine-tuning of the Cpx envelope stress response is required for cell wall homeostasis in Escherichia coli. mBio 2016, 7, e00047-16. [Google Scholar] [CrossRef]
  68. Tanous, C.; Soutourina, O.; Raynal, B.; Hullo, M.-F.; Mervelet, P.; Gilles, A.-M.; Noirot, P.; Danchin, A.; England, P.; Martin-Verstraete, I. The CymR regulator in complex with the enzyme CysK controls cysteine metabolism in Bacillus subtilis. J. Biol. Chem. 2008, 283, 35551–35560. [Google Scholar] [CrossRef] [PubMed]
  69. Hullo, M.-F.; Martin-Verstraete, I.; Soutourina, O. Complex phenotypes of a mutant inactivated for CymR, the global regulator of cysteine metabolism in Bacillus subtilis. FEMS Microbiol. Lett. 2010, 309, 201–207. [Google Scholar] [CrossRef] [PubMed]
  70. Cha, M.-K.; Bae, Y.-J.; Kim, K.-J.; Park, B.-J.; Kim, I.-H. Characterization of two alkyl hydroperoxide reductase C homologs alkyl hydroperoxide reductase C_H1 and alkyl hydroperoxide reductase C_H2 in Bacillus subtilis. World J. Biol. Chem. 2015, 6, 249–264. [Google Scholar] [CrossRef]
  71. Gout, I. Coenzyme A: A protective thiol in bacterial antioxidant defence. Biochem. Soc. Trans. 2019, 47, 469–476. [Google Scholar] [CrossRef] [PubMed]
  72. Lee, J.-W.; Soonsanga, S.; Helmann, J.D. A complex thiolate switch regulates the Bacillus subtilis organic peroxide sensor OhrR. Proc. Natl. Acad. Sci. USA 2007, 104, 8743–8748. [Google Scholar] [CrossRef]
  73. Höper, D.; Völker, U.; Hecker, M. Comprehensive characterization of the contribution of individual SigB-dependent general stress genes to stress resistance of Bacillus subtilis. J. Bacteriol. 2005, 187, 2810–2826. [Google Scholar] [CrossRef]
  74. Yeak, K.Y.C.; Boekhorst, J.; Wels, M.; Abee, T.; Wells-Bennik, M.H.J. Prediction and validation of novel SigB regulon members in Bacillus subtilis and regulon structure comparison to Bacillales members. BMC Microbiol. 2023, 23, 17. [Google Scholar] [CrossRef]
  75. Smits, W.K.; Dubois, J.-Y.F.; Bron, S.; van Dijl, J.M.; Kuipers, O.P. Tricksy business: Transcriptome analysis reveals the involvement of thioredoxin A in redox homeostasis, oxidative stress, sulfur metabolism, and cellular differentiation in Bacillus subtilis. J. Bacteriol. 2005, 187, 3921–3930. [Google Scholar] [CrossRef] [PubMed]
  76. Garibyan, L.; Huang, T.; Kim, M.; Wolff, E.; Nguyen, A.; Nguyen, T.; Diep, A.; Hu, K.; Iverson, A.; Yang, H.; et al. Use of the rpoB gene to determine the specificity of base substitution mutations on the Escherichia coli chromosome. DNA Repair 2003, 2, 593–608. [Google Scholar] [CrossRef] [PubMed]
  77. Price, L.B.; Vogler, A.; Pearson, T.; Busch, J.D.; Schupp, J.M.; Keim, P. In vitro selection and characterization of Bacillus anthracis mutants with high-level resistance to ciprofloxacin. Antimicrob. Agents Chemother. 2003, 47, 2362–2365. [Google Scholar] [CrossRef] [PubMed]
  78. Leehan, J.D.; Nicholson, W.L. The spectrum of spontaneous rifampin resistance mutations in the Bacillus subtilis rpoB gene depends on the growth environment. Appl. Environ. Microbiol. 2021, 87, e01237-21. [Google Scholar] [CrossRef] [PubMed]
  79. Leehan, J.D.; Nicholson, W.L. Environmental dependence of competitive fitness in rifampin-resistant rpoB mutants of Bacillus subtilis. Appl. Environ. Microbiol. 2022, 88, e0242221. [Google Scholar] [CrossRef]
  80. Patel, Y.; Soni, V.; Rhee, K.Y.; Helmann, J.D. Mutations in rpoB that confer rifampicin resistance can alter levels of peptidoglycan precursors and affect β-lactam susceptibility. mBio 2023, 14, e0316822. [Google Scholar] [CrossRef] [PubMed]
  81. Selby, C.P.; Lindsey-Boltz, L.A.; Li, W.; Sancar, A. Molecular mechanisms of transcription-coupled repair. Annu. Rev. Biochem. 2023, 92, 115–144. [Google Scholar] [CrossRef] [PubMed]
  82. Martin, H.A.; Sundararajan, A.; Ermi, T.S.; Heron, R.; Gonzales, J.; Lee, K.; Anguiano-Mendez, D.; Schilkey, F.; Pedraza-Reyes, M.; Robleto, E.A. Mfd affects global transcription and the physiology of stressed Bacillus subtilis cells. Front. Appl. Environ. Microbiol. 2021, 12, 625705. [Google Scholar] [CrossRef] [PubMed]
Figure 1. (A). Spontaneous- and hydrogen peroxide-promoted RifR mutation frequencies in strains of B. subtilis WT and ∆GO. Strains cultured to an OD600 of 1.0 were split into two subcultures; one of these subcultures was amended with a LD25 of H2O2, and the other was left as an untreated control. After a 24 h incubation period, the cultures were processed to determine mutation frequencies with regard to RifR, as described in Materials and Methods. (B). The hydrogen peroxide susceptibility of the B. subtilis WT and ∆GO strains. Strains propagated with an OD600 of 1.0 were treated with increasing doses of hydrogen peroxide for 30 min, and LD50s and LD90s values were determined using dose/response curves, as described in Materials and Methods. Values represent the average of three independent experiments per triplicate ± standard deviation. Letters a–d indicate statistically significant differences between strains, as determined by one-way analysis of variance (ANOVA), followed by a Tukey’s post-hoc test; p < 0.05.
Antioxidants 13 00332 g001
Figure 2. B. subtilis strain susceptibility to hydrogen peroxide, with distinct genotypes. The indicated strains, propagated to an OD600 of 1.0, were treated with increasing doses of hydrogen peroxide for 30 min; LD90 values were determined using dose/response curves, as described in Materials and Methods. Values represent the average of three independent experiments, per triplicate ± standard deviation. Letters a–d, indicate statistically significant differences between strains, as determined by one-way analysis of variance (ANOVA), followed by a Tukey’s post-hoc test; p < 0.05.
Antioxidants 13 00332 g002
Figure 3. Heatmap analysis using the Log2 values of the top 100 upregulated proteins from WT and ∆GO strains that were either exposed to H2O2 or not. The graph represents the complete linkage and Spearman Rank Correlation. The Z-Score indicates differences between rows, not activation or repression.
Antioxidants 13 00332 g003
Figure 4. Proteins with the highest level of dysregulation in the strain, B. subtilis ∆GO. Bars represent the 30 proteins with the highest (A) and lowest (B) Log2 fold values detected by proteomics in the strain, B. subtilis ∆GO.
Antioxidants 13 00332 g004
Figure 5. Hydrogen peroxide elicits differential protein profiles in the WT and ∆GO B. subtilis strains. Protein abundance values (fmol) were plotted as fold changes for the WT and ∆GO strains exposed to H2O2 versus the same untreated strains. Proteins with the highest and lowest fold change values are indicated in the figure.
Antioxidants 13 00332 g005
Figure 6. (A). B. subtilis strain susceptibility to hydrogen peroxide, with distinct genotypes. The indicated strains with an OD600 of 1.0 were treated with increasing doses of hydrogen peroxide for 30 min; LD90s values were determined using dose/response curves, as described in Materials and Methods. Values represent the average of three independent experiments, per triplicate ± standard deviation. Letters a–c indicate statistically significant differences between strains, as determined by a one-way analysis of variance (ANOVA) followed by a Tukey’s post-hoc test; p < 0.05. (B). Spontaneous- and hydrogen peroxide-promoted RifR mutation frequencies of B. subtilis strains with different genotypes. Strains cultured to an OD600 of 1.0 were split into two subcultures, one of these subcultures was amended with a LD25 of H2O2, and the other was left as an untreated control. After a 24 h incubation period, the cultures were processed to determine mutation frequencies in RifR, as described in Materials and Methods. Values represent the average of three independent experiments, per triplicate ± standard deviation. Letters a–d indicate statistically significant differences between strains, as determined by a one-way analysis of variance (ANOVA) followed by a Tukey’s post-hoc test; p < 0.05.
Antioxidants 13 00332 g006
Figure 7. B. subtilis WT and ∆GO strain susceptibility to t-BHP (A). Strains with an OD600 of 1.0 were treated with increasing doses of t-BHP for 30 min; LD90s values were determined from the dose/response graphs, as described in Materials and Methods. Values represent the average of three independent experiments, per triplicate ± standard deviations. (B). The indicated strains were treated with an OD600 of 0.8, which was amended with a LD25 of H2O2, and then allowed to increase to an OD600 of 1.0. At this point, the strains were treated with increasing doses of t-BHP for 30 min; LD90s values were determined using the dose/response graphs, as described in Materials and Methods. Values represent the average of three independent experiments, per triplicate ± standard deviations. Asterisks (*) indicate statistically significant differences between LD90 values and strains, as determined by a one-way analysis of variance (ANOVA) followed by a Tukey’s post-hoc test; p < 0.05.
Antioxidants 13 00332 g007
Figure 8. B. subtilis WT and ∆GO strain susceptibility to rifampicin and ciprofloxacin. Strains with an OD600 of 1.0 were treated with increasing doses of rifampicin (A) or ciprofloxacin (B), at the indicated concentrations, for 30 min; LD90s values were determined using the dose/response graphs, as described in Materials and Methods. Values represent the average of three independent experiments, per triplicate ± standard deviations. Asterisks (*) indicate significant differences between LD90 values and strains, as determined by a one-way analysis of variance (ANOVA) followed by a Tukey’s post-hoc test; p < 0.05.
Antioxidants 13 00332 g008
Table 1. Abundance and fold changes of stress-associated proteins from B. subtilis strains, ∆GO and WT.
ProteinCell FunctionEssentialProtein Abundance (fmol)∆GO/WT∆GO H2O2/GO
WT∆GOWT
H2O2
∆GO
H2O2
Max
Fold
Log2
Max Fold
Max
Fold
Log2
Max Fold
KatAOxidative stressNo5.21227.7187.716143.55.450.7−0.51
YciBZur regulonNo0.5415.63.0214.3728.94.840.92−0.12
CoaEPeroxide stressYes0.676.390.266.029.53.250.94−0.09
AhpFOxidative stressNo19.5516939.2137.368.643.10.81−0.3
AhpCOxidative stressNo250.30.02478.30.067.60 × 10−5−13.731.58
OhrAOxidative stressNo0.420.230.459.30.53−0.7640.435.3
CymRRedox stress and
stringent response
No1.32273.72420.43.20.88−0.02
CysSRedox stress and
stringent response
Yes7.328.258.427.871.120.160.95−0.07
CysKRedox stress and
stringent response
No949197.889.50.96−0.060.98−0.03
SufBRedox stressYes26.762.131.456.12.321.210.9−0.12
SufDRedox stressYes25.561.230.958.862.41.260.96−0.07
SufCRedox stressYes34.677.153.173.82.21.130.95−0.07
SufSRedox stressYes10.81617.617.21.50.581.070.1
YutI(Nfu)Redox stressNo15.814.316.613.90.9−0.150.97−0.08
RecASOS responseNo2.75.810.9102.11.071.70.76
HupaSOS response 303.4401.5359.1306.41.320.40.76−0.39
YceDGeneral stressNo21.1234.918.932.11.650.720.91−13
TrxAGeneral stressYes1.12.341.91.91.990.990.82−0.28
YceEGeneral stressNo19.228.2225.324.91.460.550.88−0.02
YflTGeneral stressNo13.31.912.43.820.14−1.3221
SmCStringent response 39.34.98.763.071.630.94−0.09
RpoBStringent response 59.5468.7158.5769.21.150.210
Disclaimer/Publisher’s Note: The statements, opinions and data contained in all publications are solely those of the individual author(s) and contributor(s) and not of MDPI and/or the editor(s). MDPI and/or the editor(s) disclaim responsibility for any injury to people or property resulting from any ideas, methods, instructions or products referred to in the content.

