

Causal Effects of Oxidative Stress on Diabetes Mellitus and Microvascular Complications: Insights Integrating Genome-Wide Mendelian Randomization, DNA Methylation, and Proteome
 ,
,
Abstract
:1. Introduction
2. Methods
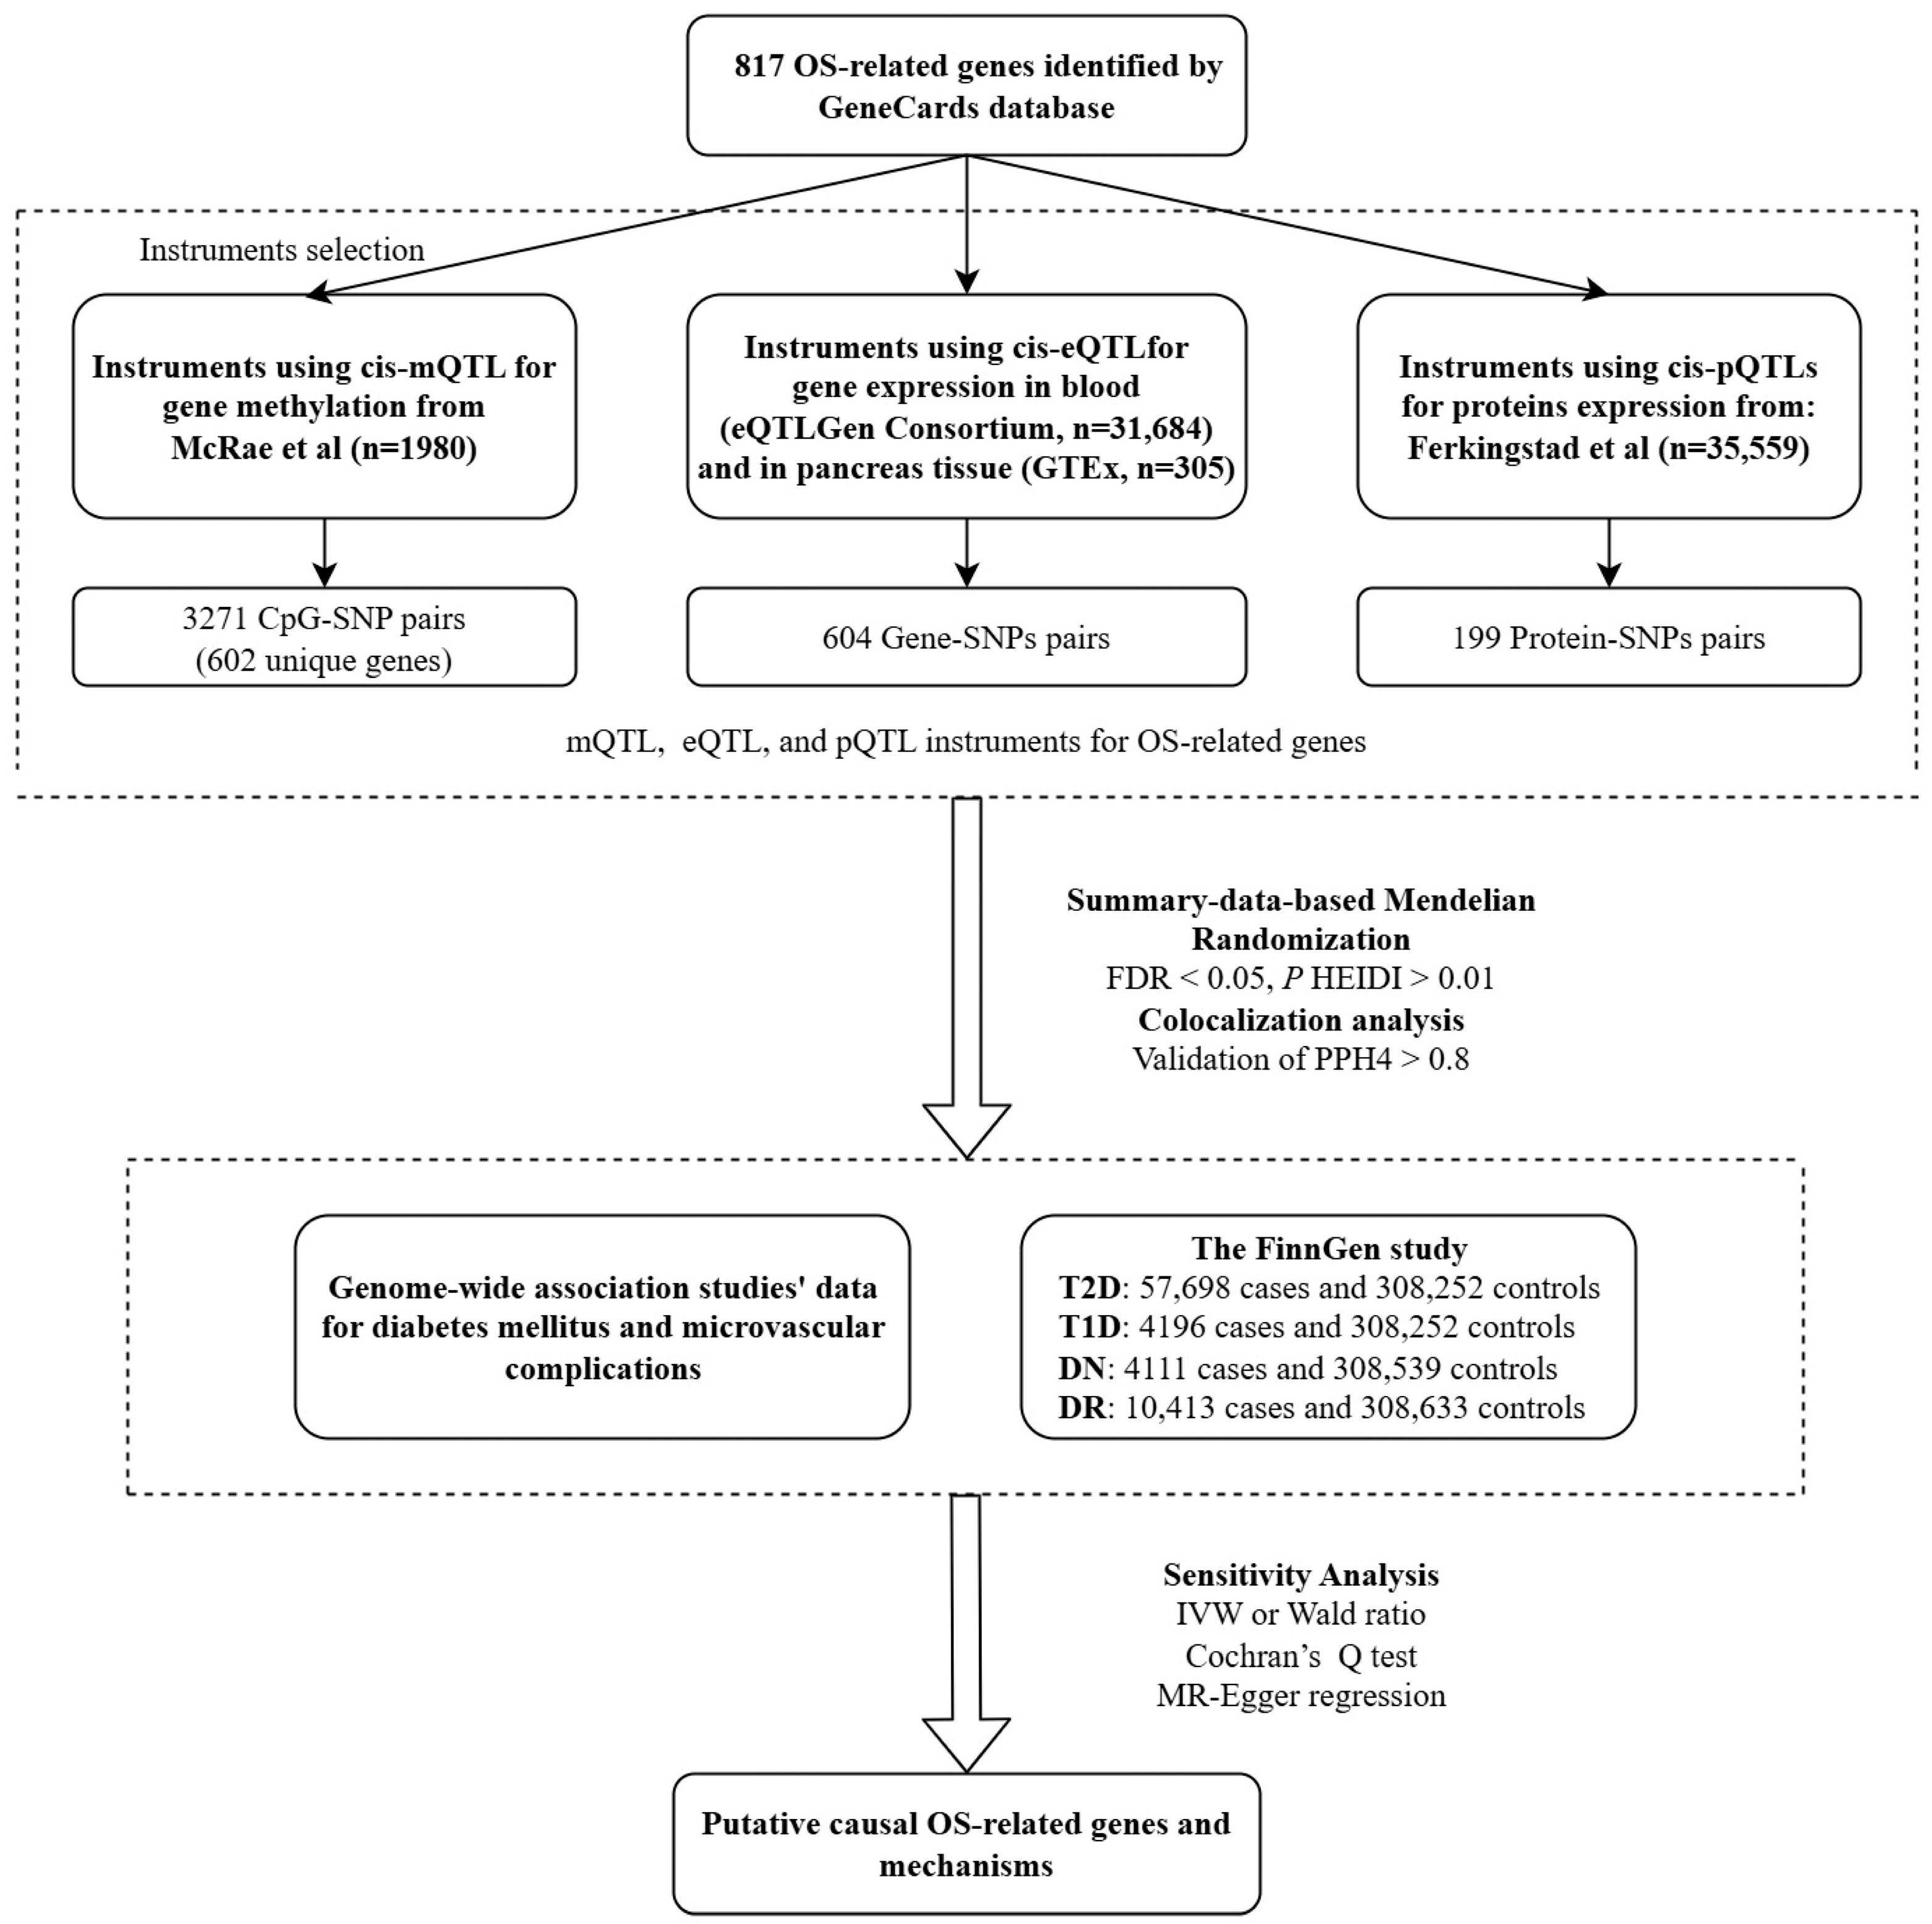
2.1. Study Design
2.2. Exposure Sources
2.3. Outcome Sources
2.4. Statistical Analyses
2.4.1. Summary-Data-Based MR Analysis
2.4.2. Colocalization Analysis
2.4.3. Sensitivity Analysis
3. Results
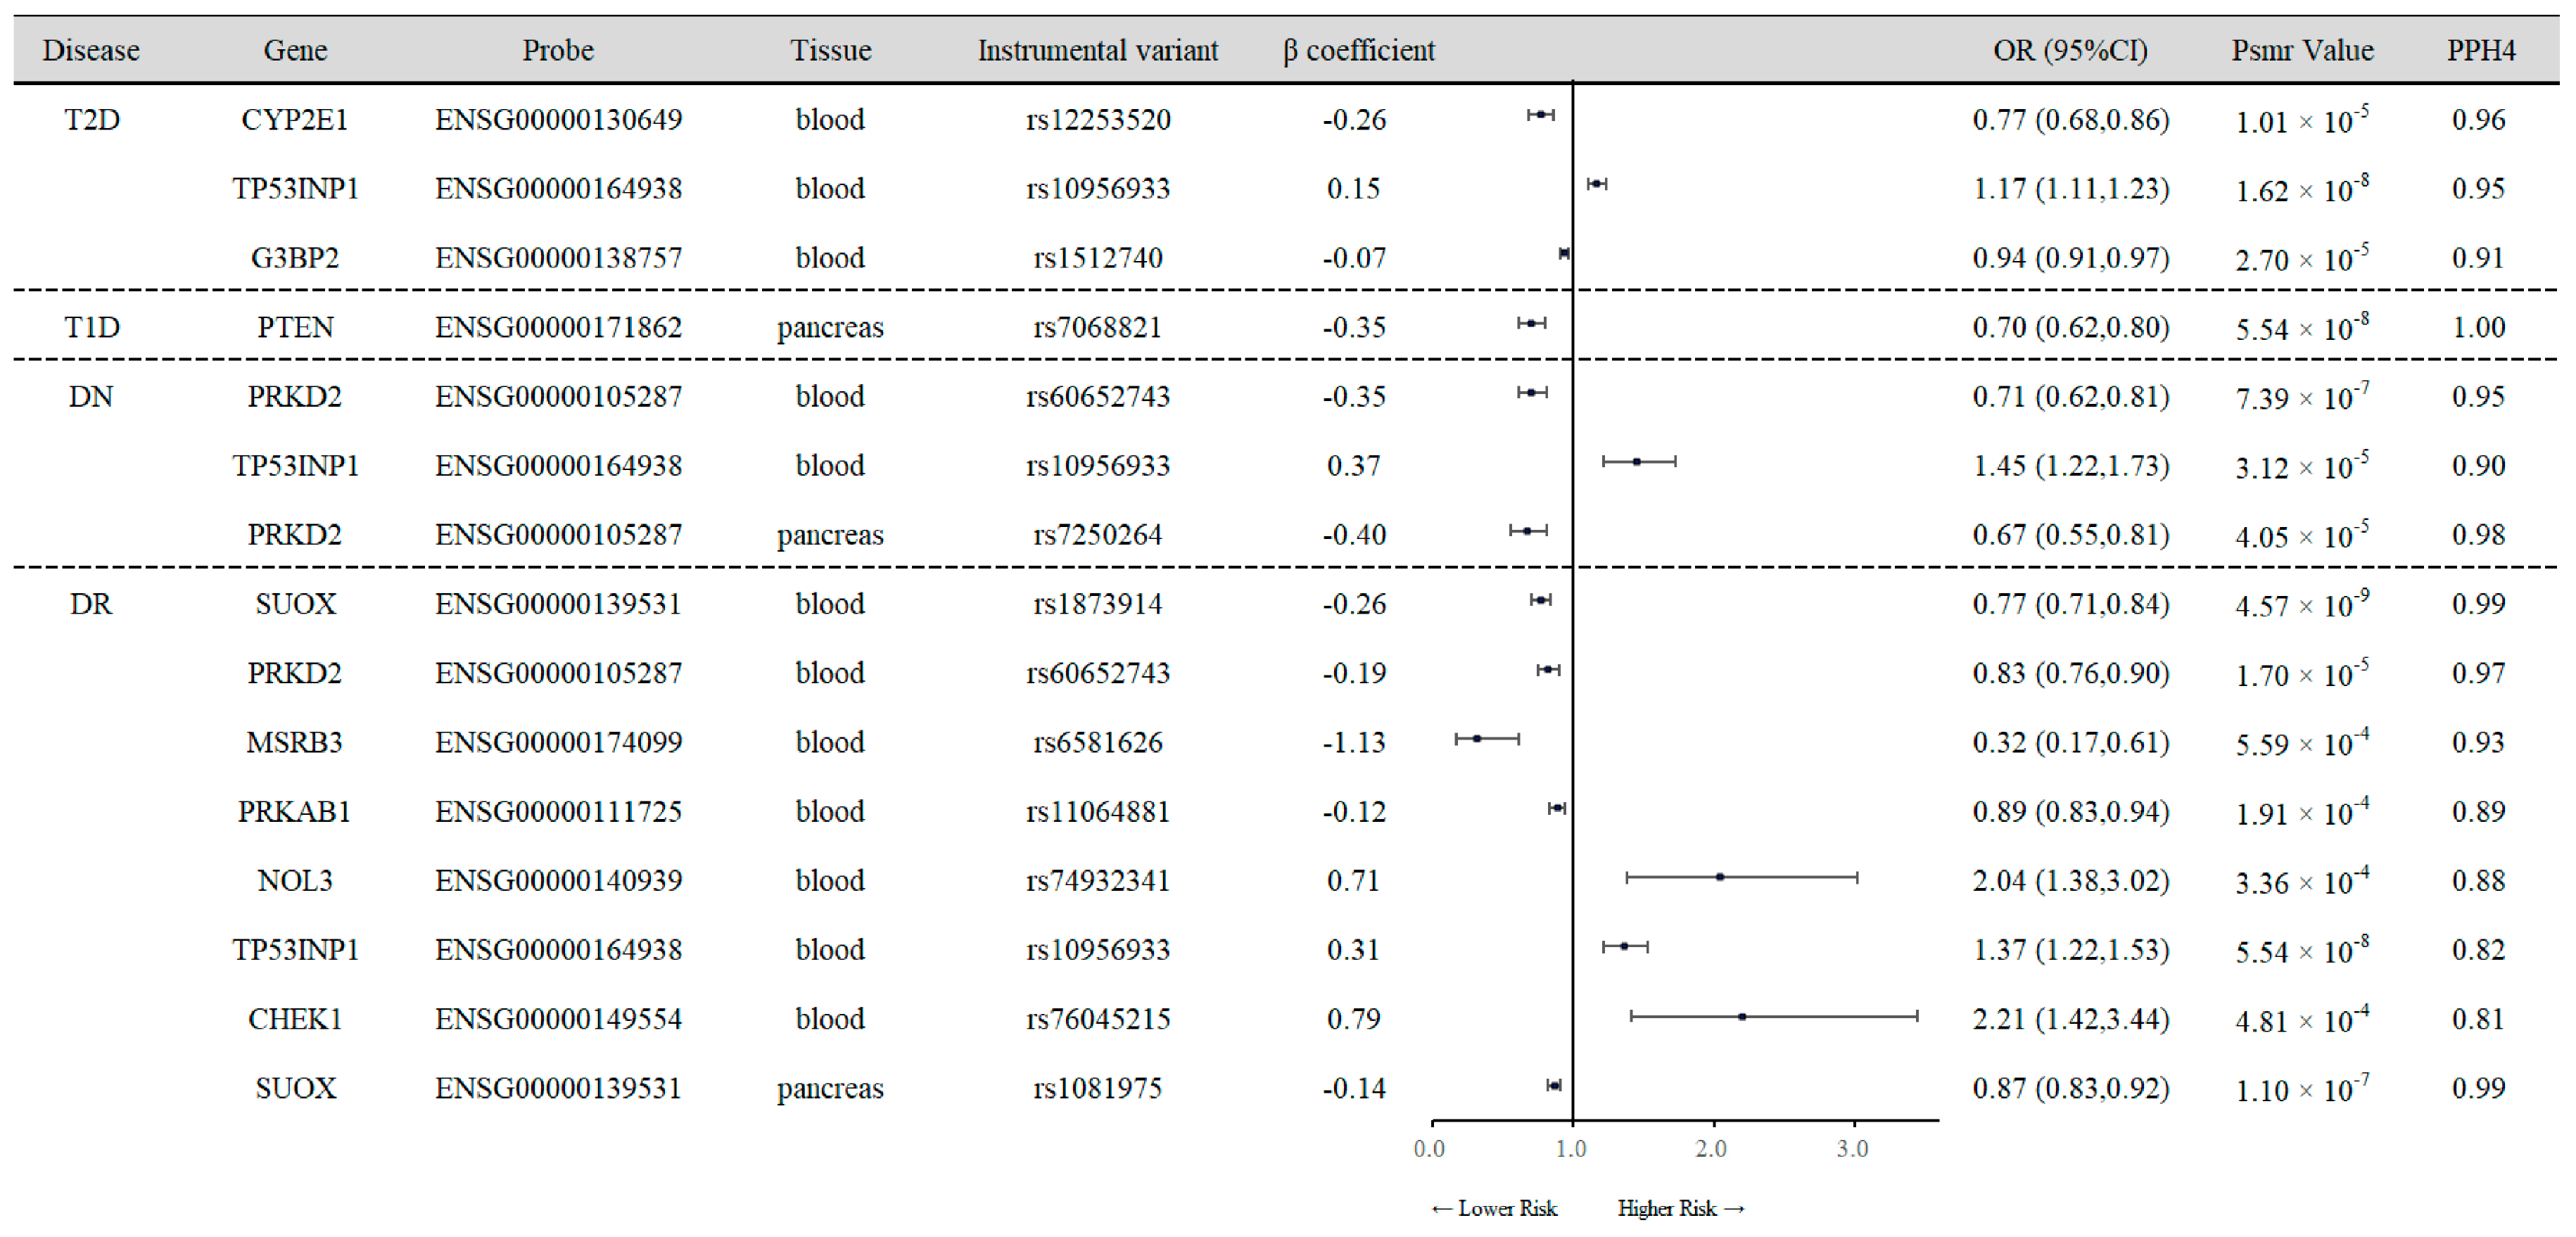
3.1. SMR Analysis of Cis-eQTL and Diabetes Outcomes
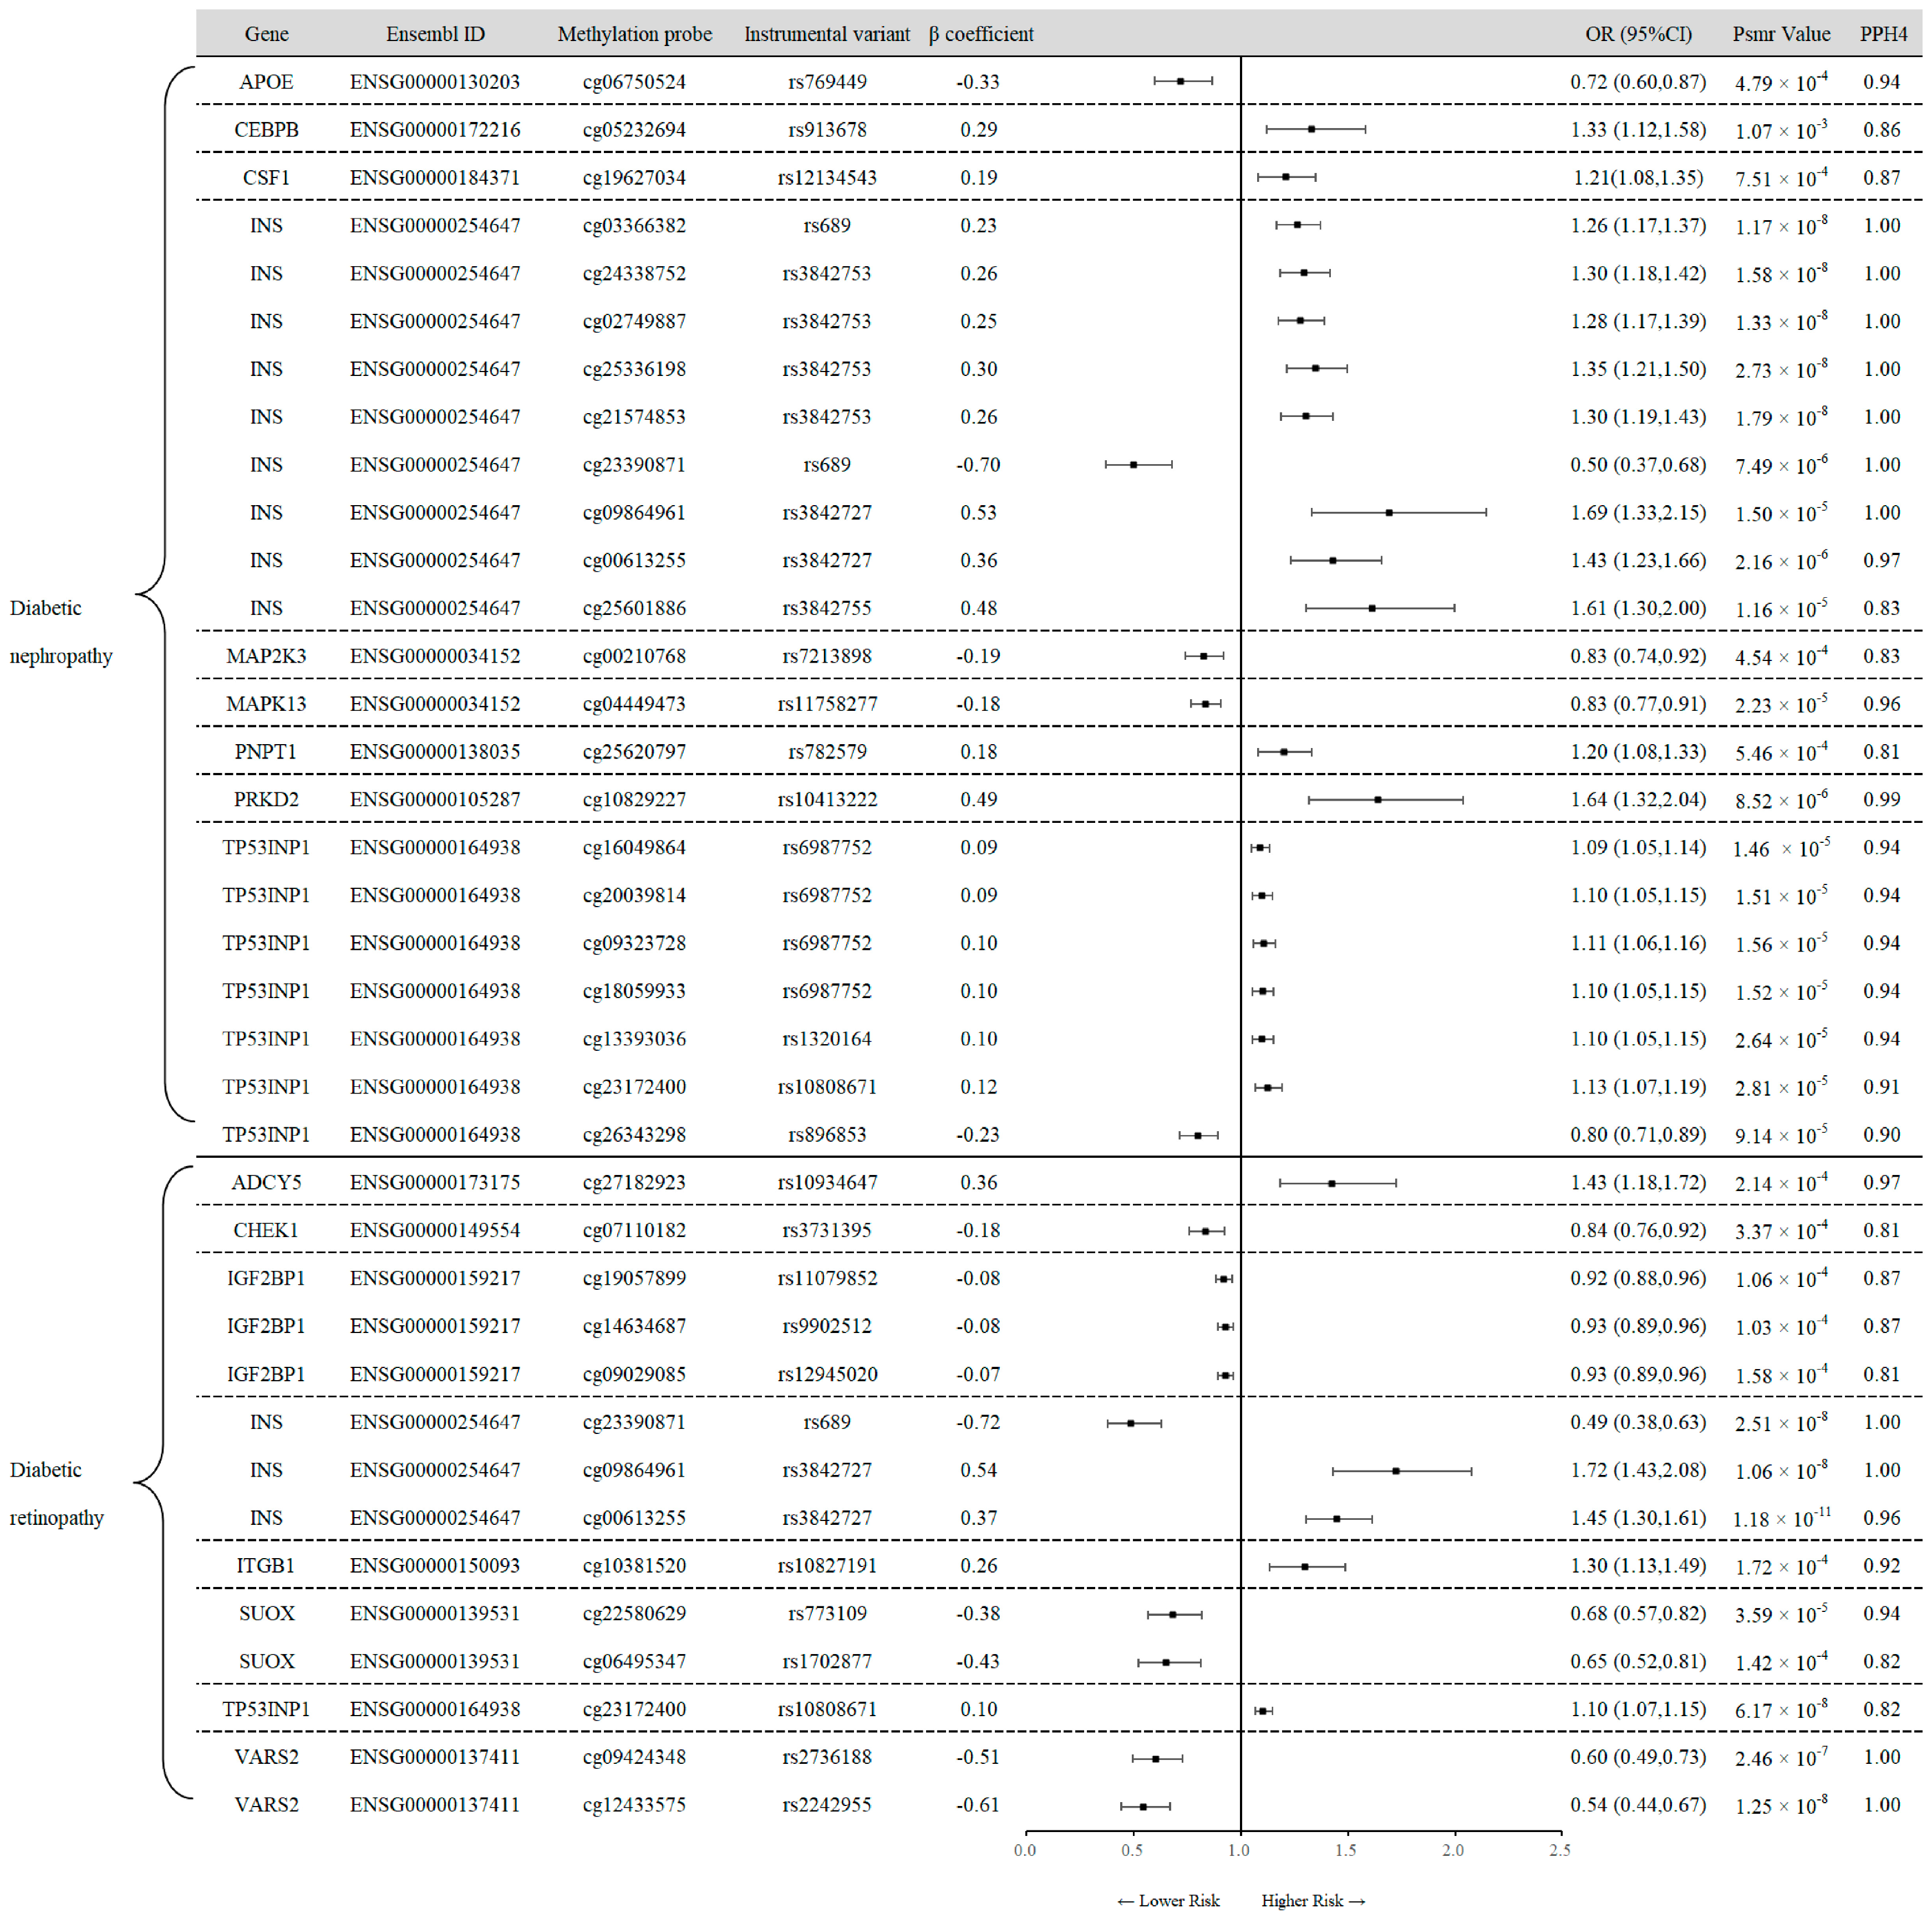
3.2. SMR Analysis of Cis-mQTL and Diabetes Outcomes
3.3. SMR Analysis of Cis-pQTL and Diabetes Outcomes
3.4. SMR Analysis for mQTL and eQTL Data
3.5. Sensitivity Analysis
4. Discussion
5. Conclusions
Supplementary Materials
Author Contributions
Funding
Institutional Review Board Statement
Informed Consent Statement
Data Availability Statement
Conflicts of Interest
References
- Ong, K.L.; Stafford, L.K.; McLaughlin, S.A.; Boyko, E.J.; Vollset, S.E.; Smith, A.E.; Dalton, B.E.; Duprey, J.; Cruz, J.A.; Hagins, H.; et al. Global, regional, and national burden of diabetes from 1990 to 2021, with projections of prevalence to 2050: A systematic analysis for the Global Burden of Disease Study 2021. Lancet 2023, 402, 203–234. [Google Scholar] [CrossRef] [PubMed]
- Schiborn, C.; Schulze, M.B. Precision prognostics for the development of complications in diabetes. Diabetologia 2022, 65, 1867–1882. [Google Scholar] [CrossRef] [PubMed]
- Zheng, Y.; Ley, S.H.; Hu, F.B. Global aetiology and epidemiology of type 2 diabetes mellitus and its complications. Nat. Rev. Endocrinol. 2018, 14, 88–98. [Google Scholar] [CrossRef] [PubMed]
- Sies, H. Oxidative stress: A concept in redox biology and medicine. Redox Biol. 2015, 4, 180–183. [Google Scholar] [CrossRef] [PubMed]
- Bhatti, J.S.; Sehrawat, A.; Mishra, J.; Sidhu, I.S.; Navik, U.; Khullar, N.; Kumar, S.; Bhatti, G.K.; Reddy, P.H. Oxidative stress in the pathophysiology of type 2 diabetes and related complications: Current therapeutics strategies and future perspectives. Free Radic. Biol. Med. 2022, 184, 114–134. [Google Scholar] [CrossRef] [PubMed]
- Azarova, I.; Polonikov, A.; Klyosova, E. Molecular Genetics of Abnormal Redox Homeostasis in Type 2 Diabetes Mellitus. Int. J. Mol. Sci. 2023, 24, 4738. [Google Scholar] [CrossRef] [PubMed]
- Cole, J.B.; Florez, J.C. Genetics of diabetes mellitus and diabetes complications. Nat. Rev. Nephrol. 2020, 16, 377–390. [Google Scholar] [CrossRef] [PubMed]
- Farh, K.K.; Marson, A.; Zhu, J.; Kleinewietfeld, M.; Housley, W.J.; Beik, S.; Shoresh, N.; Whitton, H.; Ryan, R.J.; Shishkin, A.A.; et al. Genetic and epigenetic fine mapping of causal autoimmune disease variants. Nature 2015, 518, 337–343. [Google Scholar] [CrossRef]
- Fraszczyk, E.; Spijkerman, A.M.W.; Zhang, Y.; Brandmaier, S.; Day, F.R.; Zhou, L.; Wackers, P.; Dollé, M.E.T.; Bloks, V.W.; Gào, X.; et al. Epigenome-wide association study of incident type 2 diabetes: A meta-analysis of five prospective European cohorts. Diabetologia 2022, 65, 763–776. [Google Scholar] [CrossRef]
- Horvath, S.; Raj, K. DNA methylation-based biomarkers and the epigenetic clock theory of ageing. Nat. Rev. Genet. 2018, 19, 371–384. [Google Scholar] [CrossRef] [PubMed]
- Stefan-Lifshitz, M.; Karakose, E.; Cui, L.; Ettela, A.; Yi, Z.; Zhang, W.; Tomer, Y. Epigenetic modulation of β cells by interferon-α via PNPT1/mir-26a/TET2 triggers autoimmune diabetes. JCI Insight 2019, 4, e126663. [Google Scholar] [CrossRef] [PubMed]
- Zhu, Z.; Zhang, F.; Hu, H.; Bakshi, A.; Robinson, M.R.; Powell, J.E.; Montgomery, G.W.; Goddard, M.E.; Wray, N.R.; Visscher, P.M.; et al. Integration of summary data from GWAS and eQTL studies predicts complex trait gene targets. Nat. Genet. 2016, 48, 481–487. [Google Scholar] [CrossRef] [PubMed]
- Fan, J.; Cao, S.; Chen, M.; Yao, Q.; Zhang, X.; Du, S.; Qu, H.; Cheng, Y.; Ma, S.; Zhang, M.; et al. Investigating the AC079305/DUSP1 Axis as Oxidative Stress-Related Signatures and Immune Infiltration Characteristics in Ischemic Stroke. Oxid. Med. Cell. Longev. 2022, 2022, 8432352. [Google Scholar] [CrossRef] [PubMed]
- Qiu, X.; Hou, Q.H.; Shi, Q.Y.; Jiang, H.X.; Qin, S.Y. Identification of Hub Prognosis-Associated Oxidative Stress Genes in Pancreatic Cancer Using Integrated Bioinformatics Analysis. Front. Genet. 2020, 11, 595361. [Google Scholar] [CrossRef] [PubMed]
- Sun, X.; Huang, X.; Sun, X.; Chen, S.; Zhang, Z.; Yu, Y.; Zhang, P. Oxidative Stress-Related lncRNAs Are Potential Biomarkers for Predicting Prognosis and Immune Responses in Patients with LUAD. Front. Genet. 2022, 13, 909797. [Google Scholar] [CrossRef] [PubMed]
- Neumeyer, S.; Hemani, G.; Zeggini, E. Strengthening Causal Inference for Complex Disease Using Molecular Quantitative Trait Loci. Trends Mol. Med. 2020, 26, 232–241. [Google Scholar] [CrossRef] [PubMed]
- McRae, A.F.; Marioni, R.E.; Shah, S.; Yang, J.; Powell, J.E.; Harris, S.E.; Gibson, J.; Henders, A.K.; Bowdler, L.; Painter, J.N.; et al. Identification of 55,000 Replicated DNA Methylation QTL. Sci. Rep. 2018, 8, 17605. [Google Scholar] [CrossRef] [PubMed]
- Võsa, U.; Claringbould, A.; Westra, H.J.; Bonder, M.J.; Deelen, P.; Zeng, B.; Kirsten, H.; Saha, A.; Kreuzhuber, R.; Yazar, S.; et al. Large-scale cis- and trans-eQTL analyses identify thousands of genetic loci and polygenic scores that regulate blood gene expression. Nat. Genet. 2021, 53, 1300–1310. [Google Scholar] [CrossRef] [PubMed]
- GTEx Consortium. The GTEx Consortium atlas of genetic regulatory effects across human tissues. Science 2020, 369, 1318–1330. [Google Scholar] [CrossRef] [PubMed]
- Ferkingstad, E.; Sulem, P.; Atlason, B.A.; Sveinbjornsson, G.; Magnusson, M.I.; Styrmisdottir, E.L.; Gunnarsdottir, K.; Helgason, A.; Oddsson, A.; Halldorsson, B.V.; et al. Large-scale integration of the plasma proteome with genetics and disease. Nat. Genet. 2021, 53, 1712–1721. [Google Scholar] [CrossRef]
- Kurki, M.I.; Karjalainen, J.; Palta, P.; Sipilä, T.P.; Kristiansson, K.; Donner, K.M.; Reeve, M.P.; Laivuori, H.; Aavikko, M.; Kaunisto, M.A.; et al. FinnGen provides genetic insights from a well-phenotyped isolated population. Nature 2023, 613, 508–518. [Google Scholar] [CrossRef] [PubMed]
- Auton, A.; Brooks, L.D.; Durbin, R.M.; Garrison, E.P.; Kang, H.M.; Korbel, J.O.; Marchini, J.L.; McCarthy, S.; McVean, G.A.; Abecasis, G.R. A global reference for human genetic variation. Nature 2015, 526, 68–74. [Google Scholar] [PubMed]
- Storey, J.D.; Tibshirani, R. Statistical significance for genomewide studies. Proc. Natl. Acad. Sci. USA 2003, 100, 9440–9445. [Google Scholar] [CrossRef] [PubMed]
- Burgess, S.; Thompson, S.G. Avoiding bias from weak instruments in Mendelian randomization studies. Int. J. Epidemiol. 2011, 40, 755–764. [Google Scholar] [CrossRef] [PubMed]
- Higgins, J.P.; Thompson, S.G.; Deeks, J.J.; Altman, D.G. Measuring inconsistency in meta-analyses. BMJ 2003, 327, 557–560. [Google Scholar] [CrossRef]
- Burgess, S.; Thompson, S.G. Interpreting findings from Mendelian randomization using the MR-Egger method. Eur. J. Epidemiol. 2017, 32, 377–389. [Google Scholar] [CrossRef] [PubMed]
- An, Y.; Xu, B.T.; Wan, S.R.; Ma, X.M.; Long, Y.; Xu, Y.; Jiang, Z.Z. The role of oxidative stress in diabetes mellitus-induced vascular endothelial dysfunction. Cardiovasc. Diabetol. 2023, 22, 237. [Google Scholar] [CrossRef] [PubMed]
- Cao, Y.; Zhao, H.; Meng, F.; Deng, Q.; Cai, L.; Guo, X.; Chen, Y.; Yang, X.; Xie, Z.; Yi, G.; et al. Exploring the shared molecular mechanism of microvascular and macrovascular complications in diabetes: Seeking the hub of circulatory system injury. Front. Endocrinol. 2023, 14, 1032015. [Google Scholar]
- Caturano, A.; D’Angelo, M.; Mormone, A.; Russo, V.; Mollica, M.P.; Salvatore, T.; Galiero, R.; Rinaldi, L.; Vetrano, E.; Marfella, R.; et al. Oxidative Stress in Type 2 Diabetes: Impacts from Pathogenesis to Lifestyle Modifications. Curr. Issues Mol. Biol. 2023, 45, 6651–6666. [Google Scholar] [CrossRef] [PubMed]
- Förstermann, U.; Xia, N.; Li, H. Roles of Vascular Oxidative Stress and Nitric Oxide in the Pathogenesis of Atherosclerosis. Circ. Res. 2017, 120, 713–735. [Google Scholar] [CrossRef] [PubMed]
- Jia, G.; Bai, H.; Mather, B.; Hill, M.A.; Jia, G.; Sowers, J.R. Diabetic Vasculopathy: Molecular Mechanisms and Clinical Insights. Int. J. Mol. Sci. 2024, 25, 804. [Google Scholar] [CrossRef] [PubMed]
- Ighodaro, O.M. Molecular pathways associated with oxidative stress in diabetes mellitus. Biomed. Pharmacother. 2018, 108, 656–662. [Google Scholar] [CrossRef] [PubMed]
- Tonin, G.; Dolžan, V.; Klen, J. Genetic and Transcriptomic Background of Oxidative Stress and Antioxidative Therapies in Late Complications of Type 2 Diabetes Mellitus: A Systematic Review. Antioxidants 2024, 13, 277. [Google Scholar] [CrossRef] [PubMed]
- Darenskaya, M.; Kolesnikov, S.; Semenova, N.; Kolesnikova, L. Diabetic Nephropathy: Significance of Determining Oxidative Stress and Opportunities for Antioxidant Therapies. Int. J. Mol. Sci. 2023, 24, 12378. [Google Scholar] [CrossRef] [PubMed]
- Hüttl, M.; Markova, I.; Miklankova, D.; Makovicky, P.; Pelikanova, T.; Šeda, O.; Šedová, L.; Malinska, H. Adverse Effects of Methylglyoxal on Transcriptome and Metabolic Changes in Visceral Adipose Tissue in a Prediabetic Rat Model. Antioxidants 2020, 9, 803. [Google Scholar] [CrossRef] [PubMed]
- Li, F.; Zhang, F.; Wang, T.; Xie, Z.; Luo, H.; Dong, W.; Zhang, J.; Ren, C.; Peng, W. A self-amplifying loop of TP53INP1 and P53 drives oxidative stress-induced apoptosis of bone marrow mesenchymal stem cells. Apoptosis 2024, 29, 882–897. [Google Scholar] [CrossRef] [PubMed]
- Li, W.; Bi, C.; Han, Y.; Tian, T.; Wang, X.; Bao, H.; Xu, X.; Zhang, X.; Liu, L.; Zhang, W.; et al. Targeting EZH1/2 induces cell cycle arrest and inhibits cell proliferation through reactivation of p57(CDKN1C) and TP53INP1 in mantle cell lymphoma. Cancer Biol. Med. 2019, 16, 530–541. [Google Scholar] [CrossRef] [PubMed]
- Gonzalez-Rellan, M.J.; Fondevila, M.F.; Fernandez, U.; Rodríguez, A.; Varela-Rey, M.; Veyrat-Durebex, C.; Seoane, S.; Bernardo, G.; Lopitz-Otsoa, F.; Fernández-Ramos, D.; et al. O-GlcNAcylated p53 in the liver modulates hepatic glucose production. Nat. Commun. 2021, 12, 5068. [Google Scholar] [CrossRef] [PubMed]
- Voight, B.F.; Scott, L.J.; Steinthorsdottir, V.; Morris, A.P.; Dina, C.; Welch, R.P.; Zeggini, E.; Huth, C.; Aulchenko, Y.S.; Thorleifsson, G.; et al. Twelve type 2 diabetes susceptibility loci identified through large-scale association analysis. Nat. Genet. 2010, 42, 579–589. [Google Scholar] [CrossRef] [PubMed]
- Xue, A.; Wu, Y.; Zhu, Z.; Zhang, F.; Kemper, K.E.; Zheng, Z.; Yengo, L.; Lloyd-Jones, L.R.; Sidorenko, J.; Wu, Y.; et al. Genome-wide association analyses identify 143 risk variants and putative regulatory mechanisms for type 2 diabetes. Nat. Commun. 2018, 9, 2941. [Google Scholar] [CrossRef] [PubMed]
- Juvinao-Quintero, D.L.; Sharp, G.C.; Sanderson, E.C.M.; Relton, C.L.; Elliott, H.R. Investigating causality in the association between DNA methylation and type 2 diabetes using bidirectional two-sample Mendelian randomisation. Diabetologia 2023, 66, 1247–1259. [Google Scholar] [CrossRef] [PubMed]
- Ling, C. Epigenetic regulation of insulin action and secretion-role in the pathogenesis of type 2 diabetes. J. Intern. Med. 2020, 288, 158–167. [Google Scholar] [CrossRef]
- Maiti, B.K. Cross-talk Between (Hydrogen)Sulfite and Metalloproteins: Impact on Human Health. Chemistry 2022, 28, e202104342. [Google Scholar] [CrossRef] [PubMed]
- Enemark, J.H. Mechanistic complexities of sulfite oxidase: An enzyme with multiple domains, subunits, and cofactors. J. Inorg. Biochem. 2023, 247, 112312. [Google Scholar] [CrossRef] [PubMed]
- Gao, H.; Liu, Y.; Demichev, V.; Tate, S.; Chen, C.; Zhu, J.; Lu, C.; Ralser, M.; Guo, T.; Zhu, Y. Optimization of Microflow LC Coupled with Scanning SWATH and Its Application in Hepatocellular Carcinoma Tissues. J. Proteome Res. 2022, 21, 1686–1693. [Google Scholar] [CrossRef] [PubMed]
- Jin, G.Z.; Yu, W.L.; Dong, H.; Zhou, W.P.; Gu, Y.J.; Yu, H.; Yu, H.; Lu, X.Y.; Xian, Z.H.; Liu, Y.K.; et al. SUOX is a promising diagnostic and prognostic biomarker for hepatocellular carcinoma. J. Hepatol. 2013, 59, 510–517. [Google Scholar] [CrossRef]
- Kinjo, Y.; Naito, Y.; Akiba, J.; Sadashima, E.; Nakayama, M.; Tanigawa, M.; Hisaka, T.; Okabe, Y.; Yano, H. SUOX and GLUT1 are biomarkers for the prognosis in large duct type intrahepatic cholangiocarcinoma. Hum. Pathol. 2022, 128, 11–19. [Google Scholar] [CrossRef] [PubMed]
- Censin, J.C.; Bovijn, J.; Holmes, M.V.; Lindgren, C.M. Colocalization analysis of polycystic ovary syndrome to identify potential disease-mediating genes and proteins. Eur. J. Hum. Genet. 2021, 29, 1446–1454. [Google Scholar] [CrossRef] [PubMed]
- Zhu, M.; Xu, K.; Chen, Y.; Gu, Y.; Zhang, M.; Luo, F.; Liu, Y.; Gu, W.; Hu, J.; Xu, H.; et al. Identification of Novel T1D Risk Loci and Their Association with Age and Islet Function at Diagnosis in Autoantibody-Positive T1D Individuals: Based on a Two-Stage Genome-Wide Association Study. Diabetes Care 2019, 42, 1414–1421. [Google Scholar] [CrossRef] [PubMed]
- Bender, D.; Kaczmarek, A.T.; Santamaria-Araujo, J.A.; Stueve, B.; Waltz, S.; Bartsch, D.; Kurian, L.; Cirak, S.; Schwarz, G. Impaired mitochondrial maturation of sulfite oxidase in a patient with severe sulfite oxidase deficiency. Hum. Mol. Genet. 2019, 28, 2885–2899. [Google Scholar] [CrossRef] [PubMed]
- Malaviya, P.; Kowluru, R.A. Homocysteine and mitochondrial quality control in diabetic retinopathy. Eye Vis. 2024, 11, 5. [Google Scholar] [CrossRef] [PubMed]
- Neizer-Ashun, F.; Bhattacharya, R. Reality CHEK: Understanding the biology and clinical potential of CHK1. Cancer Lett. 2021, 497, 202–211. [Google Scholar] [CrossRef] [PubMed]
- Gu, C.; Wang, W.; Tang, X.; Xu, T.; Zhang, Y.; Guo, M.; Wei, R.; Wang, Y.; Jurczyszyn, A.; Janz, S.; et al. CHEK1 and circCHEK1_246aa evoke chromosomal instability and induce bone lesion formation in multiple myeloma. Mol. Cancer 2021, 20, 84. [Google Scholar] [CrossRef] [PubMed]
- Yoshida, K.; Yokoi, A.; Yamamoto, T.; Hayashi, Y.; Nakayama, J.; Yokoi, T.; Yoshida, H.; Kato, T.; Kajiyama, H.; Yamamoto, Y. Aberrant Activation of Cell-Cycle-Related Kinases and the Potential Therapeutic Impact of PLK1 or CHEK1 Inhibition in Uterine Leiomyosarcoma. Clin. Cancer Res. 2022, 28, 2147–2159. [Google Scholar] [CrossRef] [PubMed]
- Varun, K.; Zoltan, K.; Alba, S.; Manuel, B.; Elisabeth, K.; Dimitrios, T.; Jan, B.G.; Maik, B.; Khurrum, S.; Berend, I.; et al. Elevated markers of DNA damage and senescence are associated with the progression of albuminuria and restrictive lung disease in patients with type 2 diabetes. EBioMedicine 2023, 90, 104516. [Google Scholar] [CrossRef] [PubMed]
- Tatsuoka, H.; Sakamoto, S.; Yabe, D.; Kabai, R.; Kato, U.; Okumura, T.; Botagarova, A.; Tokumoto, S.; Usui, R.; Ogura, M.; et al. Single-Cell Transcriptome Analysis Dissects the Replicating Process of Pancreatic Beta Cells in Partial Pancreatectomy Model. iScience 2020, 23, 101774. [Google Scholar] [CrossRef] [PubMed]
- Li, S.; Deng, J.; Sun, D.; Chen, S.; Yao, X.; Wang, N.; Zhang, J.; Gu, Q.; Zhang, S.; Wang, J.; et al. FBXW7 alleviates hyperglycemia-induced endothelial oxidative stress injury via ROS and PARP inhibition. Redox Biol. 2022, 58, 02530. [Google Scholar] [CrossRef] [PubMed]
- Wojtala, M.; Dąbek, A.; Rybaczek, D.; Śliwińska, A.; Świderska, E.; Słapek, K.; El-Osta, A.; Balcerczyk, A. Silencing Lysine-Specific Histone Demethylase 1 (LSD1) Causes Increased HP1-Positive Chromatin, Stimulation of DNA Repair Processes, and Dysregulation of Proliferation by Chk1 Phosphorylation in Human Endothelial Cells. Cells 2019, 8, 1212. [Google Scholar] [CrossRef] [PubMed]
- Martin, T.M.; Burke, S.J.; Wasserfall, C.H.; Collier, J.J. Islet beta-cells and intercellular adhesion molecule-1 (ICAM-1): Integrating immune responses that influence autoimmunity and graft rejection. Autoimmun. Rev. 2023, 22, 103414. [Google Scholar] [CrossRef] [PubMed]
- Siddiqui, K.; George, T.P.; Mujammami, M.; Isnani, A.; Alfadda, A.A. The association of cell adhesion molecules and selectins (VCAM-1, ICAM-1, E-selectin, L-selectin, and P-selectin) with microvascular complications in patients with type 2 diabetes: A follow-up study. Front. Endocrinol. 2023, 14, 1072288. [Google Scholar] [CrossRef]
- Lessieur, E.M.; Liu, H.; Saadane, A.; Du, Y.; Kiser, J.; Kern, T.S. ICAM-1 on the luminal surface of endothelial cells is induced to a greater extent in mouse retina than in other tissues in diabetes. Diabetologia 2022, 65, 1734–1744. [Google Scholar] [CrossRef] [PubMed]
- Deliyanti, D.; Suphapimol, V.; Ang, P.; Tang, X.; Jayasimhan, A.; Wilkinson-Berka, J.L. Early Depletion of Neutrophils Reduces Retinal Inflammation and Neovascularization in Mice with Oxygen-Induced Retinopathy. Int. J. Mol. Sci. 2023, 24, 15680. [Google Scholar] [CrossRef] [PubMed]
- Abu El-Asrar, A.M.; Nawaz, M.I.; Ahmad, A.; Dillemans, L.; Siddiquei, M.; Allegaert, E.; Gikandi, P.W.; De Hertogh, G.; Opdenakker, G.; Struyf, S. CD40 Ligand-CD40 Interaction Is an Intermediary between Inflammation and Angiogenesis in Proliferative Diabetic Retinopathy. Int. J. Mol. Sci. 2023, 24, 15582. [Google Scholar] [CrossRef] [PubMed]
- Portillo, J.C.; Yu, J.S.; Vos, S.; Bapputty, R.; Lopez Corcino, Y.; Hubal, A.; Daw, J.; Arora, S.; Sun, W.; Lu, Z.R.; et al. Disruption of retinal inflammation and the development of diabetic retinopathy in mice by a CD40-derived peptide or mutation of CD40 in Müller cells. Diabetologia 2022, 65, 2157–2171. [Google Scholar] [CrossRef]
- Vos, S.; Aaron, R.; Weng, M.; Daw, J.; Rodriguez-Rivera, E.; Subauste, C.S. CD40 Upregulation in the Retina of Patients with Diabetic Retinopathy: Association with TRAF2/TRAF6 Upregulation and Inflammatory Molecule Expression. Investig. Ophthalmol. Vis. Sci. 2023, 64, 17. [Google Scholar] [CrossRef] [PubMed]
- Tremblay, J.; Hamet, P. Environmental and genetic contributions to diabetes. Metabolism 2019, 100s, 153952. [Google Scholar] [CrossRef] [PubMed]
- Gantenbein, K.V.; Kanaka-Gantenbein, C. Mediterranean Diet as an Antioxidant: The Impact on Metabolic Health and Overall Wellbeing. Nutrients 2021, 13, 1951. [Google Scholar] [CrossRef] [PubMed]
- El Assar, M.; Álvarez-Bustos, A.; Sosa, P.; Angulo, J.; Rodríguez-Mañas, L. Effect of Physical Activity/Exercise on Oxidative Stress and Inflammation in Muscle and Vascular Aging. Int. J. Mol. Sci. 2022, 23, 8713. [Google Scholar] [CrossRef] [PubMed]

| Disease | Gene | Ensembl ID | Probe | β coefficient | OR (95%CI) | Psmr Value | PPH4 |
|---|---|---|---|---|---|---|---|
| T2D | ADCY5 | ENSG00000173175 | cg27182923 | 0.29 | 1.34 (1.19, 1.50) | 6.66 × 10⁻⁷ | 0.97 |
| APAF1 | ENSG00000120868 | cg10957001 | −0.02 | 0.98 (0.97, 0.99) | 6.08 × 10⁻⁶ | 0.89 | |
| BCL2L11 | ENSG00000153094 | cg04202892 | −0.04 | 0.96 (0.95, 0.98) | 1.06 × 10⁻⁵ | 0.93 | |
| BCL2L11 | ENSG00000153094 | cg04780086 | −0.14 | 0.87 (0.81, 0.94) | 2.09 × 10⁻⁴ | 0.92 | |
| BCL2L11 | ENSG00000153094 | cg18646521 | −0.08 | 0.93 (0.89, 0.96) | 4.35 × 10⁻⁵ | 0.92 | |
| BCL2L11 | ENSG00000153094 | cg00997280 | 0.09 | 1.09 (1.04, 1.15) | 1.08 × 10⁻³ | 0.87 | |
| BDNF | ENSG00000176697 | cg00298481 | 0.15 | 1.16 (1.06, 1.28) | 9.61 × 10⁻⁴ | 0.84 | |
| CAMK2G | ENSG00000148660 | cg07512258 | 0.11 | 1.12 (1.06, 1.18) | 5.88 × 10⁻⁵ | 0.90 | |
| CDKN1A | ENSG00000124762 | cg24425727 | 0.03 | 1.03 (1.02, 1.05) | 8.74 × 10⁻⁵ | 0.86 | |
| CDKN1A | ENSG00000124762 | cg11920449 | 0.03 | 1.03 (1.02, 1.05) | 8.64 × 10⁻⁵ | 0.86 | |
| CDKN1A | ENSG00000124762 | cg03714916 | 0.10 | 1.10 (1.04, 1.16) | 3.00 × 10⁻⁴ | 0.86 | |
| CYB5R3 | ENSG00000100243 | cg08690876 | −0.05 | 0.95 (0.93, 0.97) | 1.16 × 10⁻⁵ | 0.86 | |
| CYB5R3 | ENSG00000100243 | cg25044876 | −0.12 | 0.89 (0.83, 0.95) | 2.38 × 10⁻⁴ | 0.80 | |
| CYP2E1 | ENSG00000130649 | cg01465364 | −0.15 | 0.86 (0.79, 0.93) | 2.40 × 10⁻⁴ | 0.97 | |
| CYP2E1 | ENSG00000130649 | cg19571004 | −0.14 | 0.87 (0.81, 0.94) | 1.35 × 10⁻⁴ | 0.97 | |
| HSF1 | ENSG00000185122 | cg18814314 | −0.04 | 0.97 (0.95, 0.98) | 2.16 × 10⁻⁶ | 0.90 | |
| IGF2BP1 | ENSG00000159217 | cg09029085 | −0.05 | 0.95 (0.93, 0.97) | 7.65 × 10⁻⁸ | 0.98 | |
| IGF2BP1 | ENSG00000159217 | cg14634687 | −0.05 | 0.95 (0.93, 0.97) | 1.04 × 10⁻⁷ | 0.97 | |
| IGF2BP1 | ENSG00000159217 | cg19057899 | −0.05 | 0.95 (0.93, 0.97) | 1.27 × 10⁻⁷ | 0.97 | |
| INSR | ENSG00000171105 | cg10381200 | 0.20 | 1.22 (1.11, 1.33) | 1.76 × 10⁻⁵ | 0.91 | |
| MAP2K3 | ENSG00000034152 | cg00210768 | −0.06 | 0.94 (0.91, 0.97) | 1.55 × 10⁻⁴ | 0.85 | |
| NUDT1 | ENSG00000106268 | cg12823233 | −0.03 | 0.97 (0.96, 0.98) | 3.47 × 10⁻⁶ | 0.83 | |
| PPARG | ENSG00000132170 | cg04632671 | 0.26 | 1.30 (1.19, 1.42) | 8.63 × 10⁻⁹ | 0.98 | |
| TP53INP1 | ENSG00000164938 | cg16049864 | 0.04 | 1.04 (1.02, 1.05) | 5.47 × 10⁻⁹ | 0.98 | |
| TP53INP1 | ENSG00000164938 | cg20039814 | 0.04 | 1.04 (1.03,1.05) | 6.08 × 10⁻⁹ | 0.98 | |
| TP53INP1 | ENSG00000164938 | cg13393036 | 0.04 | 1.04 (1.03, 1.06) | 6.51 × 10⁻⁹ | 0.98 | |
| TP53INP1 | ENSG00000164938 | cg26343298 | −0.10 | 0.91 (0.88, 0.94) | 1.88 × 10⁻⁷ | 0.95 | |
| TP53INP1 | ENSG00000164938 | cg23172400 | 0.05 | 1.05 (1.03, 1.07) | 2.13 × 10⁻⁸ | 0.95 | |
| TSFM | ENSG00000123297 | cg12113251 | 0.11 | 1.11 (1.04, 1.19) | 1.73 × 10⁻³ | 0.84 | |
| T1D | BDNF | ENSG00000176697 | cg10635145 | −0.17 | 0.84 (0.77, 0.92) | 3.16 × 10⁻⁴ | 0.81 |
| DUSP1 | ENSG00000120129 | cg17560677 | 0.42 | 1.52 (1.18, 1.94) | 1.08 × 10⁻³ | 0.95 | |
| DUSP1 | ENSG00000120129 | cg22118147 | −0.28 | 0.76 (0.64, 0.89) | 8.87 × 10⁻⁴ | 0.84 | |
| SRXN1 | ENSG00000172070 | cg15557840 | −0.06 | 0.94 (0.90, 0.97) | 5.49 × 10⁻⁴ | 0.81 | |
| SUOX | ENSG00000139531 | cg22580629 | −0.66 | 0.52 (0.38, 0.69) | 1.22 × 10⁻⁵ | 0.93 |
| Outcome | Gene | eQTL → GWAS | Probe | mQTL → GWAS | mQTL → eQTL | |||||||
|---|---|---|---|---|---|---|---|---|---|---|---|---|
| OR (95% CI) | p Value | PPH4 | OR (95% CI) | p Value | PPH4 | Beta | se | p Value | PPH4 | |||
| T2D | TP53INP1 | 1.17 (1.11, 1.23) | 1.62 × 10⁻⁸ | 0.95 | cg26343298 | 0.91 (0.88, 0.94) | 1.88 × 10⁻⁷ | 0.95 | −0.62 | 0.05 | 2.01 × 10⁻³¹ | 0.99 |
| DN | 1.45 (1.22, 1.73) | 3.12 × 10⁻⁵ | 0.90 | 0.80 (0.71, 0.89) | 9.14 × 10⁻⁵ | 0.90 | ||||||
| DR | SUOX | 0.77 (0.71, 0.84) | 4.57 × 10⁻⁹ | 0.99 | cg22580629 | 0.68 (0.57, 0.82) | 3.59 × 10⁻⁵ | 0.94 | 1.52 | 0.24 | 2.19 × 10⁻¹⁰ | 0.97 |
| DR | CHEK1 | 2.21 (1.42, 3.44) | 4.81 × 10⁻⁴ | 0.81 | cg07110182 | 0.84 (0.76, 0.92) | 3.37 × 10⁻⁴ | 0.81 | −0.23 | 0.03 | 3.43 × 10⁻¹² | 0.89 |
Disclaimer/Publisher’s Note: The statements, opinions and data contained in all publications are solely those of the individual author(s) and contributor(s) and not of MDPI and/or the editor(s). MDPI and/or the editor(s) disclaim responsibility for any injury to people or property resulting from any ideas, methods, instructions or products referred to in the content. |
© 2024 by the authors. Licensee MDPI, Basel, Switzerland. This article is an open access article distributed under the terms and conditions of the Creative Commons Attribution (CC BY) license (https://creativecommons.org/licenses/by/4.0/).
Share and Cite
Liu, K.; Chen, Z.; Liu, L.; Li, T.; Xing, C.; Han, F.; Mao, H. Causal Effects of Oxidative Stress on Diabetes Mellitus and Microvascular Complications: Insights Integrating Genome-Wide Mendelian Randomization, DNA Methylation, and Proteome. Antioxidants 2024, 13, 903. https://doi.org/10.3390/antiox13080903
Liu K, Chen Z, Liu L, Li T, Xing C, Han F, Mao H. Causal Effects of Oxidative Stress on Diabetes Mellitus and Microvascular Complications: Insights Integrating Genome-Wide Mendelian Randomization, DNA Methylation, and Proteome. Antioxidants. 2024; 13(8):903. https://doi.org/10.3390/antiox13080903
Chicago/Turabian StyleLiu, Kang, Zitong Chen, Lishan Liu, Ting Li, Changying Xing, Feng Han, and Huijuan Mao. 2024. "Causal Effects of Oxidative Stress on Diabetes Mellitus and Microvascular Complications: Insights Integrating Genome-Wide Mendelian Randomization, DNA Methylation, and Proteome" Antioxidants 13, no. 8: 903. https://doi.org/10.3390/antiox13080903