Article

5-Fluorouracil in Combination with Calcium Carbonate Nanoparticles Loaded with Antioxidant Thymoquinone against Colon Cancer: Synergistically Therapeutic Potential and Underlying Molecular Mechanism

1
Natural Medicines and Products Research Laboratory, Institute of Bioscience, Universiti Putra Malaysia, Serdang 43400, Selangor, Malaysia
2
Department of Veterinary Preclinical Science, Faculty of Veterinary Medicine, Universiti Putra Malaysia, Serdang 43400, Selangor, Malaysia
*
Author to whom correspondence should be addressed.
Antioxidants 2024, 13(9), 1030; https://doi.org/10.3390/antiox13091030
Submission received: 15 July 2024 / Revised: 16 August 2024 / Accepted: 23 August 2024 / Published: 25 August 2024

Abstract

:
Colon cancer is the third most common cancer worldwide, with high mortality. Adverse side effects and chemoresistance of the first-line chemotherapy 5-fluorouracil (5-FU) have promoted the widespread use of combination therapies. Thymoquinone (TQ) is a natural compound with potent antioxidant activity. Loading antioxidants into nano delivery systems has been a major advance in enhancing their bioavailability to improve clinical application. Hence, this study aimed to prepare the optimal TQ-loaded calcium carbonate nanoparticles (TQ-CaCO3 NPs) and investigate their therapeutic potential and underlying molecular mechanisms of TQ-CaCO3 NPs in combination with 5-FU against colon cancer. Firstly, we developed purely aragonite CaCO3 NPs with a facile mechanical ball-milling method. The pH-sensitive and biocompatible TQ-CaCO3 NPs with sustained release properties were prepared using the optimal synthesized method (a high-speed homogenizer). The in vitro study revealed that the combination of TQ-CaCO3 NPs (15 μM) and 5-FU (7.5 μM) inhibited CT26 cell proliferation and migration, induced cell apoptosis and cell cycle arrest in the G0/G1 phase, and suppressed the CT26 spheroid growth, exhibiting a synergistic effect. Finally, network pharmacology and molecular docking results indicated the potential targets and crucial signaling pathways of TQ-CaCO3 NPs in combination with 5-FU against colon cancer. Therefore, TQ-CaCO3 NPs combined with 5-FU could enhance the anti-colon cancer effects of 5-FU with broader therapeutic targets, warranting further application for colon cancer treatment.

Graphical Abstract

1. Introduction

According to the latest global cancer statistics in the GLOBOCAN database, colon cancer remains one of the major causes of morbidity and mortality worldwide, which is largely attributed to a relatively higher intake of animal-source foods and an increasingly sedentary lifestyle [1]. Given a constant incidence rate, the expanding and aging population will lead to a significant rise in cases of colon cancer, imposing a substantial burden on society. 5-Fluorouracil (5-FU) is one of the commonly used chemotherapy drugs in the treatment of colon cancer. However, insufficient accumulation of 5-FU in tumors due to non-specificity and a low plasma half-life, as well as limited response rates (10–15%), results in high-dosage uses of 5-FU, thereby leading to severe toxic side effects such as nausea, diarrhea, fever, myocardial ischemia, and neutropenia [2,3]. Therefore, there is an urgent need to explore new chemotherapy synergistic drugs, reducing the dose of chemotherapy drugs or shortening the chemotherapy cycle while maintaining the effects of chemotherapy, to improve the life quality of patients and minimize toxic side effects.
Thymoquinone (TQ), the primary active ingredient of the natural product Nigella sativa seeds, is a promising natural antioxidant. It acts by scavenging free radicals, thereby reducing oxidative stress. TQ enhances the activity of antioxidant enzymes such as superoxide dismutase, catalase, and glutathione peroxidase, which protect cells from oxidative damage [4]. Additionally, TQ inhibits lipid peroxidation, a process that damages cell membranes and leads to cell death [5]. It exhibits preventive or therapeutic effects on osteosarcoma, colon cancer, and gastric cancer through modulating reactive oxygen species production and cellular proliferation, autophagy, apoptosis, invasion, and metastasis [6,7,8]. Importantly, the combinatorial uses of the antioxidant TQ and chemotherapy drug 5-FU have shown promising anticancer properties in the treatment of triple-negative breast cancer and gastric cancer [9,10]. However, the underlying mechanisms of TQ in combination with 5-FU against cancer have not been comprehensively investigated. Moreover, the high hydrophobic property of TQ contributes to its poor solubility and low bioavailability, leading to limited therapeutic effects [11,12]. To improve the anticancer efficacy of TQ while reducing toxic side effects, various nanocarriers have been applied to deliver it to target cancerous cells. For example, PEGylated-TQ nanoparticles and TQ-loaded poly lactic-co-glycolic acid nanoparticles were synthesized for breast cancer and malignant melanoma treatment, respectively [13,14].
The ideal anti-cancer drug delivery system should have the ability of favorable sustained release and pronounced biocompatibility with simple and economical synthesis methods [15,16]. Thus, it can deliver the drugs to target sites to enhance the anti-cancer efficacy of drugs and reduce their side effects, with no or low toxicity to normal tissues and cells. Calcium carbonate has been approved for clinical use by the U.S. Food and Drug Administration (FDA). Calcium carbonate nanoparticles have been widely studied as nanocarriers of drugs against cancer due to their excellent biocompatibility, pH responsiveness, and biodegradability. As reported, calcium carbonate nanoparticles showed safety on the normal breast cell line MCF10A, fibroblasts NIH3T3, normal tissues in C57BL/6 mice, as well as hematological and biochemical levels in Kunming mice, and satisfactory blood compatibility [17,18,19,20]. Moreover, calcium carbonate nanoparticles exhibited remarkable pH-controlled drug release, with lower release at pH 7.4 in the blood and healthy tissue environment but more rapid release in the acidic tumor environment [21,22,23,24]. Meanwhile, calcium carbonate nanoparticles can decompose into Ca2+ and CO2 under acidic conditions, facilitating tumor-targeted delivery [25]. Cockle shells, abundant in coastal areas, are natural sources of calcium carbonate that is low-cost and easily available. Moreover, cockle shells consist of good-quality calcium carbonate in the aragonite polymorph form, of which aragonite is a stable phase of calcium carbonate [26,27]. Furthermore, compared with down-top methods such as precipitation, emulsion, and polymerization, mechanical ball milling (top-down approach) can synthesize large-scale cockle shell-derived calcium carbonate nanoparticles by a simple operation while maintaining their unique features [28,29].
Herein, this study used a mechanical ball-milling approach to develop cockle shell-derived aragonite calcium carbonate nanoparticles (CaCO3 NPs) and synthesized TQ-loaded CaCO3 NPs (TQ-CaCO3 NPs) using the optimal formulation. Characterization of nanoparticles was performed to examine the potential of CaCO3 NPs for antioxidant TQ delivery. The combinatorial effects of TQ-CaCO3 NPs and 5-FU were then assessed in colon cancer in vitro models. Furthermore, the underlying therapeutic mechanisms of the combination were investigated by using network pharmacology and molecular docking. This study may present new insights into the combinatorial therapy for colon cancer treatment, with potential implications for future applications.

2. Materials and Methods

2.1. Materials

Cockle shells were sourced from the local market in Serdang, Malaysia. We also used dodecyl dimethyl betaine (BS-12, Jindun Industrial, Shanghai, China), thymoquinone (TQ, Molekula, Darlington, UK), and deionized water with a resistance of 18.2 MΩ/cm from an ELGA LabWater PURELAB flex3 water purification system (Type I) (ELGA, High Wycombe, UK). Brine shrimp (Artemia salina) was purchased from local pet shop in Kuala Lumpur, Malaysia; NIH3T3 embryonic fibroblast cell line and CT26 colon cancer cell line were sourced from the American Type Culture Collection (ATCC, Manassas, VA, USA); we also used RPMI-1640 with L-glutamine (Cytiva, Freiburg, Germany), fetal bovine serum (FBS, Cytiva, Freiburg, Germany), penicillin–streptomycin (Elabscience, Wuhan, China), trypsin-EDTA (1×) (Cytiva, Freiburg, Germany), 3-(4,5-dimethylthiazol-2-yl)-2,5-diphenyltetrazolium bromide) (MTT, Solarbio, Beijing, China), dimethylsulfoxide (DMSO, ChemAR, Kielce, Poland), 5-fluorouracil (5-FU, Molekula, Darlington, UK), crystal violet (Solarbio, Beijing, China), acridine orange (AO, Sigma-Aldrich, St. Louis, MO, USA), ribonuclease A (RNase A) and propidium iodide (PI) (Nacalai Tesque, Kyoto, Japan), and Annexin V-FITC apoptosis kit (BD Bioscience, Fremont, CA, USA). All other reagents were of analytical grade.

2.2. Preparation of CaCO3 NPs from Cockle Shells

The initial step was the preparation of micro-sized calcium carbonate from cockle shells. Briefly, cockle shells were boiled for 30 min in a steel container and thoroughly washed to remove stains on the shells. Upon drying in an oven (FD 115, Fisher Scientific, Limburg, Germany) at 50 °C, the shells were finely ground and then sieved using a stainless-steel laboratory test sieve (Endicott Ltd., London, UK) with an aperture size of 75 μm to obtain micro-sized calcium carbonate powder.
For the preparation of CaCO3 NPs, 5 g of micro-sized calcium carbonate powder was added into 50 mL of deionized water in a 250 mL flat-bottom flask. The mixture was stirred with a magnetic stirrer bar at 1000 rpm for 30 min at room temperature using a magnetic stirring machine (WiseStir® Systematic Multi-Hotplate Stirrer, Daihan Scientific®, Wonju, Republic of Korea), followed by adding 1.5 mL of BS-12 and stirring at 1000 rpm for 2 h at room temperature. The obtained samples were then centrifuged (Beckman Coulter, CA, USA) three times to remove BS-12 and dried in an oven at 50 °C for 5 d. The dried samples were placed in a glass cylindrical jar containing ceramic balls and rolled on a programmable ball miller (BML-6″, Daihan Scientific®, Republic of Korea) at 200 rpm for 500 h to obtain the final CaCO3 NPs.

2.3. Synthesis and Optimization of TQ-CaCO3 NPs

TQ-CaCO3 NPs were synthesized using two methods: a shaking incubator and a high-speed homogenizer. Briefly, different weight ratios of TQ to CaCO3 NPs (1:2, 1:4, 1:6, 1:8, 1:10, 1:15, and 1:20 w/w) were prepared. For the synthesis method using a shaking incubator, the mixtures (12 mg of CaCO3 NPs and varying amounts of TQ in 1.2 mL of ethanol) were continuously shaken at 200 rpm overnight in the dark at room temperature in the shaking incubator (LSI 3016R, Daihan Labtech, Wonju, Republic of Korea). For the synthesis method using a high-speed homogenizer (IKA-T25 digital Ultra-Turrax, Staufen, Germany), the mixtures (150 mg of CaCO3 NPs and varying amounts of TQ in 15 mL of ethanol) were homogenized at the time and speed-determined via single-factor experiments. The single-factor experimental design is shown in Supplementary Table S1. Finally, TQ-CaCO3 NPs were collected by centrifuging, washing, and drying and kept at room temperature for further use.
The supernatant of each formulated mixture was collected for compound loading content (LC) and encapsulation efficiency (EE) analyses. The better synthesis method and the best formulation were determined by comparing the results of LC and EE. The amount of free compound in the supernatant was evaluated using an ultraviolet–visible (UV-Vis) spectrophotometer (PerkinElmer Lambda 35, Perkin Elmer, Shelton, CT, USA), where the absorption peak of TQ in ethanol was 252 nm (Supplementary Figure S1). The results of LC and EE were determined by calculating the difference between the total weight of the compound fed and the free compound weight in the supernatant according to the following equations:
LC (%) = (weight of compound fed − weight of free compound)/weight of nanoparticles × 100%,
EE (%) = (weight of compound fed − weight of free compound)/weight of compound fed × 100%.

2.4. Physicochemical Characterization of CaCO3 NPs and TQ-CaCO3 NPs

2.4.1. Electron Microscopy and Zetasizer

The surface morphology of CaCO3 NPs and TQ-CaCO3 NPs was analyzed via field emission scanning electron microscopy (FESEM, NovaTMNanoSEM 230, FEI, Hillsboro, OR, USA) and high-resolution transmission electron microscopy (HRTEM, Hitachi H-7100, Tokyo, Japan). The nanoparticles were suspended in 100% acetone, followed by sonication with high-level ultrasonic power (Power Sonic 505, Seoul, Republic of Korea) for 15 min at room temperature. Subsequently, a drop of the dispersion was placed on a carbon-coated copper grid, and the samples were dried at room temperature before microscopy viewing. The size of nanoparticles in the HRTEM figure was measured using ImageJ 1.51n software. The zeta potential and size of nanoparticles were analyzed using Zetasizer Nano ZS (Malvern Instruments, Worcestershire, UK) at 25 °C. The dried nanoparticles were dispersed in 100% acetone for hydrodynamic size analysis and in deionized water (pH 7.4) for zeta potential analysis, where the Henry model was employed for zeta potential determination.

2.4.2. Energy-Dispersive X-ray Spectroscopy, X-ray Diffractometer, and Fourier Transform Infrared Spectroscopy

Elemental compositions of CaCO3 NPs and TQ-CaCO3 NPs were determined using energy-dispersive X-ray spectroscopy (EDX, X-mas EDS, Oxford Instruments, Abingdon, UK), which is conjugated with FESEM. The crystalline nature and purity of CaCO3 NPs and TQ-CaCO3 NPs were determined using a Shimadzu X-ray diffraction (XRD)-6000 powder diffractometer on a continuous scanning process with Cu Kα (λ = 1.5406 Å) as the X-ray source. The obtained XRD data were analyzed using Jade 6 software, and the crystallographic model was created using Vesta 3.5.8 software. Crystallite sizes of CaCO3 NPs and TQ-CaCO3 NPs were obtained using Scherrer’s equation:
D = 0.9λ/B × cosθ,
where D is crystallite size in angstroms, λ is X-ray wavelength (1.5406 Å), B is full-width at half maximum of peak in radian unit, and θ is peak position in radian unit. The chemical properties of CaCO3 NPs and TQ-CaCO3 NPs were determined using Fourier transform infrared spectroscopy (FTIR, Spectrum 100, Perkin Elmer, Shelton, CT, USA) over the range of 4000 to 400 cm−1 at a 2 cm−1 resolution and averaging 64 scans. The obtained FTIR data were analyzed using OMNIC 7.3 software.

2.5. In Vitro Compound Release Study

The compound release study of TQ was monitored in PBS buffer with 1% (v/v) Tween 80 at pH 7.4, 6.5, and 5.0 using the pre-treated dialysis tubing cellulose membrane (Molecular weight cut-off: 14 kDa; Sigma-Aldrich). The dialysis was conducted in a shaking incubator at 37 ± 0.5 °C and 100 rpm. At predetermined time intervals, the release medium was withdrawn and replaced with the same volume of fresh medium. The quantity of TQ released from TQ-CaCO3 NPs was detected by UV-vis spectrophotometry. The compound release data were fitted in different kinetic models, including zero-order, first-order, Higuchi, Hixson–Crowell, and Krosmeyer–Peppas models. The R2 value was used to evaluate the best fit of the data to the kinetic models. The compound release mechanism was analyzed using the n value from the Krosmeyer–Peppas model.

2.6. Biocompatibility Evaluation of CaCO3 NPs and TQ-CaCO3 NPs

2.6.1. Hemocompatibility Analysis

The rat red blood cells (erythrocytes) were collected from plasma by centrifugation at 3000 rpm for hemocompatibility analysis. The erythrocytes were redispersed in the PBS to prepare a 4% solution. The dispersed blood was added to each test sample aliquot at different concentrations (62.5–4000 μg/mL), followed by incubation for 1 h at 37 °C. Thereafter, the test samples were recentrifuged, and the supernatant was analyzed at 540 nm by microplate reader. The PBS solution and deionized water were used as negative (0% hemolysis) and positive control (100% hemolysis), respectively. The hemolysis percentage was calculated using the following equation:
hemolysis (%) = [(Asample − Anegative)/(Apositive − Anegative)] × 100%,
where Asample, Anegative, and Apositive represent the absorbance of the test sample, negative control, and positive control, respectively.

2.6.2. Toxicity Analysis in Brine Shrimp

The toxicity was determined by measuring the survival rate of brine shrimp treated with different concentrations of nanoparticles [30]. Briefly, 34 g of sea salt (without iodine) was dissolved in 1 L of deionized water as the simulated seawater, and 1 g of brine shrimp eggs was put into the salt water. The eggs were then incubated with constant air and a light source (12 h light–dark cycle) at room temperature for 24 h. Once hatching, 10 active nauplii in 1 mL of salt water were transferred to each well of the 24-well plate. Different concentrations (0–1000 μg/mL) of CaCO3 NPs and TQ-CaCO3 NPs were added into the wells containing the nauplii, whereas KMnO4 dissolved in simulated seawater with the same concentrations served as the positive control. The surviving nauplii were observed using light microscopy (LM) and recorded at 12, 24, 36, and 48 h. The brine shrimp survival rate was calculated using the following formula:
survival rate (%) = alive brine shrimp/total brine shrimp × 100%.

2.6.3. Cytotoxicity Analysis

Cytotoxicity of nanoparticles was evaluated in the NIH3T3 embryonic fibroblast cell line. NIH3T3 cells were cultured with different concentrations of CaCO3 NPs (concentrations: 0–1000 μg/mL), TQ (TQ concentrations: 0–60 μM), and TQ-CaCO3 NPs (TQ concentrations: 0–60 μM) for 96 h. After 96 h of incubation, 20 μL of MTT solution (5 mg/mL) was added to each well and incubated at 37 °C (5% CO2 and 95% air) for 4 h. The solution was then removed, and the purple formazan crystals were solubilized in DMSO. The absorbance was measured at 570 nm with reference wavelength of 630 nm using the multimode microplate reader (Synergy H1, BioTek, Winooski, VT, USA). The cell viability was determined with respect to the untreated control. Half-maximum inhibitory concentration (IC50) was calculated by nonlinear regression analysis in GraphPad Prism 8 software.

2.7. In Vitro Cell Experiments of TQ-CaCO3 NPs in Combination with 5-FU

2.7.1. MTT Assay

Colon cancer CT26 cells (5 × 10³ cells/well) were seeded in 96-well plates for 24 h and treated with different concentrations of TQ-CaCO3 NPs, 5-FU, or in combination for 96 h. After treatment, the cells were incubated with MTT (5 mg/mL) reagent for 4 h. The purple formazan crystals formed were solubilized with DMSO, and the absorbance (OD) at 570 nm (630 nm as the reference wavelength) was measured using the multimode microplate reader (Synergy H1, BioTek, USA). The cell viability was determined with respect to the untreated control. IC50 was calculated by nonlinear regression analysis in GraphPad Prism 8 software.

2.7.2. Synergism Analysis

The combination index (CI) was calculated using CompuSyn 1.0 software, as established by Chou and Talalay, where CI > 1 indicates antagonism, CI = 1 indicates additive, and CI < 1 indicates synergism [31].

2.7.3. Colony-Formation Assay

After being cultured in 6-well plates for 48 h, CT26 cells were treated with TQ-CaCO3 NPs, 5-FU, and their combination. After treatment, the cells were allowed to form colonies for 7 days until the colonies were visible. They were then fixed with 100% methanol and stained with 0.5% crystal violet. The cells were photographed using a microscope attached to a digital camera. The number of colonies was calculated using ImageJ software.

2.7.4. AO/PI Staining

Following 96 h of treatment with TQ-CaCO3 NPs and 5-FU either alone or in combination, CT26 cells were washed with PBS and stained with 5 μg/mL AO/PI (1:1) dual stain for 10 min at room temperature. The cells were photographed using an inverted fluorescence microscope (Carl Zeiss Microscopy GmbH, Gottingen, Germany). AO-viable cell density was calculated using ImageJ software according to the presence or absence of non-viable cell staining (PI).

2.7.5. Cell Cycle and Apoptosis Analysis

CT26 cells were cultured in 6-well plates with TQ-CaCO3 NPs and 5-FU either alone or in combination for 96 h. For cell cycle analysis, after being fixed in 70% ethanol overnight at 4 °C, cells were resuspended in PBS and exposed to RNase A solution (10 mg/mL) and PI solution (50 μg/mL) in the dark for 30 min. For apoptosis analysis, cells were resuspended in 1× binding buffer and stained with 5 μL of Annexin V-FITC and 5 μL of PI in the dark for 20 min. Thereafter, cell cycle and apoptosis were measured by a BD FACSCanto II flow cytometer (BD Biosciences, Milpitas, CA, USA) and analyzed using BD FACSDiva 6.1.2 software.

2.7.6. Wound-Healing Assay

CT26 cells were seeded in 6-well plates and scraped with a 200 μL sterile pipette tip when the cells achieved 90% confluence. The scratched cells were then cultured with TQ-CaCO3 NPs and 5-FU either alone or in combination for 48 h. Images were captured using an inverted fluorescence microscope (Carl Zeiss Microscopy GmbH, Gottingen, Germany) after 0, 24, and 48 h. The wound-healing area was measured and analyzed using ImageJ software.

2.7.7. The 3D Spheroid Culture

CT26 cells were seeded in agarose-coated 96-well plates at 2000, 4000, 6000, 8000, 10,000, 15,000, and 20,000 cells/well and incubated for 13 days at 37 °C. Spheroids were observed and imaged using a LM on days 4, 7, 10, and 13. Image J software was used to measure the diameter of spheroids and determine the volume of spheroids.

2.7.8. The 3D Spheroid-Inhibition Assay

CT26 cell seeding density was chosen for obtaining the spheroids with a diameter of 400–500 μM after 4-day incubation. Spheroids were then cultured with TQ-CaCO3 NPs and 5-FU either alone or in combination for 96 h and imaged for a period of 14 days using an LM. The diameter and volume of spheroids were determined using Image J software. The spheroid growth inhibition rate was calculated using the following formula:
growth inhibition rate on the nth day (%) = (1 − Vtn/Vcn) × 100%,
where Vtn represents the spheroid volume of the treatment group on the nth day relative to its average spheroid volume on the 4th day, and Vcn is the average spheroid volume of the control group on the nth day relative to its average volume on the 4th day.

2.8. Network Pharmacology

2.8.1. Target Prediction and Screening of 5-FU and TQ

The molecular structures of 5-FU and TQ were obtained from the PubChem database (https://pubchem.ncbi.nlm.nih.gov/, accessed on 16 February 2024). The biological targets of 5-FU and TQ were retrieved from the TCMSP (https://www.tcmsp-e.com, accessed on 16 February 2024), Swiss Target Prediction (http://www.swisstargetprediction.ch/, accessed on 16 February 2024), Stitch (http://stitch.embl.de/, accessed on 16 February 2024), TargetNet (http://targetnet.scbdd.com/, accessed on 16 February 2024), SuperPred (https://prediction.charite.de/, accessed on 16 February 2024), DrugBank (https://go.drugbank.com/, accessed on 16 February 2024), and SEA (https://sea.bkslab.org/, accessed on 16 February 2024) databases. Drug–target networks were constructed using Gephi 0.10.1 software.

2.8.2. Targets Collection and Screening of Colon Cancer

“Colon cancer” was used as the keyword to retrieve the target genes from DisGeNET (https://www.disgenet.org/search, accessed on 17 February 2024), GeneCards (https://www.genecards.org/, accessed on 17 February 2024), OMIM (https://www.omim.org/, accessed on 17 February 2024), PharmGKB (https://www.pharmgkb.org/, accessed on 17 February 2024), and TTD (https://db.idrblab.net/ttd/, accessed on 17 February 2024) databases. Meanwhile, with “colon cancer” as the keyword and “Homo sapiens” as the target organism, the GSE74602 dataset was selected from GEO (https://www.ncbi.nlm.nih.gov/geo/, accessed on 18 February 2024) database, including 30 paired normal and tumor samples. The “limma” package in R 4.2.2 software was used to screen the differential genes with p value < 0.05 and |logFC| > 1. The volcano map and heat map were drawn using R 4.2.2 software for visualization of differential genes. After consolidating the target genes and eliminating the duplicate values, the final targets of colon cancer were obtained.

2.8.3. PPI, GO, and KEGG Analysis

The potential targets of 5-FU in combination with TQ against colon cancer were identified by intersecting the target genes of 5-FU, TQ, and colon cancer using Origin 9.8.0.200 software, and a Venn diagram was drawn for illustration. STRING database (https://string-db.org/, accessed on 19 February 2024) was used to construct the PPI network of the drug–colon cancer intersection targets. Gephi 0.10.1 software was applied to perform data analysis and visualize the PPI network. Based on the degree values, the node size and color of targets were adjusted, and the hub genes were screened. GO functional annotation and KEGG pathway analysis of the drug–colon cancer targets after STRING processing was conducted by using the “clusterProfiler”, “org.Hs.eg.db”, and “ggplot2” packages in R 4.2.2 software. The top 10 GO terms with the smallest p-value were selected and are shown in a bar graph and chord diagram, and the top 30 KEGG pathways with the smallest p-value are shown in a bubble graph. Simultaneously, the top 5 pathways with the smallest p-value and colorectal cancer pathway obtained by enrichment analysis of KEGG and their corresponding targets were imported into Gephi 0.10.1 software to draw the key pathway–target network diagram.

2.9. Molecule Docking

The 3D structures of 5-FU and TQ were downloaded from the PubChem database (https://pubchem.ncbi.nlm.nih.gov/, accessed on 22 February 2024), and the protein structures of the target genes were obtained from the PDB database (https://www.rcsb.org/, accessed on 22 February 2024). Discovery Studio Visualizer v19.1.0.18287 software was used to remove water molecules of proteins, predict the binding sites of protein pockets, and delete the original ligands. The processed proteins were imported into AutoDock Tools 1.5.6 software to add polar hydrogen and charge. The molecular docking was executed using AutoDock Vina 1.2.5 software. Subsequently, the results of molecular docking were visualized in Discovery Studio Visualizer v19.1.0.18287 software.

2.10. Statistical Analysis

Data analysis was performed with at least triplicates using the GraphPad Prism 8 and Origin 9.8.0.200 software. Statistical analysis involved one-way ANOVA followed by Turkey’s post-test for multiple comparisons or Student’s t-test for single comparison and two-way ANOVA followed by Dunnett’s post-test. p value < 0.05 (p < 0.05) was considered statistically significant. Unless otherwise stated, the results were expressed as mean ± standard deviation.

3. Results

3.1. Synthesis of the Optimal TQ-CaCO3 NPs

The synthesis concept of CaCO3 NPs and TQ-CaCO3 NPs is illustrated in Figure 1A. The most critical parameters for loading the compound into nanoparticles are the weight percentage of the compound in the delivery system (LC) and the percentage of the encapsulated compound to its initial amount for loading (EE). Optimizing EE can reduce compound loss by minimizing the amount of left compound in the loading process, and optimal LC ensures the dose of the encapsulated compound before administration and minimizes the amount of nanocarrier, thereby reducing the potential side effects of nanocarrier [32]. Firstly, TQ loading at varying weight ratios (weight of TQ to weight of CaCO3 NPs) was performed using the shaking incubator to obtain the best formulation. Figure 1B showed that the highest EE in the 1:4 group (19.31%) had no significant difference from the result of the 1:6 group (17.88%). However, the LC in the 1:4 group was significantly superior to that in the 1:6 group (p < 0.05). Therefore, when the shaking incubator was used for TQ loading, the 1:4 weight ratio of TQ to CaCO3 NPs was considered the optimal formulation.
To increase the interactions between the compounds and nanoparticles for better loading results, a high-speed homogenizer with strong thrust forces is considered a potentially effective method for compound loading. Two factors will affect the loading results when the high-speed homogenizer is utilized for compound loading: speed and time [33]. Thus, the single-factor experiments were performed to determine the optimal speed and time for TQ loading. As the results illustrate in Figure 1C,D, loading with 24,000 rpm and 3 min achieved the highest LC and EE of TQ-CaCO3 NPs in the single-factor experiments, respectively, employed as the target speed and time for TQ loading using the high-speed homogenizer. Subsequently, TQ loading at varying weight ratios of TQ to CaCO3 NPs with the target speed and time was tested for the best formulation. Although it is displayed in Figure 1E that loading at a 1:4 weight ratio reached the highest EE of TQ-CaCO3 NPs with 8.82% of LC, the LC of loading at a 1:2 weight ratio (13.68%) was significantly superior to that of other groups (p < 0.05). In addition, loading at a 1:2 weight ratio still obtained high EE (27.36%). Therefore, the 1:2 weight ratio of TQ to CaCO3 NPs was deemed the optimal formulation. Moreover, the optimal outcomes achieved using the high-speed homogenizer for TQ loading surpassed those attained using the shaking incubator (p < 0.05), as shown in Figure 1F. Overall, the high-speed homogenizer was chosen as the final synthesis method for TQ-CaCO3 NPs, where the 1:2 weight ratio of TQ to CaCO3 NPs at a speed of 24,000 rpm for 3 min was employed for loading TQ.

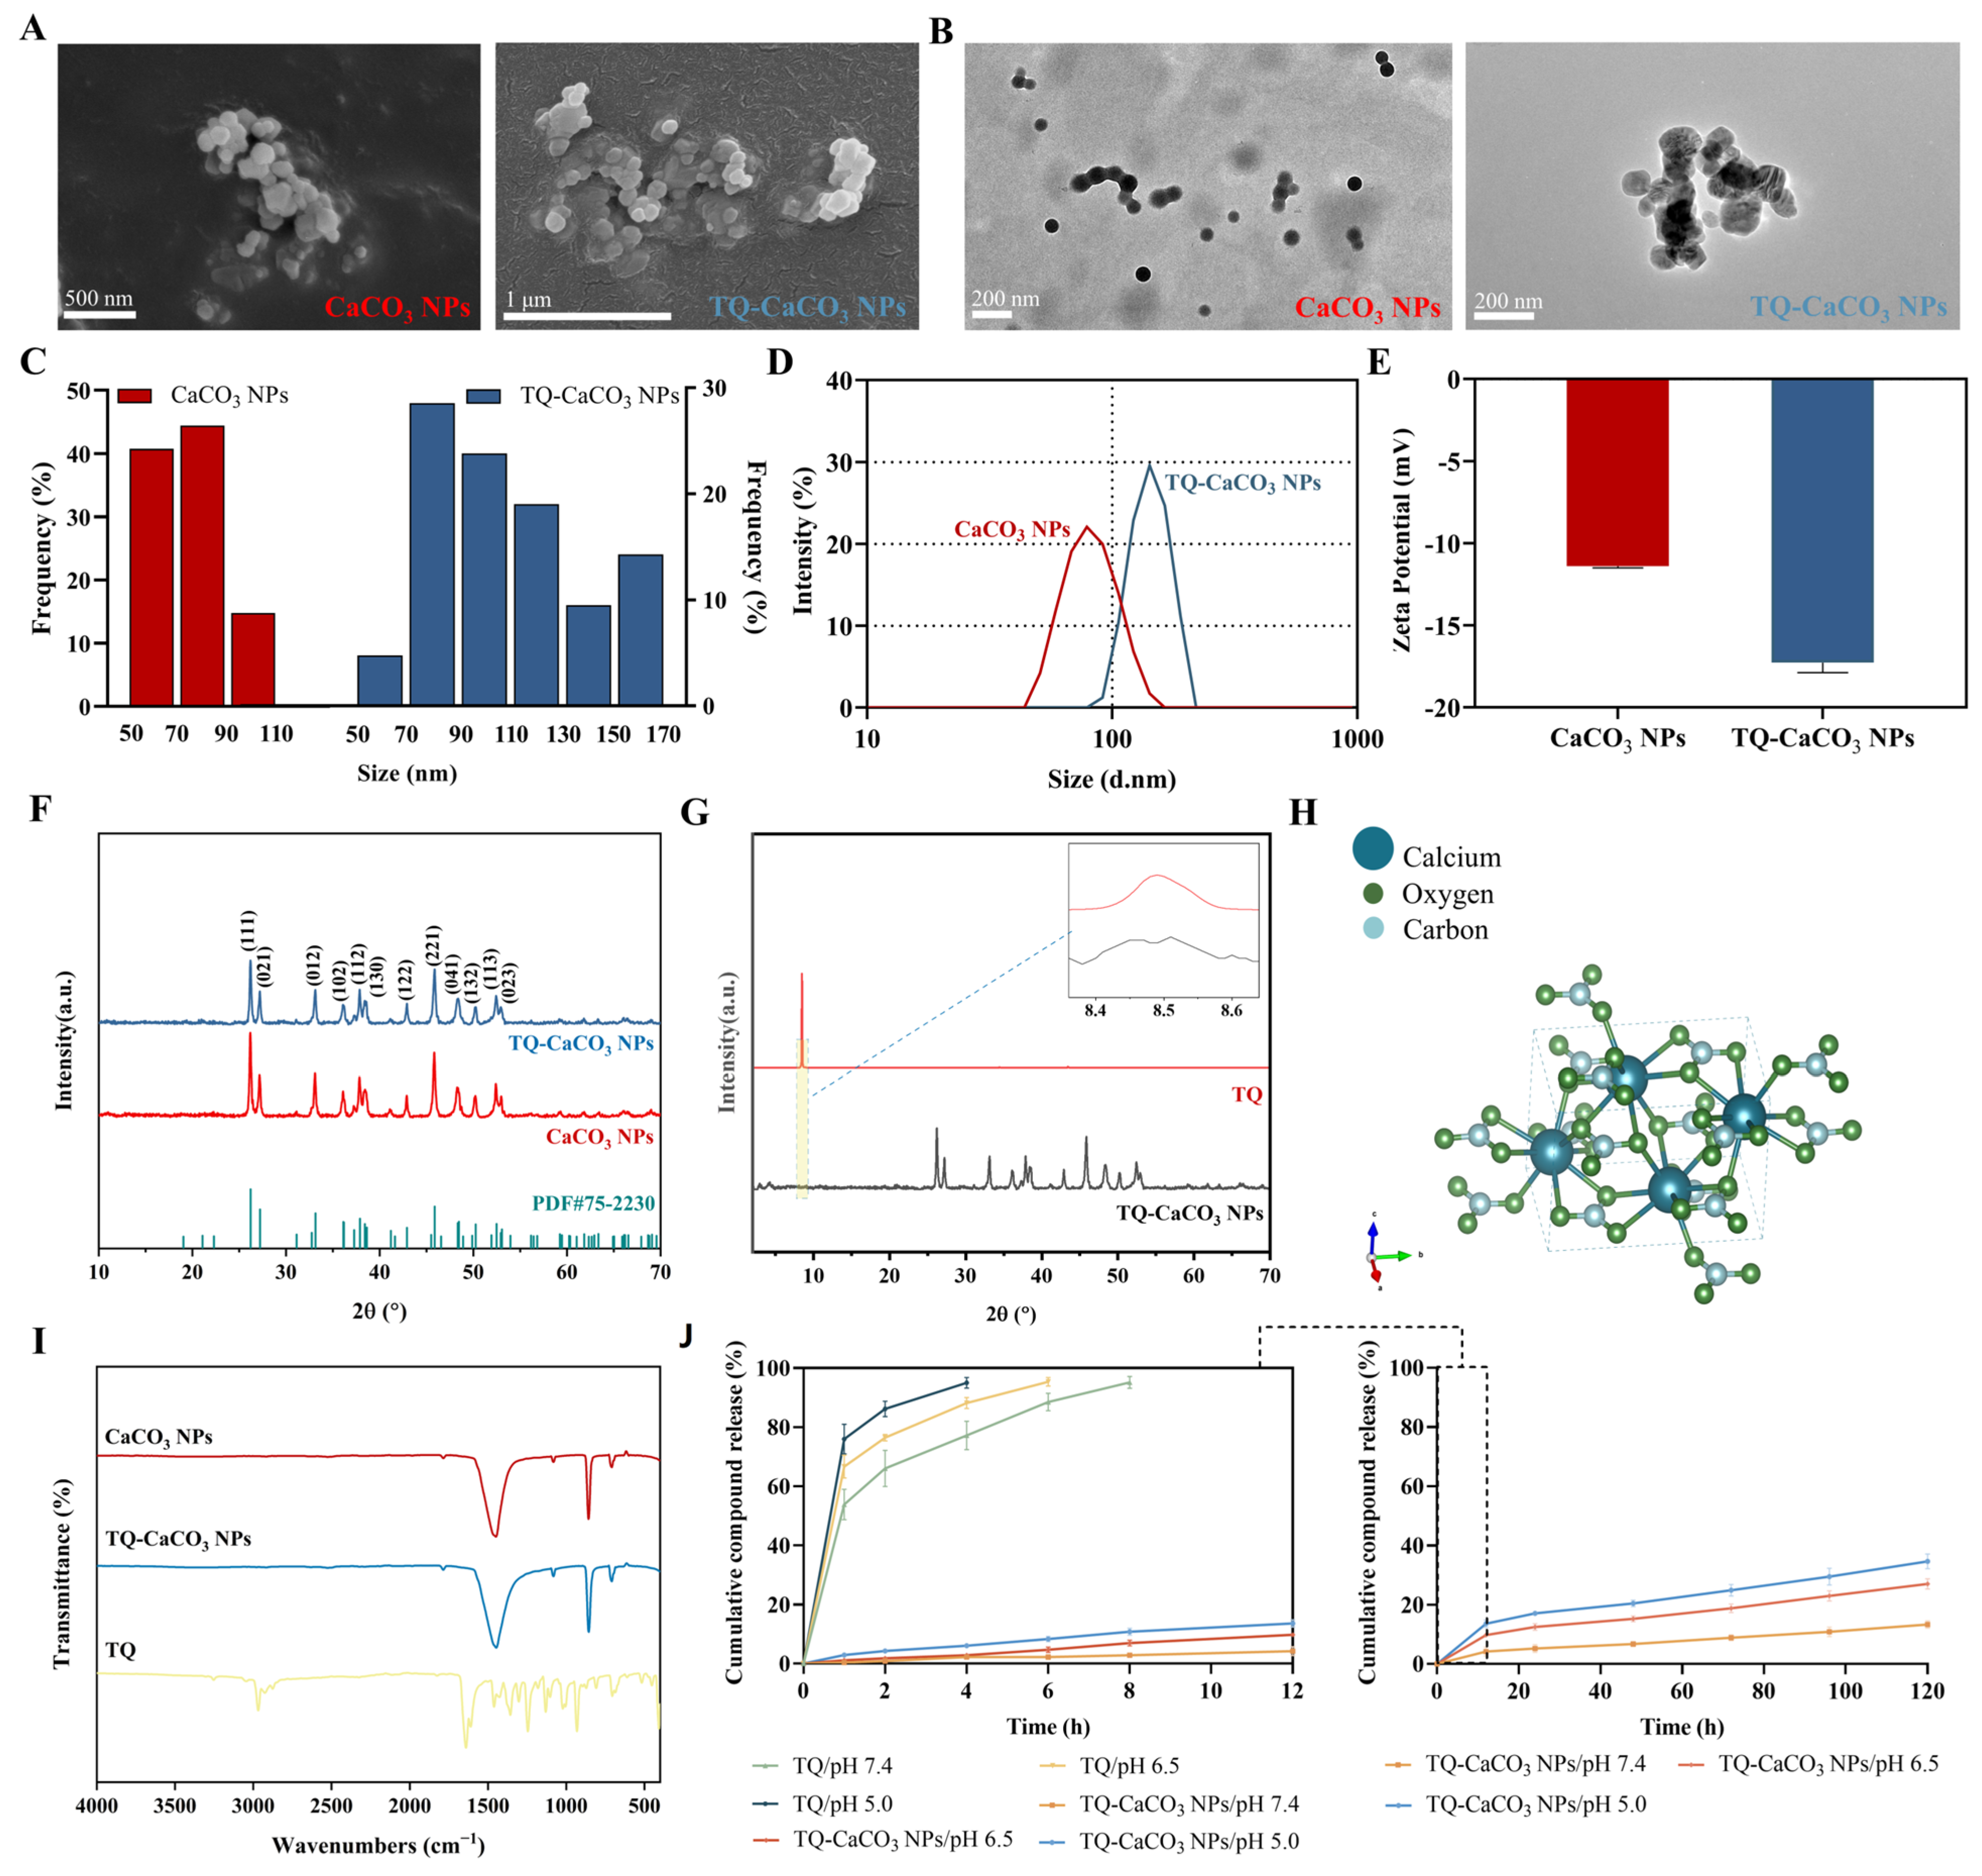
3.2. Characterization of CaCO3 NPs and TQ-CaCO3 NPs

Both FESEM and HRTEM images of CaCO3 NPs and TQ-CaCO3 NPs display homogeneous spherical or nearly spherical porous nanoparticles (Figure 2A,B). Meanwhile, HRTEM images show an average nanoparticle size of 77 nm before compound loading and 110 nm after loading (Figure 2C). Additionally, the hydrodynamic size distribution and zeta potential of CaCO3 NPs and TQ-CaCO3 NPs are illustrated in Figure 2D,E, respectively. Dynamic light scattering revealed consistent results in the hydrodynamic diameter of CaCO3 NPs and TQ-CaCO3 NPs with the results in HRTEM, where the average hydrodynamic diameter of CaCO3 NPs and TQ-CaCO3 NPs was 86 and 139 nm, respectively, with a polydispersity index of less than 0.5. The zeta potential of CaCO3 NPs was −11.4 mV, determined by electrophoretic light scattering, whereas TQ-CaCO3 NPs had a slightly higher zeta potential of −17.3 mV. Moreover, the elemental compositions of synthesized CaCO3 NPs and TQ-CaCO3 NPs were determined using EDX analysis (Supplementary Figures S2–S4). As displayed in Table 1, CaCO3 NPs contained 16.06% carbon, 62.42% oxygen, 21.27% calcium, and 0.25% sodium, suggesting that calcium carbonate derived from the cockle shell was almost 100% pure. Based on the conventional stoichiometrically derived ratio of CaCO3, the Ca/C/O was almost in a molar ratio of 1:1:3. The EDX results of TQ-CaCO3 NPs and TQ suggested that the change in elemental percentages of Ca/C/O between CaCO3 NPs and TQ-CaCO3 NPs may be due to the loading of the compound.
XRD was used to analyze the crystalline phase of CaCO3 NPs before and after TQ loading. The CaCO3 NP diffraction peaks (crystal planes) observed, i.e., 26.22° (111), 27.23° (021), 33.15° (012), 36.12° (102), 37.90° (112), 38.42° (130), 42.92° (122), 45.87° (221), 48.33° (041), 50.25° (132), 52.48° (113), and 53.05° (023), confirmed the aragonite structure of CaCO3 NPs when comparing them with the reference diffraction peaks (PDF#75-2230) of aragonite calcium carbonate nanoparticles from the Inorganic Crystal Structure Database (Figure 2F). The similarity in the diffraction peaks of CaCO3 NPs and TQ-CaCO3 NPs indicated that the aragonite structure of CaCO3 NPs remained unchanged even after loading with TQ. In addition, the similar diffraction peak between TQ and TQ-CaCO3 NPs shown in Figure 2G suggests that TQ has been loaded. Moreover, the lattice parameters of CaCO3 NPs and TQ-CaCO3 NPs are displayed in Table 2. Notably, the crystallite size of CaCO3 NPs and TQ-CaCO3 NPs was 827 and 848 Å, respectively, consistent with the results in HRTEM and Zetasizer, and the crystallinity of both nanoparticles was more than 95%. The changes in lattice parameters between CaCO3 NPs and TQ-CaCO3 NPs further demonstrated that TQ has been loaded. Based on the obtained lattice parameters, the orthorhombic (Pmcn space group) crystalline morphology of aragonite CaCO3 NPs was created and illustrated in Figure 2H.
FTIR was used to detect the functional groups of nanoparticles and analyze their chemical properties. The FTIR spectra of CaCO3 NPs, TQ-CaCO3 NPs, and TQ are shown in Figure 2I, and the peak vibration assignments of nanoparticles are presented in Table 3. CaCO3 NPs exhibited characteristic peaks at 707.41, 854.8, and 1082.21 cm−1, corresponding to in-plane C-O bending vibration, out-of-plane C-O bending vibration, and symmetric C-O stretching of CO32- in aragonite polymorph, respectively. This suggests that CaCO3 NPs were an aragonite crystal, in agreement with the result of XRD analysis. The prominent peak for the asymmetric C-O stretching of CO32- appeared at 1450.53 cm−1, and the weak peak at 1783.63 cm−1 was attributed to symmetric C-O stretching and in-plane C-O bending vibration of CO32-. It is interesting to know that TQ showed its major characteristic peaks for CH (sp3), CH (sp2), C꞊C, and trans C꞊C groups at 2962.28, 3256.94, 1639.50, and 931.67 cm−1, respectively. The FTIR absorption peaks of TQ-CaCO3 NPs were similar to those of aragonite CaCO3 NPs, implying that the aragonite polymorphism did not change after TQ loading. However, the broader absorbance band in TQ-CaCO3 NPs around 1447.33 cm−1, compared to that in CaCO3 NPs, and the shift of peaks, such as from 1450.53 cm−1 in CaCO3 NPs to 1447.33 cm−1 in TQ-CaCO3 NPs, can be attributed to the addition of TQ to CaCO3 NPs.
The compound-release study was investigated at a pH of 7.4, 6.5, and 5.0, which modeled the blood and healthy tissue environment, the weakly acidic extracellular environment in malignant tumors, and the more acidic intracellular environment in malignant tumors, respectively [34]. Figure 2J displays the TQ release profiles at pH 7.4, 6.5, and 5.0 for 120 h. As evident in the figure, the release of TQ from TQ-CaCO3 NPs was pH-dependent. The accumulative TQ release amounts of TQ-CaCO3 NPs at pH 7.4 were 5.27% within 24 h and 13.30% within 120 h. The release rate at pH 6.5 was higher than that at pH 7.4, with the accumulative release amounts 12.50% within 24 h and 27.01% within 120 h. At pH 5.0, the TQ release rate was accelerated more obviously. TQ-CaCO3 NPs released 17.94% of TQ within 24 h and 33.77% within 120 h at pH 5.0. These results suggested the pH-sensitive property of CaCO3 NPs and its potent benefits in increasing the intracellular accumulation of TQ in tumors, which may strengthen the anticancer effects of TQ. The compound-release pattern of TQ-CaCO3 NPs was analyzed using zero-order, first-order, Higuchi, Hixon–Crowell, and Korsmeyer–Peppas models. It can be observed in Table 4 that the release curves of TQ-CaCO3 NPs at pHs of 7.4 and 5.0 exhibited the best fit with the Korsmeyer–Peppas model (R2 = 0.98578 at a pH of 7.4 and R2 = 0.98765 at a pH of 5.0). Higuchi was the best-fit model for TQ-CaCO3 NPs release at a pH of 6.5 (R2 = 0.98363), indicating the concentration of TQ released from TQ-CaCO3 NPs increased with the square root of time [35]. However, the high R2 (0.98266) suggested that the compound-release pattern of TQ-CaCO3 NPs at a pH of 6.5 also followed the Korsmeyer–Peppas model. Furthermore, TQ-CaCO3 NPs released TQ following the non-Fickian transport mechanism (0.45 < n < 0.89) [36]. Therefore, the hydrophobic compound TQ was released from TQ-CaCO3 NPs with both diffusion and erosion-controlled principals.

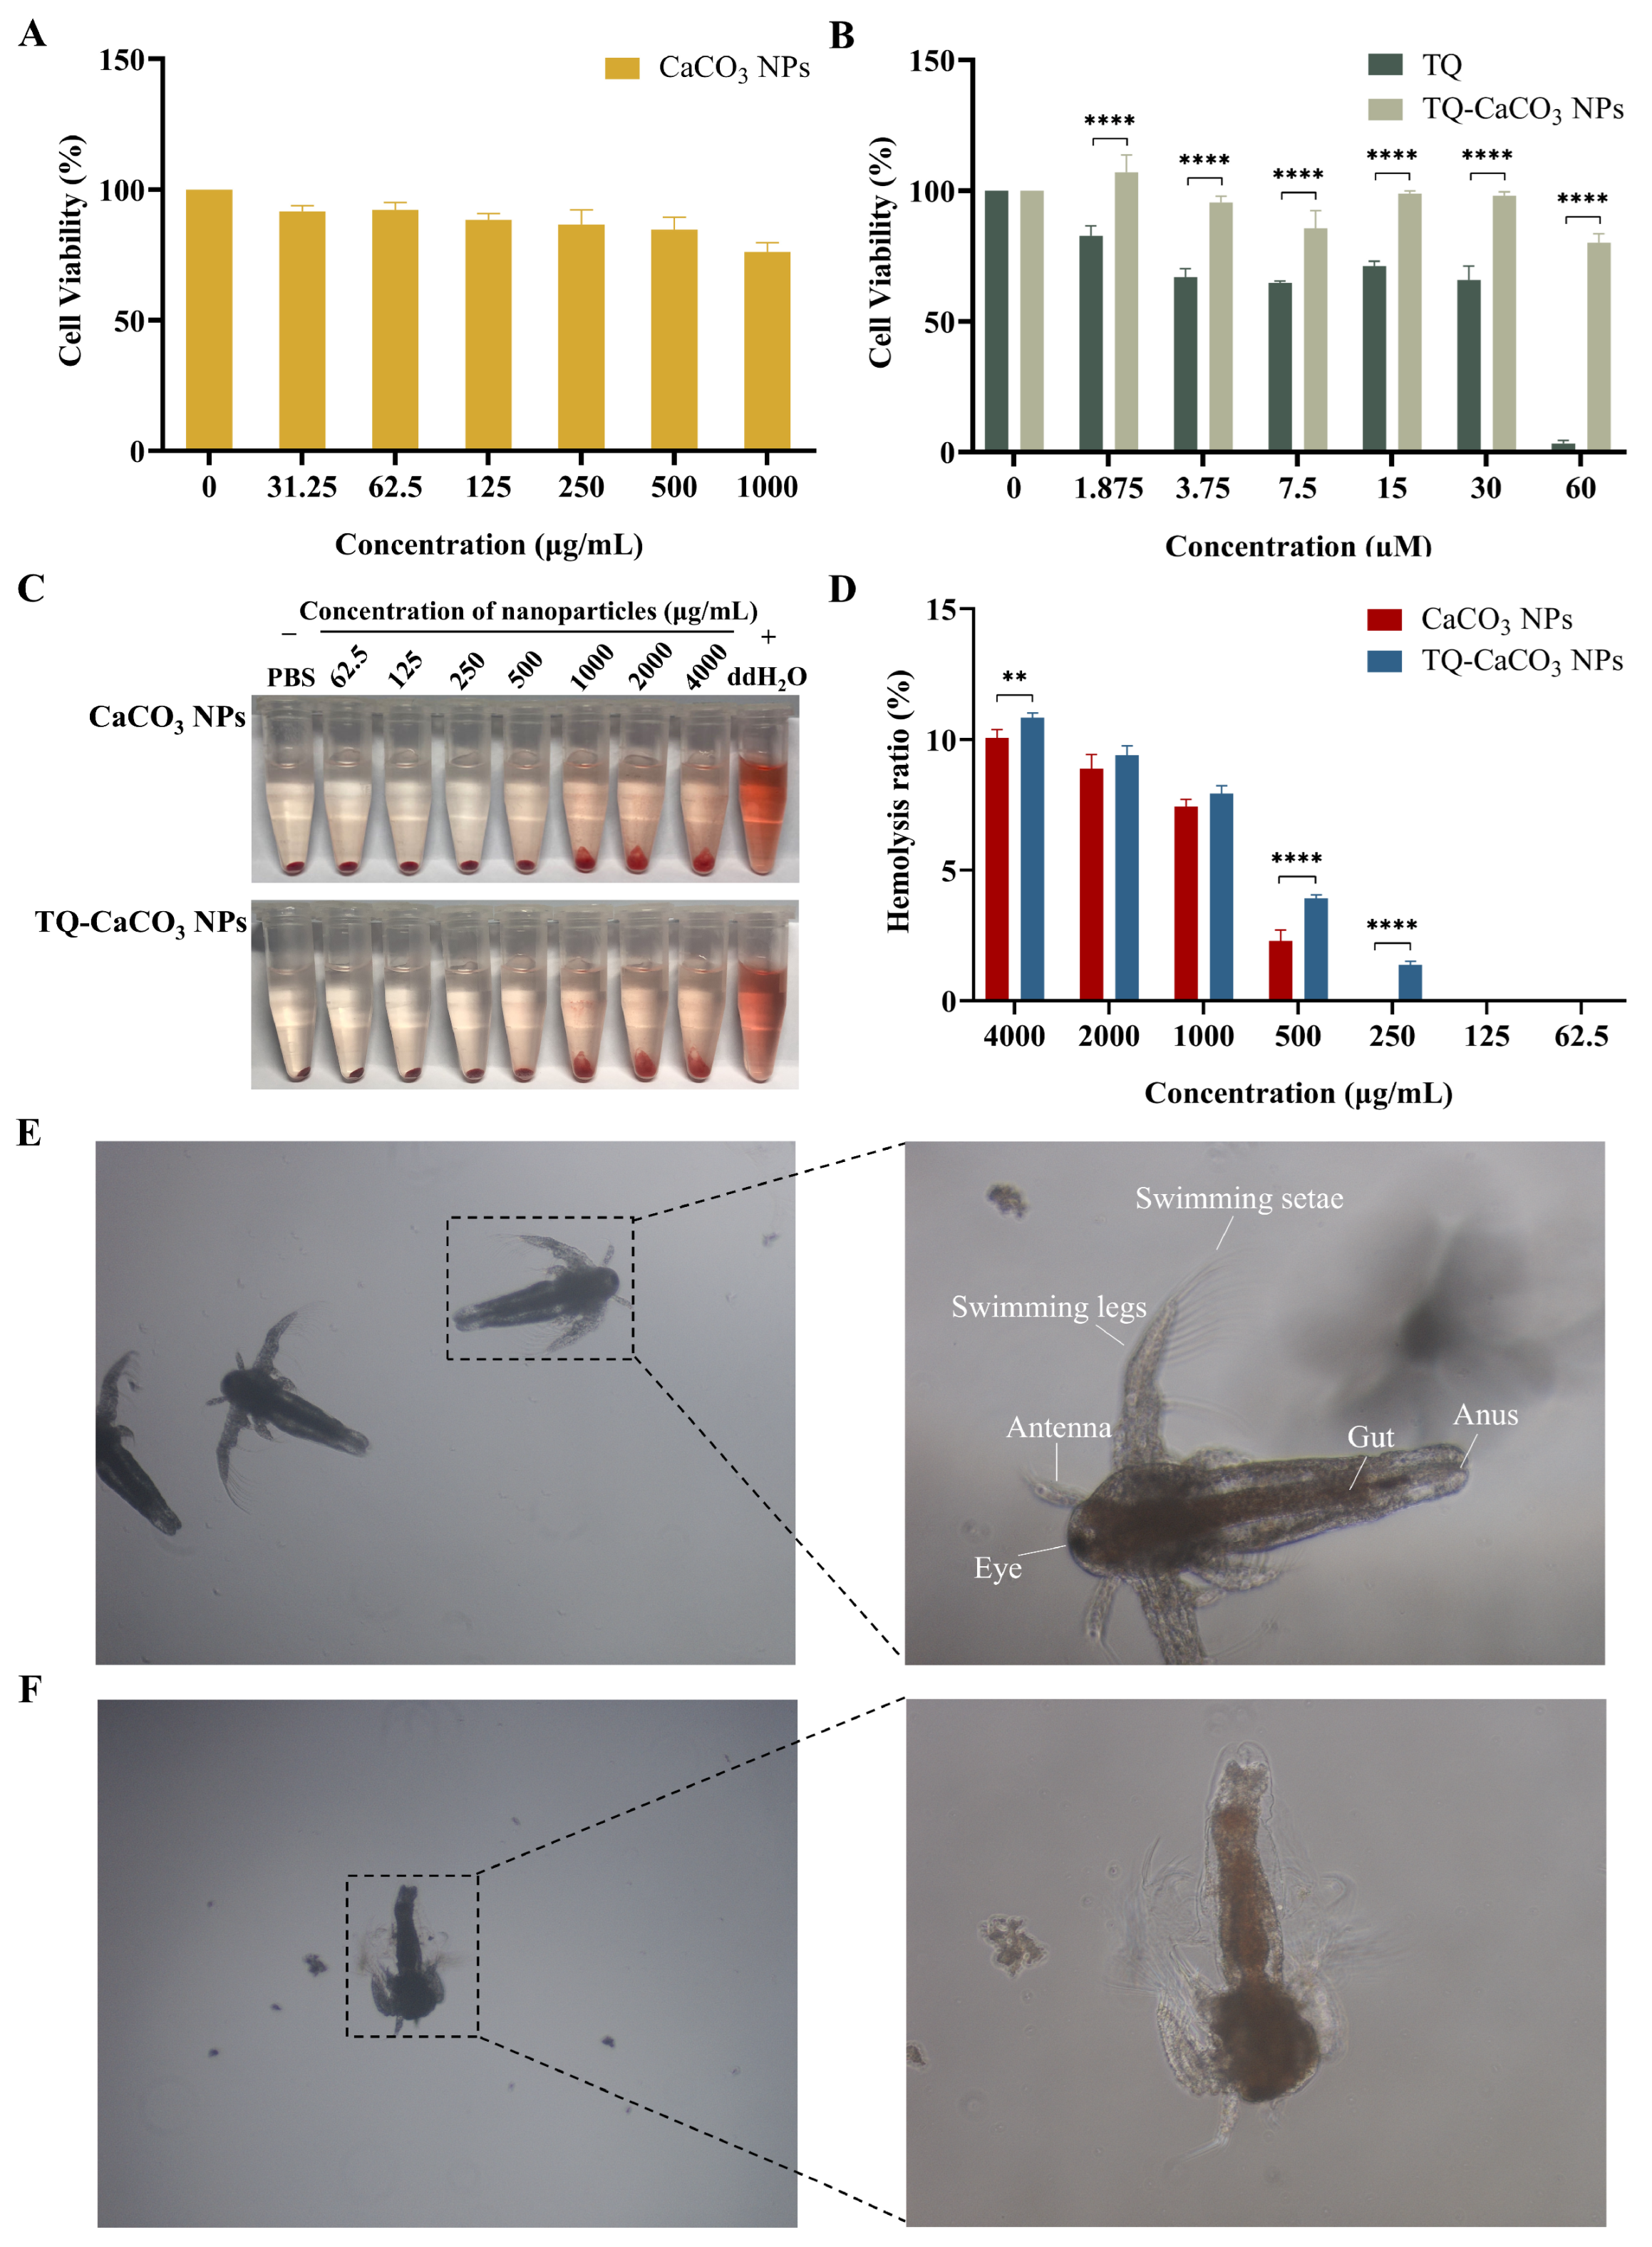
3.3. CaCO3 NPs and TQ-CaCO3 NPs Exhibit Favorable Biocompatibility

Although calcium carbonate nanoparticles are well-known for excellent biocompatibility and calcium carbonate has been approved by the FDA for clinical application, it is still necessary to evaluate the biocompatibility (cytotoxicity, toxicity, and blood compatibility) of nanoparticles due to the potential problems in the process of nanoparticle preparation. To investigate the cytotoxicity of nanoparticles, the normal embryonic fibroblast cell line NIH3T3 was employed as the cell model, and an extended incubation time of 96 h was chosen. According to the standard ISO 10993-5, non-toxicity is considered the reduction of cell viability by no more than 30% [37]. As shown in Figure 3A, blank CaCO3 NPs exhibited cell viability of more than 75% within the concentration range of 0–1000 μg/mL after 96 h, suggesting they are non-toxic to NIH3T3 cells. Figure 3B reveals that TQ was toxic to NIH3T3 cells, with an IC50 value of 21.08 ± 2.49 μM, but TQ-CaCO3 NPs were non-toxic to NIH3T3 cells even at the high TQ concentration of 60 μM. This may be attributed to the prolonged release of TQ from CaCO3 NPs under the healthy cell environment of pH 7.4. Therefore, CaCO3 NP loading of TQ can reduce the toxicity of TQ.
The blood compatibility of CaCO3 NPs and TQ-CaCO3 NPs was evaluated by the in vitro erythrocyte-induced hemolysis test. This test assessed the release percentage of hemoglobin when nanoparticles were directly in contact with erythrocyte surfaces and caused cell lysis, regarded as the preliminary investigation for the in vivo toxicity evaluation of nanoparticles [38]. During this test, isotonic PBS solution was used as the negative control, and the positive control was deionized water that can induce osmotic shock, leading to hemolysis [39]. Figure 3C displays the results of the hemolysis test, revealing that the hemolysis of CaCO3 NPs and TQ-CaCO3 NPs was concentration-dependent. At the same time, complete lysis (the absence of precipitation) was observed in deionized water-treated erythrocytes. Generally, more than 25% of the hemolysis ratio is considered hemolytic, and less than 10% is non-hemolytic [40]. It can be observed in Figure 3D that CaCO3 NPs and TQ-CaCO3 NPs exhibited low hemolysis rates (below 12%) even at the high concentration of 4000 μg/mL. Remarkably, the hemolysis ratio of CaCO3 NPs was better than that of TQ-CaCO3 NPs, especially at concentrations of 500 and 250 μg/mL (p < 0.05), which may be associated with the effects of TQ on erythrocytes. Moreover, the two samples with concentrations ranging from 62.5 to 500 μg/mL showed less than 5% hemolysis activity. Therefore, it can be concluded that the synthesized CaCO3 NPs and TQ-CaCO3 NPs possessed great blood biocompatibility.
Brine shrimp (Artemia salina), an invertebrate species belonging to the zooplankton, was used to evaluate the toxicity of nanoparticles due to its advantages of a fast life cycle, low maintenance costs, and adaptability to laboratory conditions [41,42]. Based on the brine shrimp survival results after treatment of positive control KMnO4, KMnO4 exhibited toxicity to brine shrimp, with an LC50 (lethal concentration 50) value of 433.07 ± 77.00, 306.73 ± 18.91, and 110.23 ± 4.35 μg/mL for 24, 36, and 48 h of exposure, respectively. According to Clarkson’s toxicity index, KMnO4 was non-toxic (LC50 value more than 1000 μg/mL) for 12 h but moderately toxic (LC50 value between 500 and 100 μg/mL) after further extended exposure to 24, 36, and 48 h [43]. In contrast, the brine shrimp toxicity tests of CaCO3 NPs and TQ-CaCO3 NPs did not show any sign of toxicity, as no dead brine shrimp was recorded in varying concentrations of nanoparticles even for 48 h of incubation, indicating that CaCO3 NPs and TQ-CaCO3 NPs were non-toxic. Moreover, the morphology of brine shrimp was observed using the LM. Figure 3E displays the live brine shrimp with an eye, swimming legs, swimming setae, gut, and anus, whereas the dead brine shrimp with a damaged body is shown in Figure 3F. Based on these findings and considering the results of blood compatibility evaluation and cytotoxicity analysis, the synthesized CaCO3 NPs were safe for drug delivery in the body, and TQ-CaCO3 NPs exhibited excellent biocompatibility.

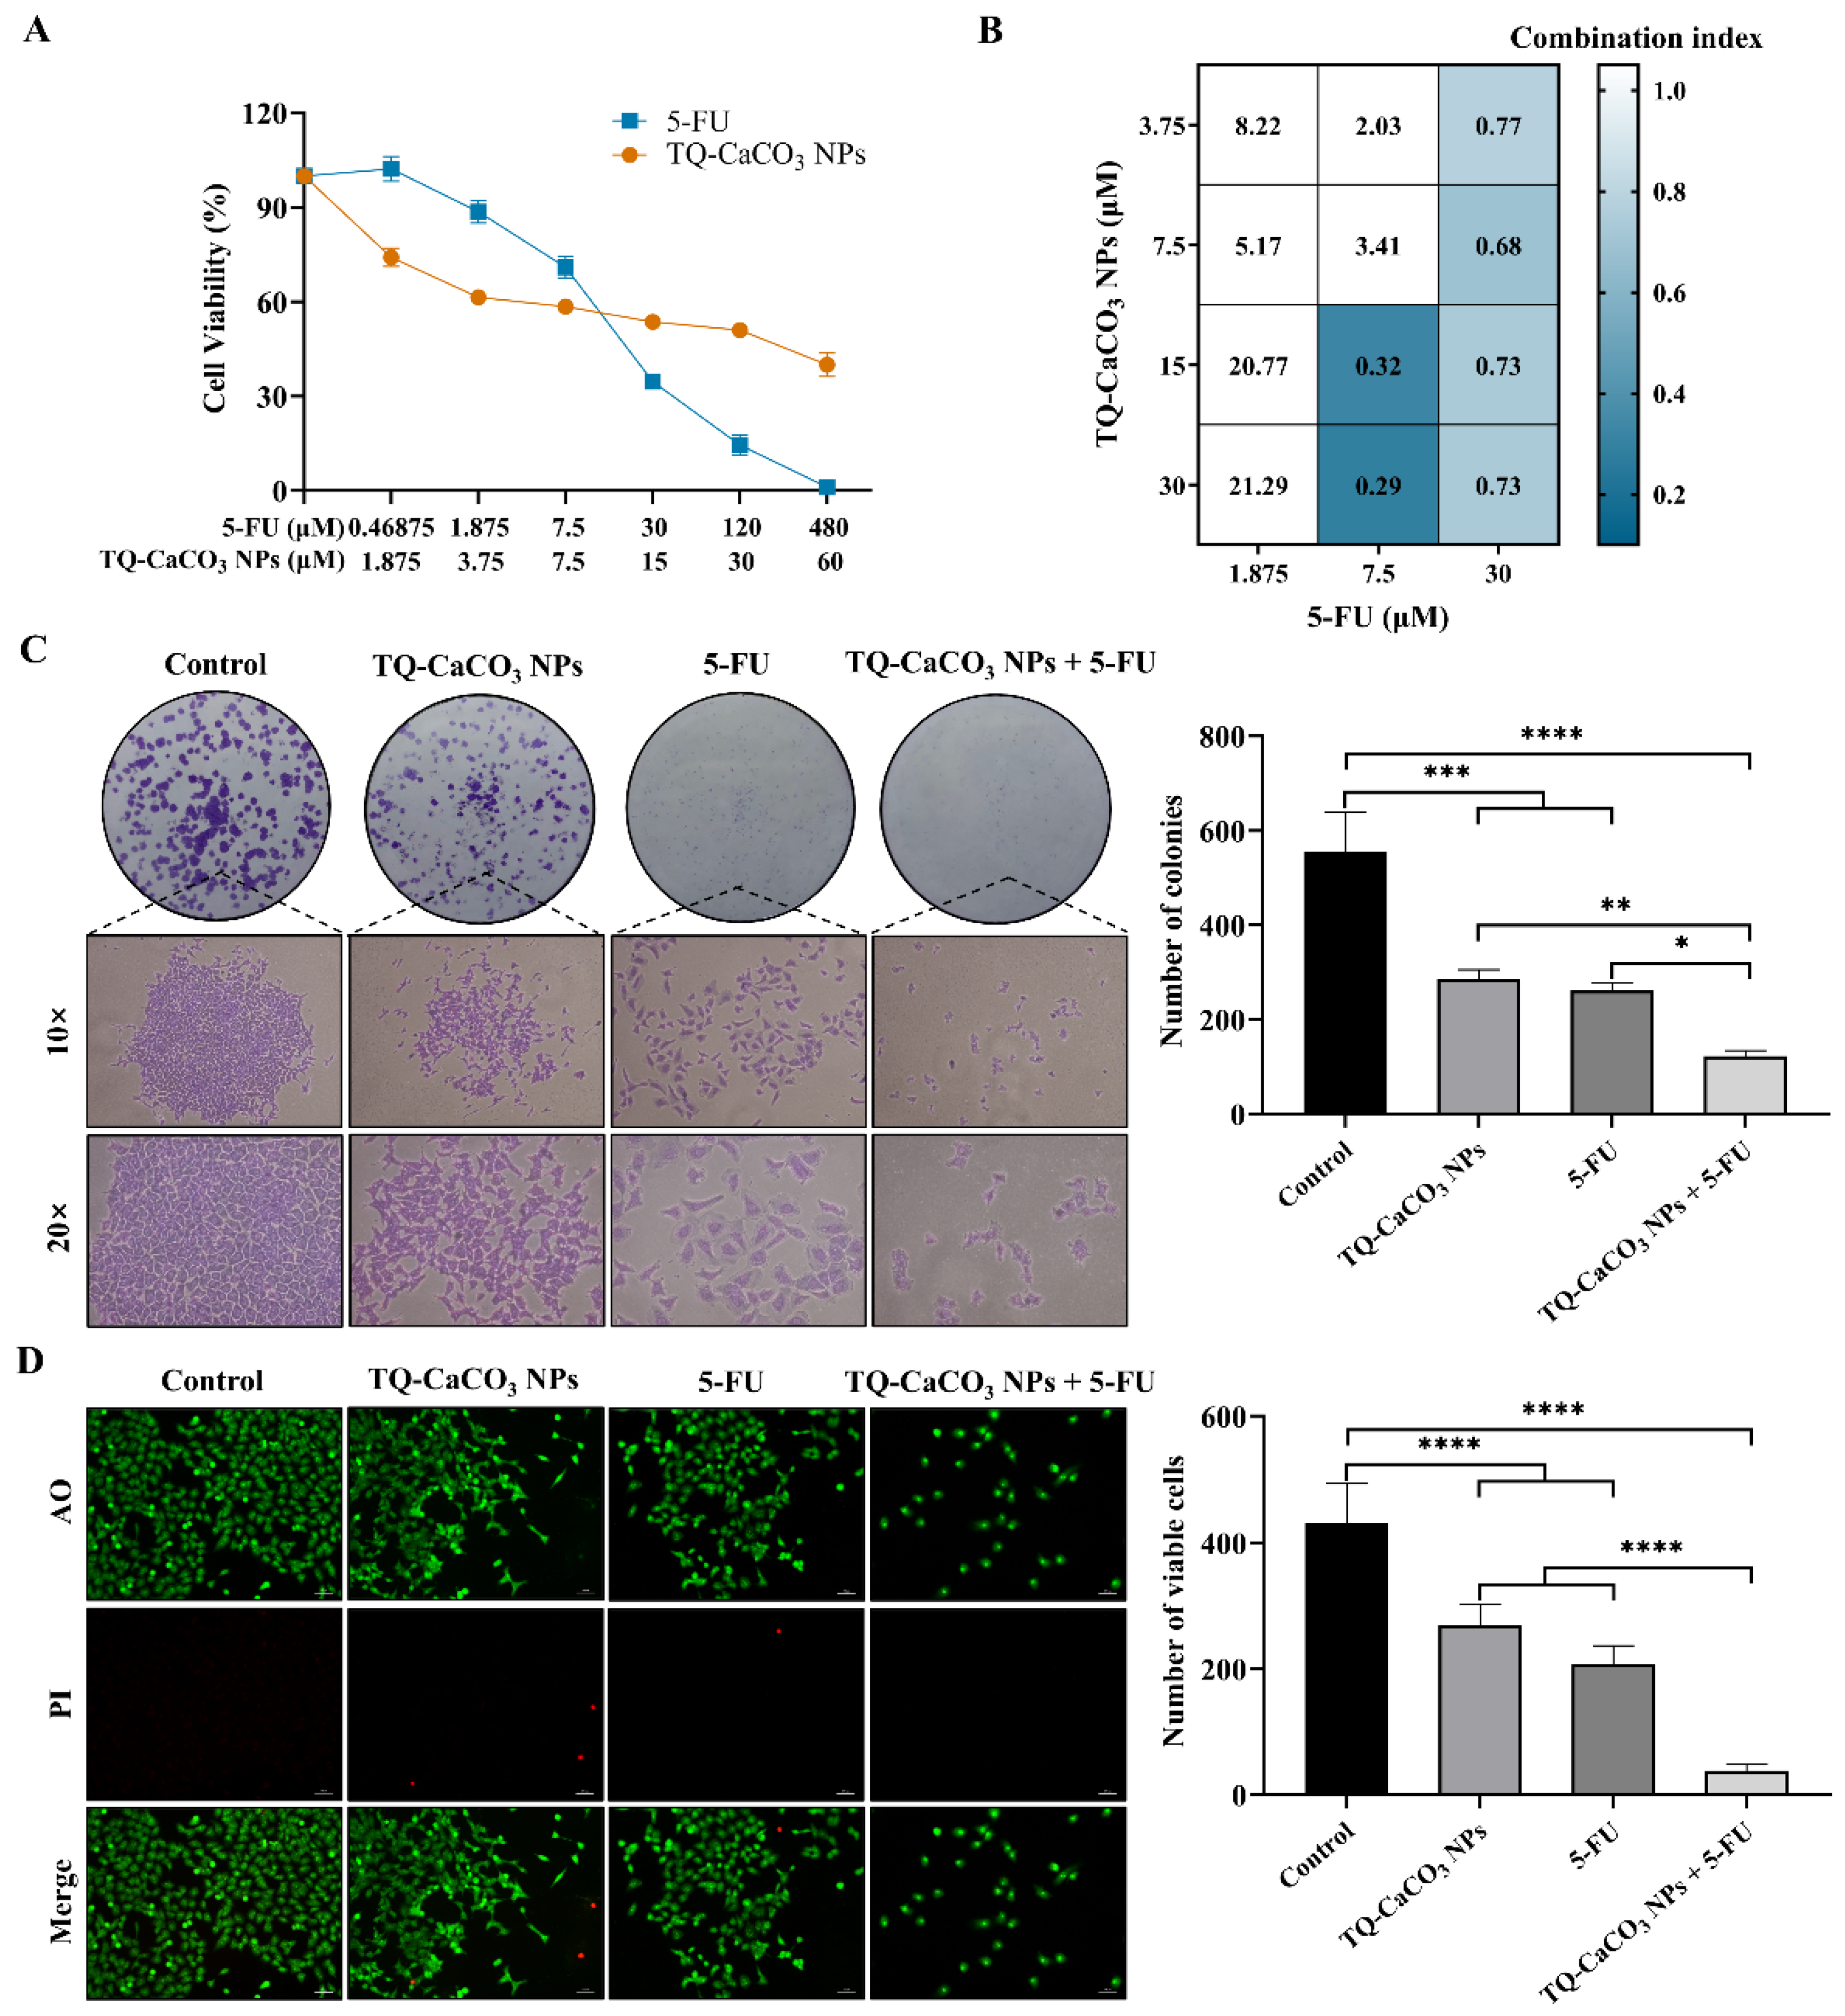
3.4. TQ-CaCO3 NPs in Combination with 5-FU Inhibits the Proliferation of CT26 Cells

To explore the effects of TQ-CaCO3 NPs in combination with 5-FU against colon cancer, an MTT assay was performed to determine the cell viability in colon cancer CT26 cells. As shown in Figure 4A, both TQ-CaCO3 NPs and 5-FU exhibited concentration-dependent inhibitive effects on the cell viability of CT26 cells, with the IC50 values of TQ-CaCO3 NPs and 5-FU being 23.35 and 17.23 μM, respectively. On this basis, the inhibitory effect of TQ-CaCO3 NPs (3.75, 7.5, 15, and 30 μM) combined with 5-FU (1.875, 7.5, and 30 μM) on CT26 cells was further evaluated. Compared to the individual treatments, the increased inhibition of cell viability was observed in half of the combination groups, while the remaining combination groups reduced the interaction effect on CT26 cells. The CI value of every TQ-CaCO3 NPs and 5-FU combination was calculated to elucidate the synergistic effects of the two treatments. The results showed that the CI values of 7.5 μM of 5-FU combined with TQ-CaCO3 NPs (15 and 30 μM) and 30 μM of 5-FU combined with TQ-CaCO3 NPs (3.75–30 μM) were all less than 1, indicating there was a synergistic effect between TQ-CaCO3 NPs and 5-FU (Figure 4B). Among all synergistic groups, 30 μM of TQ-CaCO3 NPs combined with 7.5 μM of 5-FU had the lowest CI value, suggesting the strongest synergistic effect, followed by 15 μM of TQ-CaCO3 NPs combined with 7.5 μM of 5-FU. However, considering that a smaller dose can achieve similar effects, 15 μM of TQ-CaCO3 NPs combined with 7.5 μM of 5-FU was selected to further analyze its inhibitive effects on colon cancer.
The colony-formation results showed that TQ-CaCO3 NPs (15 μM) and 5-FU (7.5 μM) inhibited the colony formation of CT26 cells, with an average of 286 and 262 colonies, respectively, compared with the average of 555 colonies in the control group (Figure 4C). In addition, as shown in Figure 4D, the reduced viable cells after the treatment of TQ-CaCO3 NPs (15 μM) and 5-FU (7.5 μM) were observed in the AO/PI staining results. Notably, consistent with the results in the MTT assay, the colony-formation assay and AO/PI-staining assay revealed the synergism of TQ-CaCO3 NPs (15 μM) and 5-FU (7.5 μM), where the combination of TQ-CaCO3 NPs and 5-FU significantly suppressed the colony formation and growth of CT26 cells. Overall, these findings imply the synergistic inhibitive effects between TQ-CaCO3 NPs and 5-FU on cell proliferation in colon cancer.

3.5. TQ-CaCO3 NPs in Combination with 5-FU Induces Cell Cycle Arrest and Apoptosis in CT26 Cells

The effects of TQ-CaCO3 NPs in combination with 5-FU on cell cycle and apoptosis in CT26 cells were evaluated to investigate the underlying mechanism of TQ-CaCO3 NPs combined with 5-FU against colon cancer. As illustrated in the flow cytometry results in Figure 5A, cells treated with 5-FU or TQ-CaCO3 NPs combined with 5-FU prominently increased G0/G1 phase arrest and reduced the cell number in the S and G2/M phases. However, after TQ-CaCO3 NPs treatment, the proportion of cells in the S phase increased slightly, while that in the G0/G1 phase decreased slightly, and that in the G2/M phase had no obvious change, indicating that TQ-CaCO3 NPs may arrest the cell cycle in the S phase. Additionally, treatment with TQ-CaCO3 NPs or 5-FU alone resulted in the significant apoptosis of CT26 cells (p < 0.05) (Figure 5B). The co-treatment of TQ-CaCO3 NPs and 5-FU showed a significant increase in the apoptotic cells (69.40%), including 54.17% with early apoptosis and 15.23% with late apoptosis, compared with the individual treatments (p < 0.05). In conclusion, the combination of TQ-CaCO3 NPs (15 μM) and 5-FU (7.5 μM) exerted synergistic antiproliferative effects on CT26 cells by inducing cell cycle arrest and apoptosis, ultimately causing cell death.

3.6. TQ-CaCO3 NPs in Combination with 5-FU Inhibits the Migration of CT26 Cells

A wound-healing assay was performed to investigate the potential effects of TQ-CaCO3 NPs in combination with 5-FU on the CT26 cell migration rate. As displayed in Figure 5C, both TQ-CaCO3 NPs and 5-FU exhibited a potent migration-inhibiting efficiency on CT26 cells. Nonetheless, the inhibitory effects of TQ-CaCO3 NPs combined with 5-FU were more noticeable than TQ-CaCO3 NPs or 5-FU alone, as the wound closure was distinctly disrupted. These results suggested that TQ-CaCO3 NPs (15 μM) and 5-FU (7.5 μM) synergistically inhibited the migration of CT26 cells.

3.7. TQ-CaCO3 NPs in Combination with 5-FU Suppresses the Growth of CT26 Spheroids

Compared with conventional 2D cells, 3D spheroids provide a tissue structure similar to intact human tumors, consisting of concentric layers including a proliferating zone, quiescent zone, and necrotic core [44]. Different cell seeding densities were applied to monitor the size of CT26 spheroids. Figure 6A revealed that the size of spheroids was strongly dependent on the initial cell seeding density. CT26 spheroids formed at the initial cell seeding density of 15,000 cells/well and cultured for 4 days had a diameter of 400–500 μm, conforming to the concentrically layered structure, thus serving as the model for spheroid-inhibition analysis [45]. After spheroid formation on day 4, CT26 spheroids were treated with TQ-CaCO3 NPs (15 μM) and 5-FU (7.5 μM) alone or in combination for 96 h. While untreated spheroids increased in size, both TQ-CaCO3 NPs and 5-FU exhibited inhibitory effects on spheroid growth (Figure 6B). Moreover, cell proliferation was significantly inhibited after incubation with the combination of TQ-CaCO3 NPs and 5-FU, and the spheroids were severely destroyed on day 14 (p < 0.05). These data indicated that TQ-CaCO3 NPs combined with 5-FU could significantly suppress CT26 spheroid growth.

3.8. Network Pharmacology

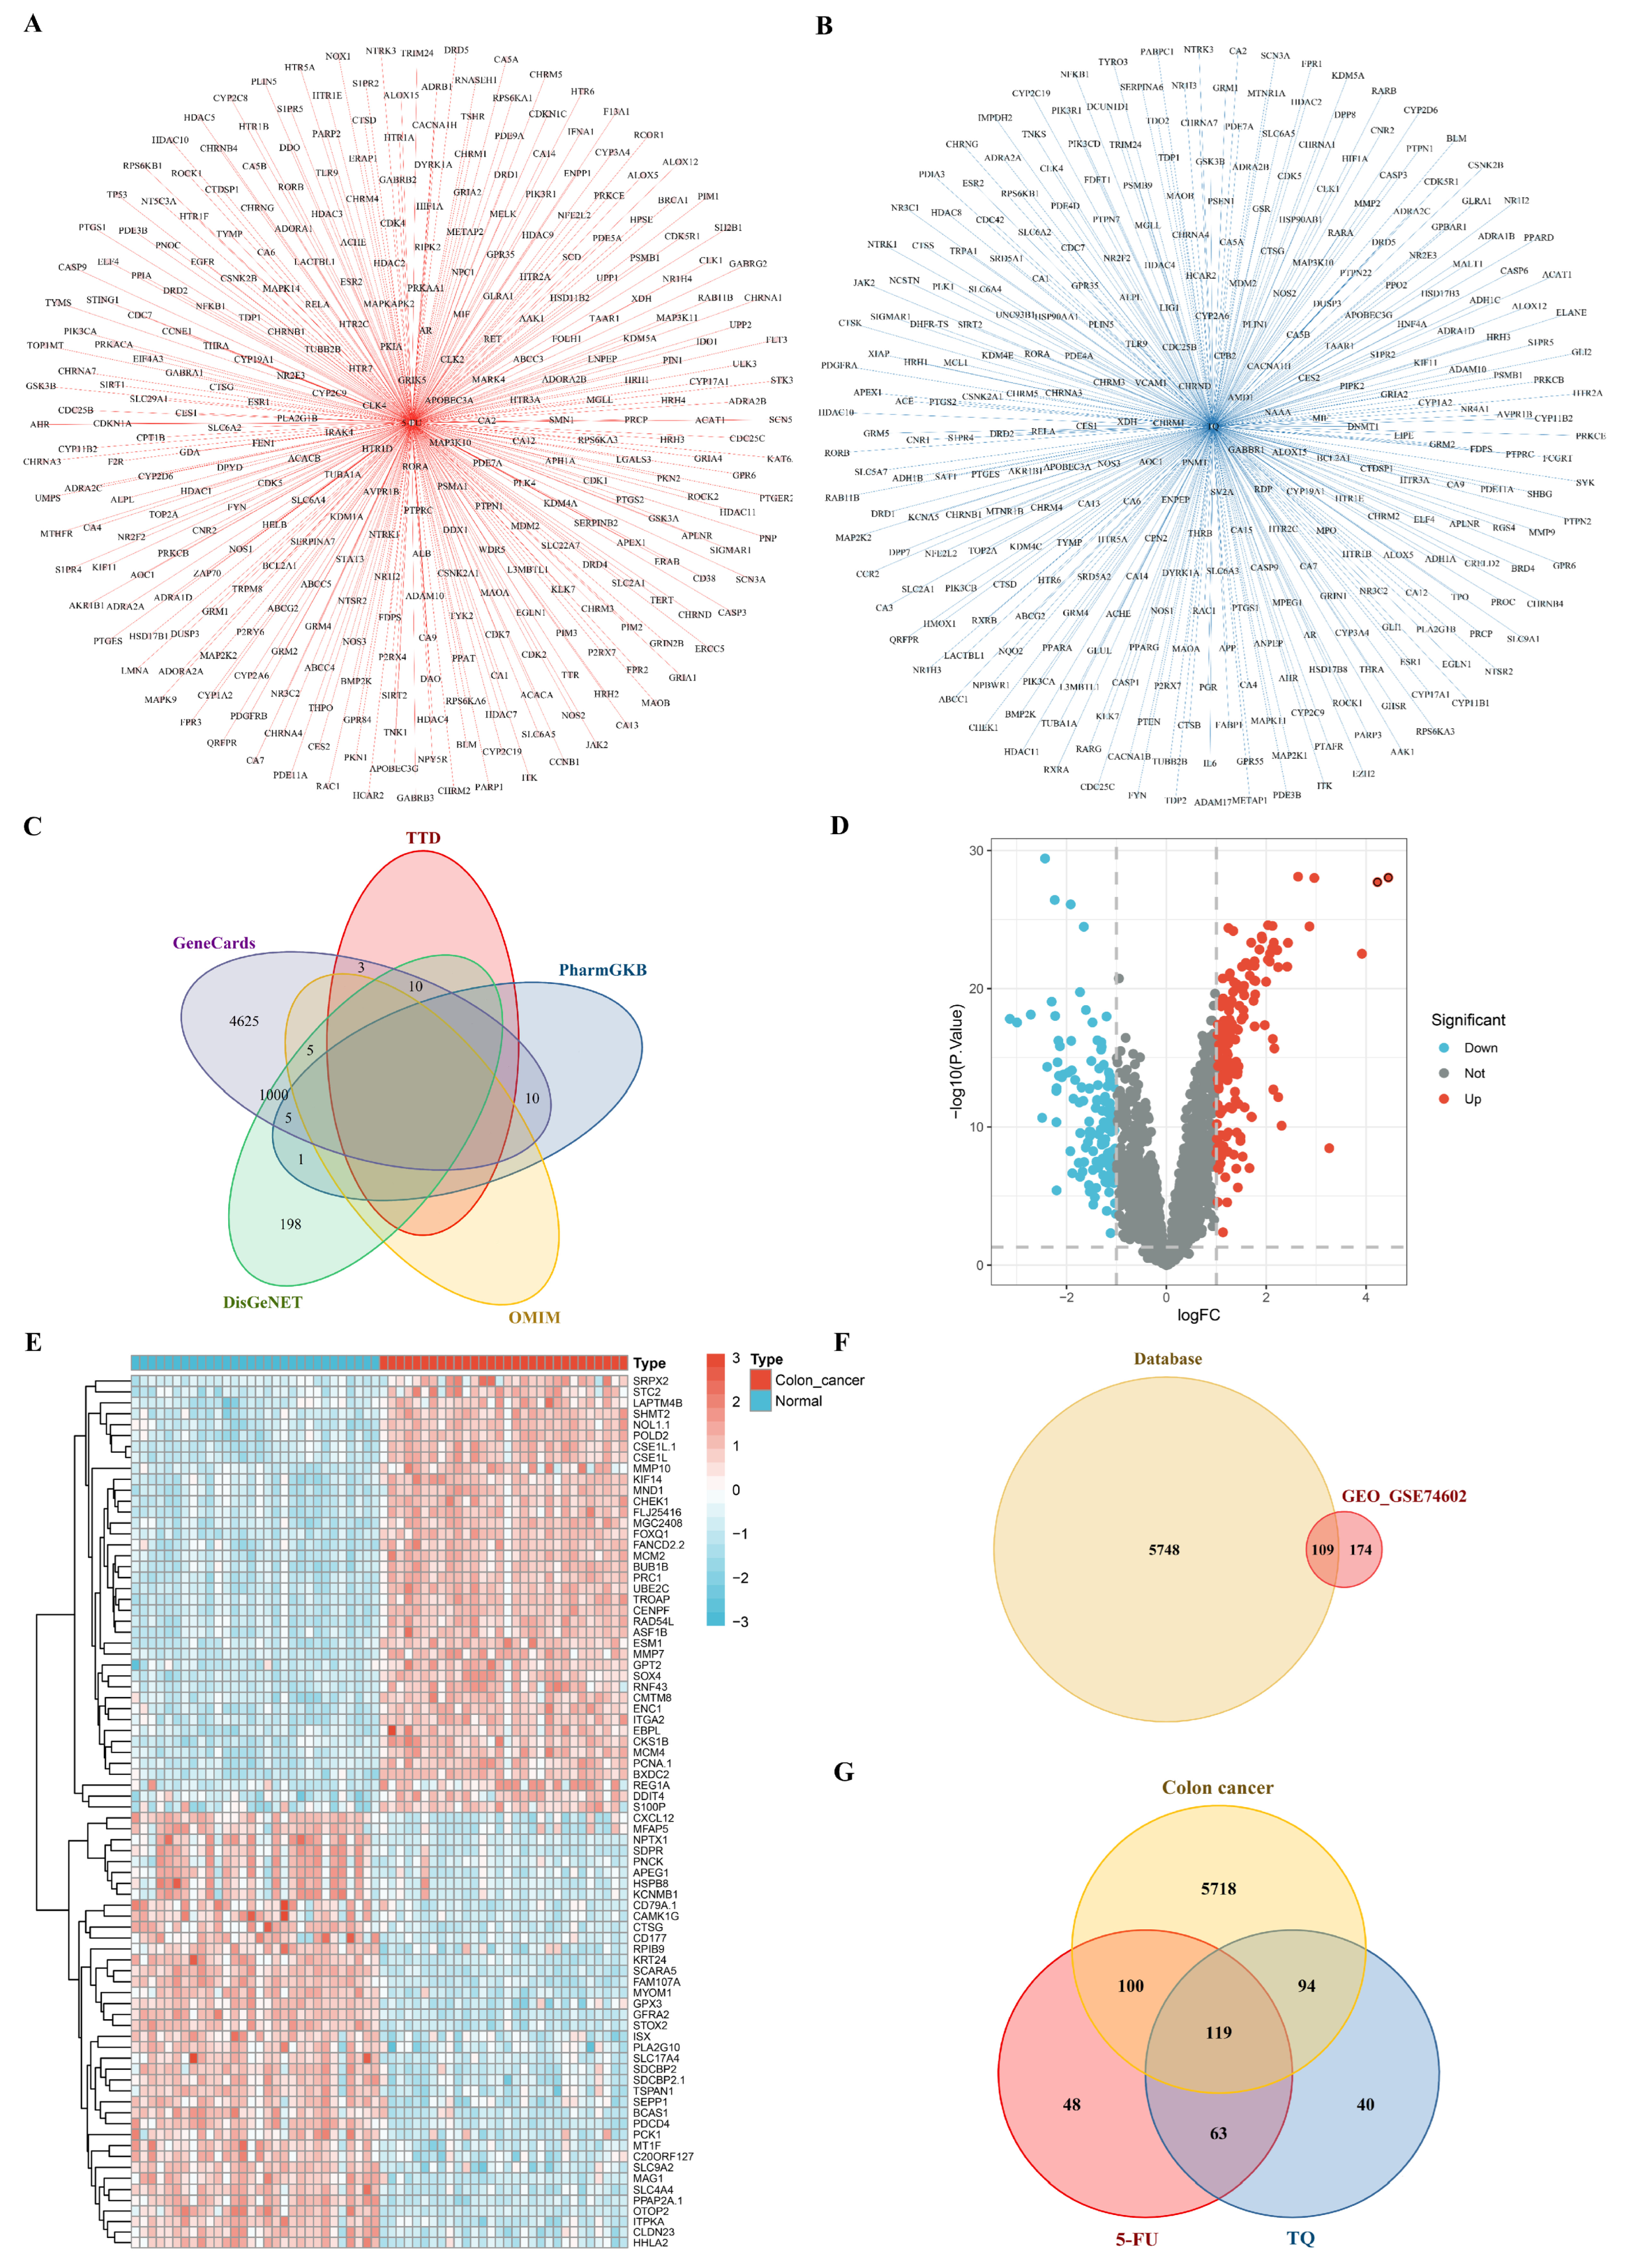
3.8.1. Potential Targets of Drugs and Colon Cancer

After being obtained from the TCMSP, Swiss Target Prediction, Stitch, TargetNet, SuperPred, DrugBank, and SEA databases, the target genes were standardized using the uniport database, and duplicate genes were excluded. 5-FU and TQ contained 330 and 316 potential targets, respectively, with the drug–target network diagrams shown in Figure 7A,B. Meanwhile, 1220, 5658, 5, 16, and 13 colon cancer-associated genes were screened from DisGeNET, GeneCards, OMIM, PharmGKB, and TTD databases, respectively. A total of 5857 targets related to colon cancer were obtained after merging and deduplicating the genes of the five databases (Figure 7C). Moreover, the differential analysis results of the GSE74602 dataset revealed that 283 genes expressed differentially between normal samples and colon tumor samples, including 153 up-regulated genes and 130 down-regulated genes (Figure 7D,E). Subsequently, the target genes from five databases and the differential genes from the GSE74602 dataset were consolidated into 6031 genes related to colon cancer. Finally, 119 targets of 5-FU combined with TQ for colon cancer treatment were screened, as illustrated in the Venn diagram (Figure 7G).

3.8.2. PPI Network and GO Functional Annotation

The 119 intersection genes of 5-FU in combination with TQ against colon cancer were imported into the STRING database, where the interaction score was set greater than 0.9, determining 74 core targets and protein interaction relationships (Figure 8A). The PPI network of the 74 targets was further analyzed using Gephi 0.10.1 software, and the network diagram is shown in Figure 8B with 74 nodes and 250 edges. The deeper the color of the nodes and the bigger the size of the nodes, the greater the degree value and the more edges connected to the target, indicating the higher significance of the target in the network. ESR1, CYP3A4, CYP2C19, CYP2C9, and ALOX15 were the top five hub genes. The GO functional annotation included 1028 biological processes (BPs), 41 cellular components (CCs), and 111 molecular functions (MFs) (p < 0.05). The top enrichment entries of BP involved in 5-FU combined with TQ against colon cancer are the response to xenobiotic stimulus, signal release, and the olefinic compound metabolic process, with the corresponding targets displayed in Figure 8C; the CCs were mainly enriched in the membrane raft, membrane microdomain, and neuronal cell body; the top three MFs were related to heme binding, tetrapyrrole binding, and oxidoreductase activity, acting on paired donors, with the incorporation or reduction in molecular oxygen (Figure 8D).

3.8.3. KEGG Pathway Enrichment Analysis

The KEGG pathway enrichment analysis of the 74 core targets was performed to further investigate the potential molecular mechanisms of 5-FU in combination with TQ against colon cancer. Figure 9A shows that the KEGG pathways were mainly enriched in chemical carcinogenesis-receptor activation, Alzheimer’s disease, pathways of neurodegeneration-multiple disease, serotonergic synapse, and human cytomegalovirus infection. Remarkably, the colorectal cancer pathway was also in the top 30 KEGG pathways (p < 0.05). The pathway–target network (Figure 9B) was constructed to better depict the relationship between the targets and the key pathways (the top five pathways and the colorectal cancer pathway). Meanwhile, the pathway–target network revealed that the top five hub genes in terms of degree value were MAP2K2, CASP3, NFKB1, PIK3CA, and PIK3R1. Moreover, the top chemical carcinogenesis-receptor activation pathway and colorectal cancer pathway are visualized in Figure 9C,D, respectively.

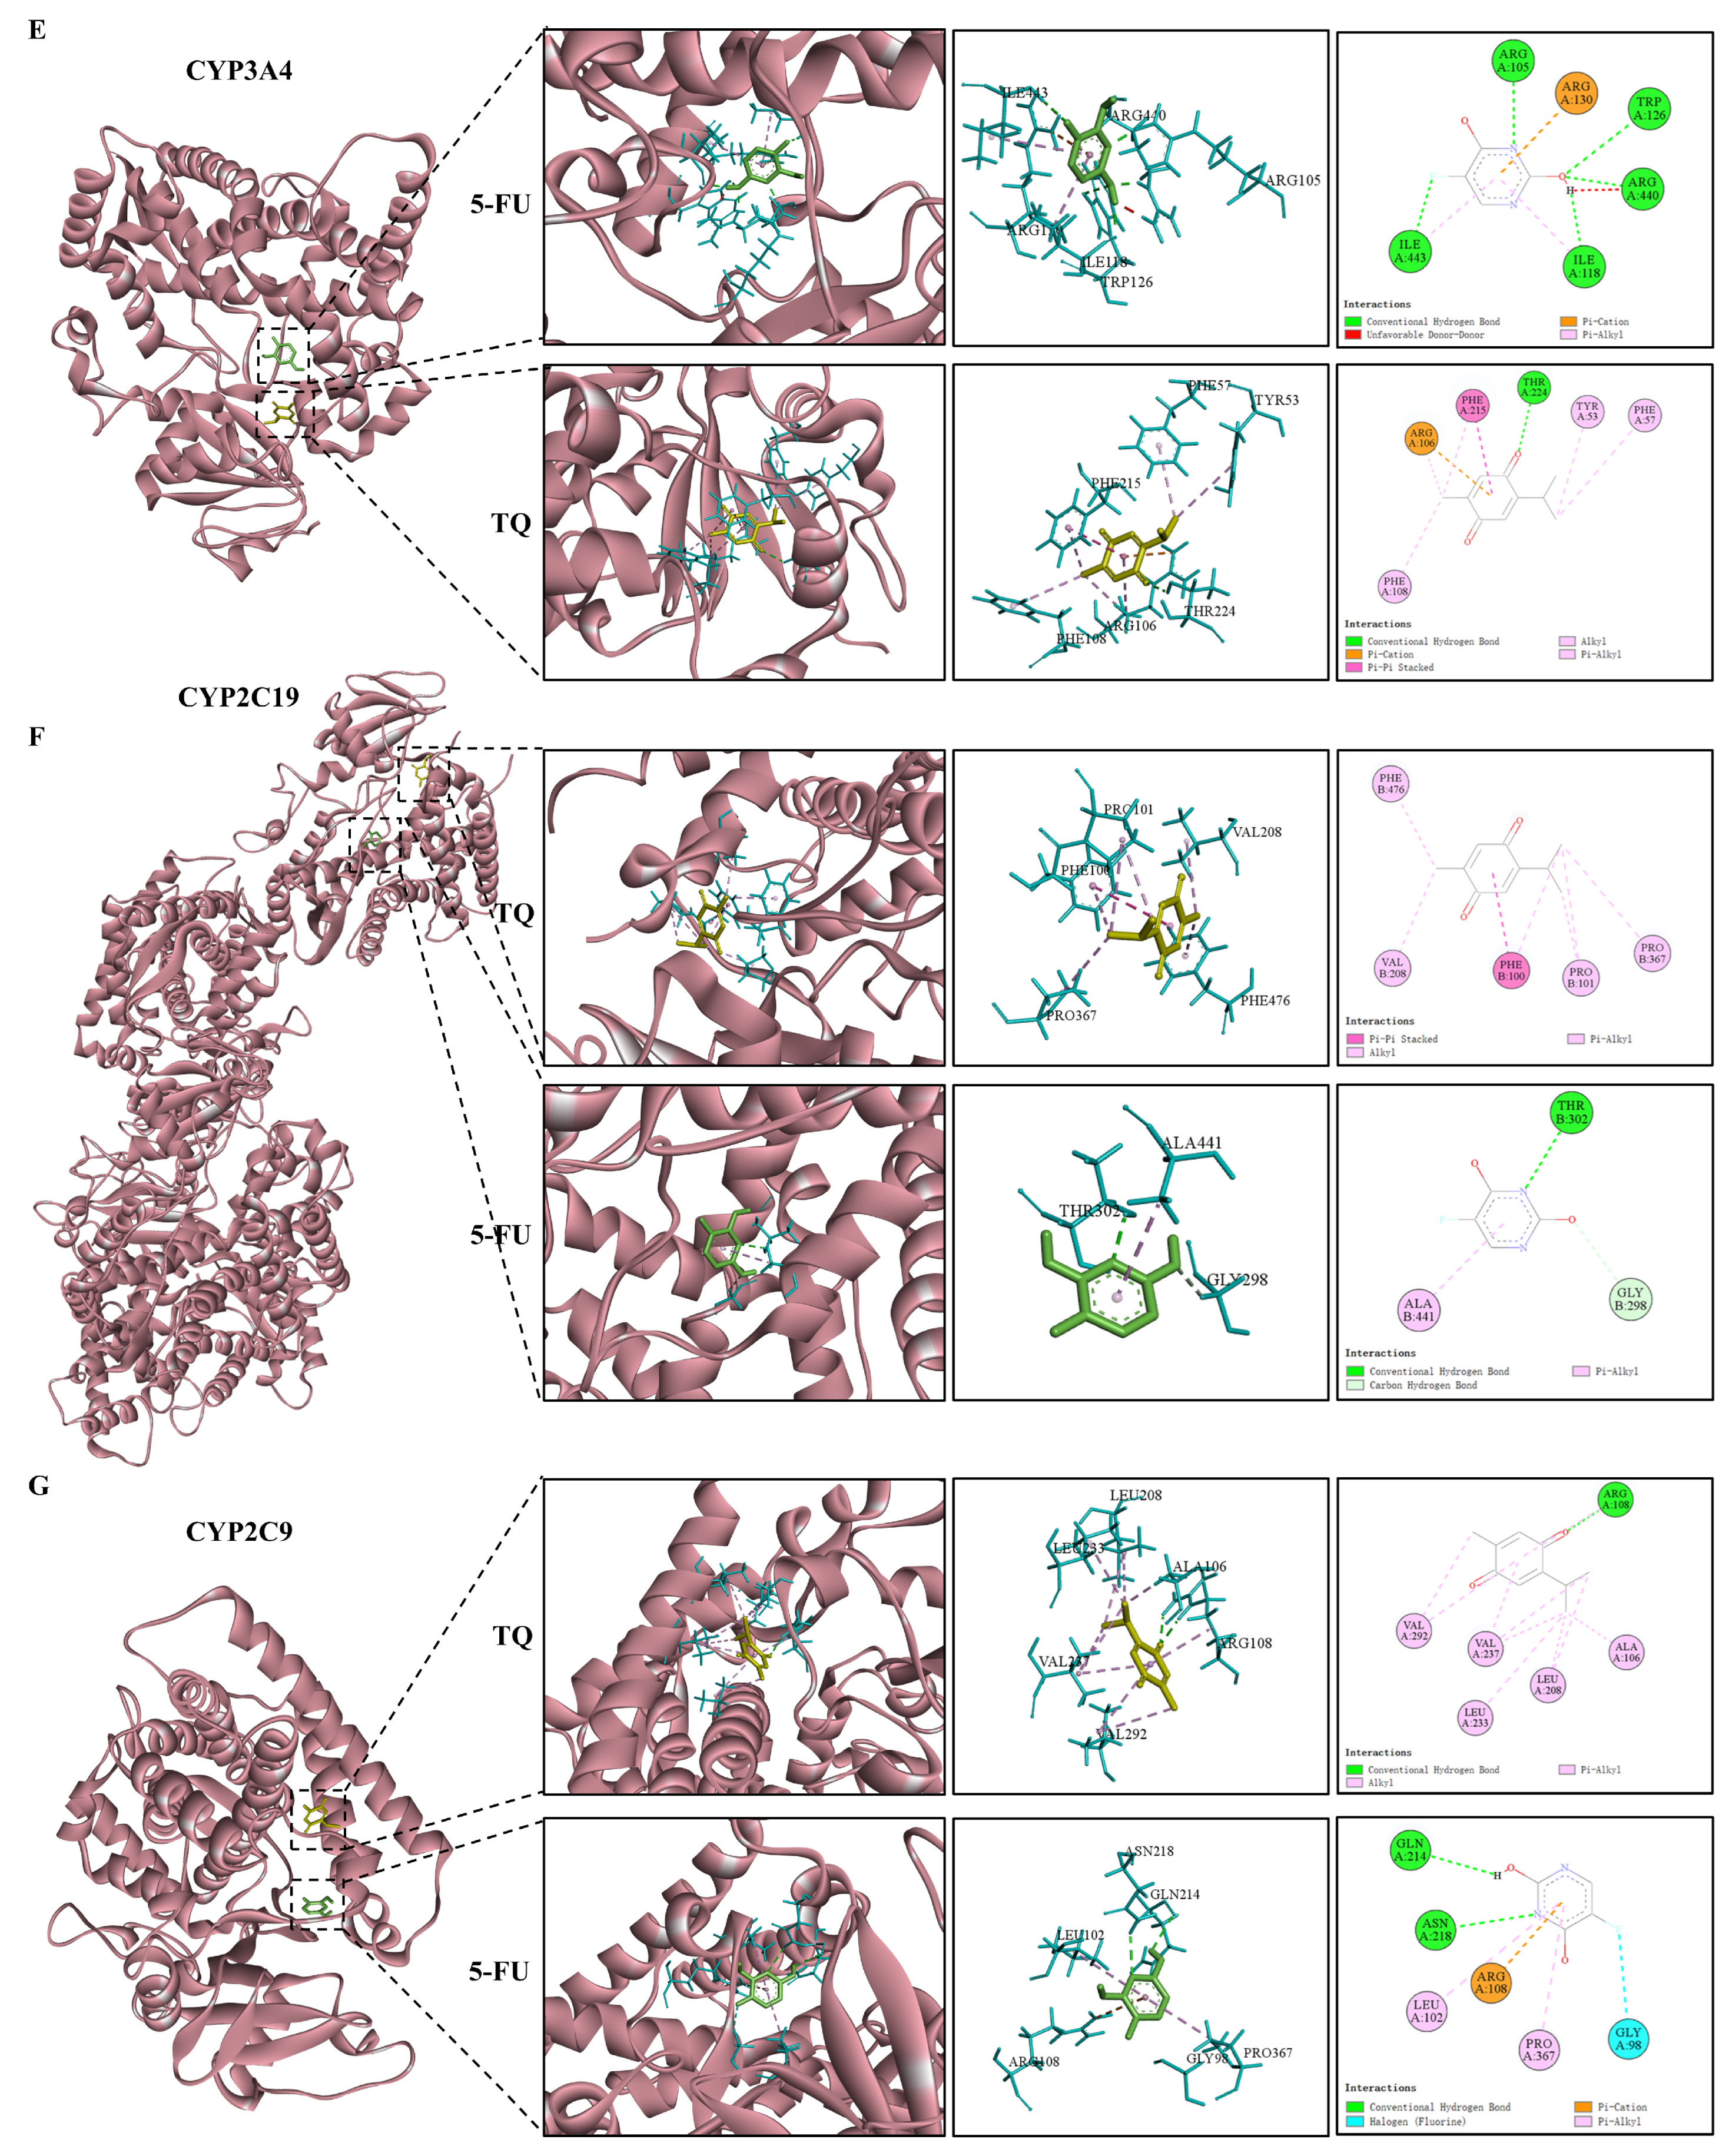
3.9. Molecular Docking

The hub genes were screened from the PPI network of the 74 core targets and pathway–target network of the six key pathways, where MAP2K2, CASP3, PIK3CA, ESR1, CYP3A4, CYP2C19, and CYP2C9 were used to conduct molecular docking with 5-FU and TQ. The molecular docking results in Table 5 indicate that all targets had favorable binding activities with 5-FU and TQ. Then, 2D force and 3D spatial environment images were employed to further analyze the interactions between 5-FU and TQ and the hub genes, as shown in Figure 10. Among them, 5-FU formed a hydrogen bond interaction with PIK3CA at the residue of VAL-851, a pi–sulfur bond interaction at the residue of MET-922, a carbon–hydrogen bond interaction at the residue of VAL-850, and a pi–alkyl bond interaction at the residue of ILE-932. Meanwhile, TQ interacted with PIK3CA by forming a hydrogen bond at the residues of ASP-933 and LYS-802, a pi–anion bond at the residue of ASP-933, and alkyl and pi–alkyl bonds at the residues of ILE-848, LEU-807 as well as ILE-932. It is noted that 5-FU and TQ also interacted (halogen (fluorine) bond) when binding to PIK3CA. Overall, the anti-colon cancer effects of 5-FU in combination with TQ and its potential therapeutic targets were verified from the molecular docking level.

4. Discussion

Despite medical advances in cancer treatment, colon cancer remains a common cause of cancer-related death worldwide. As a first-line chemotherapeutic drug for colon cancer therapy, 5-FU inhibits thymidylate synthase and incorporates its metabolites into RNA and DNA, leading to the death of cancer cells [46]. However, nearly half of colon cancer are resistant to 5-FU-based chemotherapy, and a high dose of 5-FU may provoke severe side effects [47,48]. Therefore, the combinatorial use of 5-FU and phytochemical compounds may be an alternative to reduce these risks due to different mechanisms of action and reduced dosage. The natural antioxidant TQ has been reported to help maintain cellular homeostasis and prevent the progression of various oxidative stress-related diseases, including cancer, cardiovascular diseases, and neurodegenerative disorders [49,50,51,52]. Notably, TQ, in combination with 5-FU, has shown promising anticancer properties in the treatment of triple-negative breast and gastric cancers [9,10]. In addition, owing to its antioxidant properties, TQ mitigates common side effects such as mucositis, myelosuppression, and gastrointestinal toxicity associated with 5-FU treatment [53]. TQ also shows hepatoprotective and renal protective properties against drug cytotoxicity, affecting key enzymes involved in detoxification, such as aspartate transaminase and alanine transaminase [54]. Nonetheless, considering that the hydrophobicity and poor bioavailability of TQ are barriers to its clinical translation and that nano delivery of phytochemical compound is a novel and effective targeted anticancer approach, this study combined TQ-loaded calcium carbonate nanoparticles (TQ-CaCO3 NPs) with 5-FU for the treatment of colon cancer.
In the present study, porous cockle shell-derived CaCO3 NPs with particle sizes of approximately 80 nm were developed using a facile mechanical ball-milling method to deliver compound TQ. This was the first attempt wherein different loading techniques, i.e., shaking incubator and high-speed homogenizer, were explored to prepare the optimal TQ-CaCO3 NPs. The slightly negative surface charge of CaCO3 may facilitate weak electrostatic attractions with TQ, particularly through its polar functional groups. The shaking incubator and high-speed homogenizer used during the compound loading process enhanced these interactions by increasing the contact between TQ molecules and the CaCO3 surface. Given the hydrophobic nature of TQ, it is also likely that hydrophobic interactions play a significant role in the compound loading process, potentially occurring at less polar regions of the CaCO3 surface or within nanoparticle pores. Moreover, the use of a shaking incubator and high-speed homogenizer improved the interaction between TQ and CaCO3 by increasing collision frequency and mixing efficiency. This mechanical energy likely promoted the adsorption of TQ onto the nanoparticle surface through electrostatic and hydrophobic interactions. However, TQ loading using a high-speed homogenizer showed superior LC and EE values compared to loading with a shaking incubator, possibly because loading using a shaking incubator is a simple shaking method, whereas loading using a high-speed homogenizer with strong physical forces is more efficient [55]. The high-speed homogenizer rapidly promotes the interactions between compounds and nanoparticles by intense mechanical forces, leading to faster compound loading and improved loading results compared with gentler agitation provided by the shaking incubator. On the other hand, high-speed homogenization facilitates a uniform dispersion of compounds and prevents nanoparticle aggregation, contributing to a consistent and reproducible compound-loading process [56]. Therefore, the high-speed homogenizer was used as the compound loading method, and the optimal formulation (1:2 weight ratio of TQ to CaCO3 NPs at 24,000 rpm for 3 min) was employed for TQ loading.
Remarkably, CaCO3 NPs loading of the hydrophobic antioxidant TQ in the present study showed better loading results than CaCO3 NPs loading of the hydrophilic drug 5-FU in our previous study [57]. For one thing, this may be related to the solubility of compounds [32]. TQ in ethanol has better solubility than 5-FU in deionized water, which may contribute to a more homogenous distribution of TQ molecules in ethanol to promote better loading into CaCO3 NPs [58,59]. This also helps to explain why the best loading results of 5-FU were at a lower weight ratio, whereas TQ obtained the best loading results at a higher weight ratio. Conversely, the dispersity of CaCO3 NPs in the loading medium may be an important factor in compound loading [56]. CaCO3 NPs may disperse better in organic solvent ethanol than in water due to the stronger viscosity of ethanol, which may increase the surface area of CaCO3 NPs for compound loading, resulting in more effective interactions between TQ and CaCO3 NPs [60,61].
Due to the porosity of CaCO3 NPs, TQ molecules were incorporated within the pores of CaCO3 NPs during the high-speed mixing of TQ and CaCO3 NPs using a high-speed homogenizer. The size of TQ-CaCO3 NPs was slightly increased compared to the size of empty CaCO3 NPs, which may be attributed to the loading of TQ. Moreover, the particle sizes of CaCO3 NPs and TQ-CaCO3 NPs are suitable for compound delivery for cancer treatment, as nanoparticles with sizes between 20 and 150 nm can reduce liver clearance and kidney filtration and prolong the circulation time in vivo [62]. As reported, other elements except for Ca, C, and O have been found inside calcium carbonate nanoparticles synthesized by other methods, such as Si, Cu, P, and Mg [63,64,65]. In contrast, the synthesis method of calcium carbonate nanoparticles and compound-loading method in this study produced purer CaCO3 NPs and TQ-CaCO3 NPs. Moreover, other calcium carbonate phases have their characteristic peaks (crystal planes), such as the calcite phase at 29.32° (104), 35.90° (110), 39.36° (113), 47.47° (018), 48.43° (116), as well as 57.37° (122) and the vaterite phase at 20.89° (002), 24.82° (100), 26.99° (101), 32.72° (102), 43.71° (110), 49.07° (112), 50.06° (104), as well as 55.74° (202) [66]. However, these peaks do not appear in Figure 2F, indicating the synthesized CaCO3 NPs and TQ-CaCO3 NPs were pure aragonite. Notably, the characteristic diffraction peak of TQ was extremely weak in the XRD pattern of TQ-CaCO3 NPs, possibly associated with the encapsulation of TQ into the pores rather than the surface of CaCO3 NPs. Besides XRD, FTIR is another tool for comparing different calcium carbonate phases, where the calcite, vaterite, and aragonite phases exhibit their characteristic absorption bands. The results of FTIR validated the aragonite polymorphism of TQ-CaCO3 NPs and the encapsulation of TQ into CaCO3 NPs without chemical modification, as there was no new observed peak besides the characteristic peaks of CaCO3 NPs and TQ [67].
The release profile of compounds from nanoparticles is divided into a sudden release and a sustained release. The sudden release of compounds quickly reaches their effective therapeutic concentrations in the body, whereas sustained release keeps compounds within the effective therapeutic concentration range [68]. As illustrated in Figure 2J, TQ-CaCO3 NPs suddenly released nearly 6% within 2 h, while pure TQ rapidly released more than 95% within 8 h. Compared to the rapid release of pure TQ, the sustained release of TQ-CaCO3 NPs can maintain the effective concentrations of TQ, thus reducing the dose, frequency of administration, and adverse effects of the compound [69]. It is noted that the antioxidant TQ was released slower from TQ-CaCO3 NPs compared with the chemotherapy drug 5-FU from 5FU-CaCO3 NPs [57]. This could be related to the hydrophobic nature of TQ, encapsulated deeper inside the CaCO3 NPs, which had to follow a lengthier diffusion path to reach the surface in comparison to water-soluble 5-FU encapsulated near the surface [35]. Interestingly, pure 5-FU exhibited a similar rapid release profile at a pH of 7.4, 6.5, and 5.0, while pure TQ released faster at a lower pH value, which may be due to the hydrophilic nature of 5-FU and the increased solubility of TQ at the decreased pH value [12]. Furthermore, as demonstrated in cytotoxicity analysis, blood compatibility evaluation, and brine shrimp toxicity assessment, the synthesized CaCO3 NPs and TQ-CaCO3 NPs exerted excellent biocompatibility, showing promise for clinical application.
TQ-CaCO3 NPs, in combination with 5-FU, were then evaluated for their potency against colon cancer CT26 cells. Our results indicated that the combination of TQ-CaCO3 NPs and 5-FU inhibited the development and progression of colon cancer by regulating cell proliferation, apoptosis, and migration. Both TQ-CaCO3 NPs and 5-FU suppressed the viability of CT26 cells in a dose-dependent manner, whereas the antiproliferative effect of TQ-CaCO3 NPs in combination with 5-FU depended on their combined concentration. The synergism of two treatments can be inferred when the combination of the treatments at specific doses produces an effect greater than the sum of the effects achieved by the individual treatments at the same doses [70]. The CI values were calculated to measure the extent of drug interactions and revealed the optimal synergistic combination (CI = 0.32) of TQ-CaCO3 NPs and 5-FU against CT26 cells. In our previous study, the combinatorial effects of 5FU-CaCO3 NPs and TQ were investigated against colon cancer CT26 cells, which also showed synergism [57]. Notably, the optimal CI value of TQ-CaCO3 NPs and 5-FU was superior to that (0.60) of 5FU-CaCO3 NPs and TQ, indicating that TQ-CaCO3 NPs and 5-FU exhibited better synergistically inhibitory effects on CT26 cells. The colony-formation assay and AO/PI staining assay results further visually confirmed the synergistically inhibitive effects of the optimal combination between TQ-CaCO3 NPs and 5-FU on cell proliferation. Hence, we continued investigating the synergistic anti-colon cancer effects and the underlying therapeutic mechanisms of TQ-CaCO3 NPs (15 μM) and 5-FU (7.5 μM).
As demonstrated, the combination of TQ-CaCO3 NPs and 5-FU exhibited antiproliferative activity by inducing cell cycle arrest and apoptosis in CT26 cells. 5-FU increased the G0/G1 phase arrest of CT26 cells and reduced the cell number in the S and G2/M phases, consistent with the mechanism of 5-FU, which inhibits thymidylate synthase, leading to the inhibition of DNA synthesis, induction of DNA damage, and a halt in cell cycle progression in the G1 or S phase [3]. In contrast, TQ-CaCO3 NPs slightly increased the cell number in the S phase and decreased in the G0/G1 phase. However, TQ-CaCO3 NPs and 5-FU combination prominently induced G0/G1 and S phases’ cell cycle arrest in CT26 cells, suggesting that TQ-CaCO3 NPs may enhance the efficacy of 5-FU by further reinforcing the cell cycle arrest in G0/G1 and S phases, resulting in a stronger inhibitory effect on cell proliferation. The enhancement of 5-FU inhibition of cell proliferation by TQ-CaCO3 NPs was further confirmed in the cell apoptosis assay. Cancer cell migration is an essential step for successful cancer metastasis associated with substantial mortality after surgical resection of primary cancer; thereby, inhibiting cell migration is a practical approach for anticancer therapy [71,72]. The wound-healing assay results revealed that TQ-CaCO3 NPs and 5-FU inhibited CT26 cell migration, while TQ-CaCO3 NPs combined with 5-FU exerted a more significant migration-inhibitory effect.
Before clinical trials, drugs must undergo a series of tests to ensure their effectiveness and safety, the first step of which is usually in vitro experiments based on 2D cells. However, compared with traditional 2D cells, 3D cell spheroids in vitro models with similar characteristics to solid tumors in vivo can better predict drug effects, bridging the gap between in vitro 2D cells and in vivo animal models [44]. In this study, agarose-based liquid overlay technology was applied to produce 3D spheroids, which has the advantage of allowing rapid aggregation of cells into spheroids with reproducible morphology [73]. Typically, when 3D spheroids are 400–500 μm in size, cell layers similar to those in solid tumors can be formed, including an outer layer composed of proliferating cells, a middle layer of quiescent cells, and a hypoxic inner layer of necrotic cells [45]. However, limited literature has explored the optimal initial cell seeding density for CT26 cells to form the expected spheroid size. To achieve a 3D spheroid size typical of solid tumors, we used increased cell seeding densities (2000, 4000, 6000, 8000, 10,000, 15,000, and 20,000 cells/well) to culture spheroids. It was observed that when the cell density was 15,000 cells/well, the spheroids cultured for 4 days were stable and uniform and reached the expected size, thereby being used for a spheroid-inhibition assay. As observed in Figure 6B, 5-FU had a less inhibitive effect on CT26 spheroids, possibly due to the spheroids exhibiting resistance to 5-FU. Nonetheless, the addition of TQ-CaCO3 NPs to 5-FU showed a high inhibitory effect on the spheroids, indicating that TQ-CaCO3 NPs enhanced the chemosensitivity of 5-FU to CT26 spheroids, thereby improving the therapeutic effect on colon cancer. Especially after 3 days of treatment, the inhibitory effect of 5-FU and TQ-CaCO3 NPs co-treatment was significantly better than that of the individual treatment (p < 0.05).
To the best of our knowledge, this is the first study to combine network pharmacology and molecular docking to elucidate the potential therapeutic mechanisms of 5-FU in combination with TQ (from TQ-CaCO3 NPs) against colon cancer. Network pharmacology, as a combination of system biology and network informatics, has been widely used as a useful analytical approach to predict potential pharmacological actions of drugs [74]. In this study, network pharmacology was employed to screen potential targets and analyze underlying therapeutic mechanisms of 5-FU in combination with TQ for the treatment of colon cancer. The targets of 5-FU and TQ and colon cancer-related genes were intersected, and 74 core targets of the 5-FU combined with TQ against colon cancer were screened. Meanwhile, the hub genes were identified in the PPI network of the 74 core targets based on the degree values, namely, ESR1, CYP3A4, CYP2C19, CYP2C9, and ALOX15. ESR1 encoding estrogen receptor α expresses very low in normal colon mucosa, but an increase in ESR1 expression results in poor outcomes in patients with colon cancer [75,76]. In addition, activated ESR1 stimulates the expression of tumor promoters and promotes colon cancer cell survival and metastasis; thus, blocking ESR1 expression offers a potential therapeutic opportunity for colon cancer [76]. Lipoxygenases and cytochrome P450s are the main enzymes mediating the metabolism of polyunsaturated fatty acids involved in cancer initiation, progression, and metastasis [77]. The expression of 15-lipoxygenase-1 (ALOX15), which plays a tumor-suppressing role, is reduced in human cancers, particularly colon cancer [78]. Transgenic expression of ALOX15 suppresses TNF-α and iNOS expression as well as NF-κB activation and downregulates LRP5 to suppress Wnt/β-catenin signaling, thereby inhibiting colon cancer [79,80]. Moreover, previous studies have shown that CYP3A4 was significantly downregulated in colonic tumors compared with normal mucosa tissues, whereas CYP2C19 and CYP2C9 were highly expressed in colon cancer; thus, upregulating CYP3A4 expression and downregulating CYP2C19 and CYP2C9 expression may prohibit the growth and metastasis of colon cancer cells [81,82].
GO and KEGG analyses provide an in-depth description of the functions of potential therapeutic targets, reflecting the possible mechanisms of TQ in combination with 5-FU against colon cancer. Some important BPs, such as the response to xenobiotic stimulus, signal release, olefinic compound metabolic process, response to oxygen levels, and unsaturated fatty acid metabolic process, are related to the potential targets. KEGG enrichment results revealed that multiple signaling pathways are involved in the anti-colon cancer mechanisms of TQ combined with 5-FU, with six key pathways, i.e., colorectal cancer, chemical carcinogenesis-receptor activation, Alzheimer’s disease, neurodegeneration-multiple disease, serotonergic synapse, and human cytomegalovirus infection. Notably, five hub genes were identified based on the network between the six pathways and corresponding targets, including MAP2K2, CASP3, NFKB1, PIK3CA, and PIK3R1. MAP2K2 (also known as MEK2), part of the Kras/Braf/MEK/MAPK signaling pathway, plays a vital role in inducing cell survival and proliferation and the inhibition of cell apoptosis of colon cancer [83]. The inhibition of MAP2K2 may suppress not only the formation of colon cancer but also the progression of colon cancer and its metastasis to the liver and lung [84,85]. Activation of the PI3K-Akt-mTOR signaling pathway is essential to the survival, proliferation, migration, and invasion of various cancer cells [86]. In this signaling pathway, the oncogene PIK3CA, encoding the p110α catalytic subunit of PI3K, is one of the most commonly mutated genes in colon cancer [87,88]. In contrast, PIK3R1 (p85α regulatory subunit of PI3K) is a tumor-suppressor gene, and the protein p85α has a reduced capacity to restrain p110α when PIK3R1 is mutated, resulting in activation of PI3K-Akt-mTOR pathway [89]. Executioner CASP3, commonly used as a marker for the efficacy of cancer treatment, is involved in modulating colon cancer cell survival, proliferation, apoptosis, migration, invasion, and metastasis [90,91]. NFKB1 (p50, p105, or p50/p105) is a member of the NF-κB signaling pathway. As activation of the NF-κB pathway promotes the formation and development of colon cancer through inducing cell proliferation, angiogenesis, and cell metastasis and inhibiting cell apoptosis, NFKB1 is employed as a potential therapeutic target for colon cancer [92]. Furthermore, molecular docking results indicated the stable binding connections between TQ/5-FU and the hub targets, i.e., MAP2K2, CASP3, PIK3CA, ESR1, CYP3A4, CYP2C19, and CYP2C9, suggesting that TQ, in combination with 5-FU, may treat colon cancer by modulating these hub targets.
However, alterations in intracellular Ca2+ homeostasis are implicated in various stages of the apoptotic signaling cascade [93]. Moreover, it has been reported that Ca2+ could act as a messenger for 5-FU to activate p53, where 5-FU may induce apoptosis through a Ca2+-calmodulin-dependent pathway, which subsequently modulated DR5-death-inducing signaling complex activity via p53 [94]. Given that calcium carbonate nanoparticles decompose into Ca2+ and CO2 under acidic conditions, further investigation will be conducted to comprehensively explore the synergistic anti-colon cancer mechanisms of TQ-CaCO3 NPs and 5-FU, as the mechanisms may involve the interaction not only between TQ and 5-FU but also between Ca2+ and 5-FU. This fact may provide a novel therapeutic intervention point for this combined treatment regimen.

5. Conclusion

Taken together, purely aragonite TQ-CaCO3 NPs with excellent pH sensitivity, biocompatibility, and sustained-release properties were synthesized by a high-speed homogenizer in this study. The combination of TQ-CaCO3 NPs and 5-FU exhibited synergistic anti-colon cancer effects by inhibiting CT26 cell proliferation and migration, inducing cell apoptosis and cell cycle arrest in the G0/G1 phase, as well as suppressing the CT26 spheroid growth. In other words, TQ-CaCO3 NPs can effectively enhance the anti-colon cancer efficacy of 5-FU, indicating that it is possible to reduce the dose of 5-FU while maintaining or improving the effect of 5-FU, thereby decreasing the toxic side effects caused by 5-FU. Furthermore, the underlying therapeutic mechanisms of the combination are possibly associated with multiple molecules and pathways, with a particular emphasis on ESR1, CYP3A4, CYP2C19, CYP2C9, ALOX15, MAP2K2, CASP3, NFKB1, PIK3CA, and PIK3R1 targets, as well as chemical carcinogenesis-receptor activation and colorectal cancer pathways. These findings may open up new possibilities for the treatment of colon cancer. Therefore, it is imperative to further verify the combination of TQ-CaCO3 NPs and 5-FU against colon cancer, including its in vivo therapeutic efficacy and comprehensive therapeutic mechanisms.

Supplementary Materials

The following supporting information can be downloaded at: https://www.mdpi.com/article/10.3390/antiox13091030/s1, Table S1: Single-factor experimental design; Figure S1: Absorption spectrum of TQ with the absorbance peak (252 nm) in ethanol; Figure S2: EDX spectrum of CaCO3 NPs; Figure S3: EDX spectrum of TQ-CaCO3 NPs; Figure S4: EDX spectrum of TQ.

Author Contributions

X.D.: Conceptualization, Methodology, Software, Writing—original draft, Visualization, Writing—review and editing. Z.Y.: Validation, Resources, Writing—review and editing. K.W.C.: Resources, Writing—review and editing. N.I.: Writing—review and editing, Funding acquisition. M.Z.A.B.: Writing—review and editing, Project administration, Funding acquisition. All authors have read and agreed to the published version of the manuscript.

Funding

This work was supported by funding from the Fundamental Research Grant Scheme (FRGS) under the Ministry of Higher Education, Malaysia (grant no. 01-01-20-2341FR).

Data Availability Statement

The data presented in this study are available in the article and Supplementary File.

Conflicts of Interest

The authors declare no conflicts of interest.

References

  1. Bray, F.; Laversanne, M.; Sung, H.; Ferlay, J.; Siegel, R.L.; Soerjomataram, I.; Jemal, A. Global Cancer Statistics 2022: GLOBOCAN Estimates of Incidence and Mortality Worldwide for 36 Cancers in 185 Countries. CA Cancer J. Clin. 2024, 74, 229–263. [Google Scholar] [CrossRef] [PubMed]
  2. Christensen, S.; Van der Roest, B.; Besselink, N.; Janssen, R.; Boymans, S.; Martens, J.W.M.; Yaspo, M.L.; Priestley, P.; Kuijk, E.; Cuppen, E.; et al. 5-Fluorouracil Treatment Induces Characteristic T>G Mutations in Human Cancer. Nat. Commun. 2019, 10, 4571. [Google Scholar] [CrossRef]
  3. Vodenkova, S.; Buchler, T.; Cervena, K.; Veskrnova, V.; Vodicka, P.; Vymetalkova, V. 5-Fluorouracil and Other Fluoropyrimidines in Colorectal Cancer: Past, Present and Future. Pharmacol. Ther. 2020, 206, 107447. [Google Scholar] [CrossRef] [PubMed]
  4. Imran, M.; Rauf, A.; Khan, I.A.; Shahbaz, M.; Qaisrani, T.B.; Fatmawati, S.; Abu-Izneid, T.; Imran, A.; Rahman, K.U.; Gondal, T.A. Thymoquinone: A Novel Strategy to Combat Cancer: A Review. Biomed. Pharmacother. 2018, 106, 390–402. [Google Scholar] [CrossRef]
  5. Darakhshan, S.; Bidmeshki Pour, A.; Hosseinzadeh Colagar, A.; Sisakhtnezhad, S. Thymoquinone and Its Therapeutic Potentials. Pharmacol. Res. 2015, 95–96, 138–158. [Google Scholar] [CrossRef]
  6. Jrah-Harzallah, H.; Ben-Hadj-Khalifa, S.; Almawi, W.Y.; Maaloul, A.; Houas, Z.; Mahjoub, T. Effect of Thymoquinone on 1,2-Dimethyl-Hydrazine-Induced Oxidative Stress during Initiation and Promotion of Colon Carcinogenesis. Eur. J. Cancer 2013, 49, 1127–1135. [Google Scholar] [CrossRef] [PubMed]
  7. Homayoonfal, M.; Asemi, Z.; Yousefi, B. Potential Anticancer Properties and Mechanisms of Thymoquinone in Osteosarcoma and Bone Metastasis. Cell Mol. Biol. Lett. 2022, 27, 21. [Google Scholar] [CrossRef]
  8. Zhu, W.Q.; Wang, J.; Guo, X.F.; Liu, Z.; Dong, W.G. Thymoquinone Inhibits Proliferation in Gastric Cancer via the STAT3 Pathway in Vivo and in Vitro. World J. Gastroenterol. 2016, 22, 4149–4159. [Google Scholar] [CrossRef]
  9. Zheng, M.; Mei, Z.; Junaid, M.; Tania, M.; Fu, J.; Chen, H.C.; Khan, M.A. Synergistic Role of Thymoquinone on Anticancer Activity of 5-Fluorouracil in Triple Negative Breast Cancer Cells. Anticancer Agents Med. Chem. 2021, 22, 1111–1118. [Google Scholar] [CrossRef]
  10. Lei, X.; Lv, X.; Liu, M.; Yang, Z.; Ji, M.; Guo, X.; Dong, W. Thymoquinone Inhibits Growth and Augments 5-Fluorouracil-Induced Apoptosis in Gastric Cancer Cells Both in Vitro and in Vivo. Biochem. Biophys. Res. Commun. 2012, 417, 864–868. [Google Scholar] [CrossRef]
  11. Alkharfy, K.M.; Ahmad, A.; Khan, R.M.A.; Al-Shagha, W.M. Pharmacokinetic Plasma Behaviors of Intravenous and Oral Bioavailability of Thymoquinone in a Rabbit Model. Eur. J. Drug Metab. Pharmacokinet. 2015, 40, 319–323. [Google Scholar] [CrossRef] [PubMed]
  12. Salmani, J.M.M.; Asghar, S.; Lv, H.; Zhou, J. Aqueous Solubility and Degradation Kinetics of the Phytochemical Anticancer Thymoquinone; Probing the Effects of Solvents, PH and Light. Molecules 2014, 19, 5925–5939. [Google Scholar] [CrossRef]
  13. Bhattacharya, S.; Ahir, M.; Patra, P.; Mukherjee, S.; Ghosh, S.; Mazumdar, M.; Chattopadhyay, S.; Das, T.; Chattopadhyay, D.; Adhikary, A. PEGylated-Thymoquinone-Nanoparticle Mediated Retardation of Breast Cancer Cell Migration by Deregulation of Cytoskeletal Actin Polymerization through MiR-34a. Biomaterials 2015, 51, 91–107. [Google Scholar] [CrossRef]
  14. Ibrahim, W.N.; Rosli, L.M.B.M.; Doolaanea, A.A. Formulation, Cellular Uptake and Cytotoxicity of Thymoquinone-Loaded Plga Nanoparticles in Malignant Melanoma Cancer Cells. Int. J. Nanomed. 2020, 15, 8059–8074. [Google Scholar] [CrossRef] [PubMed]
  15. Shi, J.; Kantoff, P.W.; Wooster, R.; Farokhzad, O.C. Cancer Nanomedicine: Progress, Challenges and Opportunities. Nat. Rev. Cancer 2017, 17, 20–37. [Google Scholar] [CrossRef] [PubMed]
  16. Senapati, S.; Mahanta, A.K.; Kumar, S.; Maiti, P. Controlled Drug Delivery Vehicles for Cancer Treatment and Their Performance. Signal Transduct. Target. Ther. 2018, 3, 7. [Google Scholar] [CrossRef]
  17. Yakubova, A.A.; Mitusova, K.A.; Darwish, A.; Rogova, A.; Ageev, E.I.; Brodskaia, A.; Muslimov, A.R.; Zyuzin, M.V.; Timin, A.S. Calcium Carbonate Nanoparticles Tumor Delivery for Combined Chemo-Photodynamic Therapy: Comparison of Local and Systemic Administration. J. Control. Release 2023, 359, 400–414. [Google Scholar] [CrossRef]
  18. Bastos, F.R.; Soares da Costa, D.; Reis, R.L.; Alves, N.M.; Pashkuleva, I.; Costa, R.R. Layer-by-Layer Coated Calcium Carbonate Nanoparticles for Targeting Breast Cancer Cells. Biomater. Adv. 2023, 153, 213563. [Google Scholar] [CrossRef]
  19. Yu, J.; Wang, L.; Xie, X.; Yu, H.; Xu, J.; Ren, J.; Zhu, W.; Lei, Z.; Lv, L. Multifunctional Nanoparticles Codelivering Doxorubicin and Amorphous Calcium Carbonate Preloaded with Indocyanine Green for Enhanced Chemo-Photothermal Cancer Therapy. Int. J. Nanomed. 2023, 18, 323–337. [Google Scholar] [CrossRef]
  20. Zhou, F.; Li, H.; Liu, Y.; Deng, H.; Rong, J.; Zhao, J. Hyaluronan Derivative Decorated Calcium Carbonate Nanoparticle as a Potential Platform for Breast Cancer Synergistic Therapy via Blood Coagulation and Drug Delivery. J. Drug Deliv. Sci. Technol. 2023, 83, 104406. [Google Scholar] [CrossRef]
  21. Xu, D.; Jin, T.; Song, L.; Zhu, N.; Han, L.; Hong, H. Synthesis of Stable Calcium Carbonate Nanoparticles for PH-Responsive Controlled Drug Release. Mater. Lett. 2023, 333, 133635. [Google Scholar] [CrossRef]
  22. Huang, H.; Zhang, W.; Liu, Z.; Guo, H.; Zhang, P. Smart Responsive-Calcium Carbonate Nanoparticles for Dual-Model Cancer Imaging and Treatment. Ultrasonics 2020, 108, 106198. [Google Scholar] [CrossRef] [PubMed]
  23. Zhao, Y.; Zheng, Y.; Zhu, Y.; Ding, K.; Zhou, M.; Liu, T. Co-Delivery of Gemcitabine and Triapine by Calcium Carbonate Nanoparticles against Chemoresistant Pancreatic Cancer. Int. J. Pharm. 2023, 636, 122844. [Google Scholar] [CrossRef]
  24. Yang, T.; Wan, Z.; Liu, Z.; Li, H.; Wang, H.; Lu, N.; Chen, Z.; Mei, X.; Ren, X. In Situ Mineralization of Anticancer Drug into Calcium Carbonate Monodisperse Nanospheres and Their PH-Responsive Release Property. Mater. Sci. Eng. C 2016, 63, 384–392. [Google Scholar] [CrossRef] [PubMed]
  25. Dong, Z.; Feng, L.; Hao, Y.; Li, Q.; Chen, M.; Yang, Z.; Zhao, H.; Liu, Z. Synthesis of CaCO3-Based Nanomedicine for Enhanced Sonodynamic Therapy via Amplification of Tumor Oxidative Stress. Chem 2020, 6, 1391–1407. [Google Scholar] [CrossRef]
  26. Isa, T.; Zakaria, Z.A.B.; Rukayadi, Y.; Hezmee, M.N.M.; Jaji, A.Z.; Imam, M.U.; Hammadi, N.I.; Mahmood, S.K. Antibacterial Activity of Ciprofloxacin-Encapsulated Cockle Shells Calcium Carbonate (Aragonite) Nanoparticles and Its Biocompatability in Macrophage J774A.1. Int. J. Mol. Sci. 2016, 17, 713. [Google Scholar] [CrossRef]
  27. Chemmalar, S.; Intan-Shameha, A.R.; Abdullah, C.A.C.; Razak, N.A.A.; Yusof, L.M.; Ajat, M.; Gowthaman, N.S.K.; Bakar, M.Z.A. Synthesis and Characterization of Gefitinib and Paclitaxel Mono and Dual Drug-Loaded Blood Cockle Shells (Anadara Granosa)-Derived Aragonite CaCO3 Nanoparticles. Nanomaterials 2021, 11, 1988. [Google Scholar] [CrossRef]
  28. Tsuzuki, T. Commercial Scale Production of Inorganic Nanoparticles. Int. J. Nanotechnol. 2009, 6, 567–568. [Google Scholar] [CrossRef]
  29. Islam, K.N.; Bakar, M.Z.B.A.; Ali, M.E.; Hussein, M.Z.B.; Noordin, M.M.; Loqman, M.Y.; Miah, G.; Wahid, H.; Hashim, U. A Novel Method for the Synthesis of Calcium Carbonate (Aragonite) Nanoparticles from Cockle Shells. Powder Technol. 2013, 235, 70–75. [Google Scholar] [CrossRef]
  30. Banti, C.N.; Hadjikakou, S.K. Evaluation of Toxicity with Brine Shrimp Assay. Bio Protoc. 2021, 11, e3895. [Google Scholar] [CrossRef]
  31. Chou, T.-C. Preclinical versus Clinical Drug Combination Studies. Leuk. Lymphoma 2008, 49, 2059–2080. [Google Scholar] [CrossRef] [PubMed]
  32. Trushina, D.B.; Borodina, T.N.; Belyakov, S.; Antipina, M.N. Calcium Carbonate Vaterite Particles for Drug Delivery: Advances and Challenges. Mater. Today Adv. 2022, 14, 100214. [Google Scholar] [CrossRef] [PubMed]
  33. Sharma, N.; Madan, P.; Lin, S. Effect of Process and Formulation Variables on the Preparation of Parenteral Paclitaxel-Loaded Biodegradable Polymeric Nanoparticles: A Co-Surfactant Study. Asian J. Pharm. Sci. 2016, 11, 404–416. [Google Scholar] [CrossRef]
  34. Mo, R.; Gu, Z. Tumor Microenvironment and Intracellular Signal-Activated Nanomaterials for Anticancer Drug Delivery. Mater. Today 2016, 19, 274–283. [Google Scholar] [CrossRef]
  35. Farzan, M.; Roth, R.; Schoelkopf, J.; Huwyler, J.; Puchkov, M. The Processes behind Drug Loading and Release in Porous Drug Delivery Systems. Eur. J. Pharm. Biopharm. 2023, 189, 133–151. [Google Scholar] [CrossRef]
  36. Costa, P.; Sousa Lobo, J.M. Modeling and Comparison of Dissolution Profiles. Eur. J. Pharm. Sci. 2001, 13, 123–133. [Google Scholar] [CrossRef]
  37. ISO ISO 10993-5:2009; Biological Evaluation of Medical Devices–Part 5: Tests for In Vitro Cytotoxicity. International Organization for Standardization: Geneva, Switzerland, 2009.
  38. Mukhopadhyay, S.; Veroniaina, H.; Chimombe, T.; Han, L.; Zhenghong, W.; Xiaole, Q. Synthesis and Compatibility Evaluation of Versatile Mesoporous Silica Nanoparticles with Red Blood Cells: An Overview. RSC Adv. 2019, 9, 35566–35578. [Google Scholar] [CrossRef]
  39. Sæbø, I.P.; Bjørås, M.; Franzyk, H.; Helgesen, E.; Booth, J.A. Optimization of the Hemolysis Assay for the Assessment of Cytotoxicity. Int. J. Mol. Sci. 2023, 24, 2914. [Google Scholar] [CrossRef] [PubMed]
  40. Amin, K.; Dannenfelser, R.M. In Vitro Hemolysis: Guidance for the Pharmaceutical Scientist. J. Pharm. Sci. 2006, 95, 1173–1176. [Google Scholar] [CrossRef]
  41. Rajabi, S.; Ramazani, A.; Hamidi, M.; Naji, T. Artemia Salina as a Model Organism in Toxicity Assessment of Nanoparticles. DARU J. Pharm. Sci. 2015, 23, 20. [Google Scholar] [CrossRef]
  42. Pinheiro, S.K.D.P.; Lima, A.K.M.; Miguel, T.B.A.R.; Filho, A.G.S.; Ferreira, O.P.; Pontes, M.D.S.; Grillo, R.; Miguel, E.D.C. Assessing Toxicity Mechanism of Silver Nanoparticles by Using Brine Shrimp (Artemia Salina) as Model. Chemosphere 2023, 347, 140673. [Google Scholar] [CrossRef] [PubMed]
  43. Clarkson, C.; Maharaj, V.J.; Crouch, N.R.; Grace, O.M.; Pillay, P.; Matsabisa, M.G.; Bhagwandin, N.; Smith, P.J.; Folb, P.I. In Vitro Antiplasmodial Activity of Medicinal Plants Native to or Naturalised in South Africa. J. Ethnopharmacol. 2004, 92, 177–191. [Google Scholar] [CrossRef] [PubMed]
  44. Nath, S.; Devi, G.R. Three-Dimensional Culture Systems in Cancer Research: Focus on Tumor Spheroid Model. Pharmacol. Ther. 2016, 163, 94–108. [Google Scholar] [CrossRef] [PubMed]
  45. Mehta, G.; Hsiao, A.Y.; Ingram, M.; Luker, G.D.; Takayama, S. Opportunities and Challenges for Use of Tumor Spheroids as Models to Test Drug Delivery and Efficacy. J. Control. Release 2012, 164, 192–204. [Google Scholar] [CrossRef]
  46. Longley, D.B.; Harkin, D.P.; Johnston, P.G. 5-Fluorouracil: Mechanisms of Action and Clinical Strategies. Nat. Rev. Cancer 2003, 3, 330–338. [Google Scholar] [CrossRef]
  47. Cho, Y.H.; Ro, E.J.; Yoon, J.S.; Mizutani, T.; Kang, D.W.; Park, J.C.; Kim, T., II; Clevers, H.; Choi, K.Y. 5-FU Promotes Stemness of Colorectal Cancer via P53-Mediated WNT/β-Catenin Pathway Activation. Nat. Commun. 2020, 11, 5321. [Google Scholar] [CrossRef]
  48. Vázquez, C.; Orlova, M.; Angriman, F.; Minatta, J.N.; Scibona, P.; Verzura, M.A.; Jáuregui, E.G.; Díaz De Arce, H.; Pallotta, M.G.; Belloso, W.H. Prediction of Severe Toxicity in Adult Patients under Treatment with 5-Fluorouracil: A Prospective Cohort Study. Anticancer Drugs 2017, 28, 1039–1046. [Google Scholar] [CrossRef]
  49. Helmy, S.A.; El-Mesery, M.; El-Karef, A.; Eissa, L.A.; El Gayar, A.M. Thymoquinone Upregulates TRAIL/TRAILR2 Expression and Attenuates Hepatocellular Carcinoma in Vivo Model. Life Sci. 2019, 233, 116673. [Google Scholar] [CrossRef]
  50. Xu, J.; Zhu, L.; Liu, H.; Li, M.; Liu, Y.; Yang, F.; Pei, Z. Thymoquinone Reduces Cardiac Damage Caused by Hypercholesterolemia in Apolipoprotein E-Deficient Mice. Lipids Health Dis. 2018, 17, 173. [Google Scholar] [CrossRef]
  51. Velagapudi, R.; Kumar, A.; Bhatia, H.S.; El-Bakoush, A.; Lepiarz, I.; Fiebich, B.L.; Olajide, O.A. Inhibition of Neuroinflammation by Thymoquinone Requires Activation of Nrf2/ARE Signalling. Int. Immunopharmacol. 2017, 48, 17–29. [Google Scholar] [CrossRef]
  52. Velagapudi, R.; El-Bakoush, A.; Lepiarz, I.; Ogunrinade, F.; Olajide, O.A. AMPK and SIRT1 Activation Contribute to Inhibition of Neuroinflammation by Thymoquinone in BV2 Microglia. Mol. Cell. Biochem. 2017, 435, 149–162. [Google Scholar] [CrossRef]
  53. Madani, F.; Kazemi, S.; Shirafkan, F.; Lotfi, M.; Hosseini, S.M.; Moghadamnia, A.A. Thymoquinone Protects against 5-Fluorouracil-Induced Mucositis by NF-Κβ and HIF-1 Mechanisms in Mice. J. Biochem. Mol. Toxicol. 2023, 37, e23405. [Google Scholar] [CrossRef] [PubMed]
  54. Khan, M.A.; Younus, H. Thymoquinone Shows the Diverse Therapeutic Actions by Modulating Multiple Cell Signaling Pathways: Single Drug for Multiple Targets. Curr. Pharm. Biotechnol. 2018, 19, 934–945. [Google Scholar] [CrossRef] [PubMed]
  55. Safavi, M.S.; Shojaosadati, S.A.; Dorkoosh, F.A.; Jo, H.J.; Kwon, Y.; Lee, K.C.; Yang, H.G.; Park, E.J.; Na, D.H. The Synthesis of Tamoxifen-Loaded Albumin Nanoparticles by Homogenizers: Optimization and in Vitro Characterization. J. Drug Deliv. Sci. Technol. 2017, 41, 20–30. [Google Scholar] [CrossRef]
  56. Dey, D.; Kumar, P.; Samantaray, S. A Review of Nanofluid Preparation, Stability, and Thermo-Physical Properties. Heat Transf. -Asian Res. 2017, 46, 1413–1442. [Google Scholar] [CrossRef]
  57. Deng, X.; Yang, Z.; Chan, K.W.; Abu Bakar, M.Z. Exploring the Therapeutic Potential of 5-Fluorouracil-Loaded Calcium Carbonate Nanoparticles Combined with Natural Compound Thymoquinone for Colon Cancer Treatment. Pharmaceutics 2024, 16, 1011. [Google Scholar] [CrossRef]
  58. Haq, A.; Michniak-Kohn, B. Effects of Solvents and Penetration Enhancers on Transdermal Delivery of Thymoquinone: Permeability and Skin Deposition Study. Drug Deliv. 2018, 25, 1943–1949. [Google Scholar] [CrossRef]
  59. Zorrilla-Veloz, R.I.; Stelzer, T.; López-Mejías, V. Measurement and Correlation of the Solubility of 5-Fluorouracil in Pure and Binary Solvents. J. Chem. Eng. Data 2018, 63, 3809–3817. [Google Scholar] [CrossRef]
  60. Fang, H.; Ni, K.; Wu, J.; Li, J.; Huang, L.; Reible, D. The Effects of Hydrogen Bonding on the Shear Viscosity of Liquid Water. Int. J. Sediment Res. 2019, 34, 8–13. [Google Scholar] [CrossRef]
  61. Tadano, T.; Zhu, R.; Muroga, Y.; Hoshi, T.; Sasaki, D.; Yano, S.; Sawaguchi, T. A New Mechanism for the Silica Nanoparticle Dispersion-Agglomeration Transition in a Poly(Methyl Methacrylate)/Silica Hybrid Suspension. Polym. J. 2014, 46, 342–348. [Google Scholar] [CrossRef]
  62. Di, J.; Gao, X.; Du, Y.; Zhang, H.; Gao, J.; Zheng, A. Size, Shape, Charge and “Stealthy” Surface: Carrier Properties Affect the Drug Circulation Time in Vivo. Asian J. Pharm. Sci. 2021, 16, 444–458. [Google Scholar] [CrossRef] [PubMed]
  63. Minkowicz, L.; Dagan, A.; Uvarov, V.; Benny, O. Controlling Calcium Carbonate Particle Morphology, Size, and Molecular Order Using Silicate. Materials 2021, 14, 3525. [Google Scholar] [CrossRef] [PubMed]
  64. Kiranda, H.K.; Mahmud, R.; Abubakar, D.; Zakaria, Z.A. Fabrication, Characterization and Cytotoxicity of Spherical-Shaped Conjugated Gold-Cockle Shell Derived Calcium Carbonate Nanoparticles for Biomedical Applications. Nanoscale Res. Lett. 2018, 13, 1. [Google Scholar] [CrossRef]
  65. Tavangar, A.; Tan, B.; Venkatakrishnan, K. Synthesis of Three-Dimensional Calcium Carbonate Nanofibrous Structure from Eggshell Using Femtosecond Laser Ablation. J. Nanobiotechnology 2011, 9, 1. [Google Scholar] [CrossRef] [PubMed]
  66. Febrida, R.; Cahyanto, A.; Herda, E.; Muthukanan, V.; Djustiana, N.; Faizal, F.; Panatarani, C.; Joni, I.M. Synthesis and Characterization of Porous CaCO3 Vaterite Particles by Simple Solution Method. Materials 2021, 14, 4425. [Google Scholar] [CrossRef]
  67. Niu, B.; Chen, H.; Wu, W.; Fang, X.; Mu, H.; Han, Y.; Gao, H. Co-Encapsulation of Chlorogenic Acid and Cinnamaldehyde Essential Oil in Pickering Emulsion Stablized by Chitosan Nanoparticles. Food Chem. X 2022, 14, 100312. [Google Scholar] [CrossRef]
  68. Sun, L.; Chen, Y.; Zhou, Y.; Guo, D.; Fan, Y.; Guo, F.; Zheng, Y.; Chen, W. Preparation of 5-Fluorouracil-Loaded Chitosan Nanoparticles and Study of the Sustained Release in Vitro and in Vivo. Asian J. Pharm. Sci. 2017, 12, 418–423. [Google Scholar] [CrossRef] [PubMed]
  69. Adepu, S.; Ramakrishna, S. Controlled Drug Delivery Systems: Current Status and Future Directions. Molecules 2021, 26, 5905. [Google Scholar] [CrossRef]
  70. Chou, T.-C. Drug Combination Studies and Their Synergy Quantification Using the Chou-Talalay Method. Cancer Res. 2010, 70, 440–446. [Google Scholar] [CrossRef]
  71. Xie, X.; Li, Y.; Lian, S.; Lu, Y.; Jia, L. Cancer Metastasis Chemoprevention Prevents Circulating Tumour Cells from Germination. Signal Transduct. Target. Ther. 2022, 7, 341. [Google Scholar] [CrossRef]
  72. Jiang, W.G.; Sanders, A.J.; Katoh, M.; Ungefroren, H.; Gieseler, F.; Prince, M.; Thompson, S.K.; Zollo, M.; Spano, D.; Dhawan, P.; et al. Tissue Invasion and Metastasis: Molecular, Biological and Clinical Perspectives. Semin. Cancer Biol. 2015, 35, S244–S275. [Google Scholar] [CrossRef]
  73. Jubelin, C.; Muñoz-Garcia, J.; Griscom, L.; Cochonneau, D.; Ollivier, E.; Heymann, M.-F.; Vallette, F.M.; Oliver, L.; Heymann, D. Three-Dimensional in Vitro Culture Models in Oncology Research. Cell Biosci. 2022, 12, 155. [Google Scholar] [CrossRef] [PubMed]
  74. Recanatini, M.; Cabrelle, C. Drug Research Meets Network Science: Where Are We? J. Med. Chem. 2020, 63, 8653–8666. [Google Scholar] [CrossRef] [PubMed]
  75. Kennelly, R.; Kavanagh, D.O.; Hogan, A.M.; Winter, D.C. Oestrogen and the Colon: Potential Mechanisms for Cancer Prevention. Lancet Oncol. 2008, 9, 385–391. [Google Scholar] [CrossRef] [PubMed]
  76. Topi, G.; Satapathy, S.R.; Ghatak, S.; Hellman, K.; Ek, F.; Olsson, R.; Ehrnström, R.; Lydrup, M.L.; Sjölander, A. High Oestrogen Receptor Alpha Expression Correlates with Adverse Prognosis and Promotes Metastasis in Colorectal Cancer. Cell Commun. Signal. 2024, 22, 198. [Google Scholar] [CrossRef] [PubMed]
  77. Meng, Y.-W.; Liu, J.-Y. Pathological and Pharmacological Functions of the Metabolites of Polyunsaturated Fatty Acids Mediated by Cyclooxygenases, Lipoxygenases, and Cytochrome P450s in Cancers. Pharmacol. Ther. 2024, 256, 108612. [Google Scholar] [CrossRef]
  78. Lee, S.I.L.; Zuo, X.; Shureiqi, I. 15-Lipoxygenase-1 as a Tumor Suppressor Gene in Colon Cancer: Is the Verdict In? Cancer Metastasis Rev. 2011, 30, 481–491. [Google Scholar] [CrossRef] [PubMed]
  79. Zuo, X.; Peng, Z.; Wu, Y.; Moussalli, M.J.; Yang, X.L.; Wang, Y.; Parker-Thornburg, J.; Morris, J.S.; Broaddus, R.R.; Fischer, S.M.; et al. Effects of Gut-Targeted 15-LOX-1 Transgene Expression on Colonic Tumorigenesis in Mice. J. Natl. Cancer Inst. 2012, 104, 709–716. [Google Scholar] [CrossRef]
  80. Liu, F.; Zuo, X.; Liu, Y.; Deguchi, Y.; Moussalli, M.J.; Chen, W.; Yang, P.; Wei, B.; Tan, L.; Lorenzi, P.L.; et al. Suppression of Membranous LRP5 Recycling, Wnt/β-Catenin Signaling, and Colon Carcinogenesis by 15-LOX-1 Peroxidation of Linoleic Acid in PI3P. Cell Rep. 2020, 32, 108049. [Google Scholar] [CrossRef]
  81. Wang, W.; Yang, J.; Edin, M.L.; Wang, Y.; Luo, Y.; Wan, D.; Yang, H.; Song, C.Q.; Xue, W.; Sanidad, K.Z.; et al. Targeted Metabolomics Identifies the Cytochrome P450 Monooxygenase Eicosanoid Pathway as a Novel Therapeutic Target of Colon Tumorigenesis. Cancer Res. 2019, 79, 1822–1830. [Google Scholar] [CrossRef]
  82. Beyerle, J.; Holowatyj, A.N.; Haffa, M.; Frei, E.; Gigic, B.; Schrotz-King, P.; Boehm, J.; Habermann, N.; Stiborova, M.; Scherer, D.; et al. Expression Patterns of Xenobiotic-Metabolizing Enzymes in Tumor and Adjacent Normal Mucosa Tissues among Patients with Colorectal Cancer: The Colo Care Study. Cancer Epidemiol. Biomark. Prev. 2020, 29, 460–469. [Google Scholar] [CrossRef] [PubMed]
  83. Custodio, A.; Feliu, J. Prognostic and Predictive Biomarkers for Epidermal Growth Factor Receptor-Targeted Therapy in Colorectal Cancer: Beyond KRAS Mutations. Crit. Rev. Oncol. Hematol. 2013, 85, 45–81. [Google Scholar] [CrossRef] [PubMed]
  84. Voisin, L.; Julien, C.; Duhamel, S.; Gopalbhai, K.; Claveau, I.; Saba-El-Leil, M.K.; Rodrigue-Gervais, I.; Gaboury, L.; Lamarre, D.; Basik, M.; et al. Activation of MEK1 or MEK2 Isoform Is Sufficient to Fully Transform Intestinal Epithelial Cells and Induce the Formation of Metastatic Tumors. BMC Cancer 2008, 8, 337. [Google Scholar] [CrossRef]
  85. Caunt, C.J.; Sale, M.J.; Smith, P.D.; Cook, S.J. MEK1 and MEK2 Inhibitors and Cancer Therapy: The Long and Winding Road. Nat. Rev. Cancer 2015, 15, 577–592. [Google Scholar] [CrossRef]
  86. Willis, O.; Choucair, K.; Alloghbi, A.; Stanbery, L.; Mowat, R.; Charles Brunicardi, F.; Dworkin, L.; Nemunaitis, J. PIK3CA Gene Aberrancy and Role in Targeted Therapy of Solid Malignancies. Cancer Gene Ther. 2020, 27, 634–644. [Google Scholar] [CrossRef] [PubMed]
  87. Zehir, A.; Benayed, R.; Shah, R.H.; Syed, A.; Middha, S.; Kim, H.R.; Srinivasan, P.; Gao, J.; Chakravarty, D.; Devlin, S.M.; et al. Mutational Landscape of Metastatic Cancer Revealed from Prospective Clinical Sequencing of 10,000 Patients. Nat. Med. 2017, 23, 703–713. [Google Scholar] [CrossRef]
  88. Mei, Z.B.; Duan, C.Y.; Li, C.B.; Cui, L.; Ogino, S. Prognostic Role of Tumor PIK3CA Mutation in Colorectal Cancer: A Systematic Review and Meta-Analysis. Ann. Oncol. 2016, 27, 1836–1848. [Google Scholar] [CrossRef]
  89. Vallejo-Díaz, J.; Chagoyen, M.; Olazabal-Morán, M.; González-García, A.; Carrera, A.C. The Opposing Roles of PIK3R1/P85α and PIK3R2/P85β in Cancer. Trends Cancer 2019, 5, 233–244. [Google Scholar] [CrossRef]
  90. Zhou, M.; Liu, X.; Li, Z.; Huang, Q.; Li, F.; Li, C.Y. Caspase-3 Regulates the Migration, Invasion and Metastasis of Colon Cancer Cells. Int. J. Cancer 2018, 143, 921–930. [Google Scholar] [CrossRef]
  91. Eskandari, E.; Eaves, C.J. Paradoxical Roles of Caspase-3 in Regulating Cell Survival, Proliferation, and Tumorigenesis. J. Cell Biol. 2022, 221, e202201159. [Google Scholar] [CrossRef]
  92. Patel, M.; Horgan, P.G.; McMillan, D.C.; Edwards, J. NF-ΚB Pathways in the Development and Progression of Colorectal Cancer. Transl. Res. 2018, 197, 43–56. [Google Scholar] [CrossRef] [PubMed]
  93. Pinton, P.; Giorgi, C.; Siviero, R.; Zecchini, E.; Rizzuto, R. Calcium and Apoptosis: ER-Mitochondria Ca2+ Transfer in the Control of Apoptosis. Oncogene 2008, 27, 6407–6418. [Google Scholar] [CrossRef] [PubMed]
  94. Can, G.; Akpinar, B.; Baran, Y.; Zhivotovsky, B.; Olsson, M. 5-Fluorouracil Signaling through a Calcium-Calmodulin-Dependent Pathway Is Required for P53 Activation and Apoptosis in Colon Carcinoma Cells. Oncogene 2013, 32, 4529–4538. [Google Scholar] [CrossRef] [PubMed]
Figure 1. (A) Schematic illustration of CaCO3 NPs and TQ-CaCO3 NPs synthesis; (B) LC and EE of TQ in TQ-CaCO3 NPs at varying weight ratios between TQ and CaCO3 NPs, using a shaking incubator for compound loading; (C) LC and EE of TQ in TQ-CaCO3 NPs at varying speeds in the single-factor experiment; (D) LC and EE of TQ in TQ-CaCO3 NPs at varying times in the single-factor experiment; (E) LC and EE of TQ in TQ-CaCO3 NPs at varying weight ratios between TQ and CaCO3 NPs, using a high-speed homogenizer for compound loading; (F) comparison of optimized loading results obtained using a shaking incubator and a high-speed homogenizer. The results with the different superscripts (a–f and A–E nomenclature) indicate significant differences (p < 0.05). ** p < 0.01, **** p < 0.0001. LC, loading content; EE, encapsulation efficiency.
Antioxidants 13 01030 g001
Figure 2. Surface morphology of CaCO3 NPs and TQ-CaCO3 NPs in (A) FESEM and (B) HRTEM; (C) particle size distribution of CaCO3 NPs and TQ-CaCO3 NPs in HRTEM; (D) hydrodynamic size and (E) zeta potential of CaCO3 NPs and TQ-CaCO3 NPs; (F) XRD patterns of CaCO3 NPs, TQ-CaCO3 NPs, and the reference diffraction peak (PDF#75-2230) of aragonite calcium carbonate nanoparticles from Inorganic Crystal Structure Database. Those labeled are the Miller indices planes (characteristic peaks of aragonite phase); (G) XRD pattern comparison between TQ and TQ-CaCO3 NPs; (H) orthorhombic crystalline morphology of aragonite CaCO3 NPs; (I) FTIR spectra of CaCO3 NPs, TQ-CaCO3 NPs, and TQ. (J) in vitro compound release profiles of TQ-CaCO3 NPs and TQ in PBS with 1% (v/v) Tween 80 at 37 °C and pH 7.4, 6.5, and 5.0. FESEM, field emission scanning electron microscopy; HRTEM, high-resolution transmission electron microscopy; XRD, X-ray diffraction; FTIR, Fourier transform infrared spectroscopy; PBS, phosphate-buffered saline.
Antioxidants 13 01030 g002
Figure 3. Cytotoxicity of (A) CaCO3 NPs (concentrations: 0–1000 μg/mL), as well as (B) TQ and TQ-CaCO3 NPs (TQ concentrations: 0–60 μM) in NIH3T3 embryonic fibroblast cell line for 96 h; (C) hemolysis phenomena and (D) hemolysis ratios of CaCO3 NPs and TQ-CaCO3 NPs. PBS solution and ddH2O were used as the negative (0% hemolysis) and positive control (100% hemolysis), respectively. The solution with red color means the release of hemoglobin from the damaged erythrocytes, and the red pellet at the bottom of the tube is intact erythrocytes after centrifugation; (E) morphology of live brine shrimp at 4× and 10× magnifications; (F) morphology of dead brine shrimp at 4× and 10× magnifications. ** p < 0.01, **** p < 0.0001. PBS, phosphate-buffered saline; ddH2O, deionized water.
Antioxidants 13 01030 g003
Figure 4. (A) Cytotoxicity of TQ-CaCO3 NPs (TQ concentrations: 0–60 μM) and 5-FU (concentrations: 0–480 μM) on CT26 cells for 96 h; (B) combination index heat map of TQ-CaCO3 NPs and 5-FU in combination against CT26 cells; (C) colony-formation assay of CT26 cells treated with TQ-CaCO3 NPs (15 μM) and 5-FU (7.5 μM) alone or in combination, with the represented images under 10× and 20× magnification; (D) AO/PI staining assay of CT26 cells treated with TQ-CaCO3 NPs (15 μM) and 5-FU (7.5 μM) alone or in combination, with the represented images under 20× magnification, where viable cells in green by AO staining and non-viable cells in red due to PI staining. * p < 0.05, ** p < 0.01, *** p < 0.001, **** p < 0.0001.
Antioxidants 13 01030 g004
Figure 5. (A) Cell cycle assay of CT26 cells treated with TQ-CaCO3 NPs (15 μM) and 5-FU (7.5 μM) alone or in combination, with the represented images displaying cell cycle distributions; (B) Annexin V-FITC assay of CT26 cells treated with TQ-CaCO3 NPs (15 μM) and 5-FU (7.5 μM) alone or in combination, with the represented images depicting cells in different quadrants: necrosis (Q1), late apoptosis (Q2), early apoptosis (Q3), and live (Q4), where Q2 and Q3 are collectively called apoptotic cells; (C) wound-healing assay of CT26 cells treated with TQ-CaCO3 NPs (15 μM) and 5-FU (7.5 μM) alone or in combination, with the represented images under 10× magnification showing cell migration after 24 and 48 h. * p < 0.05, ** p < 0.01, *** p < 0.001, **** p < 0.0001.
Antioxidants 13 01030 g005
Figure 6. (A) CT26 spheroid growth analysis for culturing for 13 days, with the represented images under 4× magnification showing that spheroid size and growth trend depend on the initial cell seeding density (2000 to 20,000 cells/well); (B) growth-inhibition analysis of CT26 spheroids treated with TQ-CaCO3 NPs (15 μM) and 5-FU (7.5 μM) alone or in combination, with the represented images under 4× magnification displaying the spheroid volume and growth inhibition. * p < 0.05, ** p < 0.01, **** p < 0.0001.
Antioxidants 13 01030 g006
Figure 7. (A) 5-FU-target network; (B) TQ-target network; (C) Venn diagram of colon cancer-related targets from the 5 databases; (D) volcano map of all differential genes, with red dots for up-regulated genes and blue dots for down-regulated genes; (E) heat map of top 40 differential genes; (F) Venn diagram of colon cancer-related targets from the 5 databases and GSE74602 dataset; (G) Venn diagram of 5-FU, TQ, and colon cancer-related targets, with a total of 119 intersection genes.
Antioxidants 13 01030 g007
Figure 8. (A) PPI network of the 74 core genes in STRING database; (B) PPI network of the 74 genes, where the deeper the color and the bigger the size, the more significant the target is for colon cancer treatment by 5-FU in combination with TQ; (C) the top 10 BPs with corresponding genes, where the size of the dot in the diagram represents the number of genes; (D) GO functional annotation of the 74 genes: the top 10 entries of BP, CC, and MF. BP, biological process; CC, cellular component; MF, molecular function.
Antioxidants 13 01030 g008
Figure 9. (A) KEGG pathway enrichment of the 74 core genes: the top 30 enriched pathways; (B) pathway–target network, where the deeper the color, the more genes from the 74 targets involved in the pathway; (C) chemical carcinogenesis-receptor activation pathway and (D) colorectal cancer pathway, where red marks represent the genes from the 74 targets.
Antioxidants 13 01030 g009
Figure 10. Schematic diagram of molecular docking between 5-FU and TQ and (A) MAP2K2, (B) CASP3, (C) PIK3CA, (D) ESR1, (E) CYP3A4, (F) CYP2C19, as well as (G) CYP2C9.
Antioxidants 13 01030 g010aAntioxidants 13 01030 g010b
Table 1. Elemental compositions of CaCO3 NPs, TQ-CaCO3 NPs, and TQ.
NanoparticlesC (%)O (%)Ca (%)Na (%)N (%)F (%)
CaCO3 NPs16.0662.4221.270.2500
TQ-CaCO3 NPs17.4262.0020.58000
TQ79.5820.420000
Table 2. Lattice parameters of CaCO3 NPs and TQ-CaCO3 NPs.
Nanoparticlesa (Å)b (Å)c (Å)α (°)β (°)γ (°)Crystallite Size (Å)Crystallinity (%)
CaCO3 NPs4.966627.964805.7486090909082796.35
TQ-CaCO3 NPs4.962837.965305.7432590909084898.18
Table 3. FTIR peak assignments of CaCO3 NPs and TQ-CaCO3 NPs. FTIR, Fourier transform infrared spectroscopy.
Peak AssignmentWavenumber (cm−1)
CaCO3 NPsTQ-CaCO3 NPs
In-plane C-O bending707.47707.47
Out of plane C-O bending854.80851.60
Symmetric C-O stretching1082.211082.21
Asymmetric C-O stretching1450.531447.33
Symmetric C-O stretching; in-plane C-O bending1783.631783.63
Table 4. Kinetic analysis of TQ releases from TQ-CaCO3 NPs at pH of 7.4, 6.5, and 5.0 using various kinetic models. R2, regression coefficient; n, release exponent.
FormulationpHZero-Order Model R2First-Order Model R2Higuchi Model R2Hixon–Crowell Model R2Korsmeyer–Peppas Model
R2n
TQ-CaCO3 NPs7.40.950130.945270.983530.954860.985780.57060
6.50.921440.953020.983630.935120.982660.53670
5.00.905260.927930.985570.925710.987650.45530
Table 5. Molecular docking binding energy of 5-FU and TQ with the hub targets.
TargetsPDB IDLigandsBinding Energy (kcal/Mol)
MAP2K21S9I5-FU−4.89
TQ−6.12
CASP33KJF5-FU−4.45
TQ−4.57
PIK3CA5DXT5-FU−4.80
TQ−5.40
ESR16DFN5-FU−5.07
TQ−6.35
CYP3A48SO15-FU−5.31
TQ−6.79
CYP2C194GQS5-FU−5.08
TQ−6.25
CYP2C97RL25-FU−5.19
TQ−6.16
Disclaimer/Publisher’s Note: The statements, opinions and data contained in all publications are solely those of the individual author(s) and contributor(s) and not of MDPI and/or the editor(s). MDPI and/or the editor(s) disclaim responsibility for any injury to people or property resulting from any ideas, methods, instructions or products referred to in the content.

