Article

Senescence Rejuvenation through Reduction in Mitochondrial Reactive Oxygen Species Generation by Polygonum cuspidatum Extract: In Vitro Evidence

1
Division of Life Sciences, College of Life Sciences and Bioengineering, Incheon National University, Incheon 22012, Republic of Korea
2
Hyundai Bioland Co., Ltd., 22, Osongsaengmyeong 2-ro, Osong-eup, Heungdeok-gu, Cheongju-si 28162, Republic of Korea
3
College of Pharmacy, Korea University, Sejong 30019, Republic of Korea
4
Convergence Research Center for Insect Vectors, Incheon National University, Incheon 22012, Republic of Korea
*
Authors to whom correspondence should be addressed.
These authors have contributed equally to this work as co-first authors.
These authors have contributed equally to this work as co-second authors.
Antioxidants 2024, 13(9), 1110; https://doi.org/10.3390/antiox13091110
Submission received: 16 July 2024 / Revised: 5 September 2024 / Accepted: 10 September 2024 / Published: 14 September 2024

Abstract

:
Oxidative stress caused by reactive oxygen species (ROS) is one of the major causes of senescence. Strategies to reduce ROS are known to be important factors in reversing senescence, but effective strategies have not been found. In this study, we screened substances commonly used as cosmetic additives to find substances with antioxidant effects. Polygonum cuspidatum (P. cuspidatum) extract significantly reduced ROS levels in senescent cells. A novel mechanism was discovered in which P. cuspidatum extract reduced ROS, a byproduct of inefficient oxidative phosphorylation (OXPHOS), by increasing OXPHOS efficiency. The reduction in ROS by P. cuspidatum extract restored senescence-associated phenotypes and enhanced skin protection. Then, we identified polydatin as the active ingredient of P. cuspidatum extract that exhibited antioxidant effects. Polydatin, which contains stilbenoid polyphenols that act as singlet oxygen scavengers through redox reactions, increased OXPHOS efficiency and subsequently restored senescence-associated phenotypes. In summary, our data confirmed the effects of P. cuspidatum extract on senescence rejuvenation and skin protection through ROS reduction. This novel finding may be used as a treatment in senescence rejuvenation in clinical and cosmetic fields.

1. Introduction

The skin is composed of three layers (the epidermis, dermis, and subcutaneous fat) and is an epithelial tissue that covers our body [1]. The skin acts as a barrier to the environment, protects against microorganisms, and maintains fluid and temperature. Skin aging is a process in which skin quality deteriorates with age [2]. Skin aging is indicated by changes in the function of cellular organelles, most notably mitochondrial degeneration [3]. As skin ages, defective mitochondria accumulate and undergo structural changes that significantly increase mitochondrial volume and size [4]. Defective mitochondria leak electrons from complex I and III in the electron transport complex (ETC) to generate ROS as byproducts [5]. In addition to producing ROS, defective mitochondria are the target of oxidative stress, which further increases mitochondrial ROS generation. Increase in oxidative stress by ROS worsens skin aging by inducing protein oxidation, lipid peroxidation, and chain scission of collagen and elastin [6]. Thus, strategies to reduce mitochondrial ROS generation might be effective as a therapeutic approach for skin aging [7,8].
Polygonum cuspidatum (P. cuspidatum) extract has been traditionally used as a medicine for various diseases in China, Japan, and Korea [9,10,11]. Traditionally, P. cuspidatum extract has been used as a folk remedy to treat patients suffering from indigestion and gastrointestinal disorders [12,13]. Recently, P. cuspidatum extract was found to have antiviral activity against coronavirus 2 by preventing the interaction between the viral spike protein and host–cell receptors [14]. It also showed remarkable antibacterial effects against Escherichia coli, Streptococcus mutans, and Streptococcus sobrinus [15]. In addition to its antiviral and antibacterial effects, P. cuspidatum extract has been used as a cosmetic ingredient. Specifically, P. cuspidatum extract was effective in skin whitening and improving blemishes [16,17,18]. However, the underlying mechanism and active ingredients by which P. cuspidatum extract exerts its effects have not yet been investigated. Therefore, understanding the mechanism of the skin-beautifying effects of P. cuspidatum extract and identifying its active ingredients will further expand the applications of P. cuspidatum extract as an anti-aging agent and cosmetic additive.
In this study, we found that P. cuspidatum extract is an antioxidant that significantly reduces ROS levels in senescent fibroblasts. A novel ROS-reducing mechanism by P. cuspidatum extract was identified, through which it restored senescence-associated phenotypes and skin barrier function. Furthermore, we identified which active components of P. cuspidatum extract played a key role in demonstrating these effects. Herein, we propose a novel ROS-reducing mechanism of P. cuspidatum extract to improve senescence-associated phenotypes and enhance skin protection.

2. Materials and Methods

2.1. Cell Culture

Human dermal fibroblasts (PCS-201-010; ATCC, Manassas, VA, USA), immortalized human keratinocytes (HaCaT; 300493; Cytion, Eppelheim, Germany), and normal human epidermal keratinocytes (HEKn; C0055C; Gibco, Grand Island, NY, USA) were used. Human dermal fibroblasts were maintained in Dulbecco’s modified Eagle’s medium (DMEM) supplemented with 10% fetal bovine serum (FBS; SH30919.03; Hyclone, Waltham, MA, USA) and 100 U/mL penicillin/100 μg/mL streptomycin (SV30079.01; Hyclone). HaCaT cells were maintained in DMEM supplemented with 10% FBS (SH30919.03; Hyclone), 2 mM L-glutamine (A2916801; Thermo Fisher Scientific, Waltham, MA, USA) and 100 U/mL penicillin/100 μg/mL streptomycin (SV30079.01; Hyclone). HEKn cells were maintained in EpiLife® medium (M-EPICF-500; Thermo Fisher Scientific) supplemented with 1× human keratinocyte growth supplement (S001K; Thermo Fisher Scientific) and 10 μg/mL gentamicin/0.25 μg/mL amphotericin B (R01510; Thermo Fisher Scientific). Cells were cultivated in ambient air (20% O2) with 5% CO2 at 37 °C. The culture media was changed every four days. Using a Cedex HiRes Analyzer (05650216001; Roche, Basel, Switzerland), cell counts and viability were evaluated. The doubling time of human dermal fibroblasts was used to categorize them as either senescent or young, depending on whether it was 14 days or more or less than 2 days.

2.2. Preparation of P. cuspidatum Extract, Pyrroloquinoline Quinone (PQQ), and Caffeine

The roots of P. cuspidatum were mixed with distilled water in a volume ratio of 1:10 and heated at 60 °C for 5 h. The extract was filtered using a 5 μm filter and then using a 0.45 μm filter. The filtrate was completely concentrated using a vacuum evaporator and then dried using a vacuum dryer (OV-12; JEIOTECH, Daejon, Republic of Korea). P. cuspidatum extract was diluted to a concentration of 100 mg/mL using dimethyl sulfoxide (DMSO, D8418; Sigma, St. Louis, MO, USA). To make a concentration of 10 μg/mL P. cuspidatum extract, 1 μL of 100 mg/mL P. cuspidatum extract was added to 10 mL medium. DMSO control was used by diluting DMSO in the medium to a concentration of 0.01%. To make the DMSO (0.01%), 1 μL of DMSO was added to 10 mL medium. Pyrroloquinoline quinone (PQQ, D7783; Sigma) was diluted to a concentration of 100 mg/mL using DMSO. To make a concentration of 10 μg/mL PQQ, 1 μL of 100 mg/mL PQQ was added to 10 mL medium. Caffeine (C7731; Sigma) was diluted to a concentration of 100 mg/mL using DMSO. To make a concentration of 10 μg/mL caffeine, 1 μL of 100 mg/mL caffeine was added to 10 mL medium.

2.3. Flow Cytometric Analysis of Reactive Oxygen Species (ROS)

P. cuspidatum extract, pyrroloquinoline quinone (PQQ, 80198; Sigma), and caffeine (C0750; Sigma) were diluted to a final concentration of 10 µg/mL and treated to senescent fibroblasts for 12 days. DMSO control was used by diluting DMSO in the medium to a concentration of 0.01%. As a positive control, 100 µM resveratrol (76511; Sigma) was used. Then, cells were incubated for 30 min at 37 °C in a medium 30 µM DHR123 (10056-1; Biotium, Fremont, CA, USA) in order to quantify ROS. Then, cells were processed for flow cytometry analysis as previously explained [19].

2.4. Cellular Proliferation Assay

Senescent fibroblasts were seeded in 96-well plates (353072; BD Biosciences, Franklin Lakes, NJ, USA) at a density of 1 × 10³ cells per well. Cells were then treated with DMSO (0.01%) or P. cuspidatum extract (1.25, 2.5, or 10 µg/mL) for 12 days. Cell numbers were enumerated using a cell proliferation assay based on a DNA content-based method [19,20,21]. Specifically, on day 12, cells were washed twice with phosphate-buffered saline (AM9624; Invitrogen, Waltham, MA, USA). A total of 50 µL of 0.2% sodium lauryl sulfate (L3771; Sigma) was added to each well and incubated at 37 °C for 1 h. Next, 150 μL of SYBR Green I nucleic acid gel stain (1:1000 in DW; Excitation/Emission: 485 nm/535 nm; S-7567; Molecular Probes, Eugene, OR, USA) was added to each well. Fluorescence intensity was measured using a VICTOR Multilabel Plate Reader (2030-0050; PerkinElmer, Waltham, MA, USA).

2.5. Analysis of the Oxygen Consumption Rate (OCR)

Senescent fibroblasts were treated with DMSO (0.01%) or P. cuspidatum extract (2.5 µg/mL) for 12 days. Analysis of the OCR was performed using the XFe24 flux analyzer (Seahorse Bioscience, Billerica, MA, USA). The analysis of OCR and the ATP production rate was performed as previously explained [20].

2.6. Flow Cytometric Analysis of Mitochondrial Membrane Potential (MMP), Cellular Lipofuscin Levels, Lysosomal Mass, and Autophagosome Level

Senescent fibroblasts were treated with DMSO (0.01%) or P. cuspidatum extract (2.5 µg/mL) for 12 days. To assess MMP, senescent fibroblasts were treated for 30 min at 37 °C in a medium containing 0.6 µg/mL JC-10 (ENZ-52305; Enzo Life Sciences, Farmingdale, NY, USA). One commonly used method for quantifying lipofuscin is autofluorescence assessment [22,23,24,25]. To assess autofluorescence, senescent fibroblasts were treated for 30 min at 37 °C in a medium containing no dyes. To assess lysosomal mass, senescent fibroblasts were treated for 30 min at 37 °C in a medium containing 100 nM LysoTracker™ Red (L7528; Thermo Fisher Scientific). To assess autophagosome level, senescent fibroblasts were treated for 30 min at 37 °C in a medium containing CYTO-ID® (ENZ-51031-0050; Enzo Life Sciences). Then, cells were processed for flow cytometry analysis as previously explained [19].

2.7. Measurement of Protein Carbonylation

HaCaT cells were treated with 500 μM H2O2 (216763; Sigma) for 4 h. Then, HaCaT cells were treated with DMSO (0.01%) or P. cuspidatum extract (2.5 µg/mL) for 12 days. As a positive control, 250 µM vitamin E (T1539; Sigma) was used. Vitamin E was diluted to a concentration of 2.5 M using DMSO (D8418; Sigma). To make a concentration of 250 µM vitamin E, 1 μL of 2.5 M vitamin E was added to 10 mL medium. Then, HaCaT cells were treated with methanol for 5 min. HaCaT cells were stained with 20 μM fluorescein-5-thiosemicarbazide (46985; Sigma) and 4 μM hoechst 33342 (H21492; Thermo fisher scientific). Fluorescence was measured using an ELISA reader (Tecan, Männedorf, Switzerland). Cell morphology was photographed using a fluorescence microscope (Leica, Wetzlar, Germany).

2.8. Measurement of Calpain 1 Protein Expression after Activation with IL-17A

To inhibit the expression of calpain 1, HEKn cells were treated with 200 ng/mL IL-17A (200-17; Peprotech; Cranbury, NJ, USA). IL-17A was diluted to a concentration of 2 mg/mL using DMSO (D8418; Sigma). To make a concentration of 200 ng/mL IL-17A, 1 μL of 2 mg/mL IL-17A was added to 10 mL medium. Then, HEKn cells were treated with DMSO (0.01%) or P. cuspidatum extract (2.5 µg/mL) for 12 days. As a positive control, 500 μg/mL ceramide NP (EVONIK, Essen, Germany) was used. Ceramide NP was diluted to a concentration of 5 g/mL using DMSO (D8418; Sigma). To make a concentration of 500 μg/mL ceramide NP, 1 μL of 5 g/mL ceramide NP was added to 10 mL medium.

2.9. Measurement of Collagen Type I and III Expression

Senescent fibroblasts were treated with DMSO (0.01%) or P. cuspidatum extract (2.5 µg/mL) for 12 days. As a positive control, 75 µg/mL vitamin C (A4403; Sigma) was used. Vitamin C was diluted to a concentration of 750 mg/mL using DMSO (D8418; Sigma). To make a concentration of 75 µg/mL vitamin C, 1 μL of 750 mg/mL vitamin C was added to 10 mL medium.

2.10. Measurement of NLRP3 Protein Expression after Activation with LPS/ATP

To induce NLR family pyrin domain-containing 3 (NLRP3) expression, HaCaT cells were treated with 5 μg/mL lipopolysaccharide (LPS; L4516; Sigma) and then with 5 mM adenosine triphosphate (ATP; A6419; Sigma). LPS was diluted to a concentration of 50 mg/mL using DMSO (D8418; Sigma). To make the concentration of 5 μg/mL LPS, 1 μL of 50 mg/mL LPS was added to 10 mL medium. ATP was diluted to a concentration of 50 M using distilled water (07-6061; Sigma). To make the concentration of 5 mM ATP, 1 μL of 50 M ATP was added to 10 mL medium. Then, HaCaT cells were treated with DMSO (0.01%) or P. cuspidatum extract (2.5 µg/mL) for 12 days. As a ROS scavenger, 5 mM N-acetylcysteine (NAC; A9165; Sigma) was treated on HaCaT cells. NAC was diluted to a concentration of 50 M using DMSO (D8418; Sigma). To make the concentration of 5 mM NAC, 1 μL of 50 M ATP was added to 10 mL medium.

2.11. Measurement of IL-8 Expression after Activation with IFN-γ/TNF-α

To induce IL-8 expression, HaCaT cells were treated with 10 ng/mL interferon gamma (IFN-γ; PHC4031; Gibco) and 20 ng/mL tumor necrosis factor-alpha (TNF-α; H8916; Sigma). IFN-γ was diluted to a concentration of 100 μg/mL using DMSO (D8418; Sigma). To make the concentration of 10 ng/mL IFN-γ, 1 μL of 100 μg/mL IFN-γ was added to 10 mL medium. TNF-α was diluted to a concentration of 200 μM using distilled water (07-6061; Sigma). To make the concentration of 20 ng/mL TNF-α, 1 μL of 200 μM TNF-α was added to 10 mL medium. Then, HaCaT cells were treated with DMSO (0.01%) or P. cuspidatum extract (2.5 µg/mL) for 12 days.

2.12. Measurement of β-Defensin 2 Expression after Activation with IFN-γ/TNF-α Followed by IL-4

HaCaT cells were treated with 10 ng/mL IFN-γ and 20 ng/mL TNF-α. To inhibit the expression of β-defensin 2, HaCaT cells were treated with 50 ng/mL IL-4 (PHC0044; Gibco). IL-4 was diluted to a concentration of 500 μg/mL using DMSO (D8418; Sigma). To make the concentration of 50 ng/mL IL-4, 1 μL of 500 μg/mL IL-4 was added to 10 mL medium. Then, HaCaT cells were treated with DMSO (0.01%) or P. cuspidatum extract (2.5 µg/mL) for 12 days. As a positive control, 25 μg/mL lactoferrin (L4894; Sigma) was used. Lactoferrin was diluted to a concentration of 250 mg/mL using DMSO (D8418; Sigma). To make the concentration of 25 μg/mL lactoferrin, 1 μL of 250 mg/mL lactoferrin was added to 10 mL medium.

2.13. Quantitative PCR (qPCR)

qPCR using mRNA was performed as described previously [26]. qPCR was conducted using the following primer (Table 1).

2.14. Western Blot Analysis

The protocol for Western blot analysis was followed as previously described [27]. Antibodies used in this study included calpain 1 antibody (ab108400; Abcam, Cambridge, UK, 1:1000 dilution in 5% skim milk), GAPDH antibody (sc-32233; Santa Cruz Biotechnology, Dallas, TX, USA, 1:5000 dilution in 5% skim milk), NLRP3 antibody (PA5-79740; Invitrogen, 1:1000 dilution in 5% skim milk), β-actin antibody (sc-47778; Santa cruz biotechnology, 1:5000 dilution in 5% skim milk), Horseradish peroxidase (HRP)-conjugated secondary antibody (1706515; Bio-Rad, Hercules, CA, USA, 1:2000 dilution in 5% skim milk), and HRP-conjugated secondary antibody (1706516; Bio-Rad, 1:10,000 dilution in 5% skim milk).

2.15. High-Performance Liquid Chromatography (HPLC) Analysis

Analysis of emodin and polydatin content in the P. cuspidatum extract was conducted using HPLC (Agilent 1200, Agilent Technologies, Santa Clara, CA, USA). HPLC column (Capcell Pak C18 4.6 × 250 mm, Shiseido, Osaka, Japan) was used. A total of 10.1 mg of P. cuspidatum extract was diluted to a 25 mL methyl alcohol (1424109; Sigma). To make a standard solution, 4.6 mg of emodin (E7881; Sigma) or 7.6 mg of polydatin (15721; Sigma) was dissolved in 50 mL of methyl alcohol.

3. Results

3.1. P. cuspidatum Extract Significantly Reduces ROS Levels in Senescent Fibroblasts

Among the widely used cosmetic ingredients, P. cuspidatum extract, pyrroloquinoline quinone (PQQ), and caffeine were used to find candidates that could effectively suppress ROS in senescent fibroblasts. P. cuspidatum extract is known to be effective in skin soothing and whitening [17,18]. PQQ prevents skin aging by regenerating and thickening skin cells [28]. Caffeine protects the skin from ultraviolet rays, slowing down photoaging of the skin [29]. Three substances were diluted to a final concentration of 10 µg/mL and treated to senescent fibroblasts. Then, on day 12, their impact on ROS levels was examined. Resveratrol, known as a potent antioxidant, was used as a positive control. As expected, resveratrol significantly decreased ROS levels in senescent fibroblasts (Figure 1A). P. cuspidatum extract also significantly decreased ROS levels, exhibiting a ROS-reducing effect similar to resveratrol (Figure 1A). However, PQQ and caffeine, which are known to be effective in skin beauty, were not effective in reducing ROS levels (Figure 1A). These results suggest that among the three ingredients known to be effective in skin beauty, only the P. cuspidatum extract exhibited antioxidant activity (Figure 1A).
To determine the concentration at which P. cuspidatum extract simultaneously reduces ROS and senescence-associated phenotypes, senescent fibroblasts were treated with P. cuspidatum extract at concentrations of 0–10 μg/mL. Since the definition of senescence is the irreversible arrest of the cell cycle [30], the cell proliferation-inducing effect of P. cuspidatum extract was used as a criterion for the recovery of senescence-associated phenotypes. A significant ROS-reducing effect was observed starting from a concentration of 2.5 μg/mL, including the 10 μg/mL concentration used in the initial screening (Figure 1B). However, the cell proliferation-inducing effect was observed only at concentrations of 1.25 and 2.5 μg/mL (Figure 1C). Here, 2.5 μg/mL was chosen as the optimal concentration of P. cuspidatum extract because it simultaneously reduces ROS and increases cell proliferation in senescent fibroblasts (Figure 1B,C; blue arrow heads).
Next, we investigated the toxicity of P. cuspidatum at selected concentrations by examining cell viability. Senescent fibroblasts treated with P. cuspidatum extract at the concentration exhibited similar viability as fibroblasts treated with DMSO, suggesting that P. cuspidatum at selected concentrations was not toxic to the cells (Figure 1D).

3.2. P. cuspidatum Extract Ameliorates Senescence-Associated Phenotypes in Senescent Fibroblasts

Senescent fibroblasts treated with selected concentrations of P. cuspidatum extract showed proliferation-inducing effects, ameliorating irreversible cell cycle arrest, one of the senescence-associated phenotypes. However, since the recovery of senescence-associated phenotypes by P. cuspidatum extract should not be based solely on its cell proliferation-inducing effect, the effects of P. cuspidatum extract on the other senescence-associated phenotypes were also investigated.
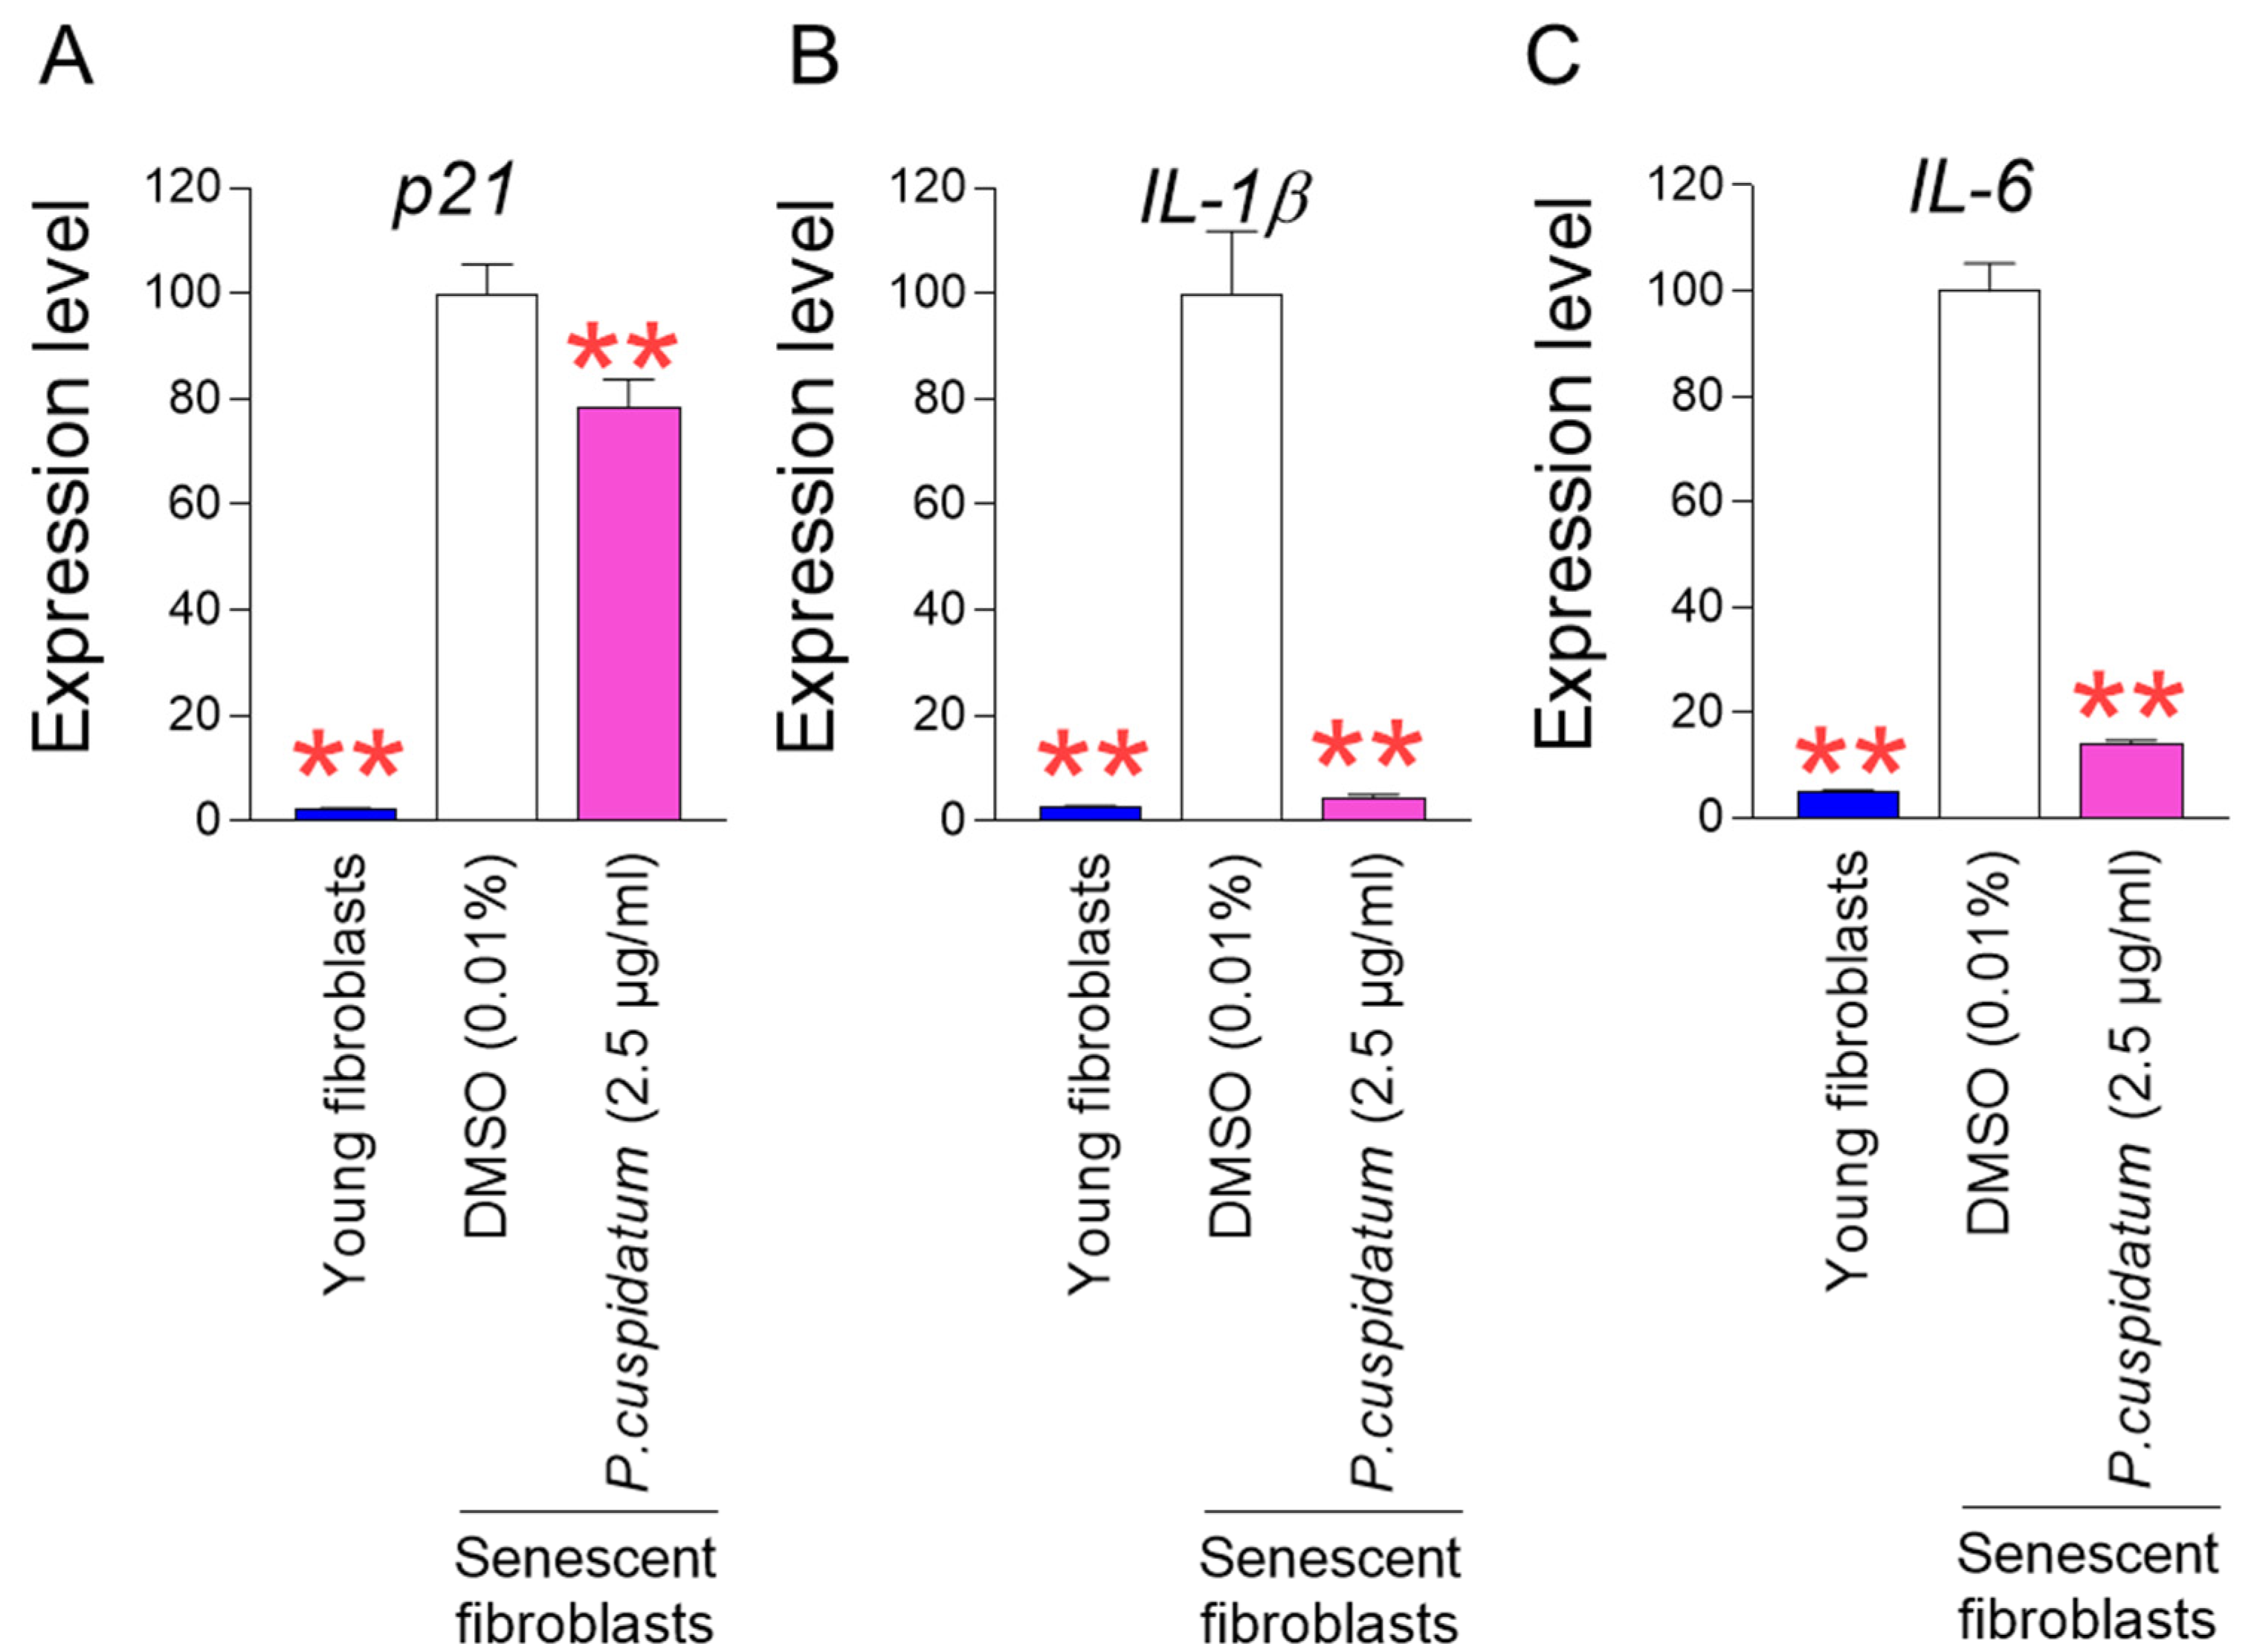
Two major pathways controlling cell cycle arrest, one of the senescence-associated phenotypes, are the p53/p21 and p16/RB pathways [31]. The p53/p21 pathway plays a key role in the early stages of senescence, whereas the p16/RB pathway plays a critical role in the maintenance of senescence [32]. Among the two major pathways, we selected the p53/p21 pathway and examined the changes in the expression of p21, a downstream pathway of p53. Young fibroblasts were used as a positive control, and p21 expression in young fibroblasts was significantly lower than in senescent fibroblasts, as previously reported [20] (Figure 2A). P. cuspidatum treatment in senescent fibroblasts significantly reduced p21 expression compared to DMSO control, indicating cell cycle progression by P. cuspidatum (Figure 2A).
The senescence-associated secretory phenotype (SASP) consists of cytokines and chemokines secreted by senescent cells [31]. ROS influences the secretion of inflammatory SASP [33]. Particularly, O2•− reacts with mitochondrial superoxide dismutase in the matrix to generate hydrogen peroxide, which is able to pass through the mitochondrial outer membrane and oxidize proteins in the cytosol. This reaction promotes the release of SASPs (IL-1β, IL-6, IL-8) [34,35,36]. Among the SASPs, we first selected IL-1β, known as an inflammatory SASP that induces T helper immune responses [37], and examined the changes in IL-1β expression. IL-1β expression in young fibroblasts was significantly lower than in senescent fibroblasts, as reported in previous studies [38] (Figure 2B). P. cuspidatum treatment in senescent fibroblasts significantly decreased IL-1β expression compared to the DMSO control, indicating that P. cuspidatum extract reduces the expression of inflammatory SASPs (Figure 2B).
IL-6 is known as an inflammatory SASP that promotes senescence through the autocrine and paracrine pathways [39]. We then examined the changes in IL-6 expression. As previously reported [40], IL-6 expression in young fibroblasts was significantly lower than in senescent fibroblasts (Figure 2C). P. cuspidatum treatment in senescent fibroblasts significantly decreased IL-6 expression compared to the DMSO control, supporting the role of P. cuspidatum extract in reducing inflammatory SASPs (Figure 2C).

3.3. P. cuspidatum Extract Reduces Mitochondrial ROS Generation through Increasing OXPHOS Efficiency in Senescent Fibroblasts

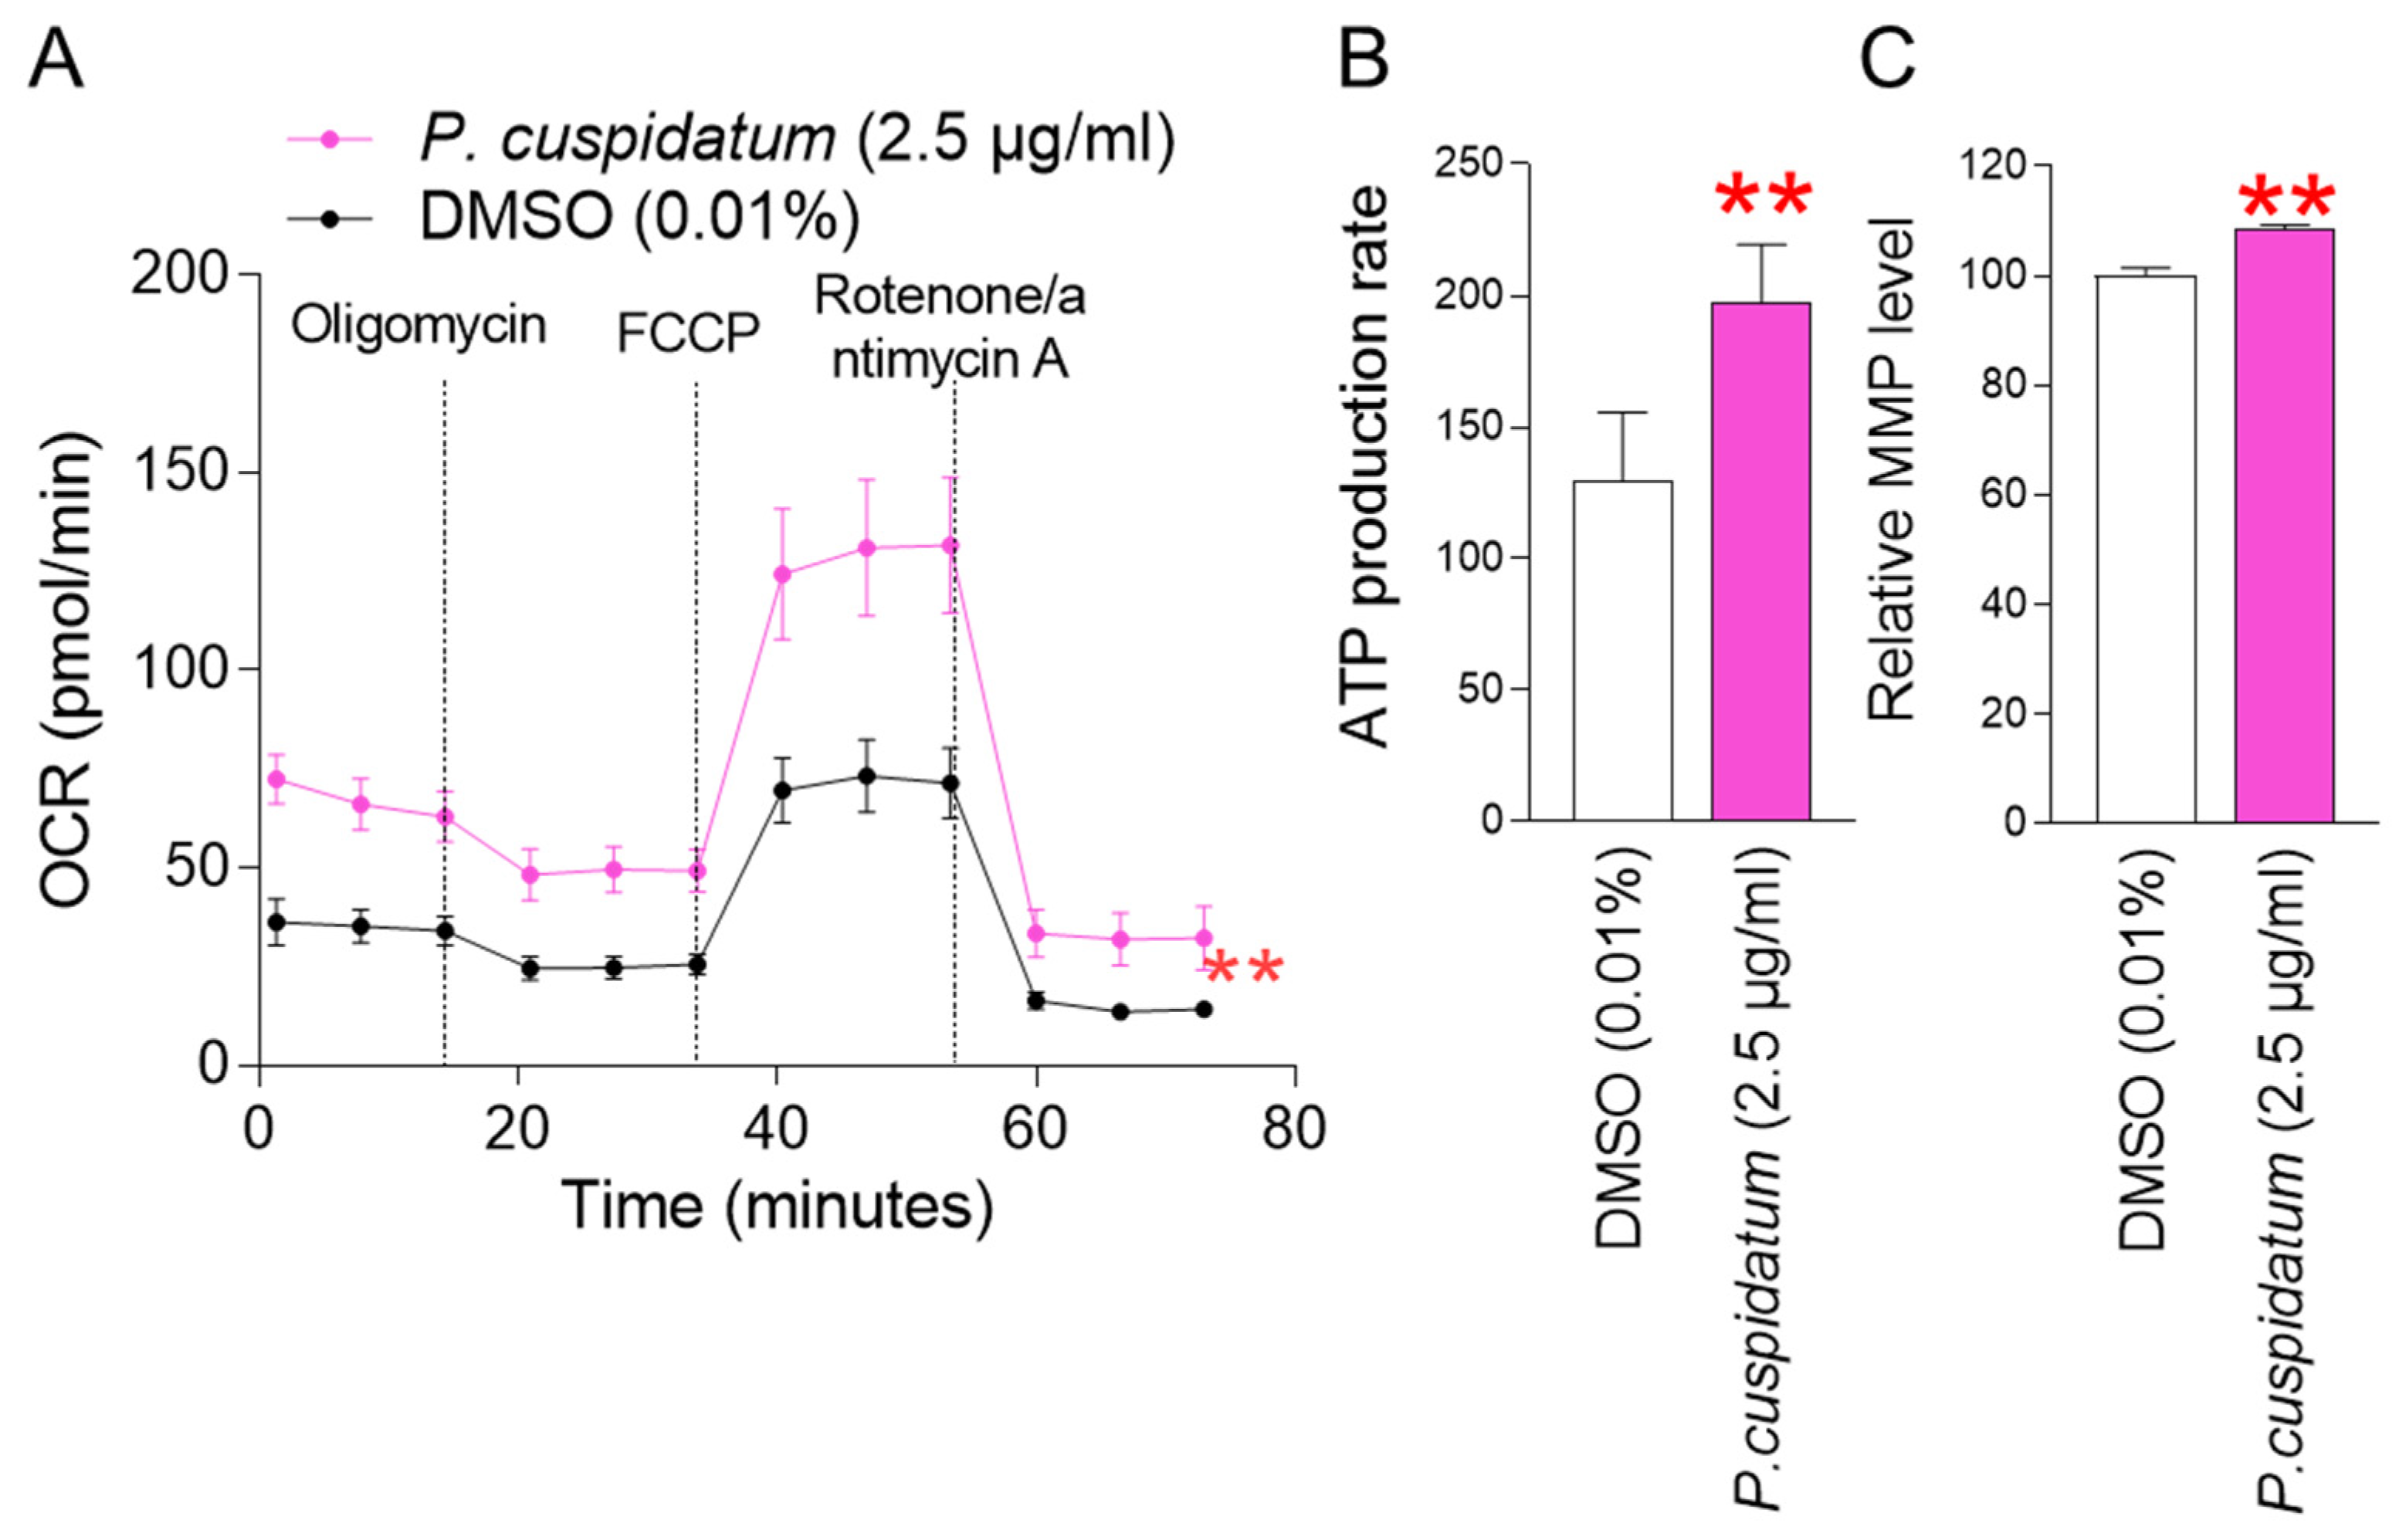
Inefficient electron transport in the mitochondrial electron transport chain (ETC) is a major cause of ROS production. In particular, inefficient electron transfer causes complexes I and III to generate superoxide anions (O2•−) from oxygen in the mitochondrial matrix [41]. It also causes complex III to generate O2•− in the mitochondrial intermembrane space [41]. Since the mitochondrial ETC not only transfers electrons but also pumps protons from the matrix to the mitochondrial intermembrane space to enable oxidative phosphorylation (OXPHOS) [42], the electron transfer efficiency in the mitochondrial ETC can be indirectly measured through OXPHOS efficiency [43]. To understand the underlying mechanism of ROS reduction by P. cuspidatum extract, OXPHOS efficiency was investigated. Oxygen consumption rate (OCR; pmoles/min) was investigated as an indicator of OXPHOS efficiency [44]. Compound injections consisted of oligomycin, carbonyl cyanide-p-trifluoromethoxyphenylhydrazone (FCCP), and a combination of rotenone/antimycin A. ATP production (after oligomycin injection), maximal respiration (after FCCP injection), and non-mitochondrial respiration (after rotenone/antimycin A injection) were evaluated using the sequentially measured OCR values. Senescent fibroblasts treated with the P. cuspidatum extract showed significantly higher OCR values than the DMSO control after each injection, indicating that the P. cuspidatum extract enhanced OXPHOS efficiency (Figure 3A; black vs. pink lines).
Since we observed an increase in OXPHOS efficiency as a result of P. cuspidatum extract, we investigated whether P. cuspidatum extract could induce an increase in mitochondrial ATP production. P. cuspidatum extract increased ATP production compared to the DMSO control (Figure 3B). These results suggest that P. cuspidatum extract increased ATP production by improving the efficiency of OXPHOS.
Mitochondrial membrane potential (MMP) is the electrical potential that is generated when protons move from the matrix to the mitochondrial intermembrane space [45]. MMP is the electrical potential difference that drives ATP production in mitochondria [46]. Since we observed an increase in mitochondrial ATP production as a result of P. cuspidatum extract, we investigated the changes in MMP. P. cuspidatum extract increased MMP compared to the control (Figure 3C).
Considering the increase in OXPHOS efficiency and the resulting increase in ATP production as a result of P. cuspidatum extract, efficient electron transport induced by P. cuspidatum extract might be the underlying mechanism of reduction in mitochondrial ROS generation.

3.4. P. cuspidatum Extract Yields Functional Recovery of Lysosome/Autophagy System in Senescent Fibroblasts

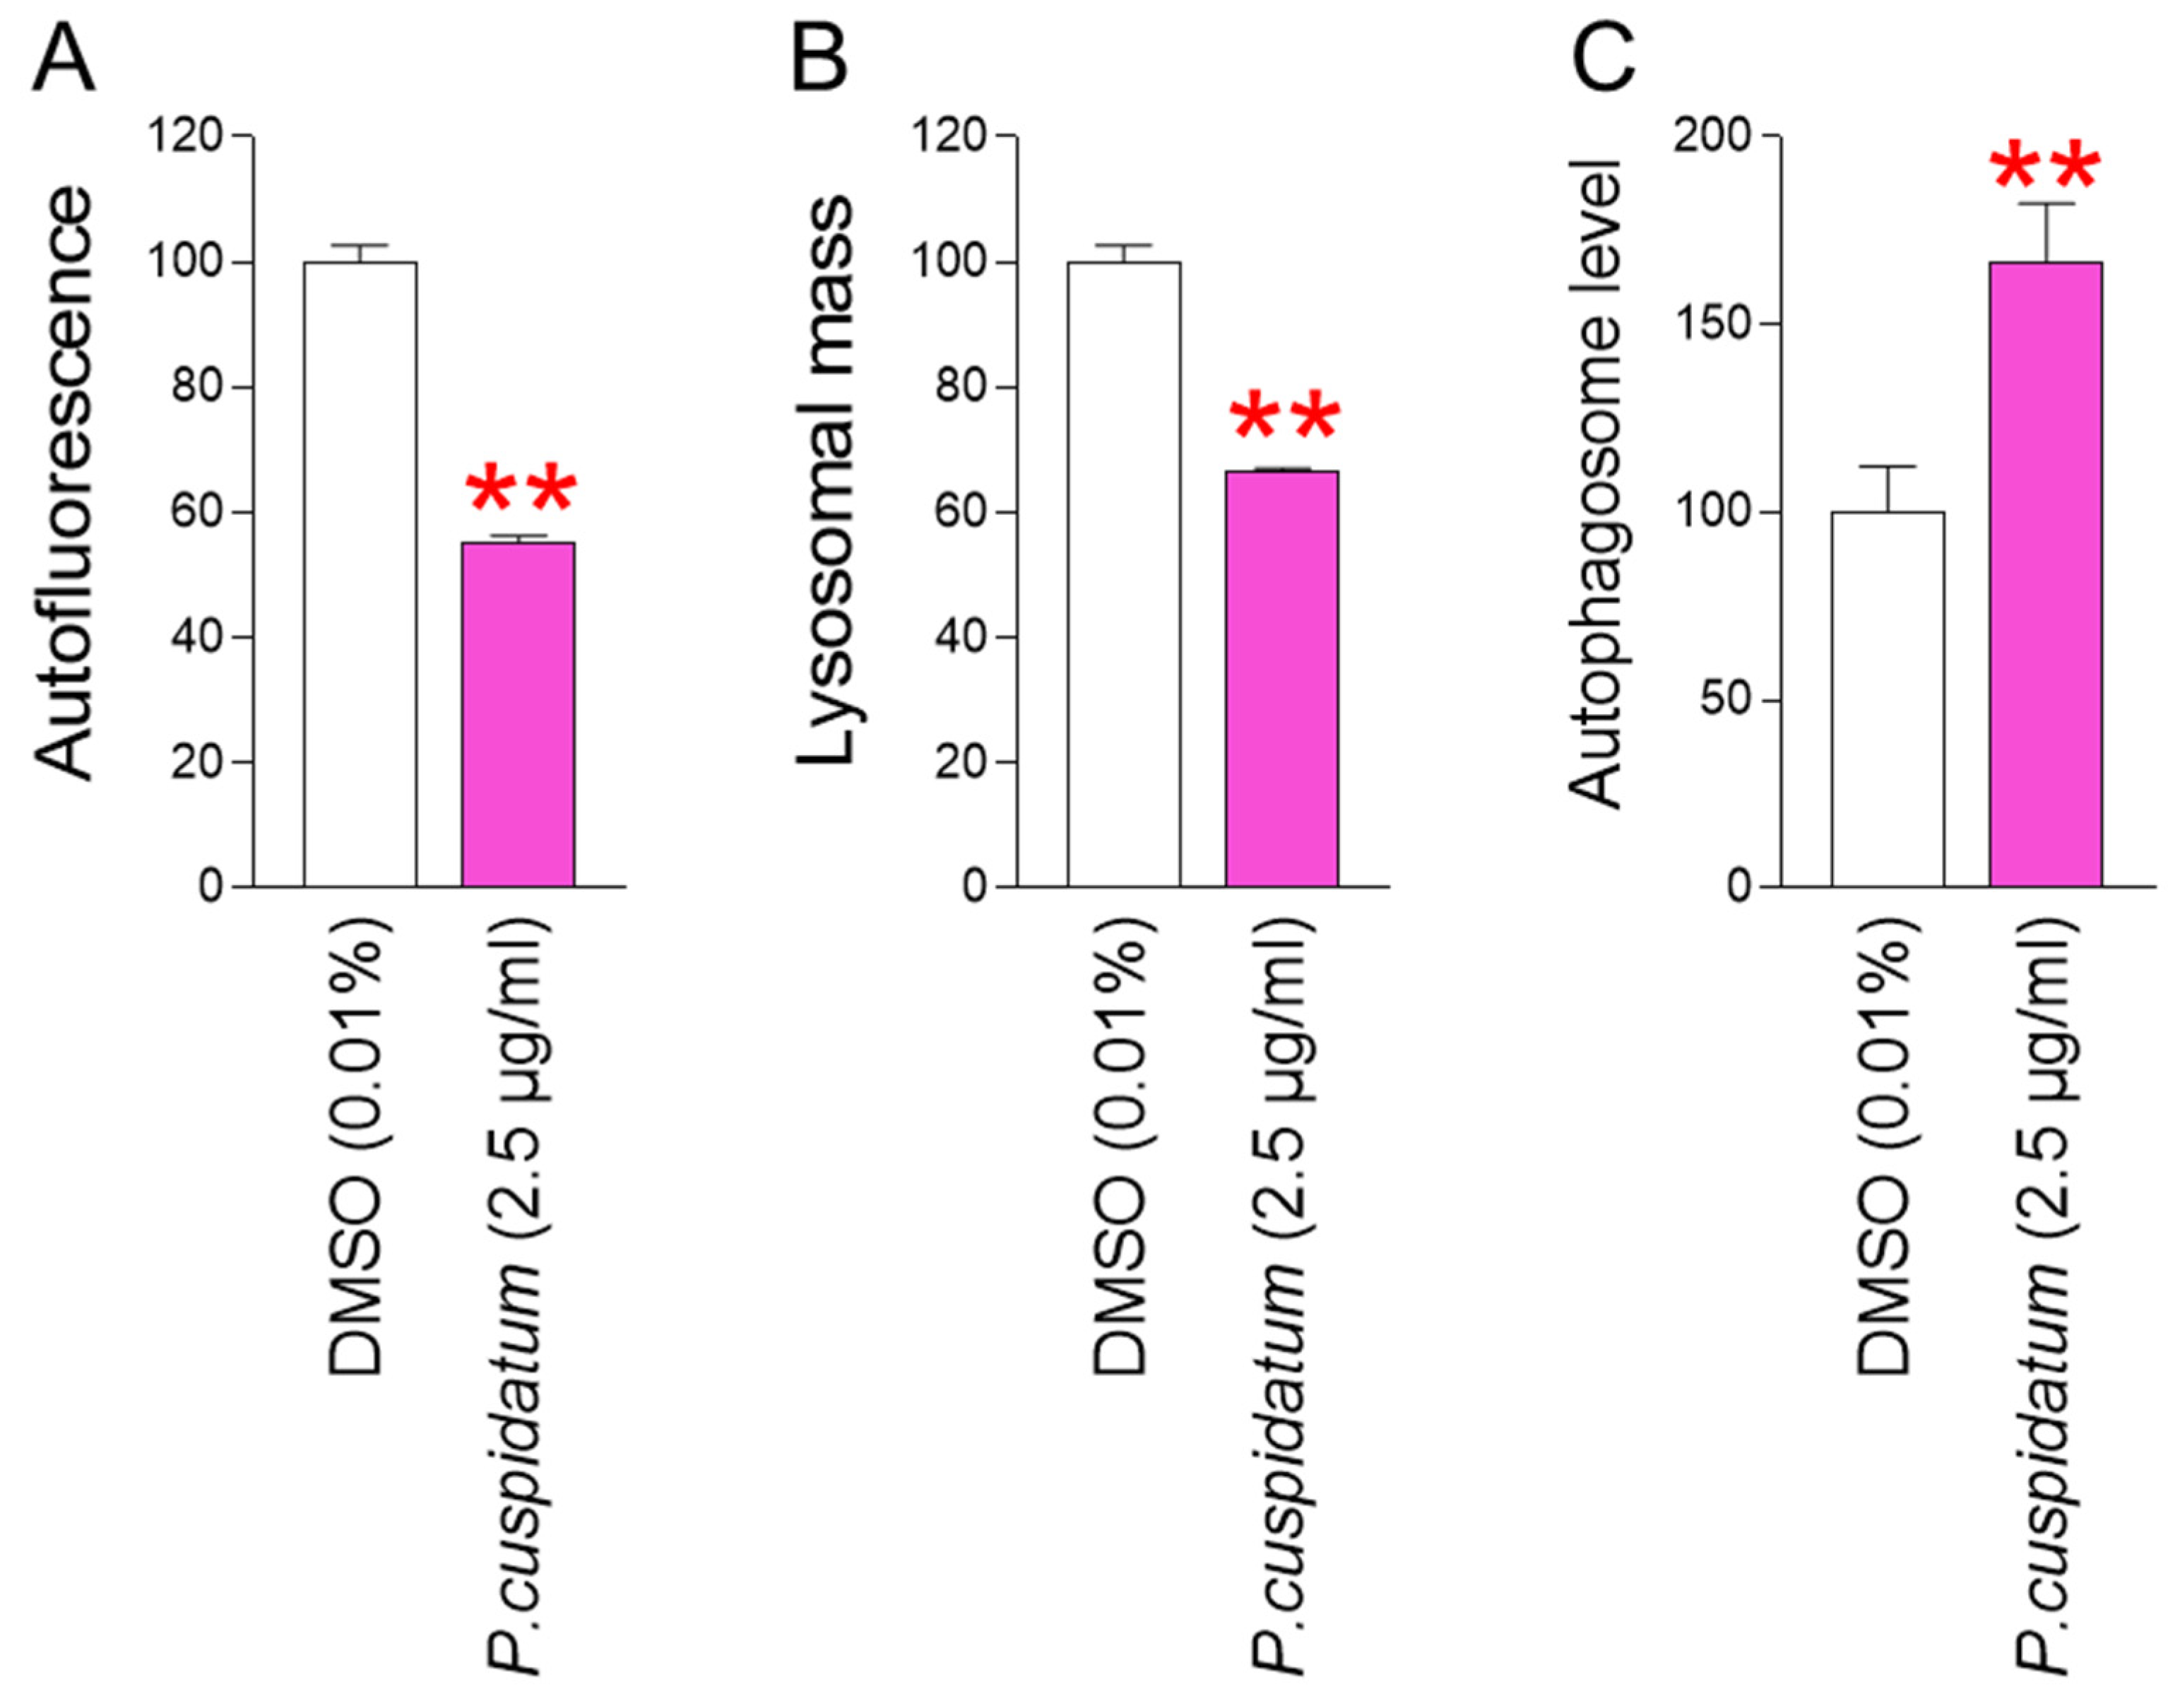
Restoration of mitochondrial function is a prerequisite for improving senescence [19,47,48,49,50]. Increase in mitochondrial ATP production by P. cuspidatum extract prompted us to investigate its effects on senescence-associated phenotypes. We investigated the amount of intracellular lipofuscin, one of the senescence-associated phenotypes [28]. Lipofuscin levels were determined by assessing the amount of intracellular autofluorescence [51]. The autofluorescence levels were significantly reduced after P. cuspidatum treatment, suggesting that P. cuspidatum decreased lipofuscin levels (Figure 4A).
Lipofuscin is one type of autofluorescent material that gradually accumulates in lysosomes. Lysosomes filled with lipofuscin act as a sink for newly synthesized hydrolytic enzymes, thereby reducing lysosomal activity. The decrease in lysosomal activity leads to an increase in lysosomal mass to compensate for the decreased activity [52]. Therefore, we investigated the changes in lysosomal mass to determine whether P. cuspidatum extract affects lysosomal activity. Lysosomal mass was significantly decreased by P. cuspidatum, suggesting a reduction in nonfunctional lysosomes by P. cuspidatum (Figure 4B).
The lysosome/autophagy system plays a key role in the removal of dysfunctional mitochondria [53]. Given the observed reduction in lysosomal mass, we investigated whether the P. cuspidatum extract restored the autophagy system. P. cuspidatum extract increased the number of autophagosomes, indicating an activated autophagy system mediated by P. cuspidatum (Figure 4C).

3.5. P. cuspidatum Extract Reduces ROS and Lipofuscin Levels in Young Fibroblasts

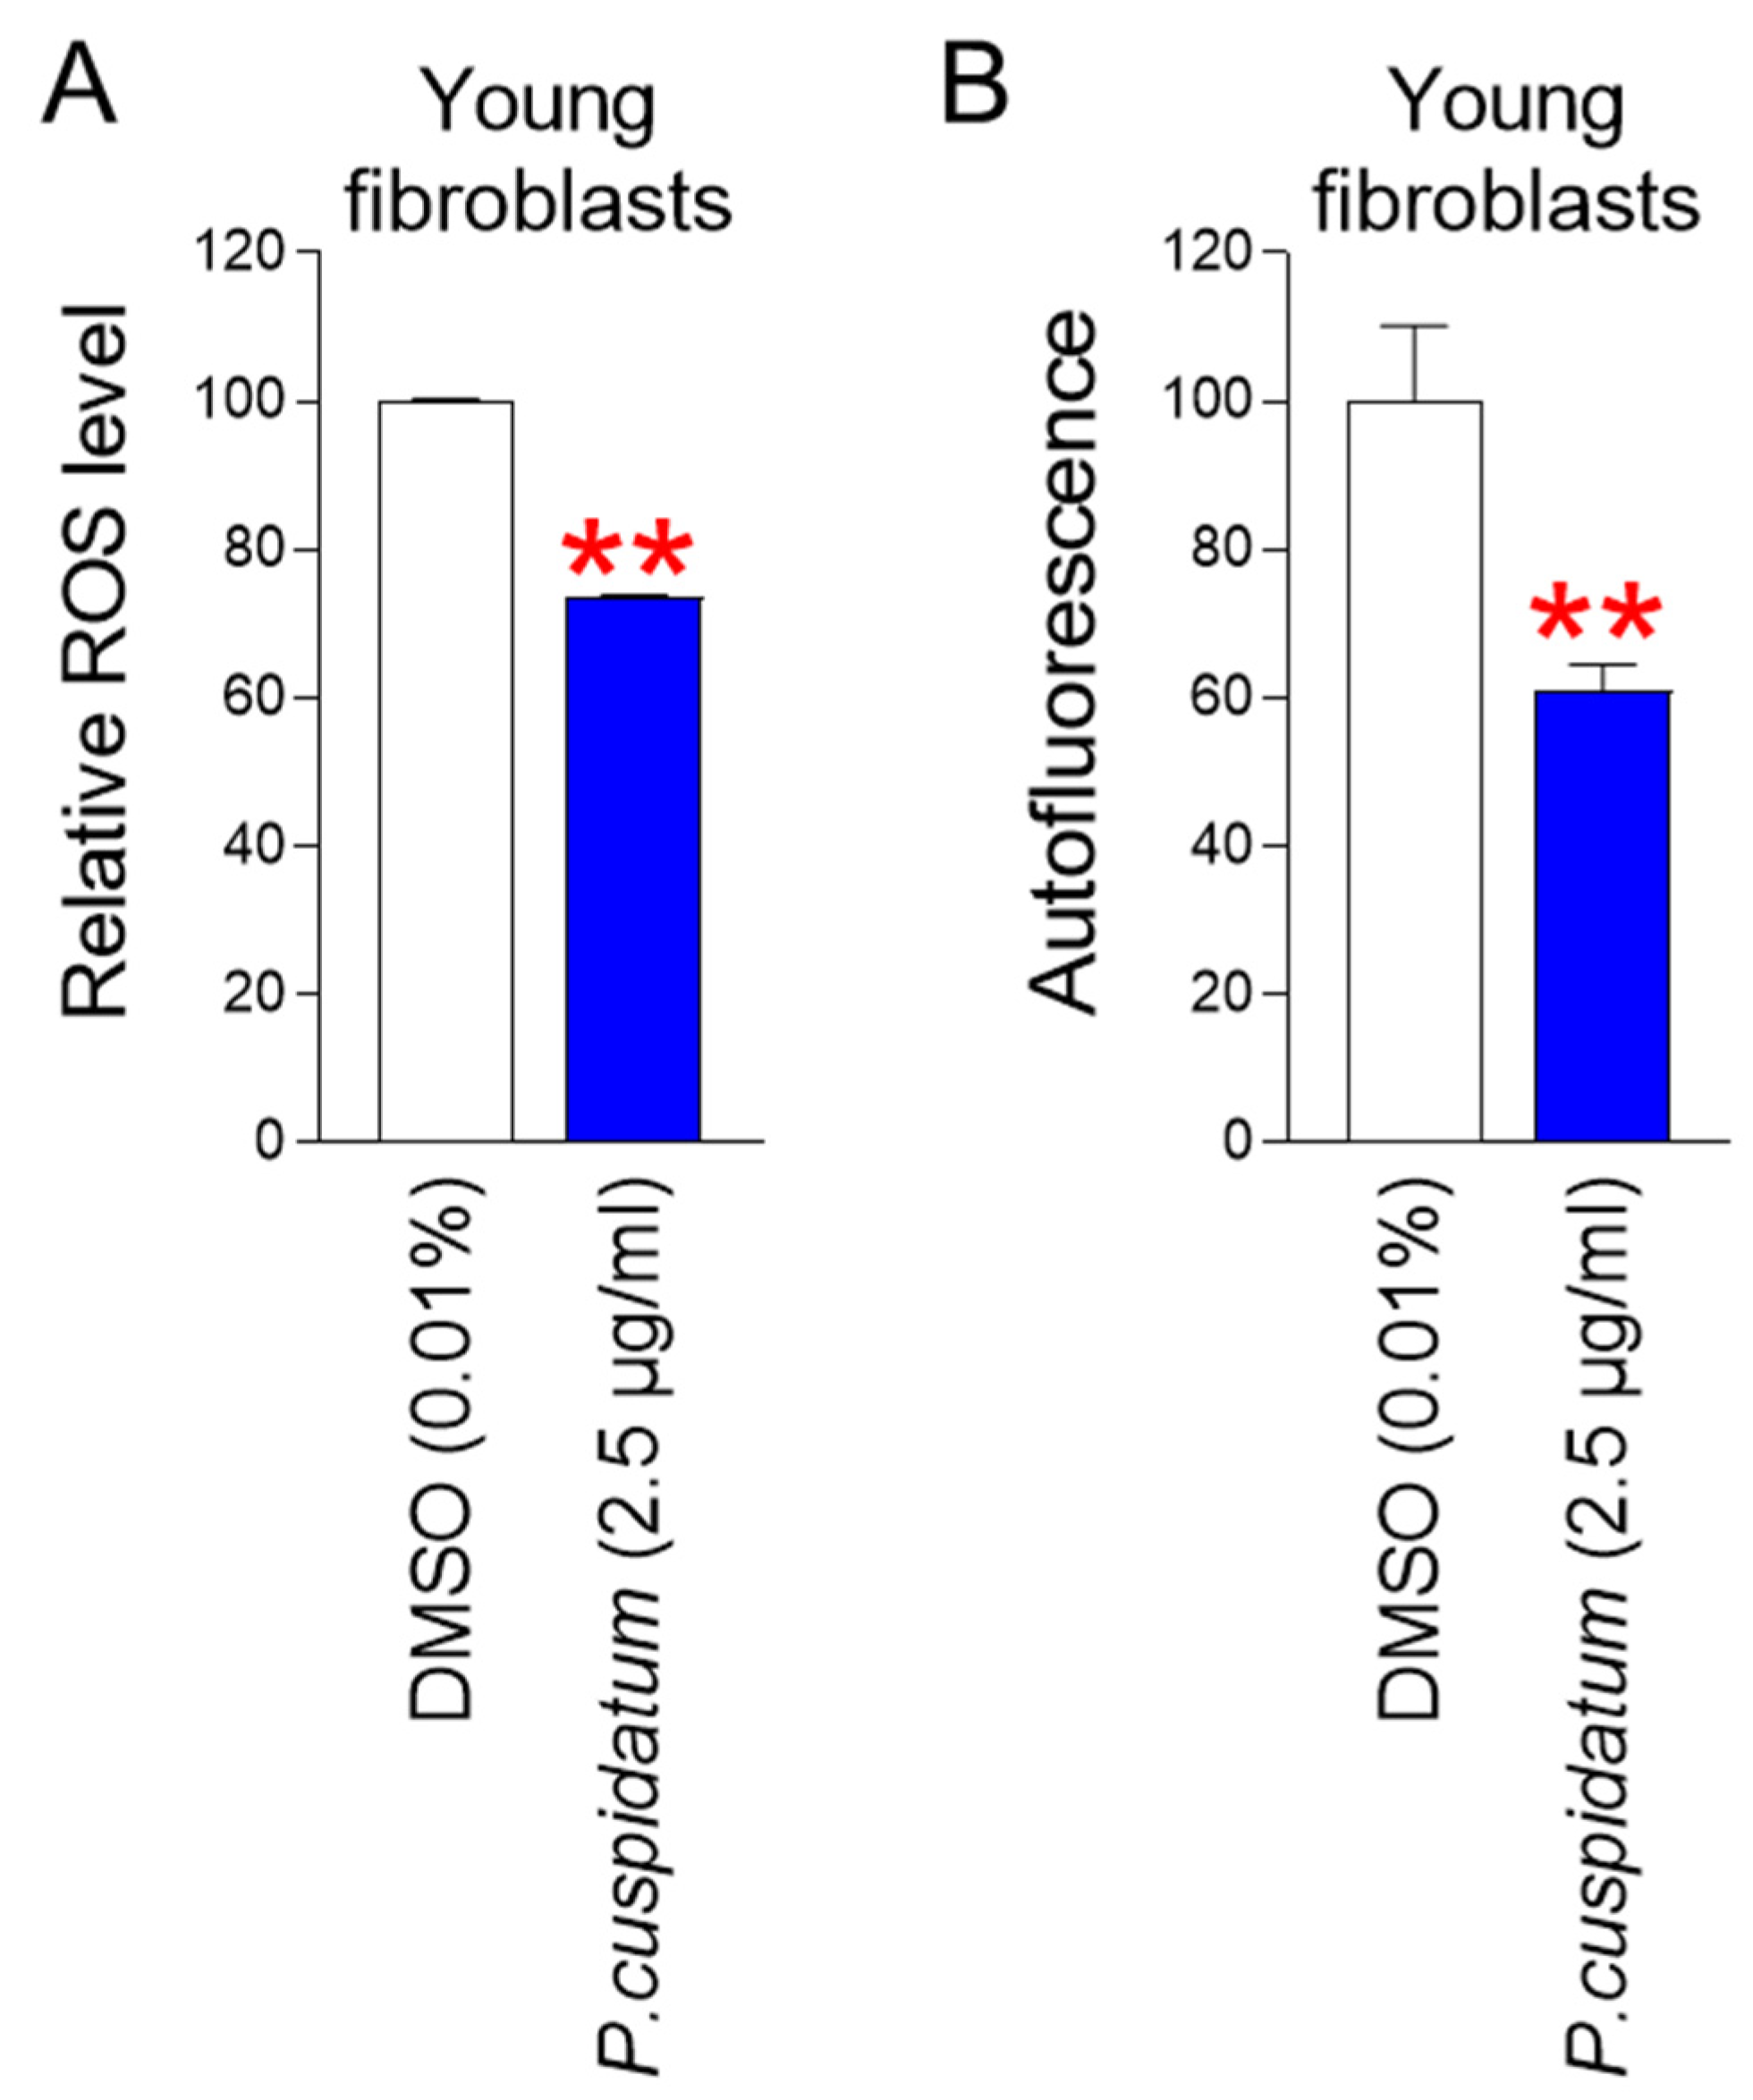
Our results showing that P. cuspidatum extract improves senescence-associated phenotypes in senescent fibroblasts raise the question of whether these improvements also apply to young fibroblasts. Therefore, we investigated whether P. cuspidatum extract exhibited the same effect on young fibroblasts. First, we examined the effect of P. cuspidatum extract on ROS levels in young fibroblasts. P. cuspidatum extract exhibited ROS-reducing effects in young fibroblasts similar to those observed in senescent fibroblasts (Figure 5A). We then examined the effect of P. cuspidatum extract on intracellular lipofuscin levels in young fibroblasts. P. cuspidatum extract reduced autofluorescence levels in young fibroblasts, suggesting that P. cuspidatum also reduced lipofuscin levels in young cells, as was seen in senescent fibroblasts (Figure 5B). Taken together, these results suggest that the effects of P. cuspidatum are not limited to senescent fibroblasts.

3.6. P. cuspidatum Extract Enhances Skin Protection through Restoring Skin Barrier Formation

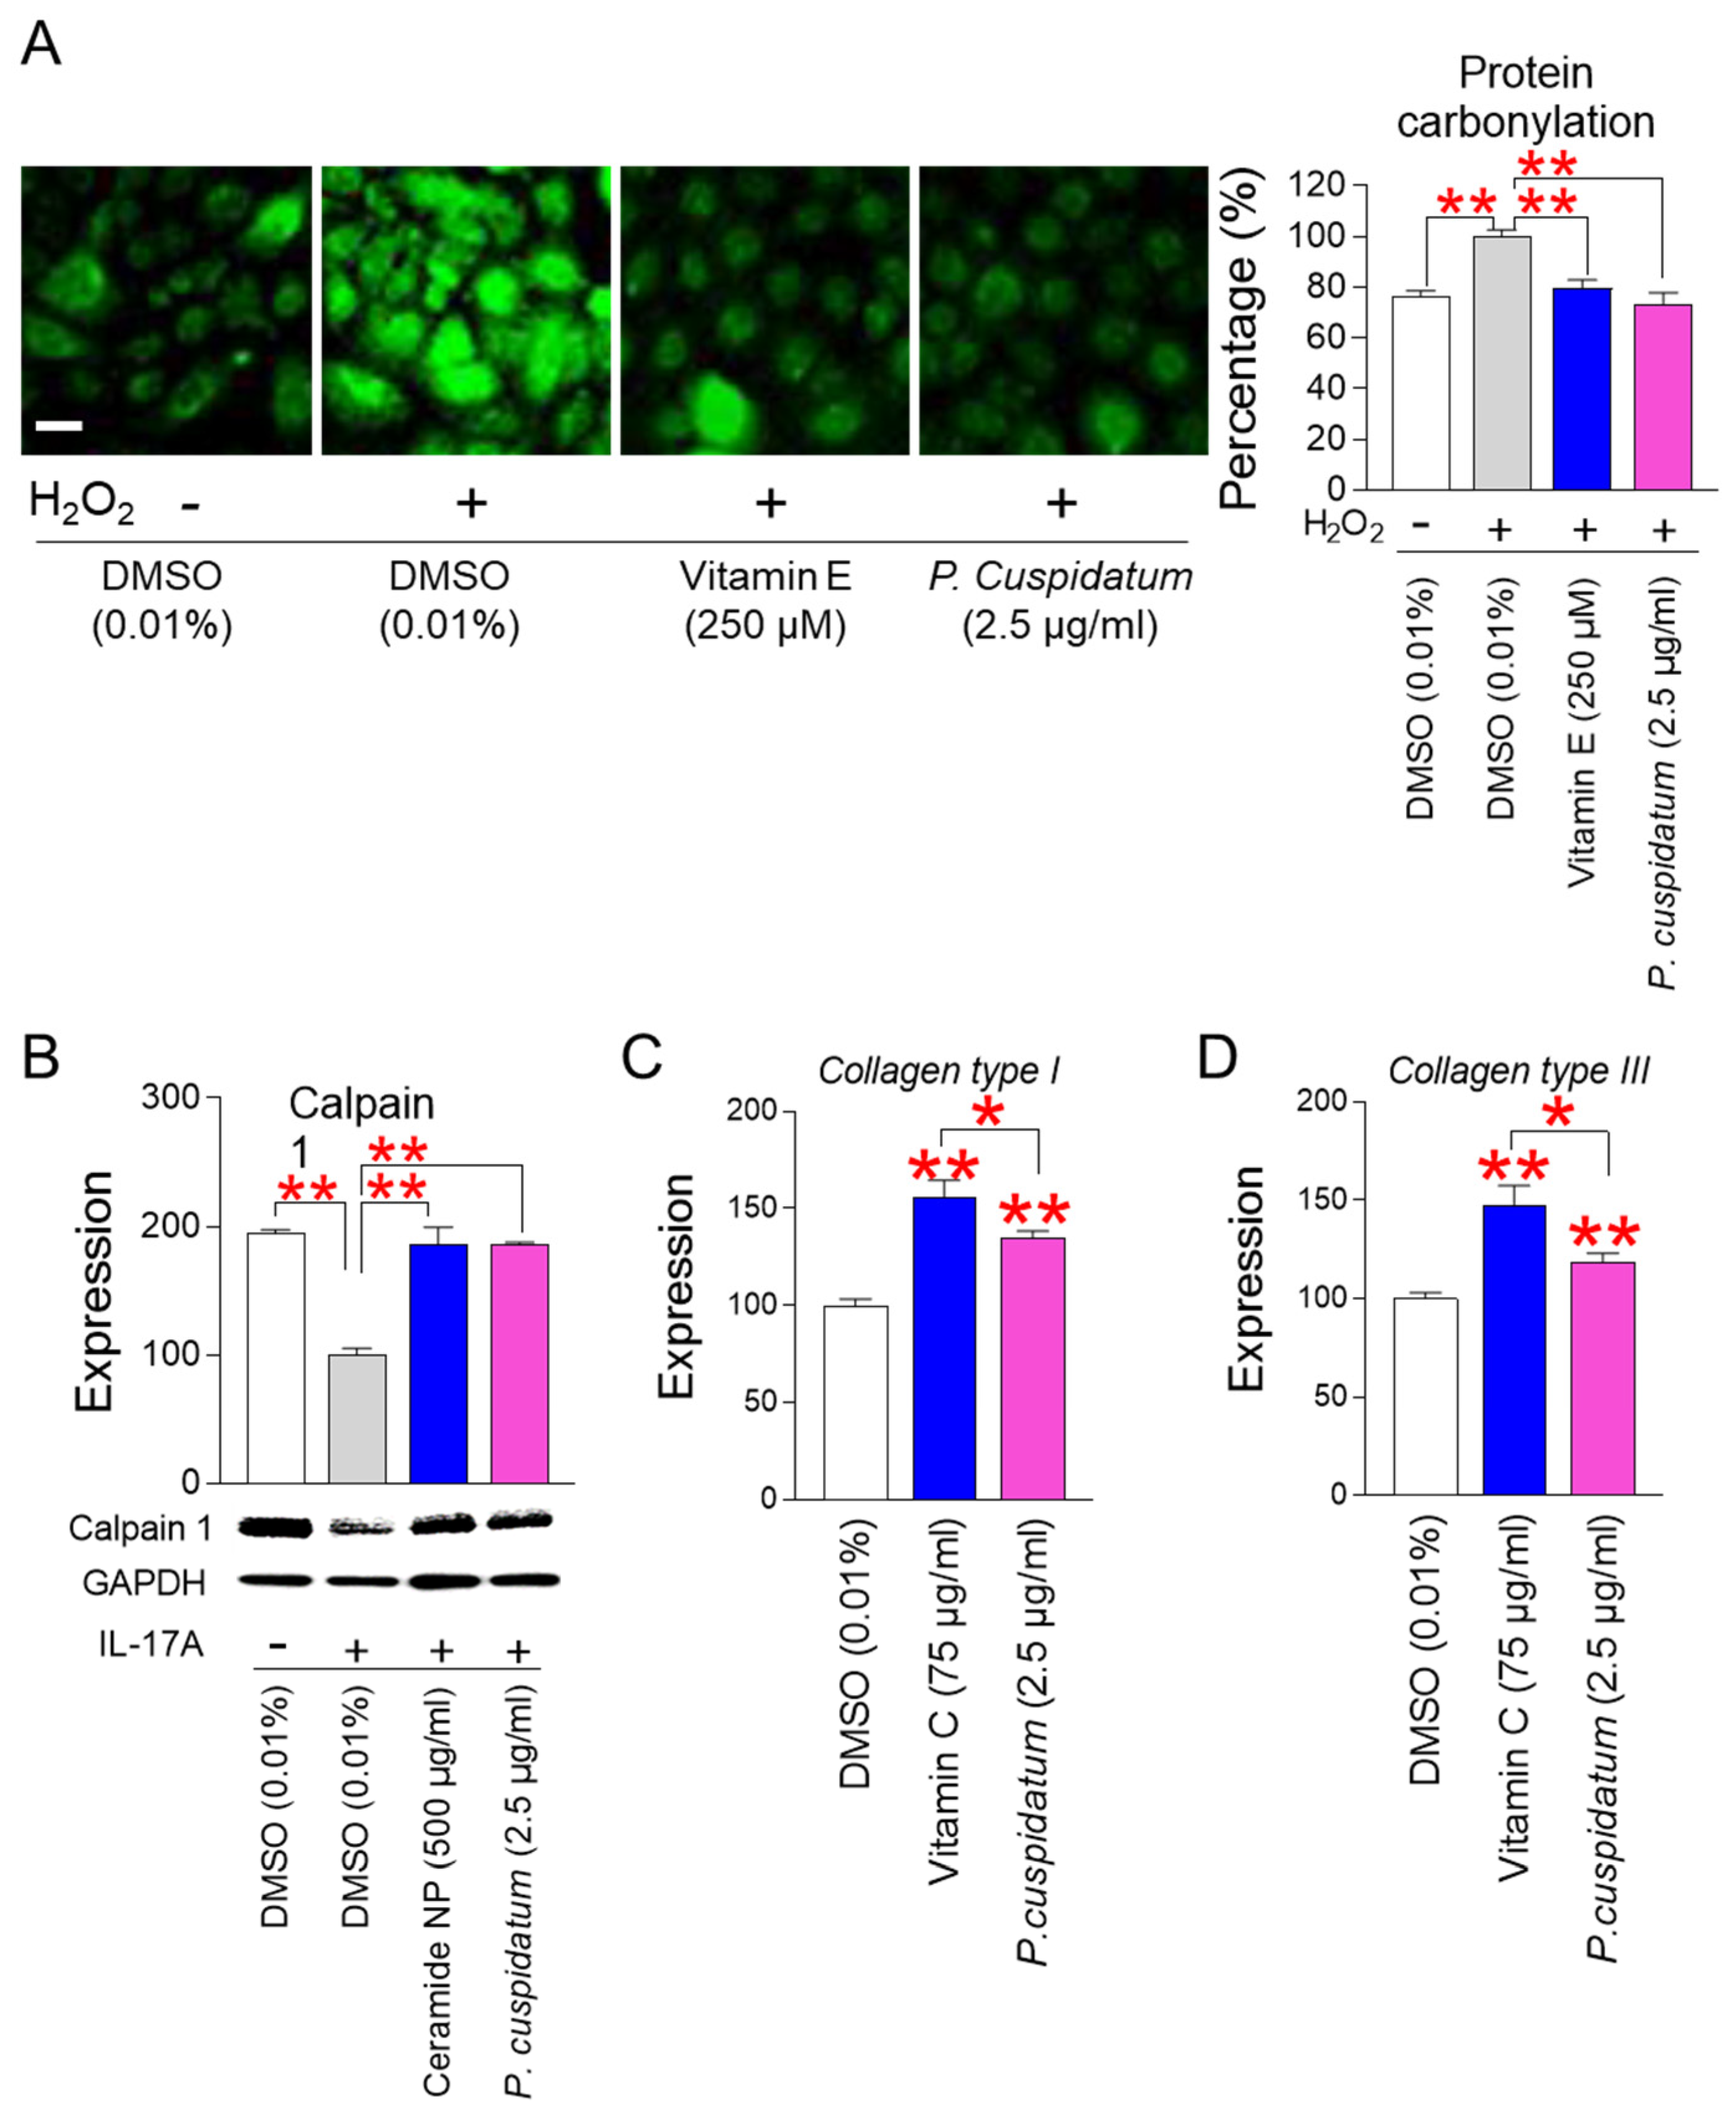
Carbonylated proteins generated by ROS-induced protein oxidation are known to be one of the main causes of skin barrier damage in the stratum corneum [54]. To investigate the effect of P. cuspidatum on protein carbonylation, normal human epidermal keratinocytes, HEKn cells, were used. HEKn cells were treated with hydrogen peroxide to induce protein carbonylation. As a positive control, vitamin E, commonly used as an antioxidant, was used [55]. Hydrogen peroxide treatment significantly increased protein carbonylation (Figure 6A, Supplementary Information S1). However, the antioxidant vitamin E significantly reduced protein carbonylation (Figure 6A, Supplementary Information S1). As seen for vitamin E, the level of protein carbonylation was significantly reduced by P. cuspidatum, indicating that P. cuspidatum reduced ROS-induced protein oxidation (Figure 6A, Supplementary Information S1).
Calpain 1 plays an important role in skin barrier formation through its role as an inhibitor of various inflammatory pathways [56,57]. IL-17A promotes skin inflammation by inducing various inflammatory cytokines and activating T cells [58,59]. Ceramide NP, which has a structure similar to the skin lipid barrier and is known to strengthen the lipid barrier of aged skin, was used as a positive control [60]. To investigate the role of P. cuspidatum extract on calpain 1 expression, HEKn cells were activated with IL-17A. IL-17A treatment significantly reduced the expression of calpain 1 protein, indicating IL-17A-mediated induction of skin inflammation (Figure 6B, Supplementary Information S2). Ceramide NP, used as a positive control, subtly increased calpain 1 expression (Figure 6B, Supplementary Information S2). However, the expression level of calpain 1 protein was significantly increased by P. cuspidatum, indicating that the P. cuspidatum extract restored skin barrier formation through its role as an inhibitor of skin inflammation (Figure 6B, Supplementary Information S2).
Collagen is a major component of dermal extracellular matrix. Changes in collagen content in the dermal are the driving force for skin aging [61]. Collagen types I and III are essential for skin tissue regeneration, and type III collagen synthesis increases in the early stage of skin regeneration, while type I collagen synthesis increases in the late stage of skin regeneration [62]. To investigate the role of P. cuspidatum extract on skin tissue regeneration, senescent fibroblasts were treated with P. cuspidatum extract. P. cuspidatum extract significantly increased the expression of collagen types I and III, indicating that P. cuspidatum is very effective in the early and late stages of skin regeneration (Figure 6C,D). As a positive control, we used vitamin C, which is an antioxidant and also participates in the redox recycling of other antioxidants [63]. Vitamin C, an antioxidant, significantly increased the expression of collagen types I and III, and the degree of increase was higher than that induced by P. cuspidatum extract (Figure 6C,D).

3.7. P. cuspidatum Extract Enhances Skin Protection through Inhibiting Skin Inflammation

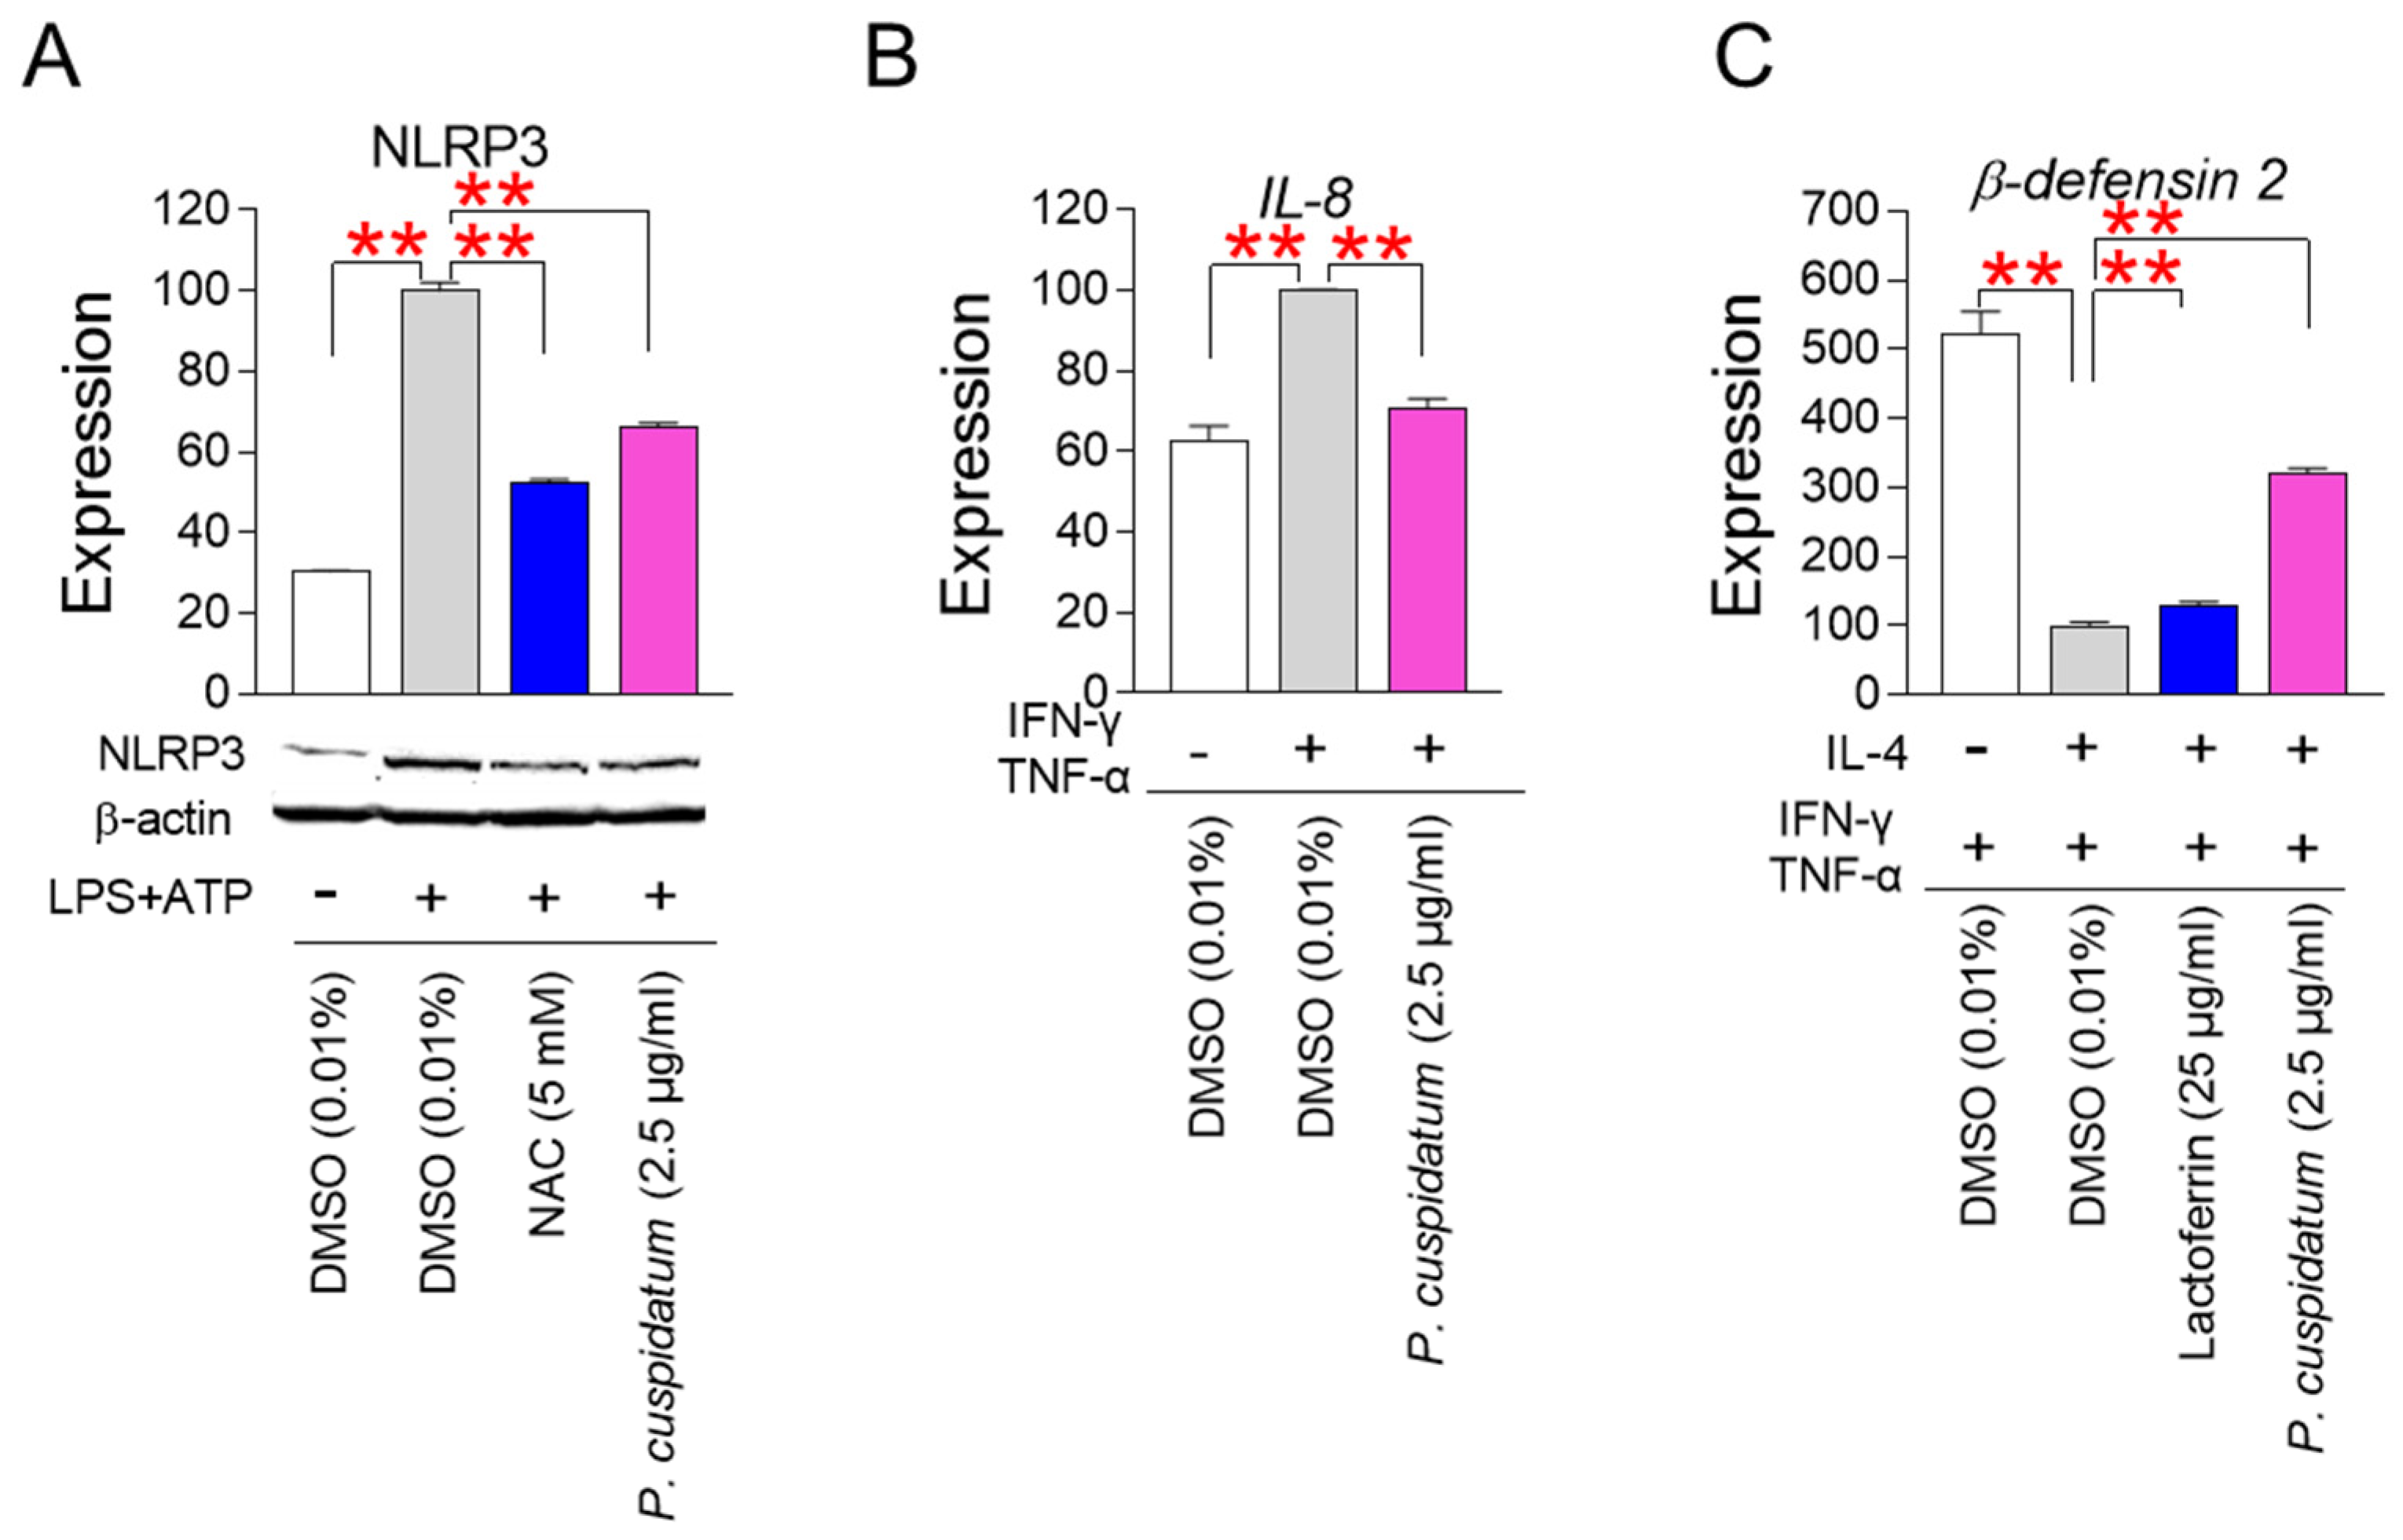
NLR family pyrin domain-containing 3 (NLRP3) plays a key role in regulating the innate immune system and inflammatory signaling [64]. NLRP3 is activated by lipopolysaccharide (LPS)/adenosine triphosphate (ATP) [65]. Since NLRP3 activation acts as an inducer of human autoimmune skin diseases, we investigated the effect of P. cuspidatum extract on NLRP3 levels. N-acetylcysteine (NAC), a ROS scavenger known to downregulate the NLRP3 inflammasome complex, was used as a positive control [66]. Activation of HaCaT cells by LPS/ATP significantly increased the expression of the NLRP3 protein (Figure 7A, Supplementary Information S2). However, NAC treatment significantly decreased NLRP3 expression (Figure 7A, Supplementary Information S2). Furthermore, the expression level of NLRP3 was significantly decreased by P. cuspidatum, indicating that the P. cuspidatum extract inhibited skin inflammation by downregulating NLRP3 expression (Figure 7A, Supplementary Information S2).
IL-8 is an inflammatory factor that plays a crucial role in skin inflammation [67]. IFN-γ and TNF-α, two cytokins released by activated T cells, synergistically activate IL-8 expression [68]. Activation of HaCaT cells by IFN-γ/TNF-α significantly upregulated IL-8 expression (Figure 7B). However, P. cuspidatum extract significantly reduced IL-8 expression levels, indicating that P. cuspidatum is very effective in preventing skin inflammation (Figure 7B).
β-defensin 2 is an antimicrobial peptide found in lesional skin and exhibits potent antimicrobial activity [69]. β-defensin 2 expression is increased by IFN-γ/TNF-α-mediated inflammation [70]. By contrast, IL-4 negatively regulates IFN-γ/TNF-α-induced β-defensin expression through activating signal transducer and activator of transcription 6 [71]. As a positive control, we used lactoferrin, which exhibits antimicrobial activity by limiting the amount of ions available for microbial metabolism [72]. To investigate the role of P. cuspidatum extract in β-defensin 2 expression, HaCaT cells activated by IFN-γ/TNF-α were treated with IL-4. IL-4 treatment decreased β-defensin 2 expression induced by IFN-γ/TNF-α (Figure 7C). However, lactoferrin exhibiting antimicrobial activity significantly increased β-defensin 2 expression (Figure 7C). As seen for lactoferrin, the expression level of β-defensin 2 was significantly increased by P. cuspidatum, indicating that the P. cuspidatum extract enhanced skin protective function by increasing antibacterial activity (Figure 7C).

3.8. Identification of Emodin and Polydatin from P. cuspidatum Extracts

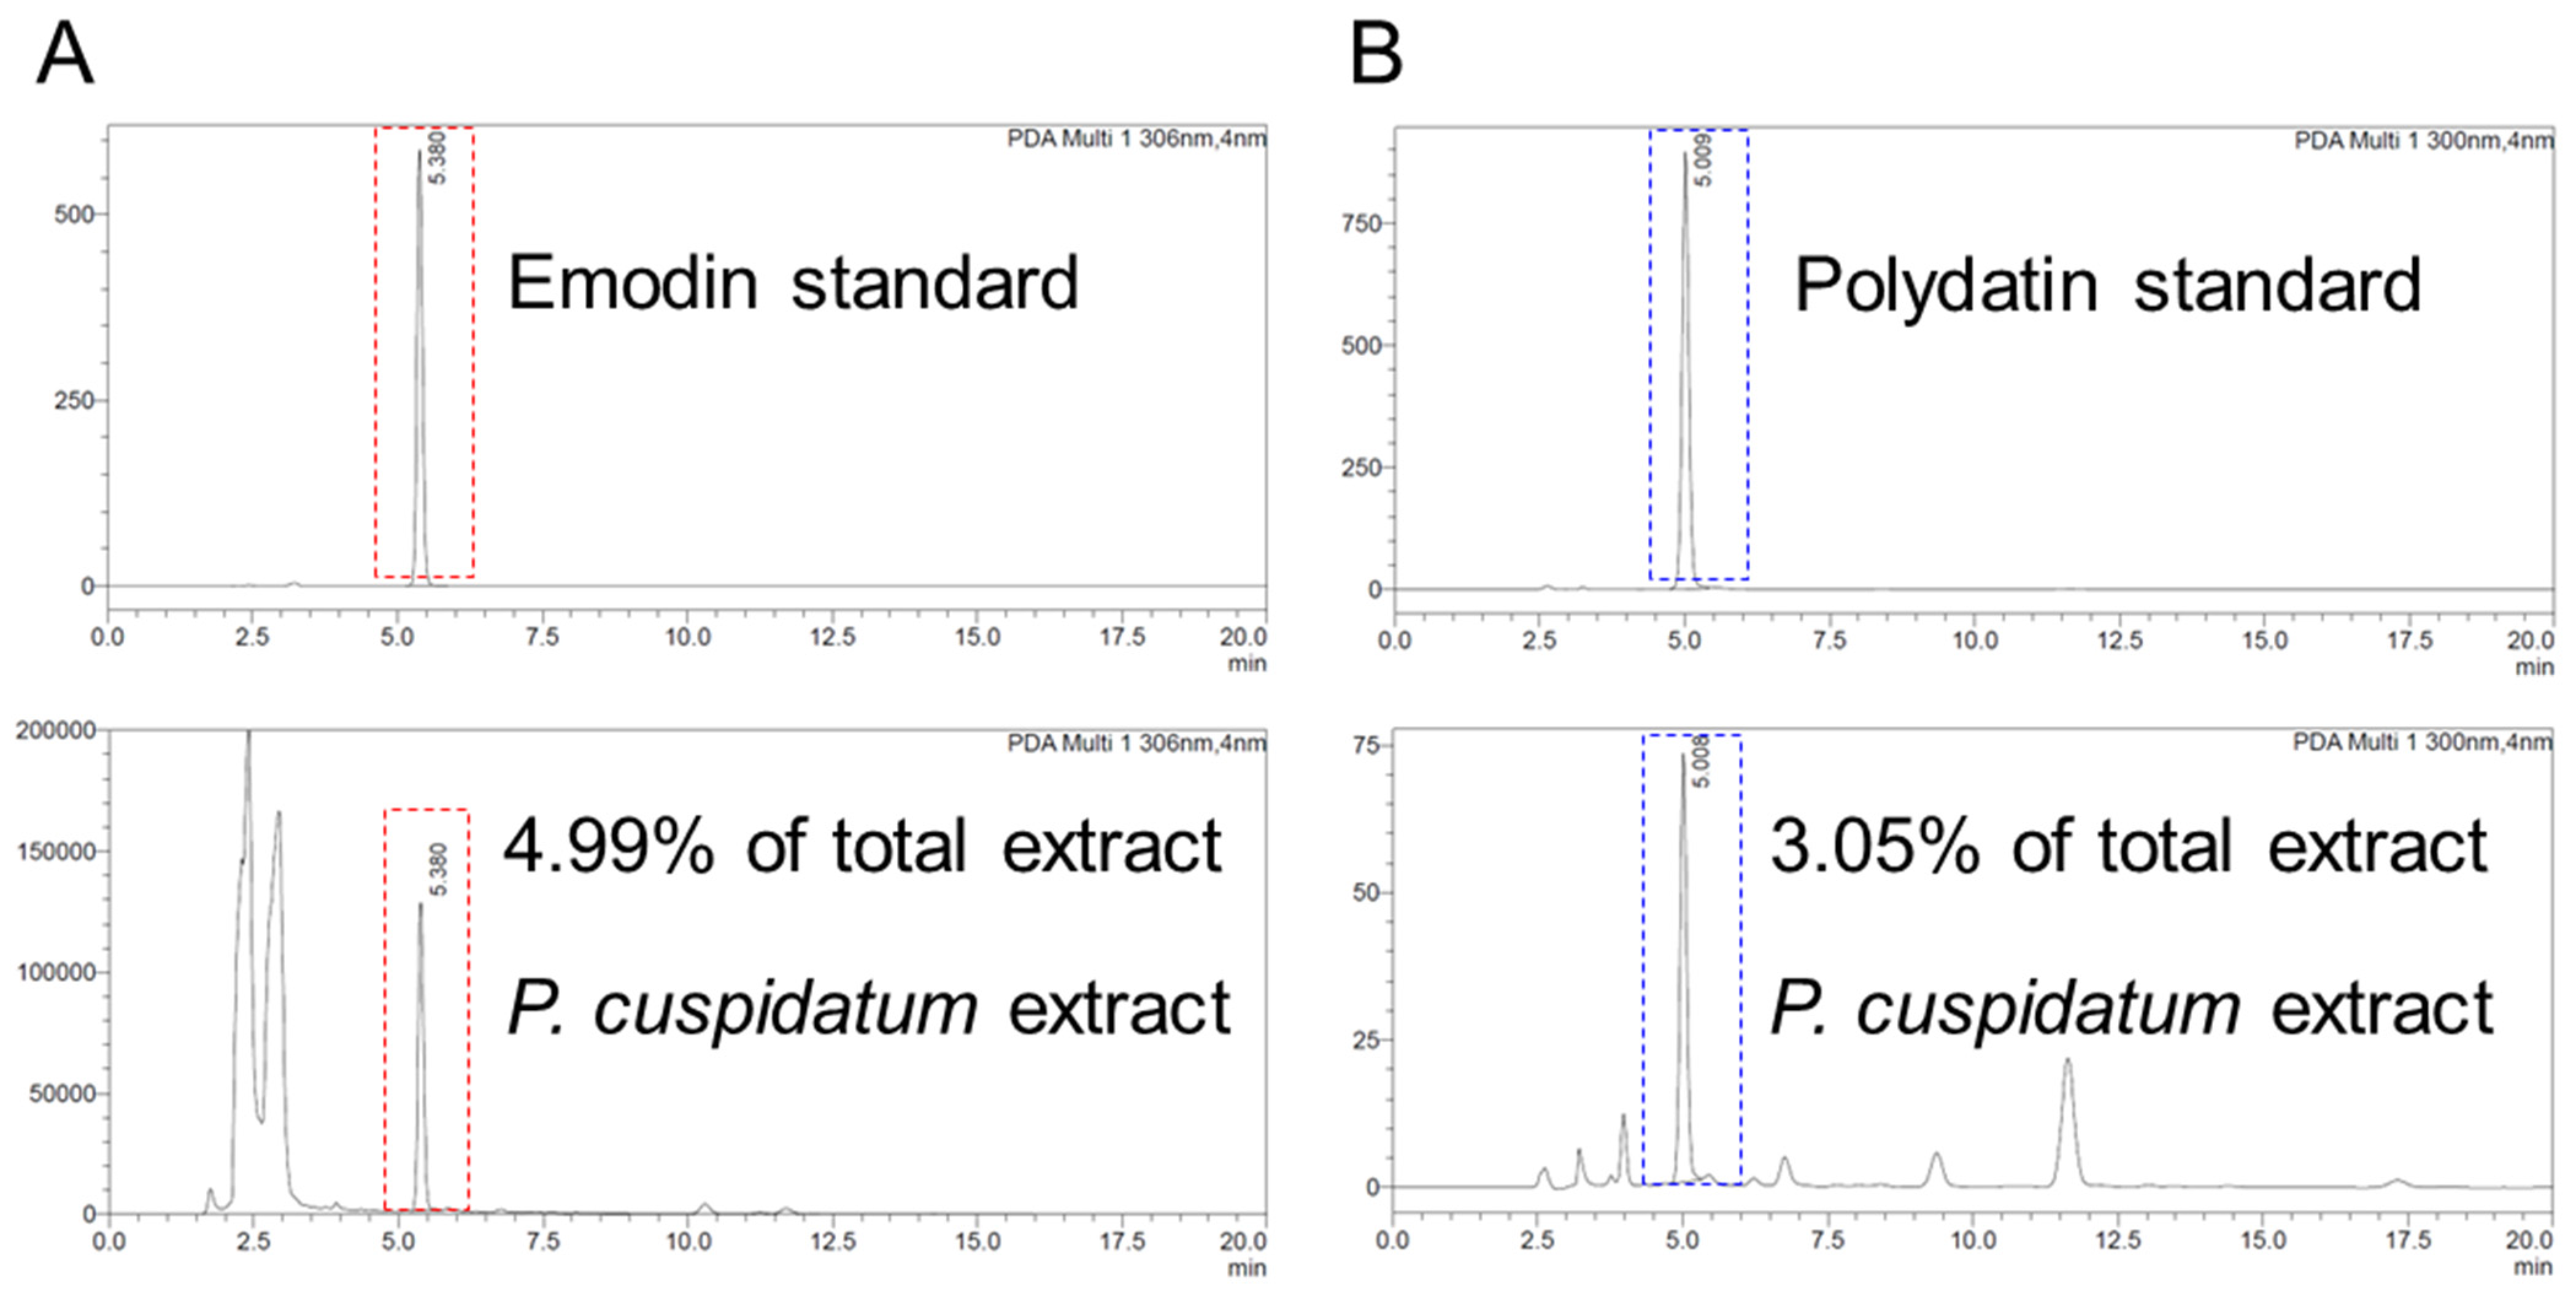
The discovery that P. cuspidatum extract is effective in enhancing skin protection by reducing oxidative stress led us to identify active ingredients with antioxidant effects among the components present in P. cuspidatum extract. Phytochemical components of P. cuspidatum extract were known to be phenolic compounds, stilbene derivatives, anthraquinone derivatives, and flavonoid compounds [73]. A literature review was conducted focusing on the antioxidant effects of phytochemical components. Two ingredients, emodin and polydatin, have been known to have antioxidant effects. Emodin, an anthraquinone derivative, has powerful antioxidant effects that may be useful against cancer [74]. Polydatin contains stilbenoid polyphenols, which act as singlet oxygen scavengers through redox reactions [75]. Therefore, first, liquid chromatography was performed to determine how much polydatin and emodin were present in the P. cuspidatum extract. The HPLC peak of the P. cuspidatum extract matched the emodin standard, and the amount of emodin present in the P. cuspidatum extract was 4.99% (Figure 8A). These results were comparable with previously tested and published results (3.37% ± 0.15%, N = 26) [76]. The HPLC peak of the P. cuspidatum extract matched the polydatin standard, and its amount was 3.05% of the total extract (Figure 8B). These results were comparable with previously tested and published results (4.08%, N = 1) [14].

3.9. Identification of Polydatin as an Active Ingredient Showing Antioxidant Effects

To identify active ingredients that exhibit antioxidant effects, senescent fibroblasts were treated with various concentrations of emodin and polydatin. Then, their effects on ROS levels and subsequent effects on senescence-associated phenotypes were evaluated. Autofluorescence, which is used to measure the amount of intracellular lipofuscin, a senescence-associated phenotype, was measured [51]. P. cuspidatum extract was used as a positive control. The significant ROS-reducing effect of emodin was observed at concentrations of 0.1, 1, and 10 μM (Figure 9A). However, the ROS-reducing effect of emodin did not reduce the level of autofluorescence, indicating that the antioxidant effects of emodin were not sufficient to reduce the senescence-associated phenotype (Figure 9B).
Polydatin was effective in reducing ROS levels at concentrations of 0.1, 1, 4, 8, and 10 μM (Figure 9C). Furthermore, polydatin was effective in reducing autofluorescence levels at concentrations of 0.1, 1, 4, 8, and 10 μM (Figure 9D). In particular, at 8 and 10 μM concentrations, polydatin was more effective in reducing ROS levels and autofluorescence levels than P. cuspidatum extract. Based on these data, polydatin was chosen to be an active ingredient that exhibits antioxidant effects and reduces the senescence-associated phenotype. 8 μM polydatin was selected as the optimal concentration for the following experiments because it was the minimal concentration that was more effective than P. cuspidatum extract.

3.10. Polydatin Reduces Mitochondrial ROS Generation by Increasing OXPHOS Efficiency

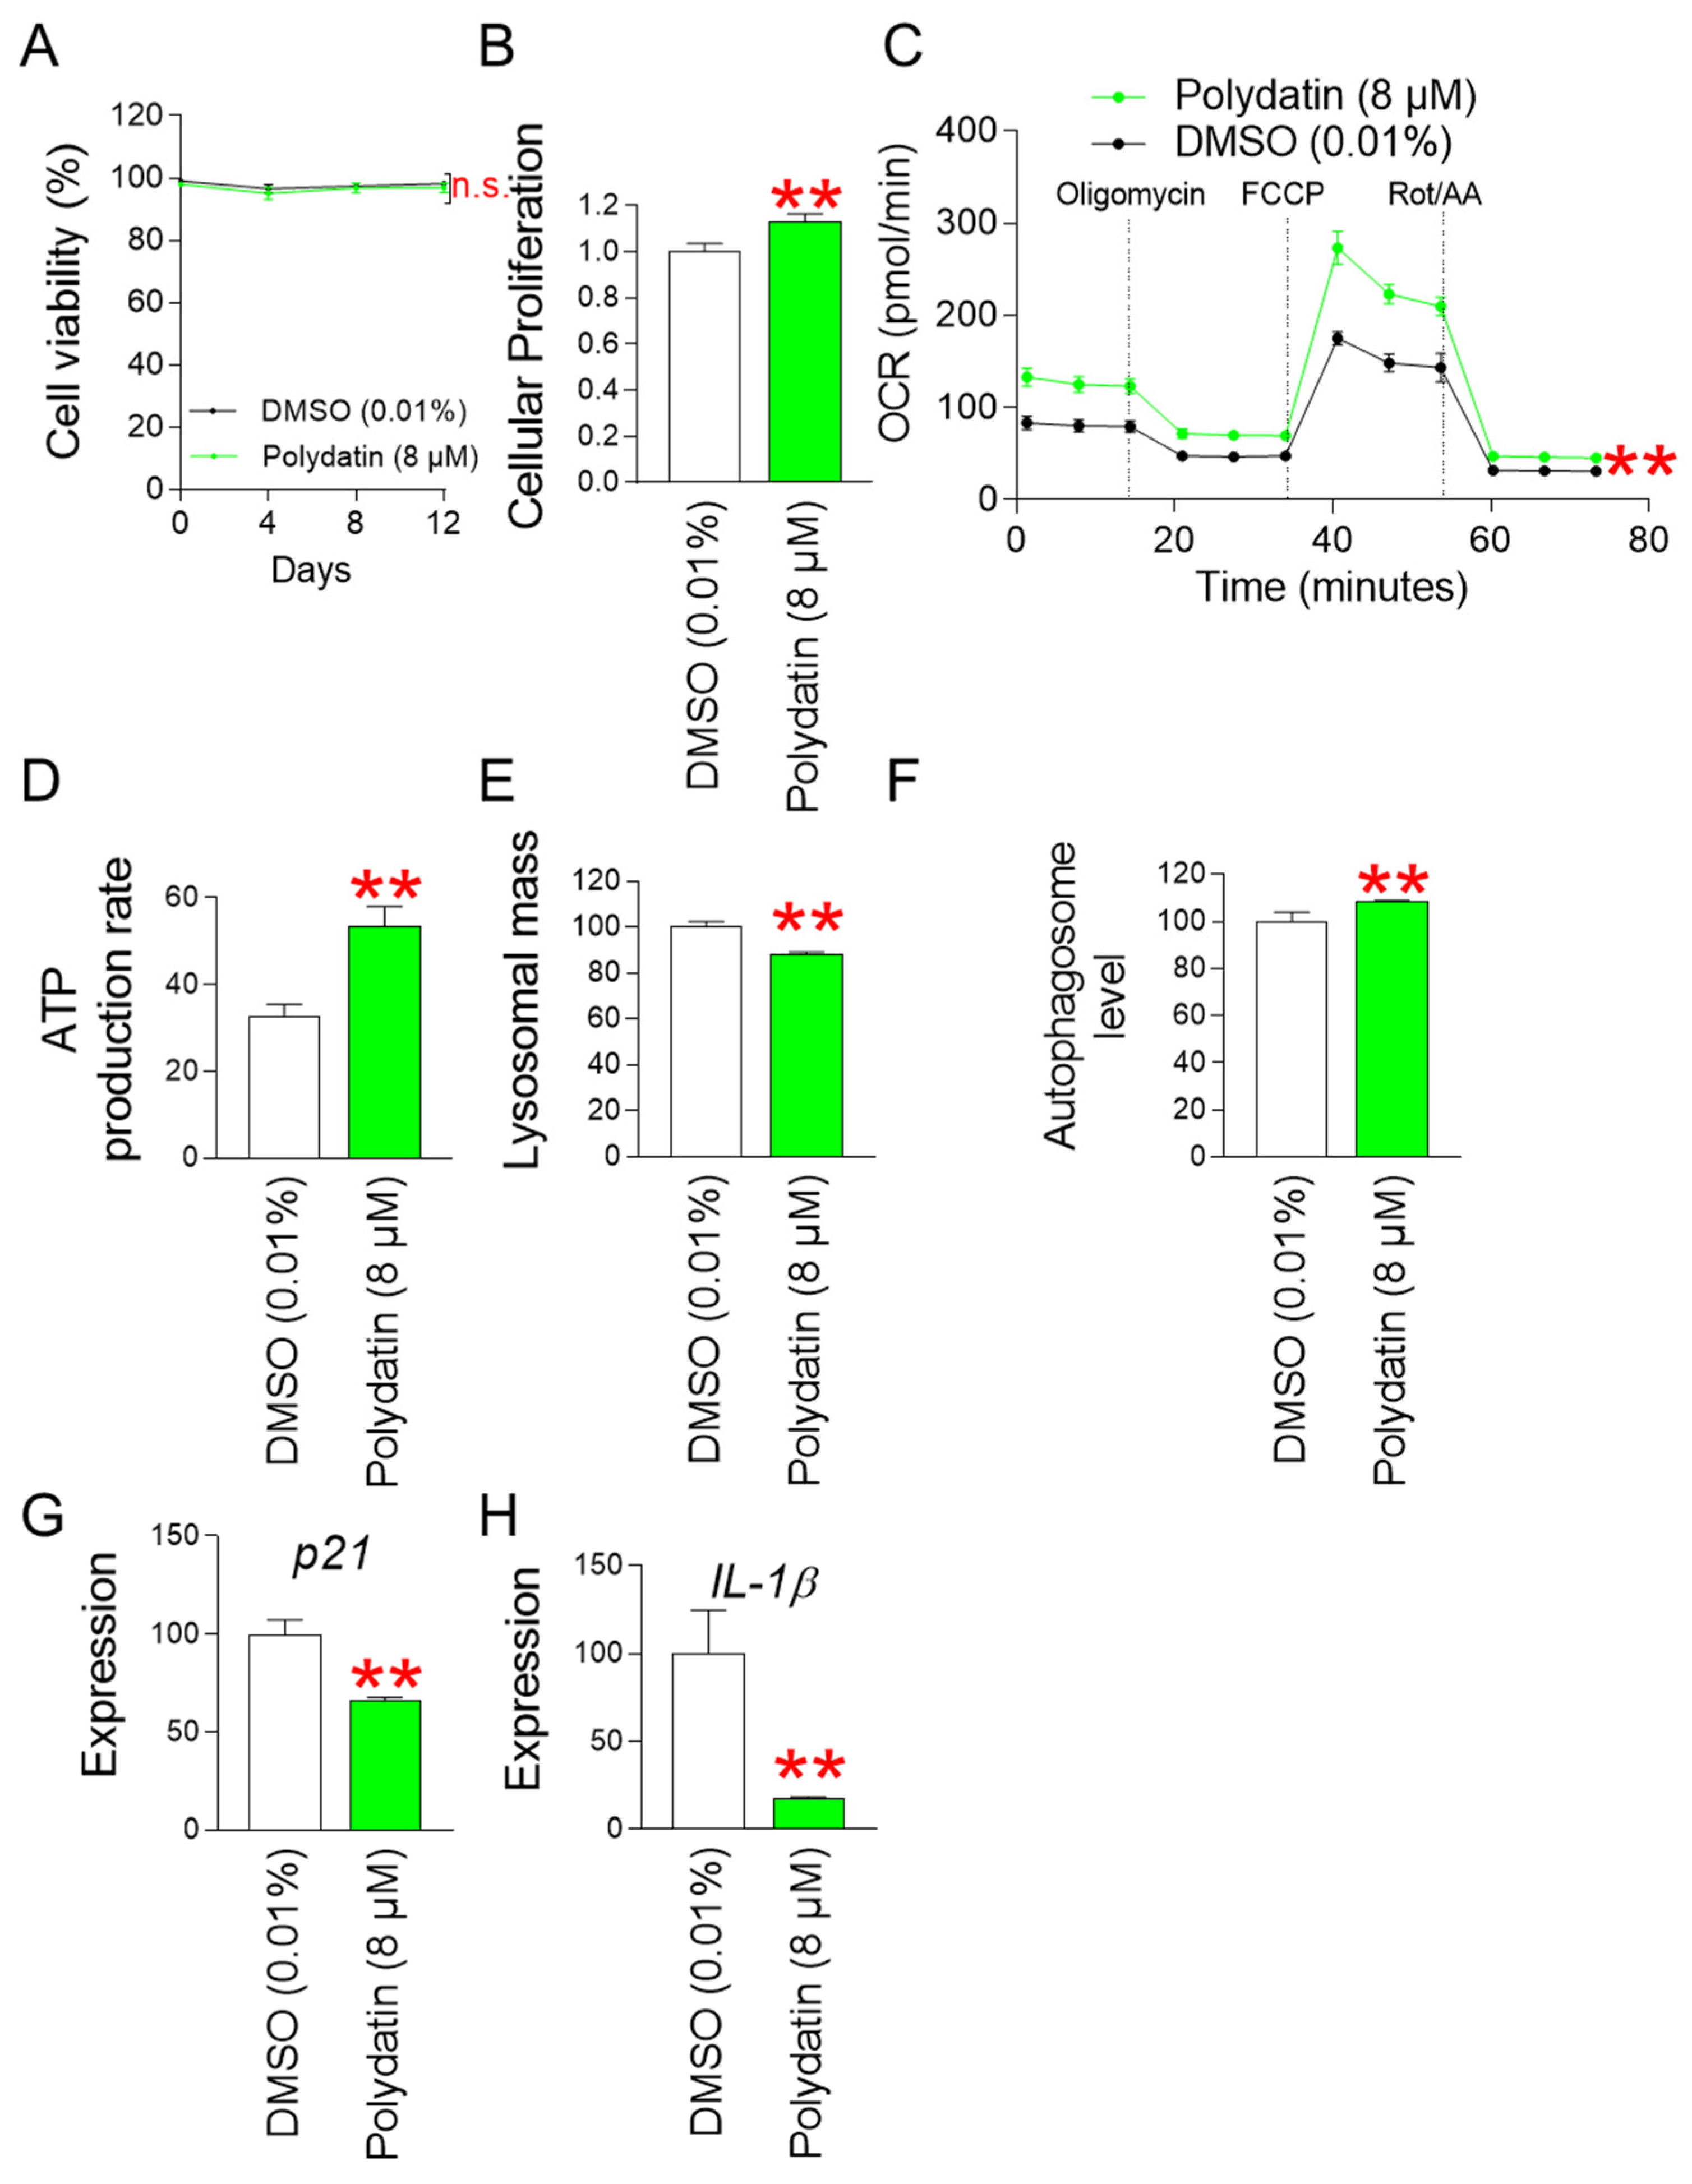
Next, we investigated the toxicity of polydatin at selected concentrations by examining cell viability. Senescent fibroblasts treated with polydatin exhibited similar viability as fibroblasts treated with DMSO, suggesting that polydatin at selected concentrations was not toxic to the cells (Figure 10A). We then examined the effect of polydatin on cellular proliferation at the selected concentration. Senescent fibroblasts treated with polydatin showed a cell proliferation-inducing effect similar to that induced by P. cuspidatum extract (Figure 10B).
Since we observed an increase in OXPHOS efficiency by P. cuspidatum, we also investigated the effect of polydatin on OXPHOS efficiency. Polydatin increased OCR levels, confirming the increased OXPHOS efficiency by polydatin (Figure 10C). As a result, polydatin-mediated increase in OXPHOS efficiency led to an increase in ATP production rate (Figure 10D).
Since we observed restoration of the lysosomal/autophagic system by P. cuspidatum at the autophagosome level, we investigated the effect of polydatin on the lysosomal/autophagic system. Polydatin decreased lysosomal mass levels and increased autophagosome levels (Figure 10E,F). These data imply that polydatin plays an important role in the restoration of the lysosomal/autophagic system.
The restoration of mitochondrial and lysosomal function by polydatin led us to investigate the effects of polydatin on other senescence-associated phenotypes. Polydatin significantly reduced p21 expression compared to DMSO control, indicating cell cycle progression induced by polydatin (Figure 10G). Polydatin also significantly reduced IL-1β expression compared to DMSO control, suggesting that polydatin reduces anti-inflammatory cytokines (Figure 10H).

4. Discussion

Oxidative stress induced by ROS is closely linked to the onset and progression of aging [77]. ROS irreversibly damages proteins, lipids, DNA, and RNA, causing aging and age-related diseases [78]. A causal link between excessive oxidative stress and aging is supported by studies in the Caenorhabditis elegans aging model, which showed that increased oxidative stress by ROS causes physiological changes associated with premature aging, such as the accumulation of lipofuscin and carbonylated proteins [79,80]. Additional studies using mice deficient in superoxide dismutase 1 (SOD1), which is present in the mitochondrial intermembrane space and matrix, support this causal relationship [81]. SOD1 deficiency increased O2•− formation and subsequent oxidative damage, leading to aging through a premature loss of skeletal muscle [81]. Mitochondria are the major organelles that generate oxidative stress within cells. More than 90% of oxygen is consumed in mitochondria, and 1–5% of oxygen is changed to highly reactive O2•− by complexes I and III present in the ETC [41]. In the mitochondrial matrix, complexes I and III change oxygen into the O2•−. O2•− is also generated by complex III in the intermembrane space of mitochondria. Mitochondrial dysfunction due to senescence reduces the activity of complexes present in the ETC, particularly complex I [82,83]. Complex I with impaired function cannot perform efficient electron transport, increases electron leakage to oxygen, and generates O2•− [82,83]. Increased mitochondrial ROS production makes mitochondria targets for mitochondrial oxidative stress, further increasing mitochondrial ROS production [42]. A vicious loop between mitochondrial ROS generation and oxidative stress exacerbates the morphology and function of cellular organelles, ultimately causing senescence [84]. This causal relationship highlights the reduction in oxidative stress as an effective strategy to ameliorate senescence [42]. In this study, we discovered a novel mechanism by which P. cuspidatum reduced mitochondrial ROS production through increasing mitochondrial OXPHOS efficiency. Enhanced OXPHOS efficiency by P. cuspidatum extract suggests efficient electron transport in the mitochondrial ETC [85,86]. Since efficient electron transport promotes proton transport from the mitochondrial matrix to the mitochondrial intermembrane space, thereby increasing MMP [87], this is indirectly supported by the increased MMP by P. cuspidatum extract. Increased MMP increased mitochondrial ATP production [88,89], suggesting restoration of mitochondrial function by P. cuspidatum extract. Furthermore, the restoration of mitochondrial function by P. cuspidatum extract led to the recovery of several aging-related phenotypes [90,91]. Therefore, our results demonstrate for the first time that P. cuspidatum extract reverses senescence by reducing mitochondrial ROS production. We propose that reducing oxidative stress using P. cuspidatum extract might be a first step toward an effective therapeutic strategy against aging and age-related diseases.
Skin aging is one of the most obvious signs of aging [92]. Oxidative stress caused by free radicals is known to be the main cause of skin aging [93]. Therefore, antioxidants that balance unstable free radicals that damage skin tissues, especially collagen, have been widely used to delay or prevent skin aging [94]. For example, vitamin C, known as an antioxidant, has been shown to reduce free radical production and minimize damage to natural collagen in skin tissues [95]. In addition, niacinamide, an antioxidant, has been shown to protect skin from free radical damage, smooth uneven skin texture, and reduce the appearance of skin moisture [96]. In this study, we found that the reduction in mitochondrial ROS production by P. cuspidatum extract played an important role in the restoration of skin barrier formation. Specifically, P. cuspidatum extract reduced carbonylated proteins that damage the skin barrier in the stratum corneum [97]. The restoration of skin barrier formation by P. cuspidatum extract was evidenced by the increased expression of calpain 1 and major collagen types. Extending the relevance of these findings, this restoration was further supported by the enhancement of skin immune defense through the reduced expression of inflammatory factors and increased antimicrobial activity. Taken together, our findings suggest that reducing mitochondrial ROS production by P. cuspidatum extract might be an effective therapeutic strategy to enhance skin protection by restoring skin barrier formation and inhibiting skin inflammation.
Natural substances are widely used as cosmetic additives because they have a lower risk of causing adverse effects on the skin than synthetically manufactured compounds [98]. Various natural substances are added to cosmetics and are known to be effective in restoring skin aging [99]. However, since natural substances contain various ingredients, identifying effective ingredients is a very important step. Identifying effective ingredients can minimize the use of unnecessary or harmful substances contained in natural substances for restoring skin aging [100]. In addition, the ingredients of natural substances may change due to changes in the cultivation site or climate [101]. Such changes in the ingredients of natural substances can also cause changes in the performance of cosmetics that use natural substances as additives [99,102]. In this study, we confirmed that the antioxidant active component of P. cuspidatum extract was polydatin. Polydatin is a stilbenoid polyphenol and a resveratrol derivative with more biological activity [75]. Since the phenol group acts as a reducing agent, hydrogen donor, and singlet oxygen scavenger through redox reactions [103], the stilbenoid polyphenol of polydatin plays a leading role in the antioxidant effect [75]. In fact, polydatin was confirmed to significantly reduce ROS levels in senescent fibroblasts, similar to P. cuspidatum extract. This reduction may be due to the antioxidant effect of the stilbenoid polyphenol of polydatin, although we have not directly verified this. In addition, we found that this reduction was due to polydatin increasing OXPHOS efficiency and reducing mitochondrial ROS production, similar to the P. cuspidatum extract. To the best of our knowledge, this is the first study to show that polydatin reduces mitochondrial ROS production through increasing OXPHOS efficiency. We propose that the use of polydatin as a cosmetic additive can be effective in reversing skin aging while minimizing potential problems that may arise when using natural substances.
Pathological levels of ROS are known to permanently damage proteins, lipids, DNA, and RNA, which is ultimately one of the major causes of aging and age-related diseases [104]. Specifically, the accumulation of oxidative damage caused by ROS induces abnormalities in p53 signaling function, leading to prolonged cell cycle arrest and subsequent senescence [6,105,106,107,108]. In addition, excessive ROS induces collagen and elastin chain cleavage, which worsens skin aging [6]. Consequently, therapeutic strategies that reduce ROS levels are emerging as one of the effective treatments for anti-aging and age-related diseases [42]. However, physiological levels of ROS serve as physiological mediators and important second messenger signaling molecules in various cellular and developmental processes [109]. In particular, ROS within the physiological nanomolar concentration range induces the reversible oxidation of protein targets to regulate cellular metabolism and stress responses [110]. Moreover, physiological levels of ROS can induce adaptive responses that enhance endogenous antioxidant defenses, reduce long-term oxidative damage, and improve overall stress tolerance [111]. The importance of physiological levels of ROS is further supported by the finding that mitohormesis, a systemic adaptive response that promotes longevity, is regulated by moderate levels of ROS [112]. In this study, we revealed a novel mechanism by which P. cuspidatum extract reduces ROS by increasing OXPHOS efficiency. Next, we found that the active component of P. cuspidatum extract with antioxidant properties is polydatin. Effectively reducing ROS levels using P. cuspidatum extract and polydatin is an effective treatment to reverse senescence, but reducing ROS levels below physiological levels may have hazardous consequences and should be approached with caution.
P. cuspidatum extract has been confirmed to enhance skin protection by restoring skin barrier formation and suppressing skin inflammation. However, further studies are needed to directly utilize P. cuspidatum extract as a cosmetic raw material. First, although the efficacy was observed at 2.5 μg/mL, a concentration optimization process of P. cuspidatum extract is necessary for use in cosmetics. For example, the minimum concentration that shows skin whitening, skin regeneration, and skin elasticity effects without toxicity should be determined after serially diluting the substance and applying it to each test [113,114]. Then, the minimum concentration of P. cuspidatum extract should be applied when formulating cosmetics. Second, studies should be conducted to determine how well P. cuspidatum extract or its active ingredient, polydatin, penetrates human skin. The stratum corneum of the skin acts as a barrier that only allows small molecules and lipophilic compounds to penetrate [115]. Even cosmetic additives that show efficacy cannot be effective if they cannot penetrate the skin barrier [116]. Although the skin penetrance of polydatin has not been studied, strategies to chemically modify the functional groups of polydatin can be applied to improve the penetration [117]. In addition, the skin penetration of P. cuspidatum extract or polydatin can be improved by using carriers. For example, phospholipids or lipid nanoparticles have a structure similar to cell membranes, which can effectively deliver active ingredients that have difficulty penetrating skin cells [118]. Finally, further studies should be conducted to determine whether P. cuspidatum extract or polydatin interacts with other ingredients to produce toxic substances. Cosmetic ingredients can interact with each other to form hazardous substances (e.g., nitrosamines) that can have harmful effects on skin [119]. Therefore, intensive studies should be conducted to determine whether hazardous substances are produced when P. cuspidatum extract or polydatin is used in various combinations with existing cosmetic ingredients.

5. Conclusions

In summary, we discovered a novel mechanism by which P. cuspidatum extract reduces ROS levels by increasing mitochondrial OXPHOS efficiency. The reduction in oxidative stress by P. cuspidatum extract restored senescence-associated phenotypes and enhanced skin protection. Furthermore, polydatin, one of the components of P. cuspidatum extract, was identified as an effective component that exhibits antioxidant activity. Polydatin also increased OXPHOS efficiency and subsequently reduced mitochondrial ROS generation, thereby reducing senescence-associated phenotypes. Our results revealed the novel mechanism of restoring senescence and enhancing skin protection by P. cuspidatum extract. If further studies on P. cuspidatum extract or polydatin are conducted from various perspectives, the novel mechanism revealed in this study may or may not be applied for clinical or cosmetic purposes in the future, but it will serve as a starting point for various in vitro studies.

Supplementary Materials

The following supporting information can be downloaded at https://www.mdpi.com/article/10.3390/antiox13091110/s1, Supplementary Information S1: Full-size image of immunofluorescence in Figure 6A. Supplementary Information S2: Full-size image of western blot (A) Figure 6B, (B) Figure 7A.

Author Contributions

Writing—original draft preparation, J.H.Y., Y.H.L., Y.B., S.S.S. and J.T.P.; Writing—review and editing, E.Y.J. and Y.H.K.; Investigation, J.H.Y., E.Y.J., Y.H.K. and Y.B. All authors have read and agreed to the published version of the manuscript.

Funding

This research was supported by a grant of the Korea Health Technology R&D Project through the Korea Health Industry Development Institute (KHIDI), funded by the Ministry of Health & Welfare, Republic of Korea (HP23C0024).

Institutional Review Board Statement

Not applicable.

Informed Consent Statement

Not applicable.

Data Availability Statement

The original contributions presented in the study are included in the article, further inquiries can be directed to the corresponding authors.

Conflicts of Interest

The authors affiliated with Incheon National University (J.H.Y., Y.H.L. and J.T.P.) and Korea University (Y.B.) did not receive any research funding from Hyundai Bioland Co., Ltd. Incheon National University (J.H.Y., Y.H.L. and J.T.P.), Korea University (Y.B.), and Hyundai Bioland Co., Ltd. (E.Y.J., Y.H.K. and S.S.S.) contributed equally to all experiments performed in this study. The authors declare no conflicts of interest. The funders had no role in the collection, analyses, or interpretation of data; in the writing of the manuscript; or in the decision to publish the paper.

References

  1. Boismal, F.; Serror, K.; Dobos, G.; Zuelgaray, E.; Bensussan, A.; Michel, L. Skin aging: Pathophysiology and innovative therapies. Med. Sci. M/S 2020, 36, 1163–1172. [Google Scholar] [CrossRef]
  2. Chaudhary, M.; Khan, A.; Gupta, M. Skin Ageing: Pathophysiology and Current Market Treatment Approaches. Curr. Aging Sci. 2020, 13, 22–30. [Google Scholar] [CrossRef] [PubMed]
  3. Martic, I.; Papaccio, F.; Bellei, B.; Cavinato, M. Mitochondrial dynamics and metabolism across skin cells: Implications for skin homeostasis and aging. Front. Physiol. 2023, 14, 1284410. [Google Scholar] [CrossRef]
  4. Boffoli, D.; Scacco, S.C.; Vergari, R.; Solarino, G.; Santacroce, G.; Papa, S. Decline with age of the respiratory chain activity in human skeletal muscle. Biochim. Et Biophys. Acta (BBA)—Mol. Basis Dis. 1994, 1226, 73–82. [Google Scholar] [CrossRef]
  5. Hwang, E.; Yoon, G.; Kang, H. A comparative analysis of the cell biology of senescence and aging. Cell. Mol. Life Sci. 2009, 66, 2503–2524. [Google Scholar] [CrossRef] [PubMed]
  6. Giorgi, C.; Marchi, S.; Simoes, I.C.M.; Ren, Z.; Morciano, G.; Perrone, M.; Patalas-Krawczyk, P.; Borchard, S.; Jędrak, P.; Pierzynowska, K.; et al. Mitochondria and Reactive Oxygen Species in Aging and Age-Related Diseases. Int. Rev. Cell Mol. Biol. 2018, 340, 209–344. [Google Scholar] [CrossRef] [PubMed]
  7. Zhavoronkov, A.; Smit-McBride, Z.; Guinan, K.J.; Litovchenko, M.; Moskalev, A. Potential therapeutic approaches for modulating expression and accumulation of defective lamin A in laminopathies and age-related diseases. J. Mol. Med. 2012, 90, 1361–1389. [Google Scholar] [CrossRef]
  8. Richards, S.A.; Muter, J.; Ritchie, P.; Lattanzi, G.; Hutchison, C.J. The accumulation of un-repairable DNA damage in laminopathy progeria fibroblasts is caused by ROS generation and is prevented by treatment with N-acetyl cysteine. Hum. Mol. Genet. 2011, 20, 3997–4004. [Google Scholar] [CrossRef]
  9. Sohn, E.; Kim, J.; Kim, C.S.; Jo, K.; Lee, Y.M.; Kim, J.S. Root of Polygonum cuspidatum extract reduces progression of diabetes-induced mesangial cell dysfunction via inhibition of platelet-derived growth factor-BB (PDGF-BB) and interaction with its receptor in streptozotocin-induced diabetic rats. BMC Complement. Altern. Med. 2014, 14, 477. [Google Scholar] [CrossRef] [PubMed]
  10. Yang, Y.; Xu, J.; Tu, J.; Sun, Y.; Zhang, C.; Qiu, Z.; Xiao, H. Polygonum cuspidatum Sieb. et Zucc. Extracts improve sepsis-associated acute kidney injury by inhibiting NF-κB-mediated inflammation and pyroptosis. J. Ethnopharmacol. 2024, 319, 117101. [Google Scholar] [CrossRef]
  11. Sohn, E.; Kim, J.; Kim, C.S.; Lee, Y.M.; Kim, J.S. Extract of Polygonum cuspidatum Attenuates Diabetic Retinopathy by Inhibiting the High-Mobility Group Box-1 (HMGB1) Signaling Pathway in Streptozotocin-Induced Diabetic Rats. Nutrients 2016, 8, 140. [Google Scholar] [CrossRef] [PubMed]
  12. Kim, Y.S.; Nam, Y.; Song, J.; Kim, H. Gastroprotective and Healing Effects of Polygonum cuspidatum Root on Experimentally Induced Gastric Ulcers in Rats. Nutrients 2020, 12, 2241. [Google Scholar] [CrossRef] [PubMed]
  13. Ke, J.; Li, M.T.; Xu, S.; Ma, J.; Liu, M.Y.; Han, Y. Advances for pharmacological activities of Polygonum cuspidatum—A review. Pharm. Biol. 2023, 61, 177–188. [Google Scholar] [CrossRef] [PubMed]
  14. Lin, S.; Wang, X.; Tang, R.W.; Lee, H.C.; Chan, H.H.; Choi, S.S.A.; Dong, T.T.; Leung, K.W.; Webb, S.E.; Miller, A.L.; et al. The Extracts of Polygonum cuspidatum Root and Rhizome Block the Entry of SARS-CoV-2 Wild-Type and Omicron Pseudotyped Viruses via Inhibition of the S-Protein and 3CL Protease. Molecules 2022, 27, 3806. [Google Scholar] [CrossRef] [PubMed]
  15. Song, J.-H.; Kim, S.-K.; Chang, K.-W.; Han, S.-K.; Yi, H.-K.; Jeon, J.-G. In vitro inhibitory effects of Polygonum cuspidatum on bacterial viability and virulence factors of Streptococcus mutans and Streptococcus sobrinus. Arch. Oral Biol. 2006, 51, 1131–1140. [Google Scholar] [CrossRef]
  16. Quinty, V.; Colas, C.; Nasreddine, R.; Nehmé, R.; Piot, C.; Draye, M.; Destandau, E.; Da Silva, D.; Chatel, G. Screening and Evaluation of Dermo-Cosmetic Activities of the Invasive Plant Species Polygonum cuspidatum. Plants 2023, 12, 83. [Google Scholar] [CrossRef]
  17. Leu, Y.L.; Hwang, T.L.; Hu, J.W.; Fang, J.Y. Anthraquinones from Polygonum cuspidatum as tyrosinase inhibitors for dermal use. Phytother. Res. PTR 2008, 22, 552–556. [Google Scholar] [CrossRef]
  18. Du, R.; Ye, L.; Chen, X.; Meng, Y.; Zhou, L.; Chen, Q.; Zheng, G.; Hu, J.; Shi, Z. Screening of Key Components for Melanogenesis Inhibition of Polygonum cuspidatum Extract Based on the Spectrum–Effect Relationship and Molecular Docking. Molecules 2024, 29, 857. [Google Scholar] [CrossRef]
  19. Lee, Y.H.; Choi, D.; Jang, G.; Park, J.Y.; Song, E.S.; Lee, H.; Kuk, M.U.; Joo, J.; Ahn, S.K.; Byun, Y.; et al. Targeting regulation of ATP synthase 5 alpha/beta dimerization alleviates senescence. Aging 2022, 14, 678–707. [Google Scholar] [CrossRef]
  20. Kang, H.T.; Park, J.T.; Choi, K.; Kim, Y.; Choi, H.J.C.; Jung, C.W.; Lee, Y.-S.; Park, S.C. Chemical screening identifies ATM as a target for alleviating senescence. Nat. Chem. Biol. 2017, 13, 616–623. [Google Scholar] [CrossRef]
  21. Kang, H.T.; Park, J.T.; Choi, K.; Choi, H.J.C.; Jung, C.W.; Kim, G.R.; Lee, Y.S.; Park, S.C. Chemical screening identifies ROCK as a target for recovering mitochondrial function in Hutchinson-Gilford progeria syndrome. Aging Cell 2017, 16, 541–550. [Google Scholar] [CrossRef] [PubMed]
  22. Moore, W.A.; Davey, V.A.; Weindruch, R.; Walford, R.; Ivy, G.O. The effect of caloric restriction on lipofuscin accumulation in mouse brain with age. Gerontology 1995, 41 (Suppl. S2), 173–186. [Google Scholar] [CrossRef]
  23. Jung, T.; Hohn, A.; Grune, T. Lipofuscin: Detection and quantification by microscopic techniques. Methods Mol. Biol. 2010, 594, 173–193. [Google Scholar] [CrossRef] [PubMed]
  24. Jensen, T.; Holten-Rossing, H.; Svendsen, I.M.; Jacobsen, C.; Vainer, B. Quantitative analysis of myocardial tissue with digital autofluorescence microscopy. J. Pathol. Inform. 2016, 7, 15. [Google Scholar] [CrossRef] [PubMed]
  25. Cho, S.; Hwang, E.S. Chapter 7—Fluorescence-Based Detection and Quantification of Features of Cellular Senescence. In Methods in Cell Biology; Darzynkiewicz, Z., Holden, E., Orfao, A., Telford, W., Wlodkowic, D., Eds.; Academic Press: Cambridge, MA, USA, 2011; Volume 103, pp. 149–188. [Google Scholar]
  26. Kuk, M.U.; Park, J.Y.; Song, E.S.; Lee, H.; Lee, Y.H.; Joo, J.; Kwon, H.W.; Park, J.T. Bacterial Artificial Chromosome-based Protein Expression Platform Using the Tol2 Transposon System. Biotechnol. Bioprocess Eng. 2022, 27, 344–352. [Google Scholar] [CrossRef]
  27. Lee, Y.H.; Kim, M.; Park, H.J.; Park, J.Y.; Song, E.S.; Lee, H.; Ko, G.; Ahn, S.; Kwon, H.W.; Byun, Y.; et al. Chemical screening identifies the anticancer properties of Polyporous parvovarius. J. Cancer 2023, 14, 50–60. [Google Scholar] [CrossRef]
  28. Draelos, Z.D.; McDaniel, D.H.; Yoelin, S.; Pot, S.; Sotir, O.; Nelson, D.B. Evaluation of a New, Advanced Antioxidant Containing Topical Allyl Pyrroloquinoline Quinone: Analysis of Antioxidant Properties and Visible Effects in Subjects with Facial Photodamage. J. Clin. Aesthetic Dermatol. 2023, 16, 53–59. [Google Scholar]
  29. Herman, A.; Herman, A.P. Caffeine’s mechanisms of action and its cosmetic use. Ski. Pharmacol. Physiol. 2013, 26, 8–14. [Google Scholar] [CrossRef]
  30. Kumari, R.; Jat, P. Mechanisms of Cellular Senescence: Cell Cycle Arrest and Senescence Associated Secretory Phenotype. Front. Cell Dev. Biol. 2021, 9, 645593. [Google Scholar] [CrossRef]
  31. González-Gualda, E.; Baker, A.G.; Fruk, L.; Muñoz-Espín, D. A guide to assessing cellular senescence in vitro and in vivo. FEBS J. 2021, 288, 56–80. [Google Scholar] [CrossRef]
  32. Huang, W.; Hickson, L.J.; Eirin, A.; Kirkland, J.L.; Lerman, L.O. Cellular senescence: The good, the bad and the unknown. Nat. Rev. Nephrol. 2022, 18, 611–627. [Google Scholar] [CrossRef] [PubMed]
  33. Picca, A.; Calvani, R.; Coelho-Junior, H.; Landi, F.; Bernabei, R.; Marzetti, E. Mitochondrial Dysfunction, Oxidative Stress, and Neuroinflammation: Intertwined Roads to Neurodegeneration. Antioxidants 2020, 9, 647. [Google Scholar] [CrossRef] [PubMed]
  34. Ichimura, H.; Parthasarathi, K.; Quadri, S.; Issekutz, A.C.; Bhattacharya, J. Mechano-oxidative coupling by mitochondria induces proinflammatory responses in lung venular capillaries. J. Clin. Investig. 2003, 111, 691–699. [Google Scholar] [CrossRef] [PubMed]
  35. Naik, E.; Dixit, V.M. Mitochondrial reactive oxygen species drive proinflammatory cytokine production. J. Exp. Med. 2011, 208, 417–420. [Google Scholar] [CrossRef] [PubMed]
  36. Nelson, G.; Kucheryavenko, O.; Wordsworth, J.; von Zglinicki, T. The senescent bystander effect is caused by ROS-activated NF-κB signalling. Mech. Ageing Dev. 2018, 170, 30–36. [Google Scholar] [CrossRef]
  37. Lopez-Castejon, G.; Brough, D. Understanding the mechanism of IL-1β secretion. Cytokine Growth Factor Rev. 2011, 22, 189–195. [Google Scholar] [CrossRef]
  38. Han, L.; Zhang, Y.; Zhang, M.; Guo, L.; Wang, J.; Zeng, F.; Xu, D.; Yin, Z.; Xu, Y.; Wang, D.; et al. Interleukin-1β-Induced Senescence Promotes Osteoblastic Transition of Vascular Smooth Muscle Cells. Kidney Blood Press. Res. 2020, 45, 314–330. [Google Scholar] [CrossRef]
  39. Mosteiro, L.; Pantoja, C.; de Martino, A.; Serrano, M. Senescence promotes in vivo reprogramming through p164a and IL-6. Aging Cell 2018, 17, e12711. [Google Scholar] [CrossRef]
  40. Zheng, Y.; Wu, S.; Ke, H.; Peng, S.; Hu, C. Secretion of IL-6 and IL-8 in the senescence of bone marrow mesenchymal stem cells is regulated by autophagy via FoxO3a. Exp. Gerontol. 2023, 172, 112062. [Google Scholar] [CrossRef]
  41. Turrens, J.F. Mitochondrial formation of reactive oxygen species. J. Physiol. 2003, 552, 335–344. [Google Scholar] [CrossRef]
  42. Lee, Y.H.; Kuk, M.U.; So, M.K.; Song, E.S.; Lee, H.; Ahn, S.K.; Kwon, H.W.; Park, J.T.; Park, S.C. Targeting Mitochondrial Oxidative Stress as a Strategy to Treat Aging and Age-Related Diseases. Antioxidants 2023, 12, 934. [Google Scholar] [CrossRef] [PubMed]
  43. Mailloux, R.J. Teaching the fundamentals of electron transfer reactions in mitochondria and the production and detection of reactive oxygen species. Redox Biol. 2015, 4, 381–398. [Google Scholar] [CrossRef]
  44. Brand, M.D.; Nicholls, D.G. Assessing mitochondrial dysfunction in cells. Biochem. J. 2011, 435, 297–312. [Google Scholar] [CrossRef] [PubMed]
  45. Sherratt, H.S. Mitochondria: Structure and function. Rev. Neurol. 1991, 147, 417–430. [Google Scholar]
  46. Zorova, L.D.; Popkov, V.A.; Plotnikov, E.Y.; Silachev, D.N.; Pevzner, I.B.; Jankauskas, S.S.; Babenko, V.A.; Zorov, S.D.; Balakireva, A.V.; Juhaszova, M.; et al. Mitochondrial membrane potential. Anal. Biochem. 2018, 552, 50–59. [Google Scholar] [CrossRef]
  47. Kuk, M.U.; Lee, H.; Song, E.S.; Lee, Y.H.; Park, J.Y.; Jeong, S.; Kwon, H.W.; Byun, Y.; Park, S.C.; Park, J.T. Functional restoration of lysosomes and mitochondria through modulation of AKT activity ameliorates senescence. Exp. Gerontol. 2023, 173, 112091. [Google Scholar] [CrossRef] [PubMed]
  48. Park, J.Y.; Lee, H.; Song, E.S.; Lee, Y.H.; Kuk, M.U.; Ko, G.; Kwon, H.W.; Byun, Y.; Park, J.T. Restoration of Lysosomal and Mitochondrial Function Through p38 Mitogen-Activated Protein Kinase Inhibition Ameliorates Senescence. Rejuvenation Res. 2022, 25, 291–299. [Google Scholar] [CrossRef]
  49. Lee, Y.H.; Park, J.Y.; Lee, H.; Song, E.S.; Kuk, M.U.; Joo, J.; Oh, S.; Kwon, H.W.; Park, J.T.; Park, S.C. Targeting Mitochondrial Metabolism as a Strategy to Treat Senescence. Cells 2021, 10, 3003. [Google Scholar] [CrossRef]
  50. Kim, J.W.; Kuk, M.U.; Choy, H.E.; Park, S.C.; Park, J.T. Mitochondrial metabolic reprograming via BRAF inhibition ameliorates senescence. Exp. Gerontol. 2019, 126, 110691. [Google Scholar] [CrossRef]
  51. Tohma, H.; Hepworth, A.R.; Shavlakadze, T.; Grounds, M.D.; Arthur, P.G. Quantification of Ceroid and Lipofuscin in Skeletal Muscle. J. Histochem. Cytochem. 2011, 59, 769–779. [Google Scholar] [CrossRef]
  52. Park, J.T.; Lee, Y.S.; Cho, K.A.; Park, S.C. Adjustment of the lysosomal-mitochondrial axis for control of cellular senescence. Ageing Res. Rev. 2018, 47, 176–182. [Google Scholar] [CrossRef] [PubMed]
  53. Wang, H.L.; Chou, A.H.; Wu, A.S.; Chen, S.Y.; Weng, Y.H.; Kao, Y.C.; Yeh, T.H.; Chu, P.J.; Lu, C.S. PARK6 PINK1 mutants are defective in maintaining mitochondrial membrane potential and inhibiting ROS formation of substantia nigra dopaminergic neurons. Biochim. Biophys. Acta 2011, 1812, 674–684. [Google Scholar] [CrossRef] [PubMed]
  54. Iwai, I.; Kuwahara, T.; Hirao, T. Decrease in the Skin Transparency Induced by Protein Carbonylation in the Stratum Corneum. Int. J. Cosmet. Sci. 2009, 31, 76. [Google Scholar] [CrossRef]
  55. Rizvi, S.; Raza, S.T.; Ahmed, F.; Ahmad, A.; Abbas, S.; Mahdi, F. The role of vitamin e in human health and some diseases. Sultan Qaboos Univ. Med. J. 2014, 14, e157–e165. [Google Scholar]
  56. Nassar, D.; Letavernier, E.; Baud, L.; Aractingi, S.; Khosrotehrani, K. Calpain activity is essential in skin wound healing and contributes to scar formation. PLoS ONE 2012, 7, e37084. [Google Scholar] [CrossRef]
  57. Raj, N.; Voegeli, R.; Rawlings, A.V.; Summers, B.; Munday, M.R.; Lane, M.E. Variation in the activities of late stage filaggrin processing enzymes, calpain-1 and bleomycin hydrolase, together with pyrrolidone carboxylic acid levels, corneocyte phenotypes and plasmin activities in non-sun-exposed and sun-exposed facial stratum corneum of different ethnicities. Int. J. Cosmet. Sci. 2016, 38, 567–575. [Google Scholar] [CrossRef]
  58. Brembilla, N.C.; Senra, L.; Boehncke, W.H. The IL-17 Family of Cytokines in Psoriasis: IL-17A and Beyond. Front. Immunol. 2018, 9, 1682. [Google Scholar] [CrossRef]
  59. Gutowska-Owsiak, D.; Schaupp, A.L.; Salimi, M.; Selvakumar, T.A.; McPherson, T.; Taylor, S.; Ogg, G.S. IL-17 downregulates filaggrin and affects keratinocyte expression of genes associated with cellular adhesion. Exp. Dermatol. 2012, 21, 104–110. [Google Scholar] [CrossRef]
  60. Coderch, L.; López, O.; de la Maza, A.; Parra, J.L. Ceramides and skin function. Am. J. Clin. Dermatol. 2003, 4, 107–129. [Google Scholar] [CrossRef]
  61. Quan, T.; Fisher, G.J. Role of Age-Associated Alterations of the Dermal Extracellular Matrix Microenvironment in Human Skin Aging: A Mini-Review. Gerontology 2015, 61, 427–434. [Google Scholar] [CrossRef]
  62. Singh, D.; Rai, V.; Agrawal, D.K. Regulation of Collagen I and Collagen III in Tissue Injury and Regeneration. Cardiol. Cardiovasc. Med. 2023, 7, 5–16. [Google Scholar] [CrossRef] [PubMed]
  63. Kaźmierczak-Barańska, J.; Boguszewska, K.; Adamus-Grabicka, A.; Karwowski, B.T. Two Faces of Vitamin C-Antioxidative and Pro-Oxidative Agent. Nutrients 2020, 12, 1501. [Google Scholar] [CrossRef] [PubMed]
  64. Kelley, N.; Jeltema, D.; Duan, Y.; He, Y. The NLRP3 Inflammasome: An Overview of Mechanisms of Activation and Regulation. Int. J. Mol. Sci. 2019, 20, 3328. [Google Scholar] [CrossRef]
  65. Xie, Q.; Shen, W.W.; Zhong, J.; Huang, C.; Zhang, L.; Li, J. Lipopolysaccharide/adenosine triphosphate induces IL-1β and IL-18 secretion through the NLRP3 inflammasome in RAW264.7 murine macrophage cells. Int. J. Mol. Med. 2014, 34, 341–349. [Google Scholar] [CrossRef]
  66. Milara, J.; Martínez-Expósito, F.; Montero, P.; Roger, I.; Bayarri, M.A.; Ribera, P.; Oishi-Konari, M.N.; Alba-García, J.R.; Zapater, E.; Cortijo, J. N-acetylcysteine Reduces Inflammasome Activation Induced by SARS-CoV-2 Proteins In Vitro. Int. J. Mol. Sci. 2022, 23, 14518. [Google Scholar] [CrossRef]
  67. Bickel, M. The role of interleukin-8 in inflammation and mechanisms of regulation. J. Periodontol. 1993, 64, 456–460. [Google Scholar]
  68. Yasumoto, K.; Okamoto, S.; Mukaida, N.; Murakami, S.; Mai, M.; Matsushima, K. Tumor necrosis factor alpha and interferon gamma synergistically induce interleukin 8 production in a human gastric cancer cell line through acting concurrently on AP-1 and NF-kB-like binding sites of the interleukin 8 gene. J. Biol. Chem. 1992, 267, 22506–22511. [Google Scholar] [CrossRef]
  69. Semple, F.; Dorin, J.R. β-Defensins: Multifunctional Modulators of Infection, Inflammation and More? J. Innate Immun. 2012, 4, 337–348. [Google Scholar] [CrossRef] [PubMed]
  70. Cieślik, M.; Bagińska, N.; Górski, A.; Jończyk-Matysiak, E. Human β-Defensin 2 and Its Postulated Role in Modulation of the Immune Response. Cells 2021, 10, 2991. [Google Scholar] [CrossRef] [PubMed]
  71. Albanesi, C.; Fairchild, H.R.; Madonna, S.; Scarponi, C.; De Pità, O.; Leung, D.Y.; Howell, M.D. IL-4 and IL-13 negatively regulate TNF-alpha- and IFN-gamma-induced beta-defensin expression through STAT-6, suppressor of cytokine signaling (SOCS)-1, and SOCS-3. J. Immunol. 2007, 179, 984–992. [Google Scholar] [CrossRef]
  72. Kell, D.B.; Heyden, E.L.; Pretorius, E. The Biology of Lactoferrin, an Iron-Binding Protein That Can Help Defend Against Viruses and Bacteria. Front. Immunol. 2020, 11, 1221. [Google Scholar] [CrossRef] [PubMed]
  73. Kirino, A.; Takasuka, Y.; Nishi, A.; Kawabe, S.; Yamashita, H.; Kimoto, M.; Ito, H.; Tsuji, H. Analysis and functionality of major polyphenolic components of Polygonum cuspidatum (itadori). J. Nutr. Sci. Vitaminol. 2012, 58, 278–286. [Google Scholar] [CrossRef] [PubMed]
  74. Hsu, S.C.; Chung, J.G. Anticancer potential of emodin. BioMedicine 2012, 2, 108–116. [Google Scholar] [CrossRef]
  75. Karami, A.; Fakhri, S.; Kooshki, L.; Khan, H. Polydatin: Pharmacological Mechanisms, Therapeutic Targets, Biological Activities, and Health Benefits. Molecules 2022, 27, 6474. [Google Scholar] [CrossRef] [PubMed]
  76. Ou, S.; Chen, T.; Wang, S.; Yang, J.; Wang, Y.; Liu, L.; Wang, S. HPLC fingerprints of polygonum cuspidatum power and polygonum cuspidatum ointment and simultaneous determination of six constituents. Intell. Pharm. 2023, 1, 251–259. [Google Scholar] [CrossRef]
  77. Papaccio, F.; D′Arino, A.; Caputo, S.; Bellei, B. Focus on the Contribution of Oxidative Stress in Skin Aging. Antioxidants 2022, 11, 1121. [Google Scholar] [CrossRef]
  78. Checa, J.; Aran, J.M. Reactive Oxygen Species: Drivers of Physiological and Pathological Processes. J. Inflamm. Res. 2020, 13, 1057–1073. [Google Scholar] [CrossRef]
  79. Hosokawa, H.; Ishii, N.; Ishida, H.; Ichimori, K.; Nakazawa, H.; Suzuki, K. Rapid accumulation of fluorescent material with aging in an oxygen-sensitive mutant mev-1 of Caenorhabditis elegans. Mech. Ageing Dev. 1994, 74, 161–170. [Google Scholar] [CrossRef]
  80. Adachi, H.; Fujiwara, Y.; Ishii, N. Effects of oxygen on protein carbonyl and aging in Caenorhabditis elegans mutants with long (age-1) and short (mev-1) life spans. J. Gerontol. Ser. A Biol. Sci. Med. Sci. 1998, 53, B240–B244. [Google Scholar] [CrossRef]
  81. Sakellariou, G.K.; Pye, D.; Vasilaki, A.; Zibrik, L.; Palomero, J.; Kabayo, T.; McArdle, F.; Van Remmen, H.; Richardson, A.; Tidball, J.G.; et al. Role of superoxide-nitric oxide interactions in the accelerated age-related loss of muscle mass in mice lacking Cu,Zn superoxide dismutase. Aging Cell 2011, 10, 749–760. [Google Scholar] [CrossRef]
  82. Choksi, K.B.; Nuss, J.E.; Deford, J.H.; Papaconstantinou, J. Age-related alterations in oxidatively damaged proteins of mouse skeletal muscle mitochondrial electron transport chain complexes. Free Radic. Biol. Med. 2008, 45, 826–838. [Google Scholar] [CrossRef] [PubMed]
  83. Choksi, K.B.; Boylston, W.H.; Rabek, J.P.; Widger, W.R.; Papaconstantinou, J. Oxidatively damaged proteins of heart mitochondrial electron transport complexes. Biochim. Et Biophys. Acta 2004, 1688, 95–101. [Google Scholar] [CrossRef]
  84. Stout, R.; Birch-Machin, M.A. Mitochondria’s Role in Skin Ageing. Biology 2019, 8, 29. [Google Scholar] [CrossRef] [PubMed]
  85. Monsour, M.; Gorsky, A.; Nguyen, H.; Castelli, V.; Lee, J.-Y.; Borlongan, C.V. Enhancing oxidative phosphorylation over glycolysis for energy production in cultured mesenchymal stem cells. NeuroReport 2022, 33, 635–640. [Google Scholar] [CrossRef]
  86. Maduka, C.V.; Kuhnert, M.M.; Habeeb, O.M.; Tundo, A.; Makela, A.V.; Goodman, S.B.; Contag, C.H. Elevated oxidative phosphorylation is critical for immune cell activation by polyethylene wear particles. J. Immunol. Regen. Med. 2023, 19, 100069. [Google Scholar] [CrossRef]
  87. Nolfi-Donegan, D.; Braganza, A.; Shiva, S. Mitochondrial electron transport chain: Oxidative phosphorylation, oxidant production, and methods of measurement. Redox Biol. 2020, 37, 101674. [Google Scholar] [CrossRef] [PubMed]
  88. Chang, S.-Y.; Lee, M.Y.; Chung, P.-S.; Kim, S.; Choi, B.; Suh, M.-W.; Rhee, C.-K.; Jung, J.Y. Enhanced mitochondrial membrane potential and ATP synthesis by photobiomodulation increases viability of the auditory cell line after gentamicin-induced intrinsic apoptosis. Sci. Rep. 2019, 9, 19248. [Google Scholar] [CrossRef]
  89. Gottschalk, B.; Koshenov, Z.; Malli, R.; Graier, W.F. Implications of mitochondrial membrane potential gradients on signaling and ATP production analyzed by correlative multi-parameter microscopy. Sci. Rep. 2024, 14, 14784. [Google Scholar] [CrossRef]
  90. Phua, Q.H.; Ng, S.Y.; Soh, B.S. Mitochondria: A Potential Rejuvenation Tool against Aging. Aging Dis. 2024, 15, 503–516. [Google Scholar] [CrossRef] [PubMed]
  91. Choudhury, D.; Rong, N.; Senthil Kumar, H.V.; Swedick, S.; Samuel, R.Z.; Mehrotra, P.; Toftegaard, J.; Rajabian, N.; Thiyagarajan, R.; Podder, A.K.; et al. Proline restores mitochondrial function and reverses aging hallmarks in senescent cells. Cell Rep. 2024, 43, 113738. [Google Scholar] [CrossRef]
  92. Farage, M.A.; Miller, K.W.; Elsner, P.; Maibach, H.I. Characteristics of the Aging Skin. Adv. Wound Care 2013, 2, 5–10. [Google Scholar] [CrossRef] [PubMed]
  93. Poljšak, B.; Dahmane, R. Free radicals and extrinsic skin aging. Dermatol. Res. Pract. 2012, 2012, 135206. [Google Scholar] [CrossRef] [PubMed]
  94. Masaki, H. Role of antioxidants in the skin: Anti-aging effects. J. Dermatol. Sci. 2010, 58, 85–90. [Google Scholar] [CrossRef] [PubMed]
  95. Pullar, J.M.; Carr, A.C.; Vissers, M.C.M. The Roles of Vitamin C in Skin Health. Nutrients 2017, 9, 866. [Google Scholar] [CrossRef] [PubMed]
  96. Boo, Y.C. Mechanistic Basis and Clinical Evidence for the Applications of Nicotinamide (Niacinamide) to Control Skin Aging and Pigmentation. Antioxidants 2021, 10, 1315. [Google Scholar] [CrossRef]
  97. Yamawaki, Y.; Mizutani, T.; Okano, Y.; Masaki, H. The impact of carbonylated proteins on the skin and potential agents to block their effects. Exp. Dermatol. 2019, 28, 32–37. [Google Scholar] [CrossRef]
  98. Hoang, H.T.; Moon, J.-Y.; Lee, Y.-C. Natural Antioxidants from Plant Extracts in Skincare Cosmetics: Recent Applications, Challenges and Perspectives. Cosmetics 2021, 8, 106. [Google Scholar] [CrossRef]
  99. Liu, J.-K. Natural products in cosmetics. Nat. Prod. Bioprospecting 2022, 12, 40. [Google Scholar] [CrossRef]
  100. He, X.; Wan, F.; Su, W.; Xie, W. Research Progress on Skin Aging and Active Ingredients. Molecules 2023, 28, 5556. [Google Scholar] [CrossRef]
  101. Brickel, J.A.; Matulka, R.A.; Burdock, G.A. The explosion in the use of natural substances and the need for new comprehensive risk assessments. Curr. Opin. Food Sci. 2018, 24, 56–61. [Google Scholar] [CrossRef]
  102. Emerald, M.; Emerald, A.; Emerald, L.; Kumar, V. Perspective of Natural Products in Skincare. Pharm. Pharmacol. Int. J. 2016, 4, 1–3. [Google Scholar] [CrossRef]
  103. Aboul-Enein, H.Y.; Kruk, I.; Kładna, A.; Lichszteld, K.; Michalska, T. Scavenging effects of phenolic compounds on reactive oxygen species. Biopolymers 2007, 86, 222–230. [Google Scholar] [CrossRef] [PubMed]
  104. Prousek, J. Fenton chemistry in biology and medicine. Pure Appl. Chem. 2007, 79, 2325–2338. [Google Scholar] [CrossRef]
  105. Macip, S.; Igarashi, M.; Fang, L.; Chen, A.; Pan, Z.Q.; Lee, S.W.; Aaronson, S.A. Inhibition of p21-mediated ROS accumulation can rescue p21-induced senescence. EMBO J. 2002, 21, 2180–2188. [Google Scholar] [CrossRef]
  106. Passos, J.F.; Nelson, G.; Wang, C.; Richter, T.; Simillion, C.; Proctor, C.J.; Miwa, S.; Olijslagers, S.; Hallinan, J.; Wipat, A.; et al. Feedback between p21 and reactive oxygen production is necessary for cell senescence. Mol. Syst. Biol. 2010, 6, 347. [Google Scholar] [CrossRef]
  107. Luo, Y.; Zou, P.; Zou, J.; Wang, J.; Zhou, D.; Liu, L. Autophagy regulates ROS-induced cellular senescence via p21 in a p38 MAPKα dependent manner. Exp. Gerontol. 2011, 46, 860–867. [Google Scholar] [CrossRef] [PubMed]
  108. Takahashi, A.; Ohtani, N.; Yamakoshi, K.; Iida, S.; Tahara, H.; Nakayama, K.; Nakayama, K.I.; Ide, T.; Saya, H.; Hara, E. Mitogenic signalling and the p16INK4a-Rb pathway cooperate to enforce irreversible cellular senescence. Nat. Cell Biol. 2006, 8, 1291–1297. [Google Scholar] [CrossRef]
  109. Sinenko, S.A.; Starkova, T.Y.; Kuzmin, A.A.; Tomilin, A.N. Physiological Signaling Functions of Reactive Oxygen Species in Stem Cells: From Flies to Man. Front. Cell Dev. Biol. 2021, 9, 714370. [Google Scholar] [CrossRef]
  110. Jones, D.P.; Sies, H. The Redox Code. Antioxid. Redox Signal. 2015, 23, 734–746. [Google Scholar] [CrossRef]
  111. Ristow, M.; Zarse, K. How increased oxidative stress promotes longevity and metabolic health: The concept of mitochondrial hormesis (mitohormesis). Exp. Gerontol. 2010, 45, 410–418. [Google Scholar] [CrossRef]
  112. Ristow, M.; Schmeisser, K. Mitohormesis: Promoting Health and Lifespan by Increased Levels of Reactive Oxygen Species (ROS). Dose Response 2014, 12, 288–341. [Google Scholar] [CrossRef] [PubMed]
  113. Soltani, S.; Boutin, Y.; Couture, F.; Biron, E.; Subirade, M.; Fliss, I. In vitro assessment of skin sensitization, irritability and toxicity of bacteriocins and reuterin for possible topical applications. Sci. Rep. 2022, 12, 4570. [Google Scholar] [CrossRef] [PubMed]
  114. Ng, W.L.; Yeong, W.Y. The future of skin toxicology testing—Three-dimensional bioprinting meets microfluidics. Int. J. Bioprint. 2019, 5, 237. [Google Scholar] [CrossRef] [PubMed]
  115. Yu, Y.Q.; Yang, X.; Wu, X.F.; Fan, Y.B. Enhancing Permeation of Drug Molecules Across the Skin via Delivery in Nanocarriers: Novel Strategies for Effective Transdermal Applications. Front. Bioeng. Biotechnol. 2021, 9, 646554. [Google Scholar] [CrossRef] [PubMed]
  116. Gorzelanny, C.; Mess, C.; Schneider, S.W.; Huck, V.; Brandner, J.M. Skin Barriers in Dermal Drug Delivery: Which Barriers Have to Be Overcome and How Can We Measure Them? Pharmaceutics 2020, 12, 684. [Google Scholar] [CrossRef]
  117. Hmingthansanga, V.; Singh, N.; Banerjee, S.; Manickam, S.; Velayutham, R.; Natesan, S. Improved Topical Drug Delivery: Role of Permeation Enhancers and Advanced Approaches. Pharmaceutics 2022, 14, 2818. [Google Scholar] [CrossRef]
  118. van Hoogevest, P.; Fahr, A. Phospholipids in Cosmetic Carriers. In Nanocosmetics: From Ideas to Products; Cornier, J., Keck, C.M., Van de Voorde, M., Eds.; Springer International Publishing: Cham, Switzerland, 2019; pp. 95–140. [Google Scholar]
  119. Lavilla, I.; Cabaleiro, N.; Bendicho, C. Chapter 14—Main Chemical Contaminants in Cosmetics: Regulatory Aspects and Analytical Methods. In Analysis of Cosmetic Products, 2nd ed.; Salvador, A., Chisvert, A., Eds.; Elsevier: Boston, MA, USA, 2018; pp. 331–383. [Google Scholar]
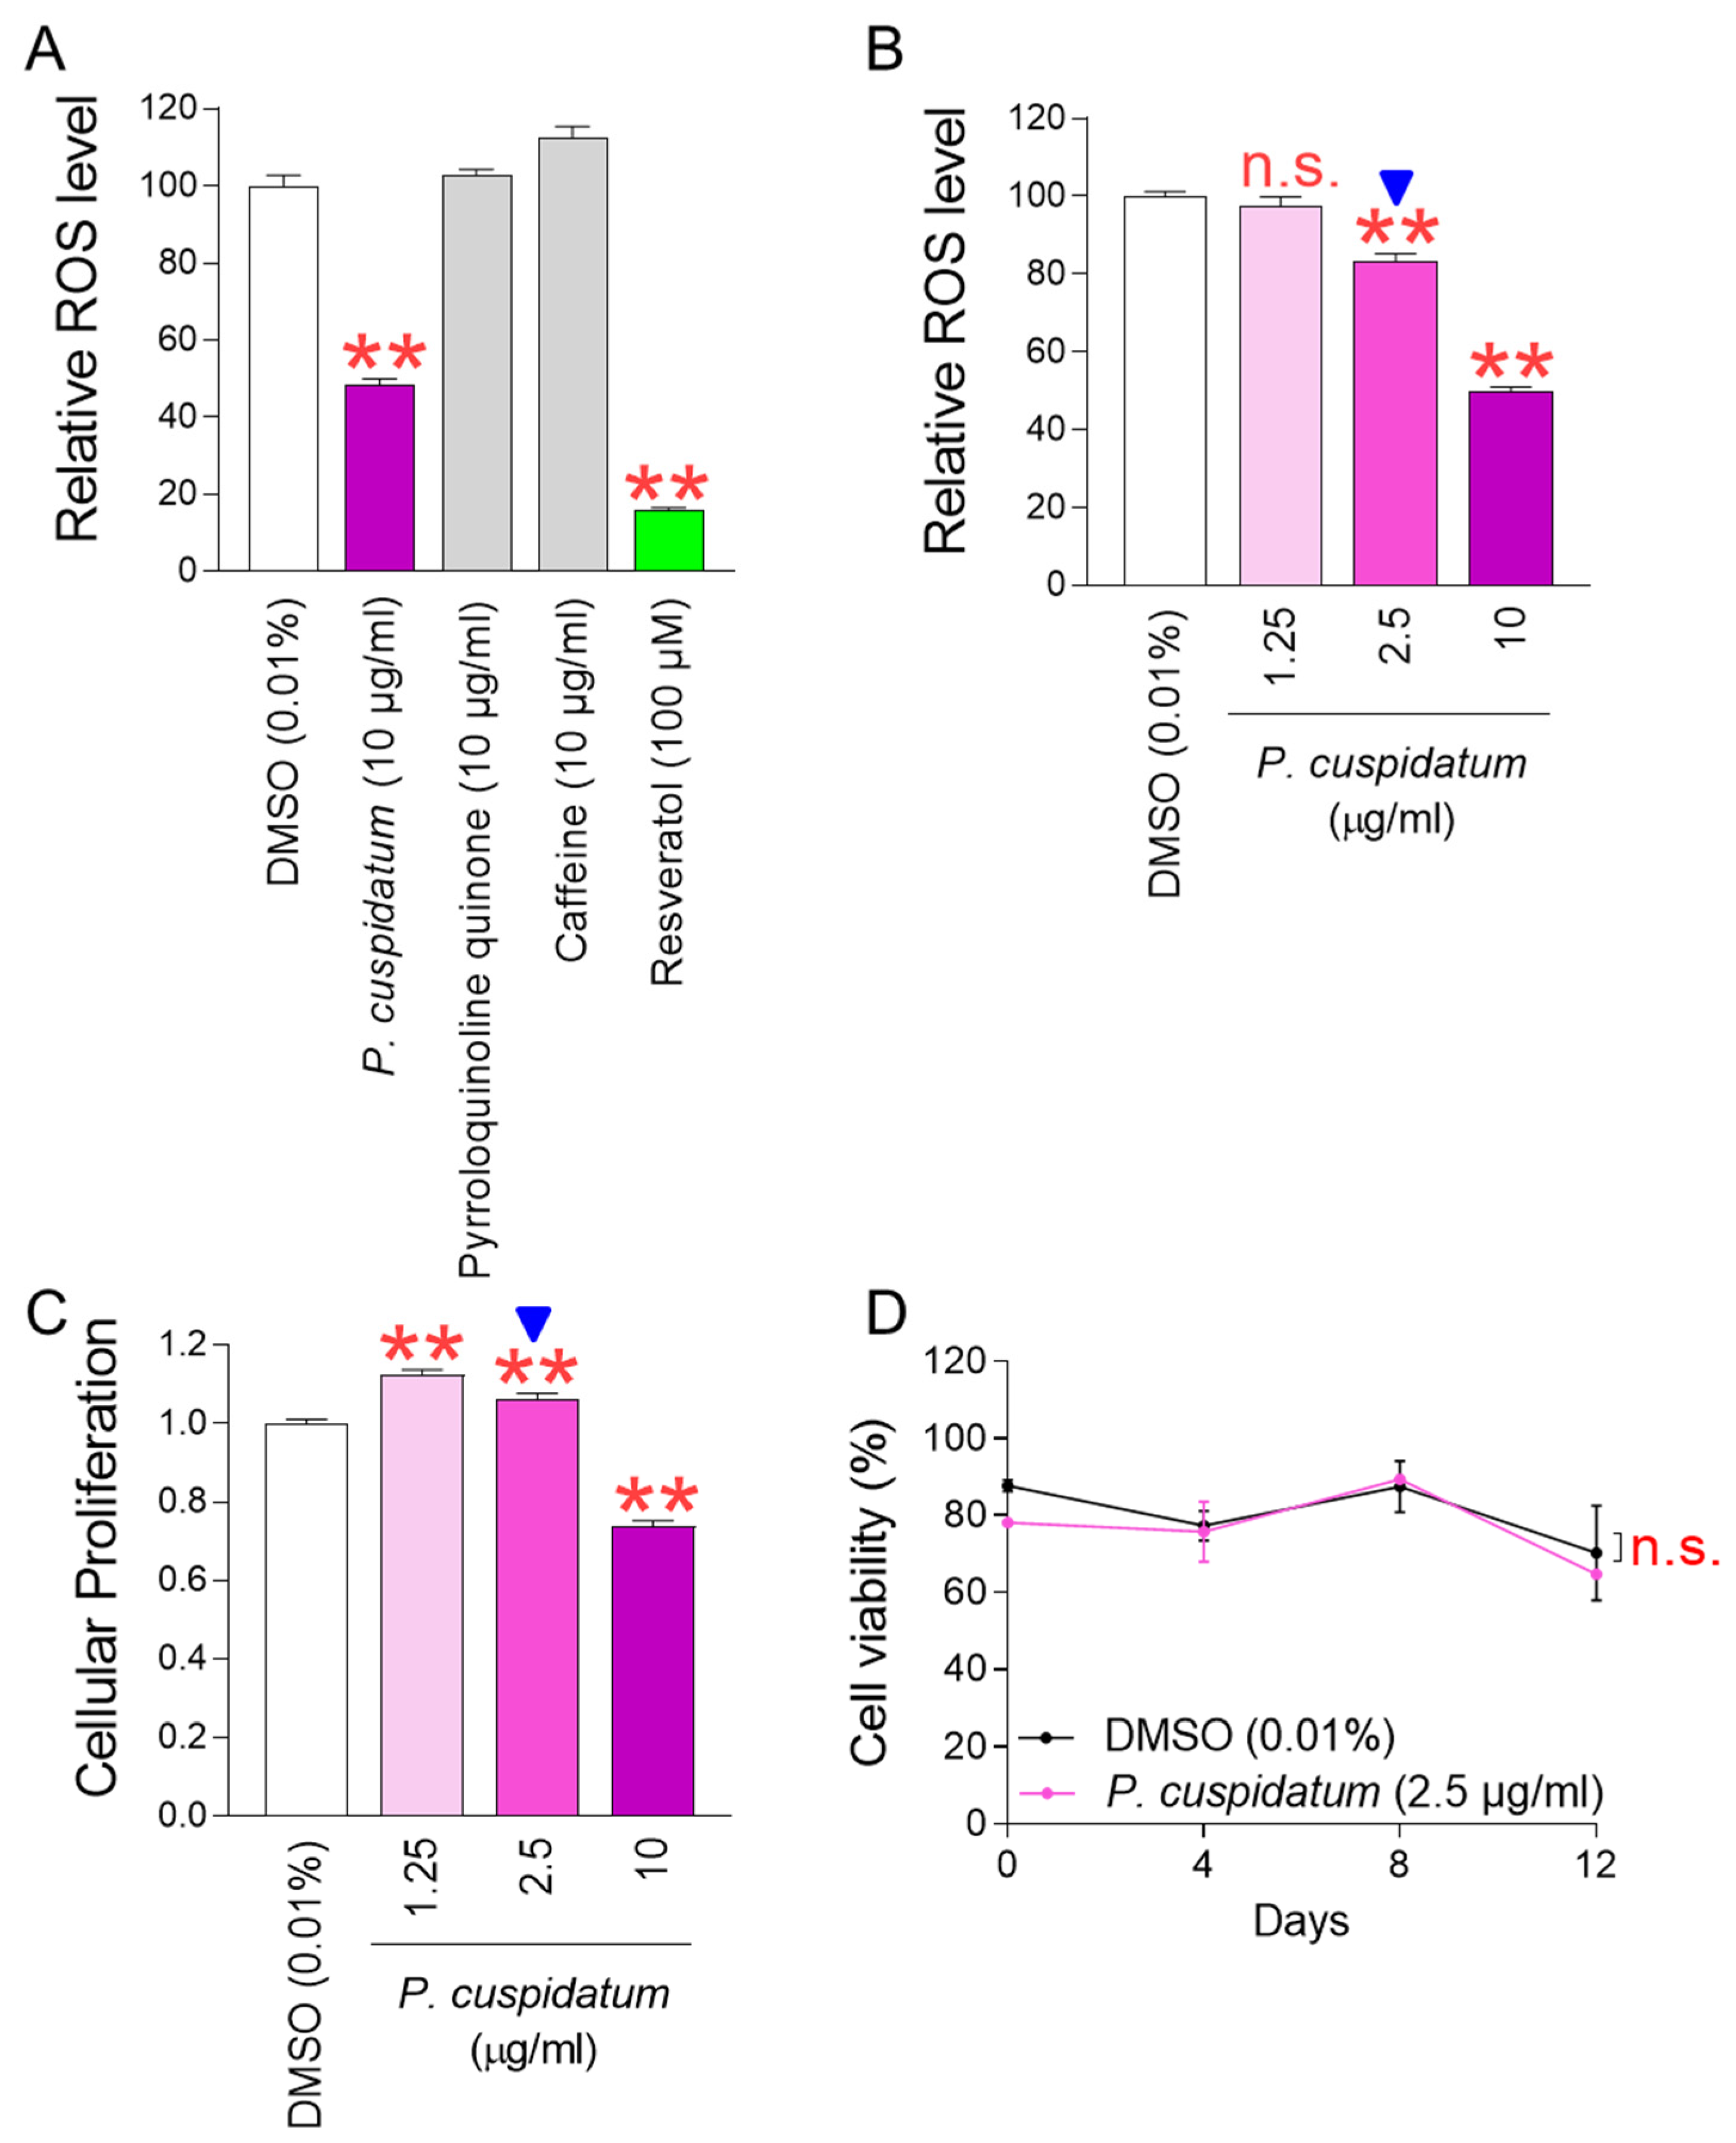
Figure 1. P. cuspidatum extract significantly reduces ROS levels in senescent fibroblasts. (A) Senescent fibroblasts were treated with P. cuspidatum extract (10 μg/mL), pyrroloquinoline quinone (PQQ) (10 μg/mL), and caffeine (10 μg/mL). On day 12, their impact on ROS levels was examined. DMSO control was used by diluting DMSO in the medium to a concentration of 0.01%. Flow cytometric analysis of ROS using DHR123. ** p < 0.01, Student’s t-test. Mean ± S.D., N = 3. Resveratrol (100 μM) was used as a positive control. (B) ROS levels were assessed at different concentrations of P. cuspidatum extract (1.25, 2.5, and 10 µg/mL) on day 12 after treatment in senescent fibroblasts. DMSO control was used by diluting DMSO in the medium to a concentration of 0.01%. n.s. (not significant), ** p < 0.01, Student’s t-test. Mean ± S.D., N = 3. (C) Cellular proliferation was assessed at different concentrations of P. cuspidatum extract (1.25, 2.5, and 10 µg/mL) on day 12 after treatment in senescent fibroblasts. DMSO control was used by diluting DMSO in the medium to a concentration of 0.01%. ** p < 0.01, Student’s t-test. Mean ± S.D., N = 3. The arrow head indicates the optimal concentration of P. cuspidatum extract on decreasing ROS levels and increasing cellular proliferation. (D) Measurement of cell viability after 0, 4, 8, and 12 days of treatment with DMSO (0.01%) or P. cuspidatum extract (2.5 µg/mL) in senescent fibroblasts. n.s. (not significant), two-way ANOVA followed by Bonferroni’s post hoc test. Mean ± S.D., N = 3.
Antioxidants 13 01110 g001
Figure 2. P. cuspidatum extract ameliorate senescence-associated phenotypes in senescent fibroblasts. (A) Expression levels of p21 gene after 12 days of treatment with DMSO (0.01%) or P. cuspidatum extract (2.5 µg/mL) in senescent fibroblasts. ** p < 0.01, Student’s t-test. Mean ± S.D., N = 3. (B) Expression levels of IL-1β gene after 12 days of treatment with DMSO (0.01%) or P. cuspidatum extract (2.5 µg/mL) in senescent fibroblasts. ** p < 0.01, Student’s t-test. Mean ± S.D., N = 3. (C) Expression levels of IL-6 after 12 days of treatment with DMSO (0.01%) or P. cuspidatum extract (2.5 µg/mL) in senescent fibroblasts. ** p < 0.01, Student’s t-test. Mean ± S.D., N = 3.
Antioxidants 13 01110 g002
Figure 3. P. cuspidatum extract reduces mitochondrial ROS generation by increasing OXPHOS efficiency in senescent fibroblasts. (A) Measurement of oxygen consumption rate (OCR; pmole/min) after 12 days of treatment with DMSO (0.01%) or P. cuspidatum extract (2.5 µg/mL). (black line: DMSO-treated senescent fibroblasts, pink line: P. cuspidatum-extract-treated senescent fibroblasts). ** p < 0.01, two-way ANOVA followed by Bonferroni’s post hoc test. Means ± S.D., N = 3. (B) Measurement of ATP production rate after 12 days of treatment with DMSO (0.01%) or P. cuspidatum extract (2.5 µg/mL). ** p < 0.01, student t-test. Mean ± S.D., N = 3. (C) Measurement of mitochondrial membrane potential (MMP) after 12 days of treatment with DMSO (0.01%) or P. cuspidatum extract (2.5 µg/mL). ** p < 0.01, Student’s t-test. Means ± S.D., N = 3.
Antioxidants 13 01110 g003
Figure 4. P. cuspidatum extract yields functional recovery of lysosome/autophagy system in senescent fibroblasts. (A) Autofluorescence was examined using flow cytometry after 12 days of treatment with DMSO (0.01%) or P. cuspidatum extract (2.5 µg/mL) in senescent fibroblasts. ** p < 0.01, Student’s t-test. Mean ± S.D., N = 3. (B) Measurement of lysosomal mass after 12 days of treatment with DMSO (0.01%) or P. cuspidatum extract (2.5 µg/mL) in senescent fibroblasts. ** p < 0.01, Student’s t-test. Mean ± S.D., N = 3. (C) Measurement of autophagosome level after 12 days of treatment with DMSO (0.01%) or P. cuspidatum extract (2.5 µg/mL) in senescent fibroblasts. ** p < 0.01, Student’s t-test. Mean ± S.D., N = 3.
Antioxidants 13 01110 g004
Figure 5. P. cuspidatum extract reduces ROS and lipofuscin levels in young fibroblasts. (A) ROS levels after 12 days of treatment with DMSO (0.01%) or P. cuspidatum extract (2.5 µg/mL) in young fibroblasts. ** p < 0.01, Student’s t-test. Mean ± S.D., N = 3. (B) Autofluorescence was examined using flow cytometry after 12 days of treatment with DMSO (0.01%) or P. cuspidatum extract (2.5 µg/mL) in young fibroblasts. ** p < 0.01, Student’s t-test. Mean ± S.D., N = 3.
Antioxidants 13 01110 g005
Figure 6. P. cuspidatum extract enhances skin protection by restoring skin barrier formation. (A) Measurement of protein carbonylation. Normal human epidermal keratinocytes, HEKn cells, were treated with 500 μM H2O2 for 4 h. Then, HEKn cells were treated with DMSO (0.01%) or P. cuspidatum extract (2.5 µg/mL) for 12 days. As a positive control, vitamin E (250 µM; T1539; Sigma) was used. ** p < 0.01, Student’s t-test. Mean ± S.D., N = 3. Scale bar: 10 μm. Full-size images of immunofluorescence are shown in Supplementary Information S1. (B) Expression levels of calpain 1 protein after activation with IL-17A. To inhibit the expression of calpain 1, HEKn cells were treated with 200 ng/mL IL-17A. Then, HEKn cells were treated with DMSO (0.01%) or P. cuspidatum extract (2.5 µg/mL) for 12 days. As a positive control, ceramide NP (500 μg/mL) was used. ** p < 0.01, Student’s t-test. Mean ± S.D., N = 3. Full-size images of western blot are shown in Supplementary Information S2. (C) Expression levels of collagen type I after 12 days of treatment with DMSO (0.01%) or P. cuspidatum extract (2.5 µg/mL). Senescent fibroblasts were treated with DMSO (0.01%) or P. cuspidatum extract (2.5 µg/mL) for 12 days. As a positive control, vitamin C (75 µg/mL) was used. * p < 0.05, ** p < 0.01, Student’s t-test. Mean ± S.D., N = 3. (D) Expression level of collagen type III after 12 days of treatment with DMSO (0.01%) or P. cuspidatum extract (2.5 µg/mL). Senescent fibroblasts were treated with DMSO (0.01%) or P. cuspidatum extract (2.5 µg/mL) for 12 days. As a positive control, vitamin C (75 µg/mL) was used. * p < 0.05, ** p < 0.01, Student’s t-test. Mean ± S.D., N = 3.
Antioxidants 13 01110 g006
Figure 7. P. cuspidatum extract enhances skin protection by inhibiting skin inflammation. (A) Expression of NLRP3 protein after activation with lipopolysaccharide (LPS)/adenosine triphosphate (ATP). HaCaT cells were treated with 5 μg/mL LPS and then with 5 mM ATP. Then, HaCaT cells were treated with DMSO (0.01%) or P. cuspidatum extract (2.5 µg/mL) for 12 days. As a ROS scavenger, 5 mM N-acetylcysteine (NAC) was treated on HaCaT cells. ** p < 0.01, Student’s t-test. Mean ± S.D., N = 3. Full-size images of western blot are shown in Supplementary Information S2. (B) Expression levels of IL-8 after activation with interferon gamma (IFN-γ)/tumor necrosis factor alpha (TNF-α). HaCaT cells were treated with 10 ng/mL IFN-γ and 20 ng/mL TNF-α. Then, HaCaT cells were treated with DMSO (0.01%) or P. cuspidatum extract (2.5 µg/mL) for 12 days. ** p < 0.01, Student’s t-test. Mean ± S.D., N = 3. (C) Expression levels of β-defensin 2 after activation with IFN-γ/TNF-α followed by IL-4. HaCaT cells were treated with 10 ng/mL IFN-γ and 20 ng/mL TNF-α. Then, HaCaT cells were treated with 50 ng/mL IL-4. HaCaT cells were treated with DMSO (0.01%) or P. cuspidatum extract (2.5 µg/mL) for 12 days. As a positive control, 25 μg/mL lactoferrin was used. ** p < 0.01, Student’s t-test. Mean ± S.D., N = 3.
Antioxidants 13 01110 g007
Figure 8. Identification of emodin and polydatin from P. cuspidatum extracts. High-performance liquid chromatography (HPLC) was performed to determine how much polydatin and emodin were present in P. cuspidatum extract. (A) The HPLC peak of the P. cuspidatum extract matched the emodin standard, and the amount of emodin present in the P. cuspidatum extract was 4.99%. (B) The HPLC peak of the P. cuspidatum extract matched the polydatin standard, and its amount was 3.05% of the total extract.
Antioxidants 13 01110 g008
Figure 9. Identification of polydatin as an active ingredient showing antioxidant effects. (A) ROS-reducing effect of emodin was observed at concentrations of 0.1, 1, and 10 μM. As a positive control, senescent fibroblasts were treated with P. cuspidatum extract (2.5 µg/mL) for 12 days. ** p < 0.01, Student’s t-test. Mean ± S.D., N = 3. (B) The ROS-reducing effect of emodin were not sufficient to reduce the level of autofluorescence. As a positive control, senescent fibroblasts were treated with P. cuspidatum extract (2.5 µg/mL) for 12 days. n.s. (not significant), ** p < 0.01, Student’s t-test. Mean ± S.D., N = 3. (C) Polydatin was effective in reducing ROS levels at concentrations of 0.1, 1, 4, 8, and 10 μM. As a positive control, senescent fibroblasts were treated with P. cuspidatum extract (2.5 µg/mL) for 12 days. ** p < 0.01, Student’s t-test. Mean ± S.D., N = 3. (D) Polydatin was effective in reducing autofluorescence levels at concentrations of 0.1, 1, 4, 8, and 10 μM. As a positive control, senescent fibroblasts were treated with P. cuspidatum extract (2.5 µg/mL) for 12 days. A total of 8 μM polydatin was chosen as the optimal concentration because it is the minimum concentration more effective than P. cuspidatum extract. ** p < 0.01, Student’s t-test. Mean ± S.D., N = 3.
Antioxidants 13 01110 g009
Figure 10. Polydatin reduces mitochondrial ROS generation through increasing OXPHOS efficiency. (A) Measurement of cell viability after 0, 4, 8, and 12 days of treatment with DMSO (0.01%) or polydatin (8 µM). n.s. (not significant), two-way ANOVA followed by Bonferroni’s post hoc test. Mean ± S.D., N = 3. (B) Measurement of cellular proliferation after 12 days of treatment with DMSO (0.01%) or polydatin (8 µM). ** p < 0.01, Student’s t-test. Mean ± S.D., N = 3. (C) Measurement of oxygen consumption rate (OCR; pmole/min) after 12 days of treatment with DMSO (0.01%) or polydatin (8 µM) (black line: DMSO-treated senescent fibroblasts, pink line: polydatin-treated senescent fibroblasts). ** p < 0.01, two-way ANOVA followed by Bonferroni’s post hoc test. Means ± S.D., N = 3. (D) Measurement of ATP production rate after 12 days of treatment with DMSO (0.01%) or polydatin (8 µM). ** p < 0.01, student t-test. Mean ± S.D., N = 3. (E) Measurement of lysosomal mass after 12 days of treatment with DMSO (0.01%) or polydatin (8 µM). ** p < 0.01, Student’s t-test. Mean ± S.D., N = 3. (F) Measurement of autophagosome level after 12 days of treatment with DMSO (0.01%) or polydatin (8 µM). ** p < 0.01, Student’s t-test. Mean ± S.D., N = 3. (G) Expression levels of p21 after 12 days of treatment with DMSO (0.01%) or polydatin (8 µM). ** p < 0.01, Student’s t-test. Mean ± S.D., N = 3. (H) Expression levels of IL-1β after 12 days of treatment with DMSO (0.01%) or polydatin (8 µM). ** p < 0.01, Student’s t-test. Mean ± S.D., N = 3.
Antioxidants 13 01110 g010
Table 1. Details of primers used in qPCR.
TargetOrientationSequence (5′-3′)Size (bp)
p21forwardAGGTGGACCTGGAGACTCTCAG22
reverseTCCTCTTGGAGAAGATCAGCCG22
IL-1βforwardCCACAGACCTTCCAGGAGAATG22
reverseGTGCAGTTCAGTGATCGTACAGG23
IL-6forwardAGACAGCCACTCACCTCTTCAG22
reverseTTCTGCCAGTGCCTCTTTGCTG22
Collagen type IforwardAGCAAGAACCCCAAGGACAA20
reverseCGAACTGGAATCCATCGGTC20
Collagen typeIIIforwardCTGATGGGGTCAAATGAAGGTG22
reverseCGTGCAACCATCCTCCAGAAC21
IL-8forwardCTGGCCGTGGCTCTCTTG18
reverseCCTTGGCAAAACTGCACCTT20
β-defensin 2forwardGTATCTCCTCTTCTCGTTCCTC22
reverseGGATCGCCTATACCACCAAAAAC23
Disclaimer/Publisher’s Note: The statements, opinions and data contained in all publications are solely those of the individual author(s) and contributor(s) and not of MDPI and/or the editor(s). MDPI and/or the editor(s) disclaim responsibility for any injury to people or property resulting from any ideas, methods, instructions or products referred to in the content.