Article

Synthesis, Characterization and Assessment of Antioxidant and Melanogenic Inhibitory Properties of Edaravone Derivatives

1
Department of Chemistry, Amrita Vishwa Vidyapeetham, Amritapuri 690525, India
2
Department of Organic Chemistry, University of Plovdiv, 24 Tzar Assen str., 4000 Plovdiv, Bulgaria
3
Department of Chemistry, College of Science, Princess Nourah bint Abdulrahman University, P.O. Box 84428, Riyadh 11671, Saudi Arabia
4
Department of Physics, FMNC, University of Kerala, Kollam 691001, India
*
Authors to whom correspondence should be addressed.
Antioxidants 2024, 13(9), 1148; https://doi.org/10.3390/antiox13091148
Submission received: 1 September 2024 / Revised: 19 September 2024 / Accepted: 20 September 2024 / Published: 23 September 2024
(This article belongs to the Section Natural and Synthetic Antioxidants)

Abstract

:
A series of edaravone derivatives and the corresponding Cu(II) complexes were synthesized and characterized using spectroscopic and analytical techniques such as IR, UV, NMR and elemental analysis. Antioxidant activities of all compounds were examined using free radical scavenging methods such as hydrogen peroxide scavenging activity (HPSA), 1,1-diphenyl-2-picrylhydrazyl (DPPH) and 2-2′-azino-bis-(3-ethylbenzothiazoline-6-sulfonate) (ABTS) assays. All of the tested compounds exhibited good antioxidant activity. Further, the frontier orbital energy levels, as well as various chemical properties, were determined using the density functional theory (DFT) calculations. The MEP maps of all of the derivatives were plotted to identify the nucleophilic and electrophilic reactive sites. Further, binding energies of all of the organic compounds with the protein tyrosinase was investigated to determine their potential anti-melanogenic applications. The selected ligand, L6 was subjected to molecular dynamics simulation analysis to determine the stability of the ligand–protein complex. The MD simulation was performed (150 ns) to estimate the stability of the tyrosinase–L6 complex. Other key parameters, such as, RMSD, RMSF, Rg, hydrogen bonds, SASA and MMPBSA were also analyzed to understand the interaction of L6 with the tyrosinase protein.

1. Introduction

Edaravone is also known as methylphenylpyrazolone or norphenazone. It functions as a free radical scavenger and its metabolites offer a range of medicinal benefits, including antibacterial, anticancer activity, and protection against dementia caused by insufficient sleep. Its other bioactivities include preventing ferroptosis in patients with amyotrophic lateral sclerosis (ALS), treating acute pancreatitis, craniocerebral injuries, acute ischemic stroke, Alzheimer’s and Parkinson diseases, reducing oxygen species, and treating asthma through anti-inflammatory and anti-oxidative effects [1,2,3,4,5,6,7,8,9]. Its therapeutic impact may be attributed to its antioxidant qualities, though its exact method of action is not well understood [10,11]. Edaravone is proposed to have three main different mechanisms against oxidative stress. It operates by preventing the peroxyl radical-induced peroxidation of both the lipid and water-soluble systems, by stopping the lipoxygenase and non-enzymatic peroxidation of lipids or by quenching the hydroxyl radicals (OH•) and preventing the peroxidation of lipids [11]. Despite these promising antioxidant properties, oral bioavailability of the edaravone is restricted owing to its low stability in physiological conditions and poor solubility. Hence, oral formulations of edaravone have not yet been applied in a clinical setting [12,13]. It is evident that the electron density of the pyrazolone ring greatly influences the electron transfer mechanism and thus governs the antioxidant properties [13]. Introduction of the substituents with appropriate stereo-electronic properties could lead to the enhancement of the antioxidant properties of the edaravone and aid in the improvement of lipophilicity [14,15,16,17,18,19]. Derivatization of the edaravone can be achieved by four key routes: by substituting the N-phenyl ring, by modifying/derivatizing ketonic group (5-position), by changing the methyl group (3-position) or by substituting the pyrazole ring (4-position) [20,21,22,23,24,25,26,27,28]. All of these derivatization strategies have been found to be successful in achieving the obtained bio-reactivities; most particularly, the substitution of the various groups at the 4th position of edaravone ring has been shown to lead to the formation of compounds with high lipophilicity and high potential antioxidant properties [17,18,19].
The main factor determining skin tone in humans is the production of melanin, which also helps to shield the skin from ultraviolet radiation. However, excessive melanin production and aggregation can cause wrinkles, melisma, freckles, actinic damage sites, and other hyperpigmentation issues [29]. Melanogenic antagonists are becoming increasingly crucial components in drugs and cosmetics to stop hyperpigmentation [30,31,32]. During the initial phases of melanin production, o-diphenols and o-diquinones are oxidized by an enzyme called tyrosinase, which contains a copper center. This enzyme is also the reason for the undesired browning of damaged fruits [33,34,35]. Earlier studies on human skin cells have demonstrated that photodamage results in the production of reactive oxygen species (ROS) and a breakdown of endogenous antioxidant pathways. Additionally, it has been established that ROS are important regulators of melanocyte growth and melanin production, and that ROS scavengers and inhibitors can reduce UV-induced melanogenesis and hyperpigmentation [35,36,37].
Here, we report the synthesis, characterization, and evaluation of antioxidant activities of edaravone derivatives. Derivatization of the edaravone was undertaken by introducing different motifs of a versatile nature at the 4th position of the pyrazolone ring [20,21,22,23,24,25,26,27,28]. All of the synthesized organic compounds were complexed with copper in anticipation of further enhancement in the antioxidant properties [38,39,40,41]. After thorough characterization, all of the compounds were evaluated for their antioxidant potency by using free radical scavenging assays, such as hydrogen peroxide scavenging activity (HPSA), 1,1-diphenyl-2-picrylhydrazyl (DPPH) and 2-2′-azino-bis-(3-ethylbenzothiazoline-6-sulfonic acid) (ABTS) assays. DFT analysis of the organic compounds was undertaken to determine the frontier molecular orbital energy levels and theoretical chemical characteristics. The binding energies of the organic compounds with the protein tyrosinase, which plays a key role in melanogenesis [35,36,37], were analyzed with the help of docking studies. Molecular dynamics simulation studies were used to understand the interaction of a selected compound with tyrosinase.

2. Experimental

2.1. Materials and Methods

All of the chemicals used in the synthesis work, including organic precursors, reagents, metal salts and solvents were obtained from Sigma Aldrich (Bengaluru, India), Spectrochem or Nice Chemicals and were used after the appropriate purification and drying [42]. Molar conductivity of the complexes was measured using an ELICO–CM-82 conductivity bridge. Infrared spectral analysis of the organic compounds and metal complexes was undertaken on a Perkin Elmer Spectrum-2 FT-IR instrument (Waltham, USA). Electronic spectral analysis (UV–visible spectral studies) was performed using a Perkin Elmer LAMDA-25 instrument (Waltham, USA). 1H and 13C NMR analysis of the organic compounds was carried out on a Bruker Avance 400 MHz spectrometer. Elemental CHN analysis of all of the of the compounds was carried out using a Thermo Scientific Flash 2000 Organic Elemental Analyzer. Copper and chloride content of the complexes was analyzed by following the established gravimetric methods [43]. X-ray analysis of the single crystals was performed on a Bruker APEX-II Kappa machine.
In the antioxidant activity studies, HPLC grade methanol (VWR, Vienna, Austria) was used. Water for HPLC was prepared with a Millipore purifier (Millipore, St. Louis, MO, USA). Potassium dihydrogen phosphate, dipotassium hydrogen phosphate, hydrogen peroxide, ascorbic acid, 2,2-diphenyl-1-picrylhydrazyl (DPPH) and 2,2′-azino-bis(3-ethylbenzothiazoline-6-sulfonic acid) (ABTS) were purchased from Sigma Aldrich. A Camspec M508 spectrometer (Leeds, England) was used in the bioactivity assays.

2.2. Synthesis of Edaravone Derivatives

The core molecule, 5-methyl-2-phenyl-2,4-dihydro-3H-pyrazol-3-one (edaravone) (L1) was purchased from Sigma Aldrich and all of the derivatives were prepared by following the procedures described here below.

2.2.1. 4-Acetyl-5-methyl-2-phenyl-2,4-dihydro-3H-pyrazol-3-one (L2)

L2 was prepared by employing a known approach with some modifications. L1 (7.5 g, 43 mmol) was taken in 35 mL tetrahydrofuran, to which Ca(OH)2 (6 g, 81 mmol) was added and then stirred. After 10 min, 5 mL acetyl chloride was added dropwise and stirring continued. The orange precipitate formed was refluxed for 4 h. The reaction mixture was cooled on an ice bath and 50 mL 2 M HCl was added with stirring until a cream-colored precipitate was separated. The precipitate was washed with excess water and dried. Yield—80%; melting point—135–137 °C; IR (KBr pellet, cm−1) 3333 (s, br), 3058 (m), 2933 (w), 2174 (w) 1633 (s), 1592 (s),1499 (s), 1400 (m), 1343 (m), 1260 (w), 1205 (w), 1157 (w), 1083 (s), 1022 (m), 963 (s), 841 (m), 752 (s), 687 (s), 597 (m); UV-vis (DMSO, 10−4 M, λ in nm (abs)) 265 (0.425), 288 (0.224); 1H NMR (400 MHz, DMSO-d6, ppm) 8.04 (2H, d (J = 8 Hz), o-HPh), 7.29 (2H, t (J = 8 Hz), m-HPh), 7.02 (1H, t (J = 8 Hz), o-HPh), 2.28 (3H, s, (CO)CH3), 2.26 (3H, s, CH3ring); 13C NMR (100 MHz, DMSO-d6, ppm) 190.2, 165.1, 148.1, 140.4, 128.2, 122.8, 118.3, 104.3, 28.2, 17.3; analysis for C12H12N2O2 calc. (found) C 66.65 (66.24); H 5.59 (5.32), N 12.96 (12.88).

2.2.2. 5-Methyl-2-phenyl-4-(1-(phenylimino)ethyl)-2,4-dihydro-3H-pyrazol-3-one (L3)

An amount of 1 g (4.6 mmol) L2 was placed in 20 mL methanol, to which was added 0.49 mL (4.6 mmol) aniline. The mixture was refluxed overnight in the presence of a catalytic amount of acetic acid. The solid obtained was separated by filtration, thoroughly washed with MeOH and air-dried. Yield—82%; melting point—174–178 °C; IR (KBr pellet, cm−1) 3461 (m), 3124 (s, br), 2984 (m), 2527 (w) 1626 (s), 1580 (s), 1492 (m), 1482 (s), 1385 (s), 1224 (m), 1079 (s), 1042 (s), 1017 (s), 957 (s), 879 (m), 842 (s), 761 (s), 693 (s), 603 (s); UV–vis (DMSO, 10−4 M, λ in nm (abs)) 261 (0.443), 290 (0.224); 1H NMR (400 MHz, DMSO-d6, ppm) 12.97 (1H,s, OH), 8.02 (2H, d (J = 8 Hz), o-HPhEda), 7.52 (2H, t (J = 8 Hz), m-HPhEda), 7.40 (5H, m, HPh), 7.14 (1H, t (J = 8 Hz), p-HPhEda), 2.45 (3H, s, (CO)CH3), 2.38 (3H, s, CH3ring); analysis for C18H17N3O calc. (found) C 74.20 (74.08), H 5.88 (6.02); N 14.42 (14.82).

2.2.3. 5-Methyl-2-phenyl-4-(1-(2-phenylhydrazineylidene)ethyl)-2,4-dihydro-3H-pyrazol-3-one (L4)

An amount of 1 g (4.6 mmol) L2 was placed in 20 mL methanol, to which was added 0.6652 g (4.6 mmol) phenyl hydrazine. The mixture was refluxed overnight in the presence of a catalytic amount of acetic acid. The solid obtained was separated by filtration, thoroughly washed with MeOH and air-dried. Yield—83%; melting point—186–188 °C; IR (KBr pellet, cm−1) 3462 (s,br), 3279 (s), 3058 (m), 1624 (s), 1538 (m), 1498 (s), 1434 (w), 1391 (m), 1309 (w), 1230 (w), 1147 (w), 1044 (w), 950 (w), 893 (w), 751 (m), 696 (m); UV–vis (DMSO, 10−4 M, λ in nm (abs)) 262 (0.799), 280 (0.895), 332 (0.462); 1H NMR (400 MHz, CDCl3, ppm) 12.36 (1H,s, OH), 8.00 (2H, d (J = 8 Hz), o-HPhEda), 7.40 (2H, t (J = 8 Hz), m-HPhEda), 7.25 (2H, t (J = 8 Hz), m-HPh), 7.17 (1H, t (J = 8 Hz), p-HPhEda), 6.95 (1H, t (J = 8 Hz), p-HPh), 6.75 (2H, d (J = 8 Hz), o-HPh), 6.17 (1H, s, NH), 2.45 (3H, s, (CO)CH3), 2.41 (3H, s, CH3ring); 13C NMR (100 MHz, CDCl3, ppm) 168.0, 165.5, 147.4, 146.3, 138.9, 129.5, 128.8, 124.5, 122.0, 119.3, 113.2, 98.8, 17.40, 14.26; analysis for C18H18N4O calc. (found) C 70.57 (70.81), H 5.92 (5.71), N 18.29 (18.98).

2.2.4. 5-Methyl-2-phenyl-4-(1-(pyridin-2-ylimino)ethyl)-2,4-dihydro-3H-pyrazol-3-one (L5)

An amount of 1 g (4.6 mmol) L2 was placed in 20 mL methanol, to which was added 0.435 g (4.6 mmol) 2-aminopyridine. The mixture was refluxed overnight in the presence of a catalytic amount of acetic acid. The solid obtained was separated by filtration, thoroughly washed with MeOH and air-dried. Yield—84%; melting point—250–252 °C; IR (KBr pellet, cm−1) 3448 (s,br), 1629 (s), 1595 (m), 1507(s), 1446 (w), 1358 (m), 1203 (w), 1085 (m), 1022 (w), 962 (s), 875 (w), 843 (m), 765 (s), 695 (m), 664 (w), 604 (w); UV–vis (DMSO, 10−4 M, λ in nm (abs)) 267 (0.483), 286 (0.331); 1H NMR (400 MHz, DMSO-d6, ppm) 12.20 (1H, s, OH), 8.74 (1H, s, o-HPy), 7.96 (2H, d (J = 8 Hz), o-HPhEda), 7.35 (2H, t (J = 8 Hz), m-HPhEda), 7.09 (1H, t (J = 8 Hz), p-HPhEda), 6.42 (3H, b, p-HPy), 2.34 (3H, s, (CO)CH3), 2.31 (3H, s, CH3ring); 13C NMR (100 MHz, DMSO-d6, ppm) 166.9, 165.2, 157.9, 147.7, 139.6, 129.1, 124.1, 118.3, 97.7, 17.3, 14.7; analysis for C17H16N4O calc. (found) C 69.85 (69.28), H 5.52 (5.23), N 19.17 (19.86).

2.2.5. 2-(1-(3-Methyl-5-oxo-1-phenyl-4,5-dihydro-1H-pyrazol-4-yl)ethylidene)hydrazine-1-carboxamide (L6)

An amount of 1 g (4.6 mmol) L2 was placed in 20 mL methanol, to which was added 0.516 g semicarbazide. The mixture was refluxed overnight in the presence of a catalytic amount of acetic acid. The solid obtained was separated by filtration, thoroughly washed with MeOH and air-dried. Yield—72%; melting point—214–217 °C; IR (KBr pellet, cm−1) 3399 (s), 3181 (s), 3039 (s), 2929 (s), 1953 (w), 1710 (s), 1631 (s), 1540 (m), 1485 (s), 1452 (s), 1361 (s), 1211 (w), 1107 (w), 1018 (m), 915 (m), 751 (s), 695 (s), 653 (m), 609 (m); UV–vis (DMSO, 10−4 M, λ in nm (abs)) 271 (0.572); analysis for C13H15N5O2 calc. (found) C 57.13 (56.88), H 5.53 (5.68), N 25.63 (26.13); mass analysis: m/z 272 (M−H).

2.2.6. 4-(1-(Hydroxyimino)ethyl)-5-methyl-2-phenyl-2,4-dihydro-3H-pyrazol-3-one (L7)

An amount of 1 g (4.6 mmol) of L2 was placed in 20 mL methanol, to which was added 0.3217 g (4.6 mmol) hydroxyl amine hydrochloride. The mixture was refluxed overnight. The solid obtained was separated by filtration, thoroughly washed with MeOH and air-dried. Yield—76%; melting point—128–130 °C; IR (KBr pellet, cm−1) 3396(s, br), 2520 (w), 1963 (w), 1638 (s), 1516 (s), 1201 (w), 1081 (s), 1016 (s), 964 (s), 873 (m), 764 (s), 692 (s), 604 (s); UV–vis (DMSO, 10−4 M, λ in nm (abs)) 261 (0.386), 305 (0.173); analysis for C12H13N3O2 calc. (found) C 62.33 (62.87), H 5.67 (5.72), N 18.17 (18.64); mass analysis: m/z 230 (M−H).

2.2.7. 5-Methyl-2-phenyl-4-thiocyanato-2,4-dihydro-3H-pyrazol-3-one (L8)

A mixture of L1 (10 mmol, 1.74 g), ammonium thiocyanate (30 mmol, 2.28 g) and potassium persulphate (20 mml, 5.4 g) was placed in 30 mL acetonitrile in a 100 mL RB flask and stirred overnight. The yellow-orange colored product that formed was filtered and dried. Yield—80%; melting point—184–186 °C; IR (KBr pellet, cm−1) 3431 (br, m), 3160 (s), 1651 (w), 1404 (s), 1200 (m), 1115 (s), 623 (s); UV–vis (DMSO, 10−4 M, λ in nm (abs)) 265 (0.537), 425 (0.277); 1H NMR (400 MHz, CDCl3, ppm) 7.84 (2H, d (J = 8 Hz), o-HPhEda), 7.44 (2H, t (J = 8 Hz), m-HPhEda), 7.24 (1H, t (J = 8 Hz), p-HPhEda), 2.67 (3H, s, CH3ring); 13C NMR (100 MHz, CDCl3, ppm) 162.0, 148.7, 137.0, 133.6, 129.1, 128.9, 125.7, 119.1, 118.8, 19.4; analysis for C11H9N3OS calc. (found) C 57.13 (57.43), H 3.92 (3.74), N 18.17 (18.73).

2.2.8. 3-Hydroxy-3-(3-methyl-5-oxo-1-phenyl-4,5-dihydro-1H-pyrazol-4-yl)indolin-2-one (L9)

A mixture of L1 (1 g, 6 mmol) and isatin (0.883 g, 6 mmol) was refluxed at 80 °C in ethanol overnight. Upon completion of the reaction, the solid product was filtered, washed, and dried. Yield—75%; melting point—250–252 °C; IR (KBr pellet, cm−1) 3470 (br, s), 2830 (w), 2380 (w), 1740 (s), 1624 (s), 1500 (m), 1468 (m), 1409 (m), 1307 (m), 1235 (w), 835 (w), 757 (s), 693 (s); UV–vis (DMSO, 10−4 M, λ in nm (abs)) 263 (1.25), 347 (0.14); 1H NMR (400 MHz, CDCl3, ppm) 9.30 (1H, d (J = 4 Hz),HIsa), 7.93 (2H, d(J = 8 Hz), o-HPhEda), 7.61 (1H, s, -OHIsa) 7.44 (3H, m, pandm-HPhEda), 7.22 (1H, t (J = 8Hz) HIsa), 7.06 (1H, t (J = 8Hz) HIsa), 6.80 (1H, d (J = 8 Hz) HIsa), 2.64 (3H, s, CH3ring); 13C NMR (100 MHz, CDCl3, ppm) 167.3, 164.0, 148.7, 144.5, 138.9, 137.9, 132.2, 129.0, 119.2, 110.3, 20.0; analysis for C18H15N3O3 calc. (found) C 67.28 (67.54), H 4.71 (4.88), N 13.08 (13.52).

2.3. Synthesis of Complexes

All of the copper(II) complexes C1C9 were prepared by using the procedure detailed below. An amount of 10 mL methanolic solution of CuCl2.2H2O (1 mmol) was added dropwise to the 10 mL ligand solution (2 mmol, in methanol) with constant stirring. The mixture was heated at 60 °C overnight and the solid product obtained was separated by filtration, washed with methanol and hexane, and air-dried.

2.3.1. Complex C1

Brown amorphous solid; yield—80%; melting point— >280 °C; IR (KBr pellet, cm−1) 591(w), 698 (m), 758 (s), 842 (w), 897 (w), 1034 (w), 1073 (w), 1169 (w), 1317 (w), 1370 (s), 1451 (s), 1491 (s), 1600 (s), 1883 (w), 1959 (w), 2345 (w), 3356 (s), 3444 (s), 3744 (w), 3841 (w), 3902 (w); UV–vis (DMSO, 10−4 M, λ in nm (abs)) 260 nm (0.23), 306 nm (0.066); analysis for C20H24Cl2CuN4O4 calc. (found) C 46.30 (46.73), H 4.66 (4.82), Cl 13.66 (14.08), Cu 12.25 (12.86), N 10.80 (11.32)%

2.3.2. Complex C2

Green amorphous solid; yield—74%; melting point— >280 °C; IR (KBr pellet, cm−1) 3452 (s), 3340 (s), 3064 (m), 2969 (m), 2920 (m), 1835 (w), 1609 (s), 1593 (s), 1494 (s), 1380 (s), 1231 (m), 1089 (s), 1022 (m), 978 (s), 908 (m), 874 (m), 847 (m), 747 (s), 690 (s), 660 (m), 625 (s); UV–vis (DMSO, 10−4 M, λ in nm (abs)) 263 (0.459), 280 (0.413); analysis for C24H24Cl2CuN4O4 calc. (found) C 50.85 (51.21), H 4.27 (4.98), Cl 12.51 (12.31), Cu 11.21 (11.20), N, 9.88 (10.23)%

2.3.3. Complex C3

Green amorphous solid; yield—82%; melting point— >280 °C; IR (KBr pellet, cm−1) 3456 (s, broad), 3066 (w), 2967 (w), 2923 (w), 2926 (w), 2345 (w), 1576(s), 1542(m),1496(s), 1437 (s), 1380 (s), 1089 (m), 1022 (m), 978 (w), 756 (w), 689 (w), 626(m), 497 (w); UV–vis (DMSO, 10−4 M, λ in nm (abs)) 264 (1.38), 551 (0.032); Analysis for C36H34Cl2CuN6O2 calc. (found) C 60.29 (60.62), H 4.78 (5.02), Cl 9.89 (9.62), Cu 8.86 (8.43), N 11.72 (12.21)%

2.3.4. Complex C4

Green amorphous solid; yield—76%; melting point— >280 °C; IR (KBr pellet, cm−1) 3400 (br, s), 3060 (m), 2919 (w), 1934 (w), 1616 (s), 1537 (s), 1484 (s), 1383 (s), 1232 (m), 1089 (s), 1028 (m), 978 (s), 907 (m), 848 (m), 747 (s), 689 (s), 661 (s), 625 (s); UV–vis (DMSO, 10−4 M, λ in nm (abs)) 262 (0.548), 282 (0.363); analysis for C36H36Cl2CuN8O2 calc. (found) C 57.87 (58.21), H 4.86 (4.92), Cl 9.49 (9.23), Cu 8.50 (8.12), N 15.00 (15.63)%

2.3.5. Complex C5

Green amorphous solid; yield—70%; melting point— >280 °C; IR (KBr pellet, cm−1) 3447 (m), 3352 (m), 3065 (w), 2967 (w), 2928 (w), 1594 (s), 1541 (s),1499 (s), 1382 (m) 1088 (s), 1020 (m), 976 (w), 909 (w), 847 (w),755 (m), 690 (m), 625 (m), 496 (w); UV–vis (DMSO, 10−4 M, λ in nm (abs)) 260 (0.47), 283 (0.268); analysis for C17H18Cl2CuN4O2 calc. (found) C 45.91 (46.32), H 4.08 (4.28), Cl 15.94 (15.44), Cu 14.29 (13.84), N 12.60 (13.12)%

2.3.6. Complex C6

Green amorphous solid; yield—85%; melting point— >280 °C; IR (KBr pellet, cm−1) 3912 (w), 3743 (w), 3603 (s), 3446 (s), 3396 (s), 3308 (s), 3174 (s), 1988 (w), 2359 (s), 1574 (s), 1491 (s), 1426 (s), 1350 (s), 1169 (s), 1061 (s), 987 (s), 903 (m), 855 (w), 758 (s), 663 (s), 585 (s), 501 (m), 451 (w); UV–vis (DMSO, 10−4 M, λ in nm (abs)) 269 (1.90), 325 (1.08); analysis for C13H17Cl2CuN5O3 calc. (found) C 36.67 (36.78), H 4.02 (3.92), Cl 16.65 (16.21), Cu 14.93 (15.23), N 16.45 (17.08)%

2.3.7. Complex C7

Brown amorphous solid; yield—82%; melting point— >280 °C; IR (KBr pellet, cm−1) 3453 (s), 3343 (s), 3077 (w), 2968 (w), 2922 (w), 2340 (w), 1953 (w), 1731(w), 1610(s), 1514 (s), 1433 (s), 1027 (m), 949 (m),754 (m), 623 (w), 489 (w); UV–vis (DMSO, 10−4 M, λ in nm (abs)) 261 (0.471), 298 (0.179); analysis for C24H26Cl2CuN6O4 calc. (found) C 48.29 (48.72), H 4.39 (4.62), Cl 11.88 (12.14), Cu 10.65 (10.23), N 14.08 (14.43)%

2.3.8. Complex C8

Brown amorphous solid; yield—76%; melting point— >280 °C; IR (KBr pellet, cm−1) 3458 (br, s), 3215 (br, s), 2254 (w), 2079 (w), 1635 (m), 1406 (s), 1121 (s), 980 (m), 768 (w), 615 (s); UV–vis (DMSO, 10−4 M, λ in nm (abs)) 275 (0.449), 415 (0.166); analysis for C22H18Cl2CuN6O2S2 calc. (found) C 44.26 (44.53), H 3.04 (2.81), Cl 11.88 (12.19), Cu 10.64 (10.31), N 14.08 (14.62)%

2.3.9. Complex C9

Brown amorphous solid; yield—80%; melting point— >280 °C; IR (KBr pellet, cm−1) 3458 (s), 3365 (s), 2944 (w), 2376 (w), 1653 (s), 1504 (w), 1360 (w), 1356 (w), 991 (w), 852 (m), 766 (w), 613 (w), 515 (m); UV–vis (DMSO, 10−4 M, λ in nm (abs)) 317 (0.346), 360 (0.272), 490 (0.18); analysis for C36H32CuN6O8 calc. (found) C 58.41 (57.92), H, 4.36 (4.12), Cu 8.58 (9.12), N 11.35 (11.78)%

2.4. Evaluation of Antioxidant Properties

2.4.1. Hydrogen Peroxide Scavenging Activity (HPSA) Assay Protocol

The hydrogen peroxide (H2O2) scavenging ability of all of the synthesized compounds was analyzed by following the reported method [44,45]. In a typical procedure, the test tubes were added with 0.6 mL of H2O2 (43 mM), 1 mL of the sample (variable concentration, 10–1000 μg/mL) and 2.4 mL of potassium phosphate buffer solution (0.2 M, pH 7.4). After thoroughly stirring, the mixture was incubated for ten minutes in the absence of light (at 37 °C). Change in the absorbance at λmax = 230 nm was measured using a spectrophotometer. Ascorbic acid was used as standard. The percentage HPSA of the samples was calculated using the following formula:
I , % ( H P S A ) = A b l a n k ( A T S A C S ) A b l a n k 100
where Ablank, Acs, and ATS are the absorbance values of the blank sample (phosphate buffer + H2O2), the control sample (compound + phosphate buffer) and the test sample (compound + phosphate buffer + H2O2), respectively. The IC50 values were obtained by interpolating the graphical dependence of hydrogen peroxide on concentration. An average value of three experiments is reported.

2.4.2. Free Radical Scavenging Assay

The DPPH (DPPH = 2,2-diphenyl-1-picrylhydrazyl) assay was carried out by following the reported procedure [46]. In a typical procedure, 2 mL of freshly prepared DPPH• solution was added with 2 mL of the test sample (various concentrations) and the mixtures were incubated for 30 min at RT. Change in the absorbance of the sample at λmax = 517 nm was measured under low-light conditions. The percentage radical scavenging ability (RSA) of all of the compounds was evaluated by using the following formula:
R S A   % = A 0 A b A 0 × 100
where A0 and Ab are the absorbance values of the control and samples, respectively. The average IC50 value (of three sets) was calculated by the graphical method.

2.4.3. ABTS (2,2′-Azino-bis(3-ethylbenzothiazoline-6-sulfonic acid) assay

The method reported by Re et al. was used for the ABTS assay [47]. 2,2′-azino-bis(3-ethylbenzothiazoline-6-sulfonic acid) cation radical (ABTS•+) solution was made by dissolving 7 mM of ABTS in 2.45 mM K2S2O8. The mixture was stirred for 16 h in the absence of light at RT. For the analysis, ABTS•+ stock solution was diluted with MeOH to obtain dilution with absorbance of 0.70 ± 0.02 (λmax = 734 nm). In a typical analysis, 0.15 mL of compound solution (variable concentration) and 2.85 mL of ABTS solution were mixed and incubated at RT for 7 min, the change in the absorbance at λmax = 734 nm was measured with the help of a spectrophotometer. The average IC50 values (set of three experiments) are determined as above.

2.4.4. Statistical Analysis

All of the analyses were made in triplicates. Data were expressed as mean ± SD. The level of significance was set at p < 0.05. Statistical program SPSS 19.0 software was used for data analysis by ANOVA followed by Duncan’s post-hoc test to evaluate differences between mean values of activities (SPSS Inc., Chicago, IL, USA).

2.5. Computational Studies: Methadology

All calculations were undertaken with the DFT using Gaussian 16 and GaussView 6 software [48,49]. For all calculations, the B3LYP technique with the 6-311++G* basis set was utilized [50]. Calculations and comparisons were also undertaken for the chemical descriptors. Autodock-Vina achieved successful molecular docking [51].
From our experimental studies, the compound L6 shows maximum biological activities and hence all molecules and metal complexes are docked and the binding affinities are found. In addition, molecular dynamics (MD) simulation of L6 is also reported to validate the experimental results of L6 with the tyrosinase from Bacillus megaterium (PDB ID: 3NM8). To obtain a clean protein structure, water and heteroatoms were removed from 3NM8 [52]. Blind docking calculations for ligand molecules bound in interactions consider molecular binding sites. Autodock-Vina was used for the study of receptor–ligand docking, and the box size was 60 × 60 × 60 Å.
MD simulation was performed on the chosen protein–ligand complex in Gromacs-2019.4. To obtain the force field coordinates, the chosen ligand topology was obtained from PRODRG server [53] and MD simulations were performed as reported earlier using GROMACS suite to find different parameters and trajectory analysis [54,55].
To comprehend the binding free energy (ΔG binding) during the simulation, MM-PBSA was used using the function g_mmpbsa. We computed ΔG for the last 50 ns using dt 1000 frames to obtain an accurate result [56].

3. Results and Discussion

3.1. Chemistry

3.1.1. Synthesis

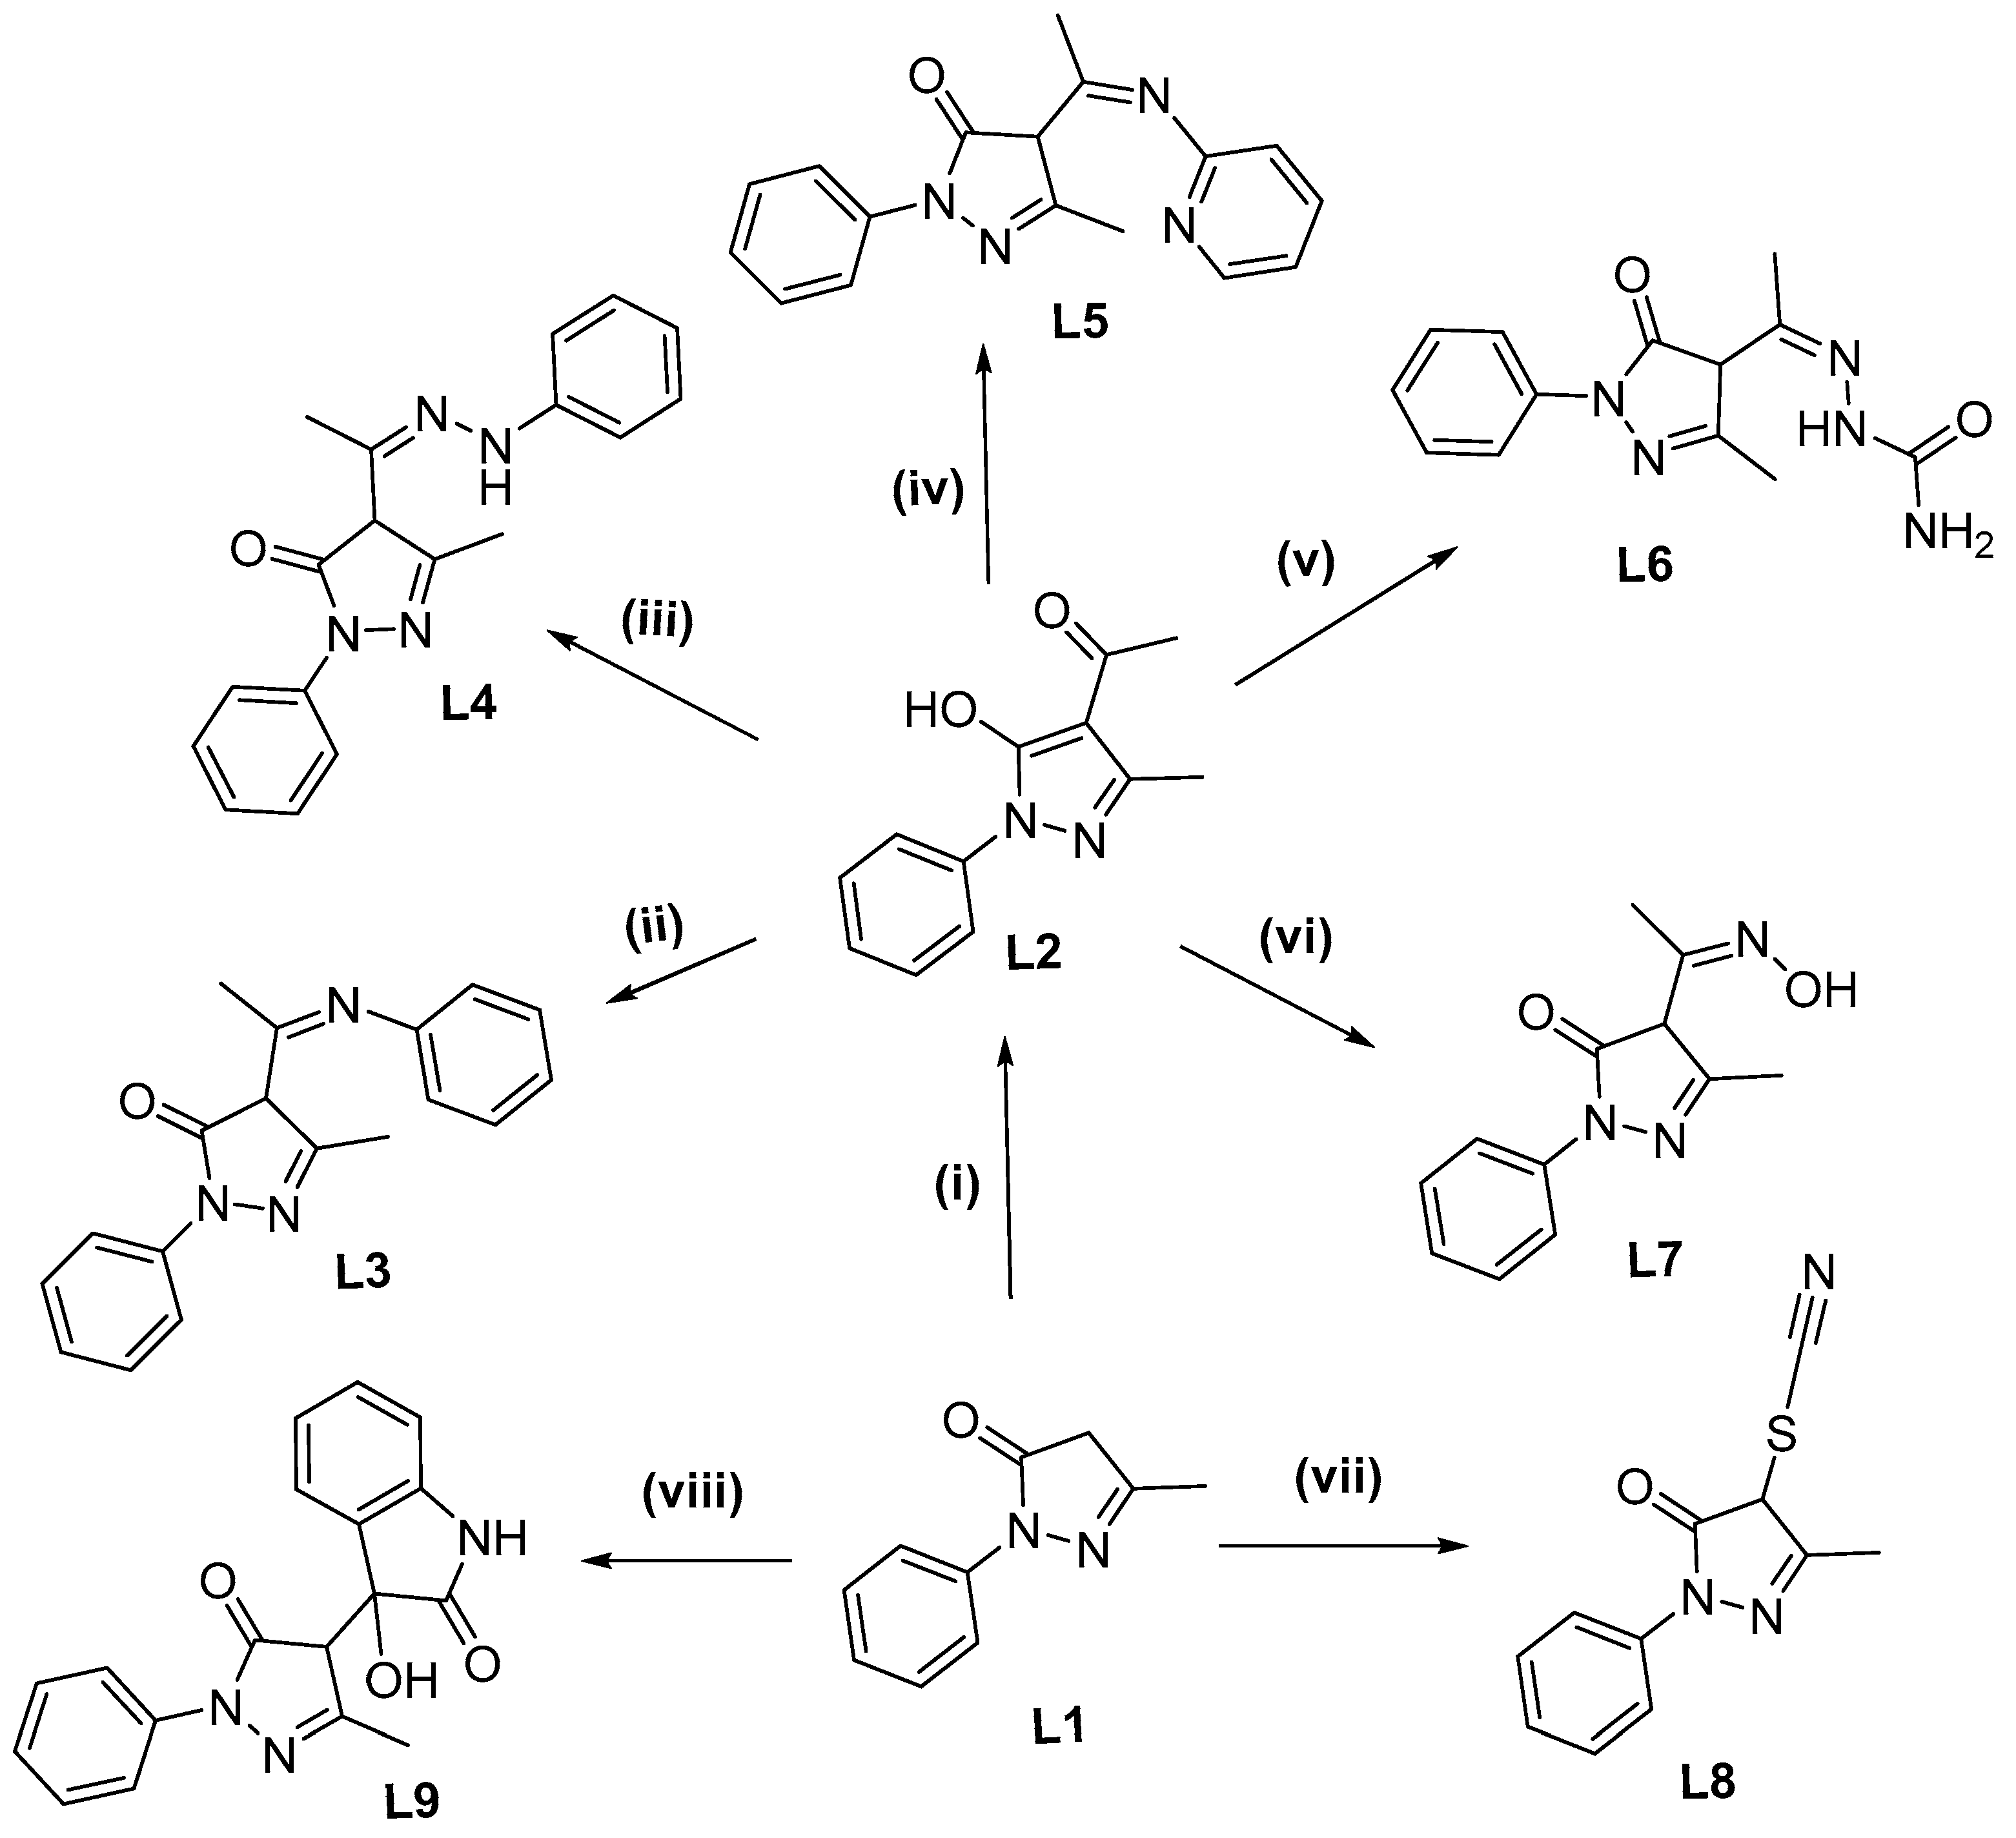
Compound L1 (edaravone) was obtained commercially and used without further purification. Compound L2 was obtained by the acetylation of L1 with acetyl chloride under alkaline reaction conditions [57]. Compounds L3L7 were obtained by reacting L2 with stochiometric amounts of aniline, phenylhydrazine, 2-aminopyridine, semicarbazide and hydroxylamine in methanol, under mild acidic and reflux conditions [58]. Compound L8 was obtained by reacting L1 with ammonium thiocyanate in the presence of potassium persulphate in acetonitrile [59]. The last compound, L9 was obtained by reacting L1 with isatin under alkaline conditions [60].
The nine compounds, L1L9, were treated with CuCl2.2H2O (in 1:1 or 1:2 stoichiometry) in methanol under reflux conditions to obtain the respective copper complexes, C1C9 in high yield (Figure 1).

3.1.2. Characterization

All of the organic compounds, L1L9, and their respective copper complexes, C1C9, were duly characterized by using various spectro-analytical methods.

Elemental Analysis

The carbon, hydrogen and nitrogen analysis data obtained for all of the compounds fit well with the proposed structures of the ligands (Scheme 1) and complexes (Figure 1), hence confirming their analytical purity. The copper and chloride analysis data [43] of the complexes confirmed the projected 2:1 ligand to metal stochiometric ratio in the complexes, C1C4 and C7C9, while 1:1 types of complex formation were found in the cases of C5 and C6.

Infrared Spectral Analysis

The infrared spectral analysis provided valuable information about the structural features of the compounds. The important absorption bands of all of the compounds are provided in the experimental section (vide infra) and the corresponding spectra are provided in the Supplementary Materials. The medium/strong intensity broadbands observed in the range 3100–3500 cm−1 are ascribed to the stretching of -NH/-OH bonds in the ligands. These bands obtain breadth and intensity in the corresponding complexes owing to the coordination and presence of ligated/solvated water molecules. The medium intensity signals seen in the range 2900–3000 cm−1 in L1L9 are assigned to the C-H stretching vibrations. Ketonic, acetyl or azomethine absorptions are observed in the range 1690–1550 cm−1 in the ligands and experience considerable change in the corresponding complexes (C1C9), indicating the metal coordination. The characteristic fingerprint region (1500–550 cm−1) of the ligand systems [57,58,59,60] experienced distinct changes upon complexation [61,62,63,64,65,66].

UV–Visible Spectral Analysis

UV–visible spectra of all of the organic derivatives (L1L9) and copper complexes (C1C9) were recorded in the range 250–900 nm in DMSO at 10−4 M concentration. All of the organic ligands exhibited broad peaks in the region 260–280 nm corresponding to π–π* transitions. Low energy transitions observed in the 280–300 nm and 350–450 nm regions are ascribed to the n-π* transitions associated with aromatic rings and N, O and S, heteroatoms present in the ligands. These peaks experience noticeable changes in the respective copper complexes owing to metal coordination [61,62,63,64,65,66]. The ligand-to-metal charge transfer (LMCT) transitions, which appear in the range 350–450 nm in some complexes, significantly increase the intensity of the bands in the region. A peak corresponding to the d–d transition was observed only in the complex C3 (i.e., 550 nm). All of the absorption values of each compound are listed in the experimental section (vide infra) and the corresponding spectra are provided in the Supplementary Materials.

NMR Analysis

All of the synthesized edaravone derivatives (L2L9) were duly characterized by 1H and 13C NMR spectral analysis (in CDCl3 or DMSO-d6 solvent) and compared with the related compounds reported in [57,58,59,60] (except for the compounds L6 and L7, due to their low solubility). The peak assignment for each compound is depicted in the experimental section (vide infra) and the corresponding NMR spectra are provided in the Supplementary Materials. The NMR analysis of the respective copper (II) complexes was not completed owing to their paramagnetic nature.

Mass Analysis

ESI mass analyses of ligands L6 and L7 were carried out in order to confirm their molecular structures. The high intensity base peaks observed at m/z 272 and m/z 230 in the corresponding mass spectra of compounds (in negative ion mode) L6 and L7, respectively, are ascribed to the respective M–H species. The ESI mass spectra of the compounds are provided in the Supplementary Materials.

3.2. Biochemistry: Evaluation of Antioxidant Properties

In biological systems, the free metal ions catalyze the oxidation of ascorbic acid and promote the formation of reactive oxygen species (ROS) such as superoxide radicals (O2•−), H2O2, and hydroxyl radicals (OH) [67]. These reactive oxygen species damage the key molecules of biological significance, such as phospholipids, proteins, and DNA, causing oxidative stress, which is responsible for numerous health disorders such as cancer, cardiovascular disease, atherosclerosis, and Alzheimer’s disease [68]. Therefore, the study of compounds possessing high free radical scavenging activity is of immense research interest [67].
In the present work, we have used three different methods to study the antioxidant activity of edaravone derivatives and their Cu(II) complexes. The methods we applied are from the respective groups of hydrogen atom transfer (DPPH), electron transfer (ABTS) [69,70], and ROS (H2O2) [68].

3.2.1. Hydrogen Peroxide Scavenging Activity (HPSA) Assay

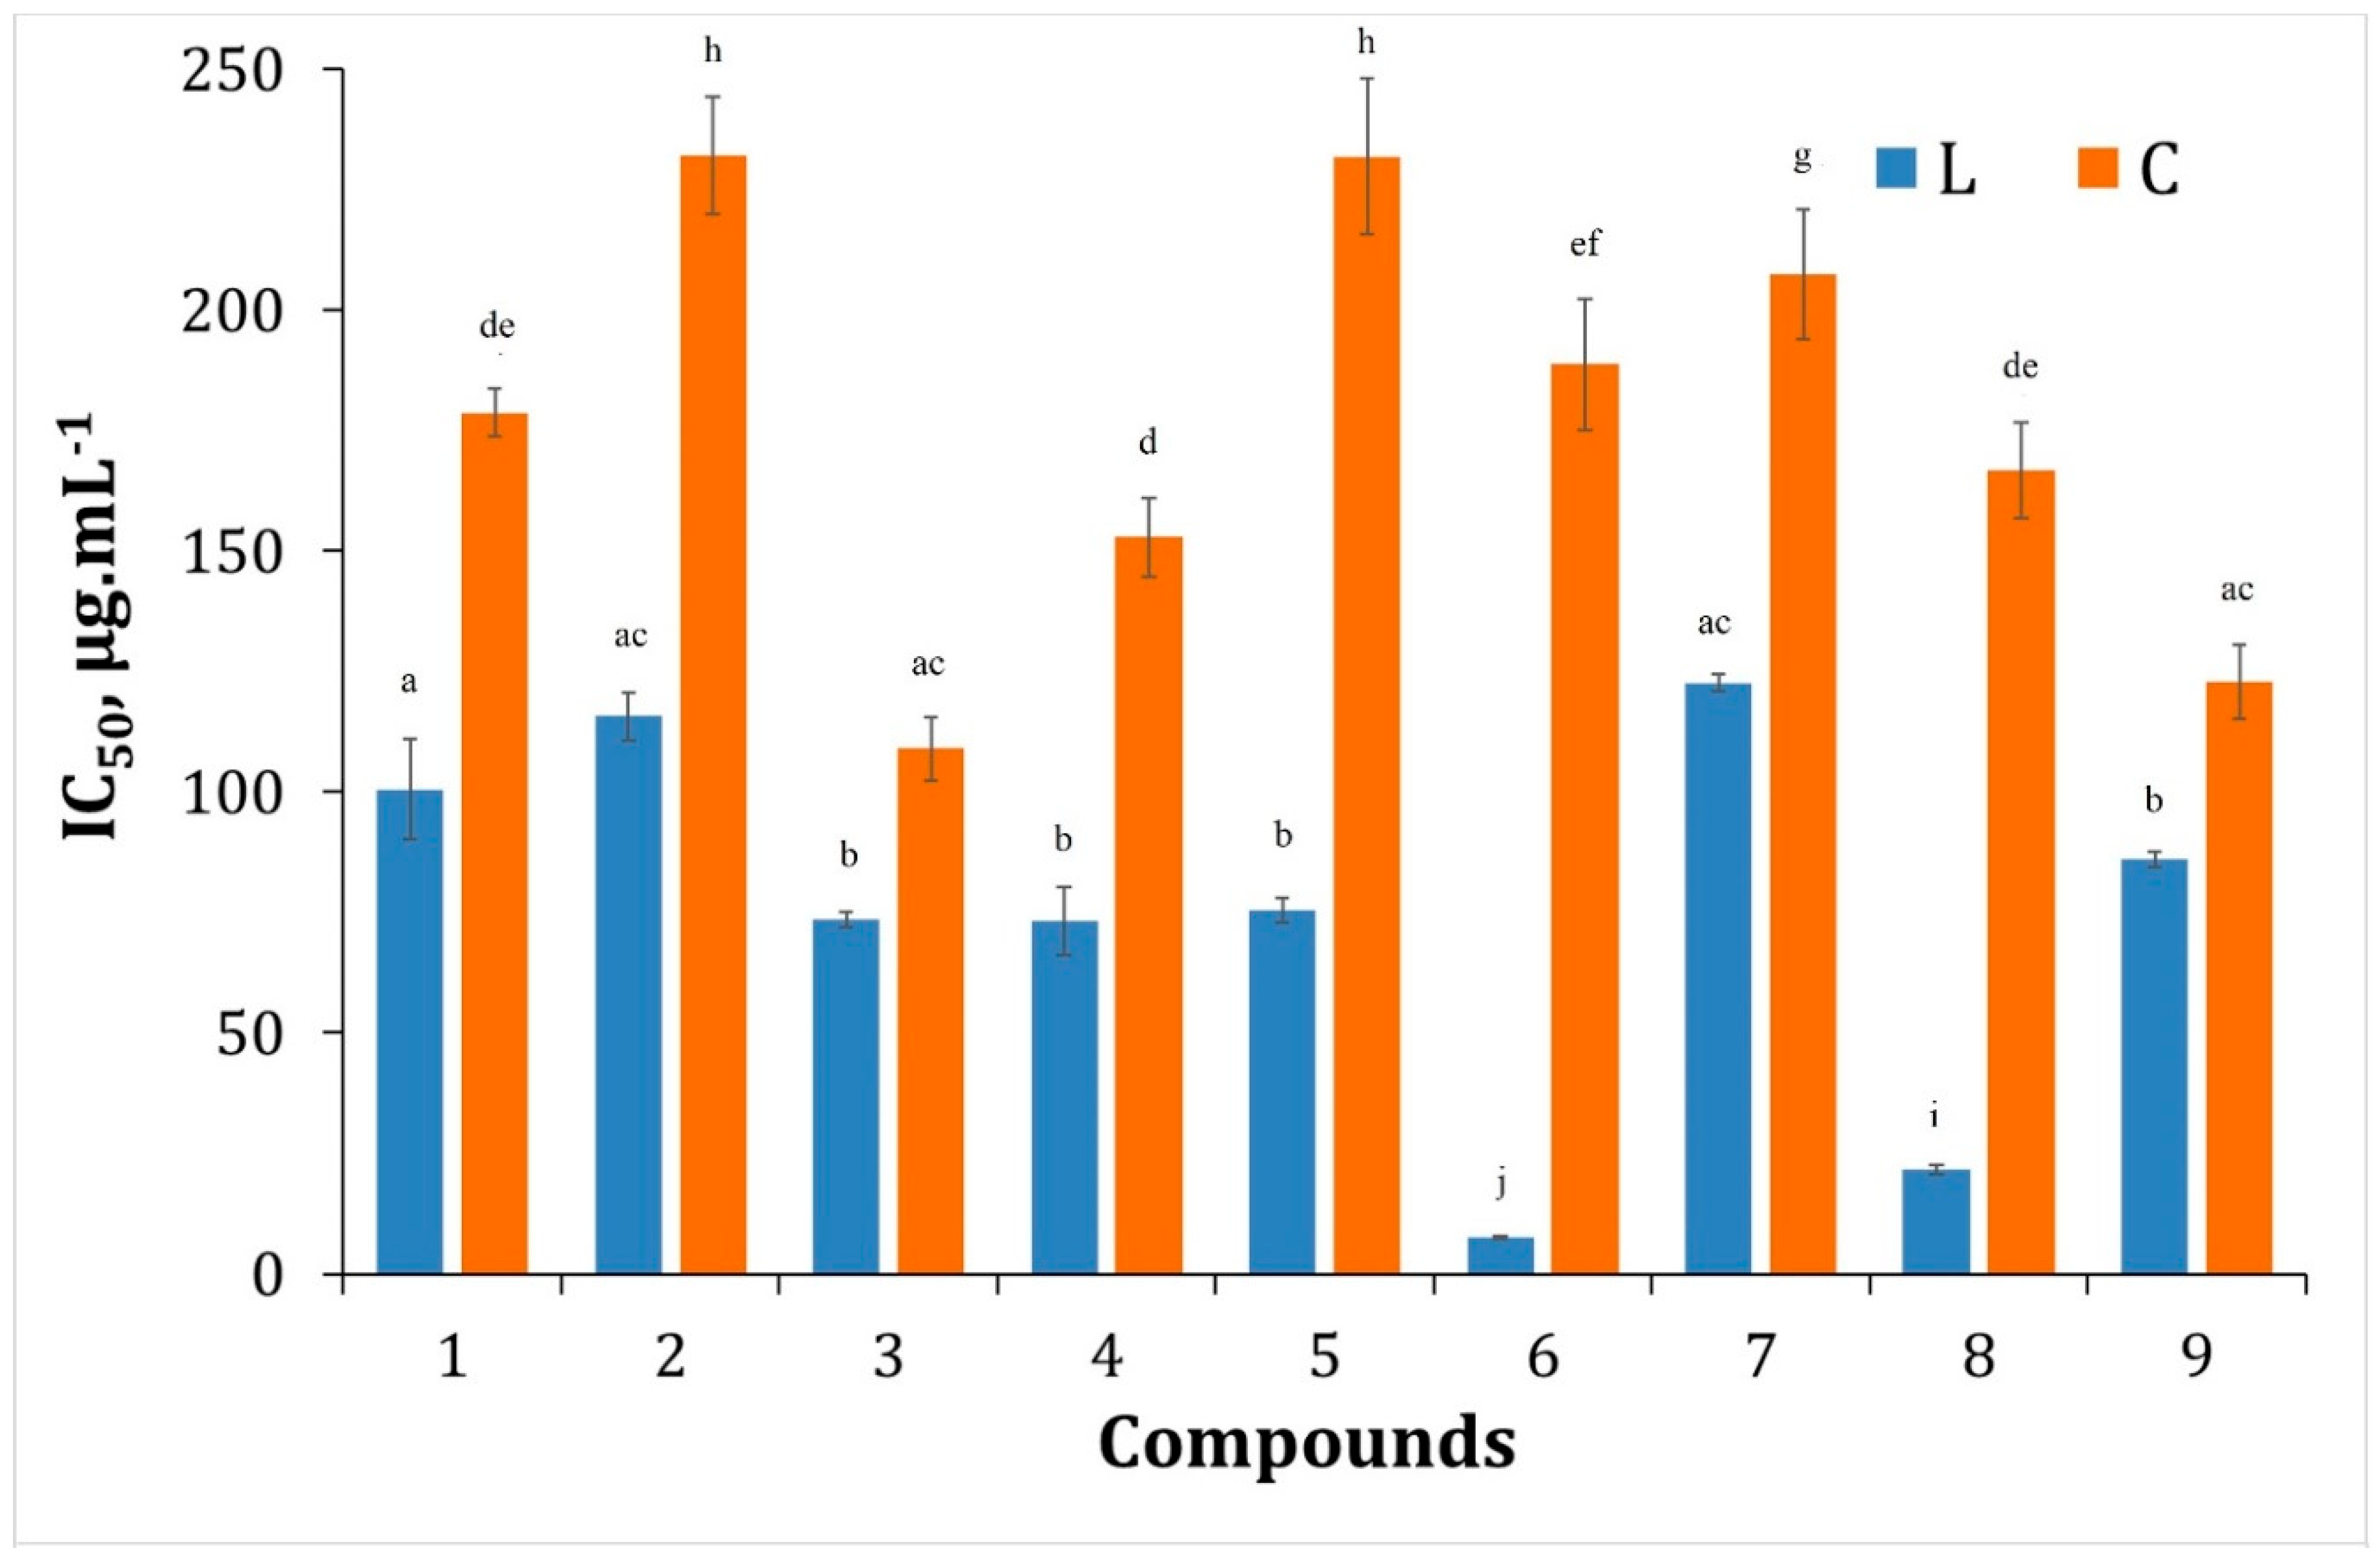
The inflammatory process accelerates the formation of ROS, especially superoxide, which will lead to the formation of H2O2 (superoxide dismutation) and which will further form hydroxyl radicals (the Haber–Weiss process) [71]. Removal of H2O2 is very important in preventing the generation of highly reactive hydroxyl radicals. Therefore, in the present work, the H2O2 scavenging property of the synthesized edaravone compounds is investigated and compared with the standard, edaravone (L1), and with ascorbic acid. Figure 2 depicts the bar diagram of the hydrogen peroxide scavenging activity (HPSA) analysis data (The IC50 values of the compounds are listed in Table S1 in the Supplementary Materials). The IC50 values of the synthesized compounds ranged from 7.61 to 232.10 µg.mL−1. Compared with ascorbic acid, edaravone derivatives L6 and L8 are characterized by higher antioxidant activity. The statistical evaluation of the antioxidant activity of the edaravone derivatives and their complexes was conducted using Duncan’s test. In this case, we used edaravone (L1) as a standard by which to distinguish the individual groups. Duncan’s test enables the evaluation of differences in antioxidant activity, while also assessing how the activity varies based on the structure of the compounds. Only the compounds, L6 (7.61 µg.mL−1) and L8 (21.61 µg.mL−1), which contain semicarbazone and thiocyanate substituents, respectively, were found to have lower IC50 values than the standard, edaravone (L1), indicating their prominent antioxidant activity. Interestingly, all of the organic edaravone derivatives exhibited higher antioxidant activity than their respective Cu(II) complexes, varying from 1.4 to a striking 24 times higher activity.

3.2.2. DPPH Free Radical Scavenging Activity Assay

The DPPH (2,2-diphenyl-1-picrylhydrazyl) radical scavenging activity is a widely used method for the investigation of the free radical scavenging ability of newly developed compounds. Change in the color of the DPPH radical from violet to yellow upon reduction is monitored in this test [72].
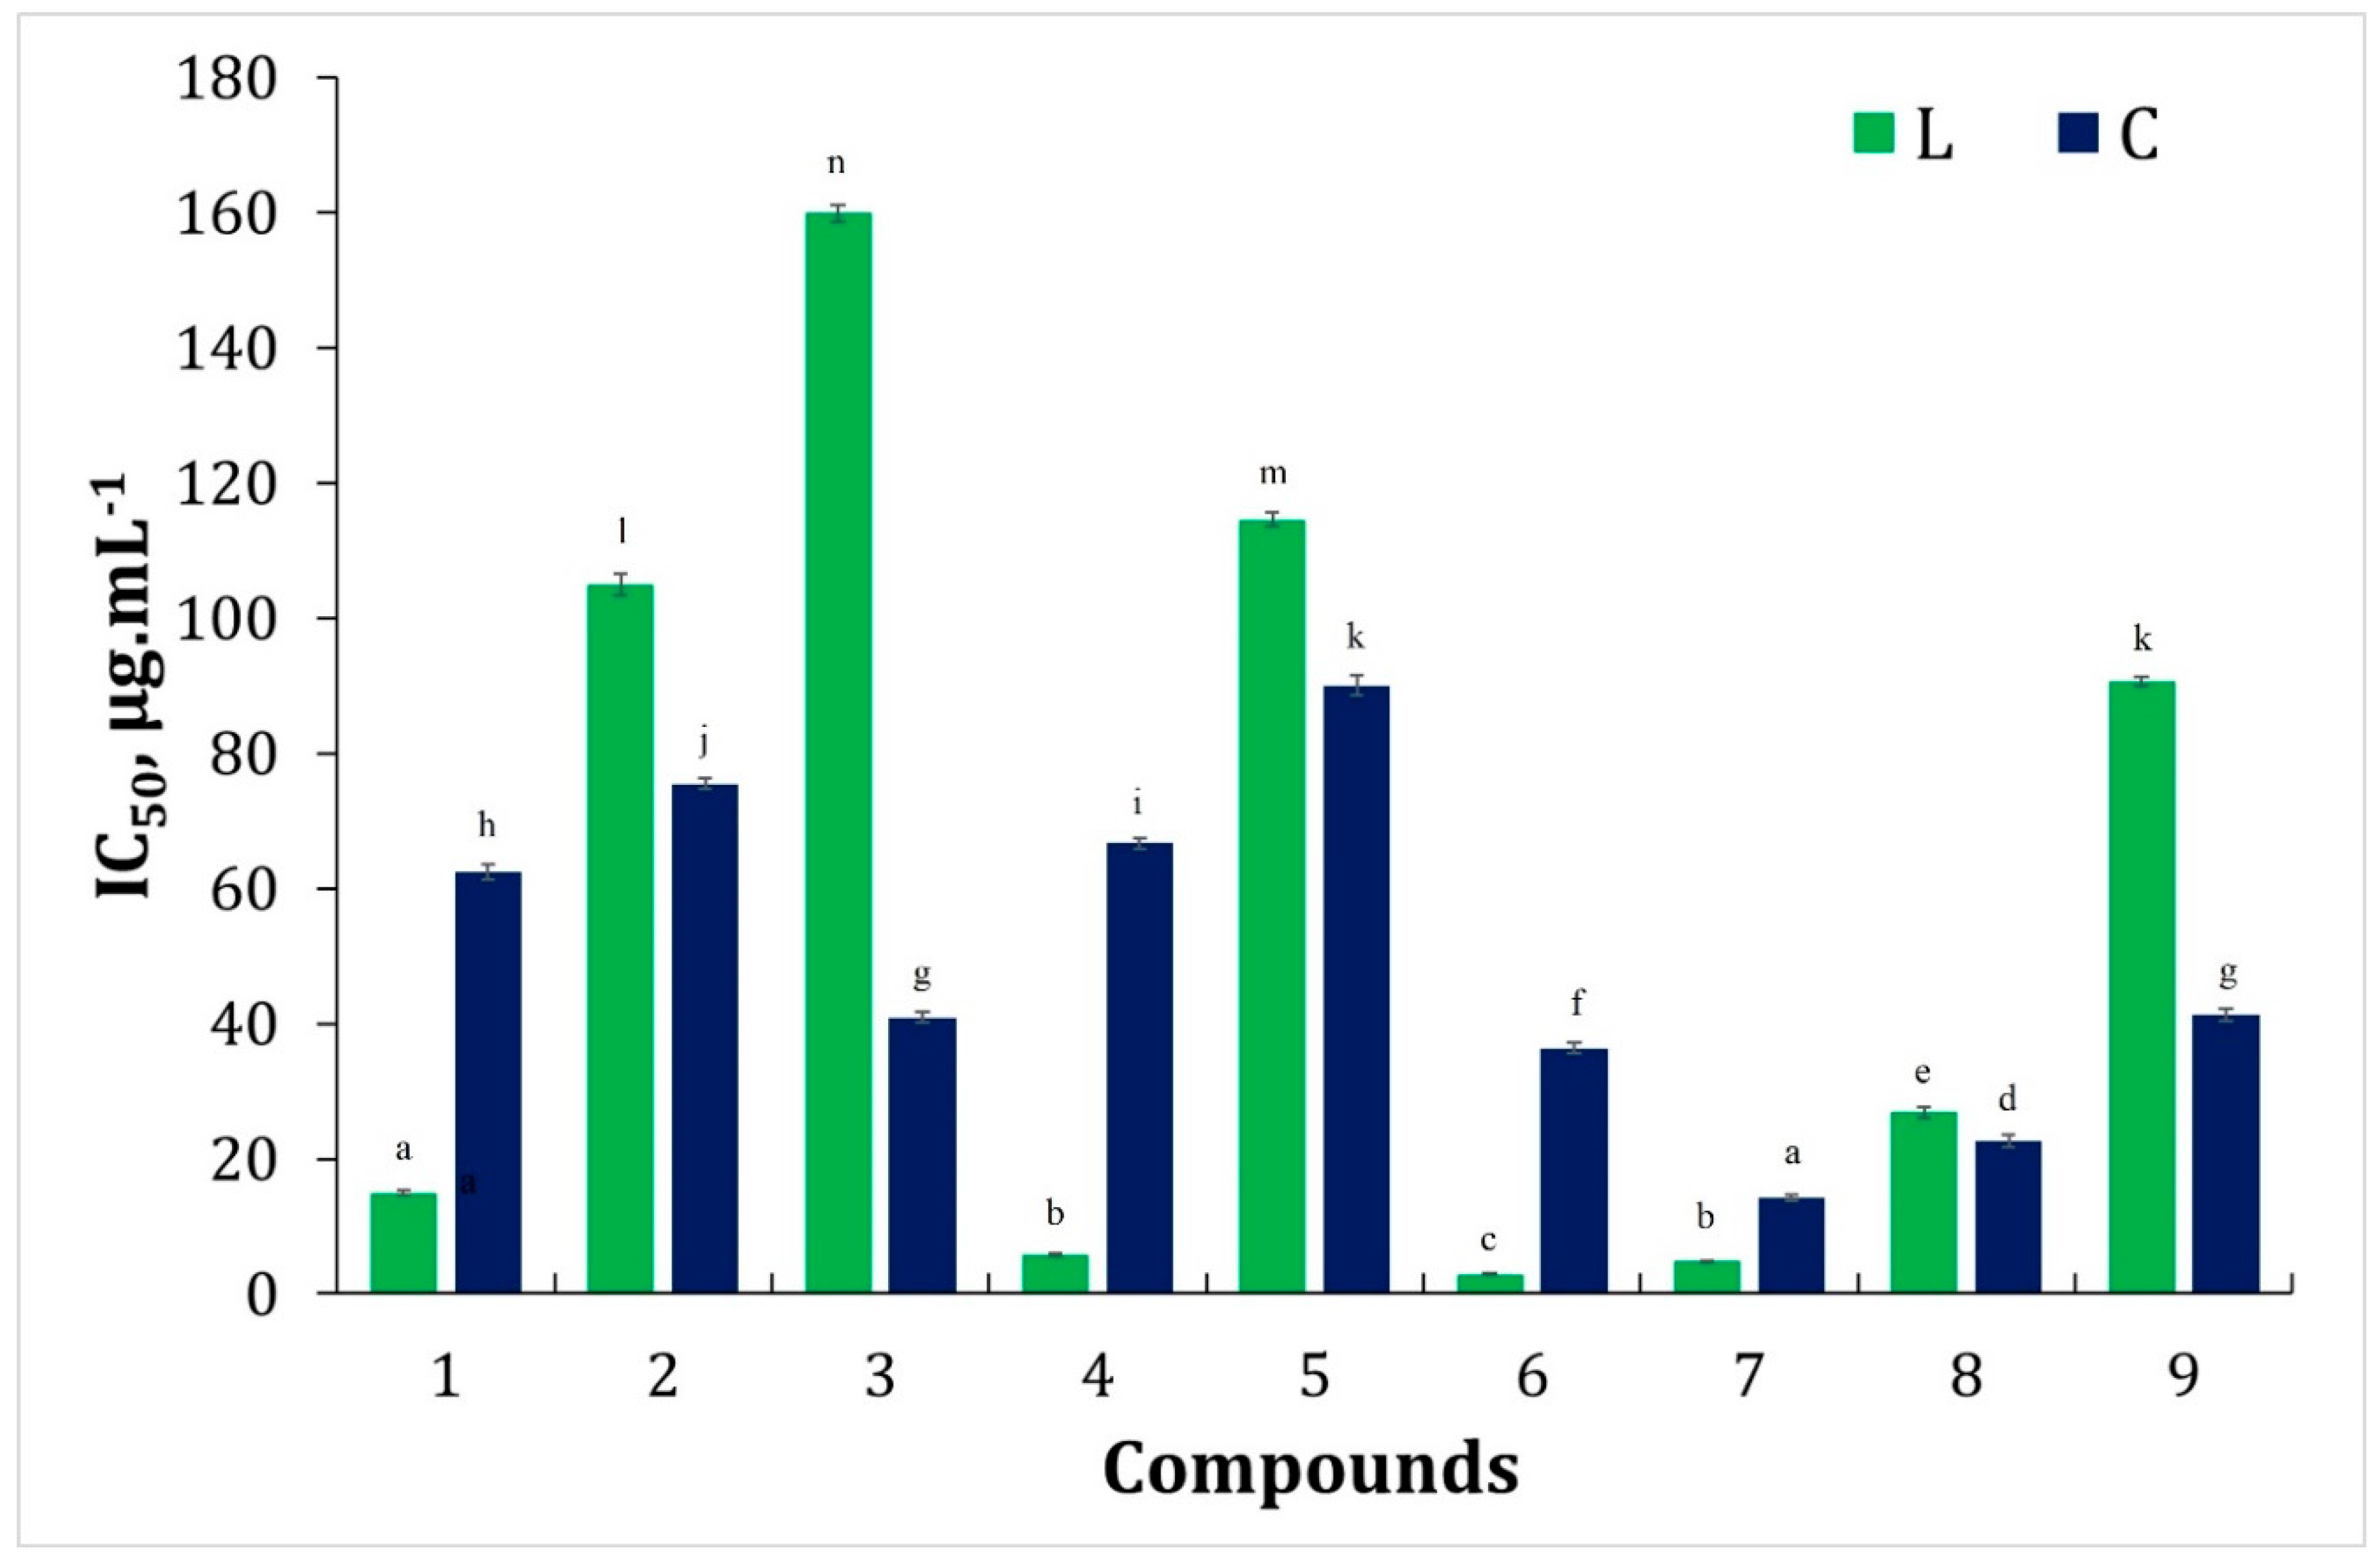
The results for radical scavenging activity of the synthesized compounds are presented in Figure 3 (The IC50 values of the compounds are listed in Table S1 in the Supplementary Materials). The edaravone derivatives L4, L6, and L7 are characterized by significantly high radical scavenging activity, with IC50 values ranging from 2.94 to 5.84 µg.mL−1. Their higher activity may be due to the fact that they more easily donate a proton for subsequent reaction with DPPH. A medium level activity is shown by the compounds L1 and L8, with IC50 values between 13 and 26 µg.mL−1. While the compounds L2, L3, L5 and L9 showed low antioxidant activity. Among the corresponding complexes, C7 (IC50 = 14.15 µg.mL−1) and C8 (IC50 = 22.55 µg.mL−1) exhibited good antioxidant activity. Interestingly, the Cu(II) complexes C2, C3, C5 and C9 showed higher antioxidant activity compared with their corresponding ligands, indicating the involvement of a copper center in the antioxidant activity [38,39,40,41].

3.2.3. ABTS Assay

The results determined by ABTS (2,2′-azino-bis(3-ethylbenzothiazoline-6-sulfonic acid) analysis are presented in Figure 4 (The IC50 values of the compounds are listed in Table S1 in the Supplementary Materials). This is a widely used method for the determination of the total antioxidant capacity of the compounds. Decolorization of the blue/green ABTS•+ radical by the act of antioxidants is monitored in this assay [73]. In the current investigation, the organic compounds L1, L4, L6, and L7 exhibited high radical scavenging activity with IC50 values ranging from 38.70 to 51.88 µg.mL−1. The copper(II) complexes C3, C6, C7, C8, and C9 showed significantly higher radical activity than the corresponding ligands, with the complex C7 (IC50 = 18.23 µg.mL−1) exhibiting the highest radical scavenging activity among all of the tested compounds.

3.3. Computational Studies

3.3.1. Electronic Properties

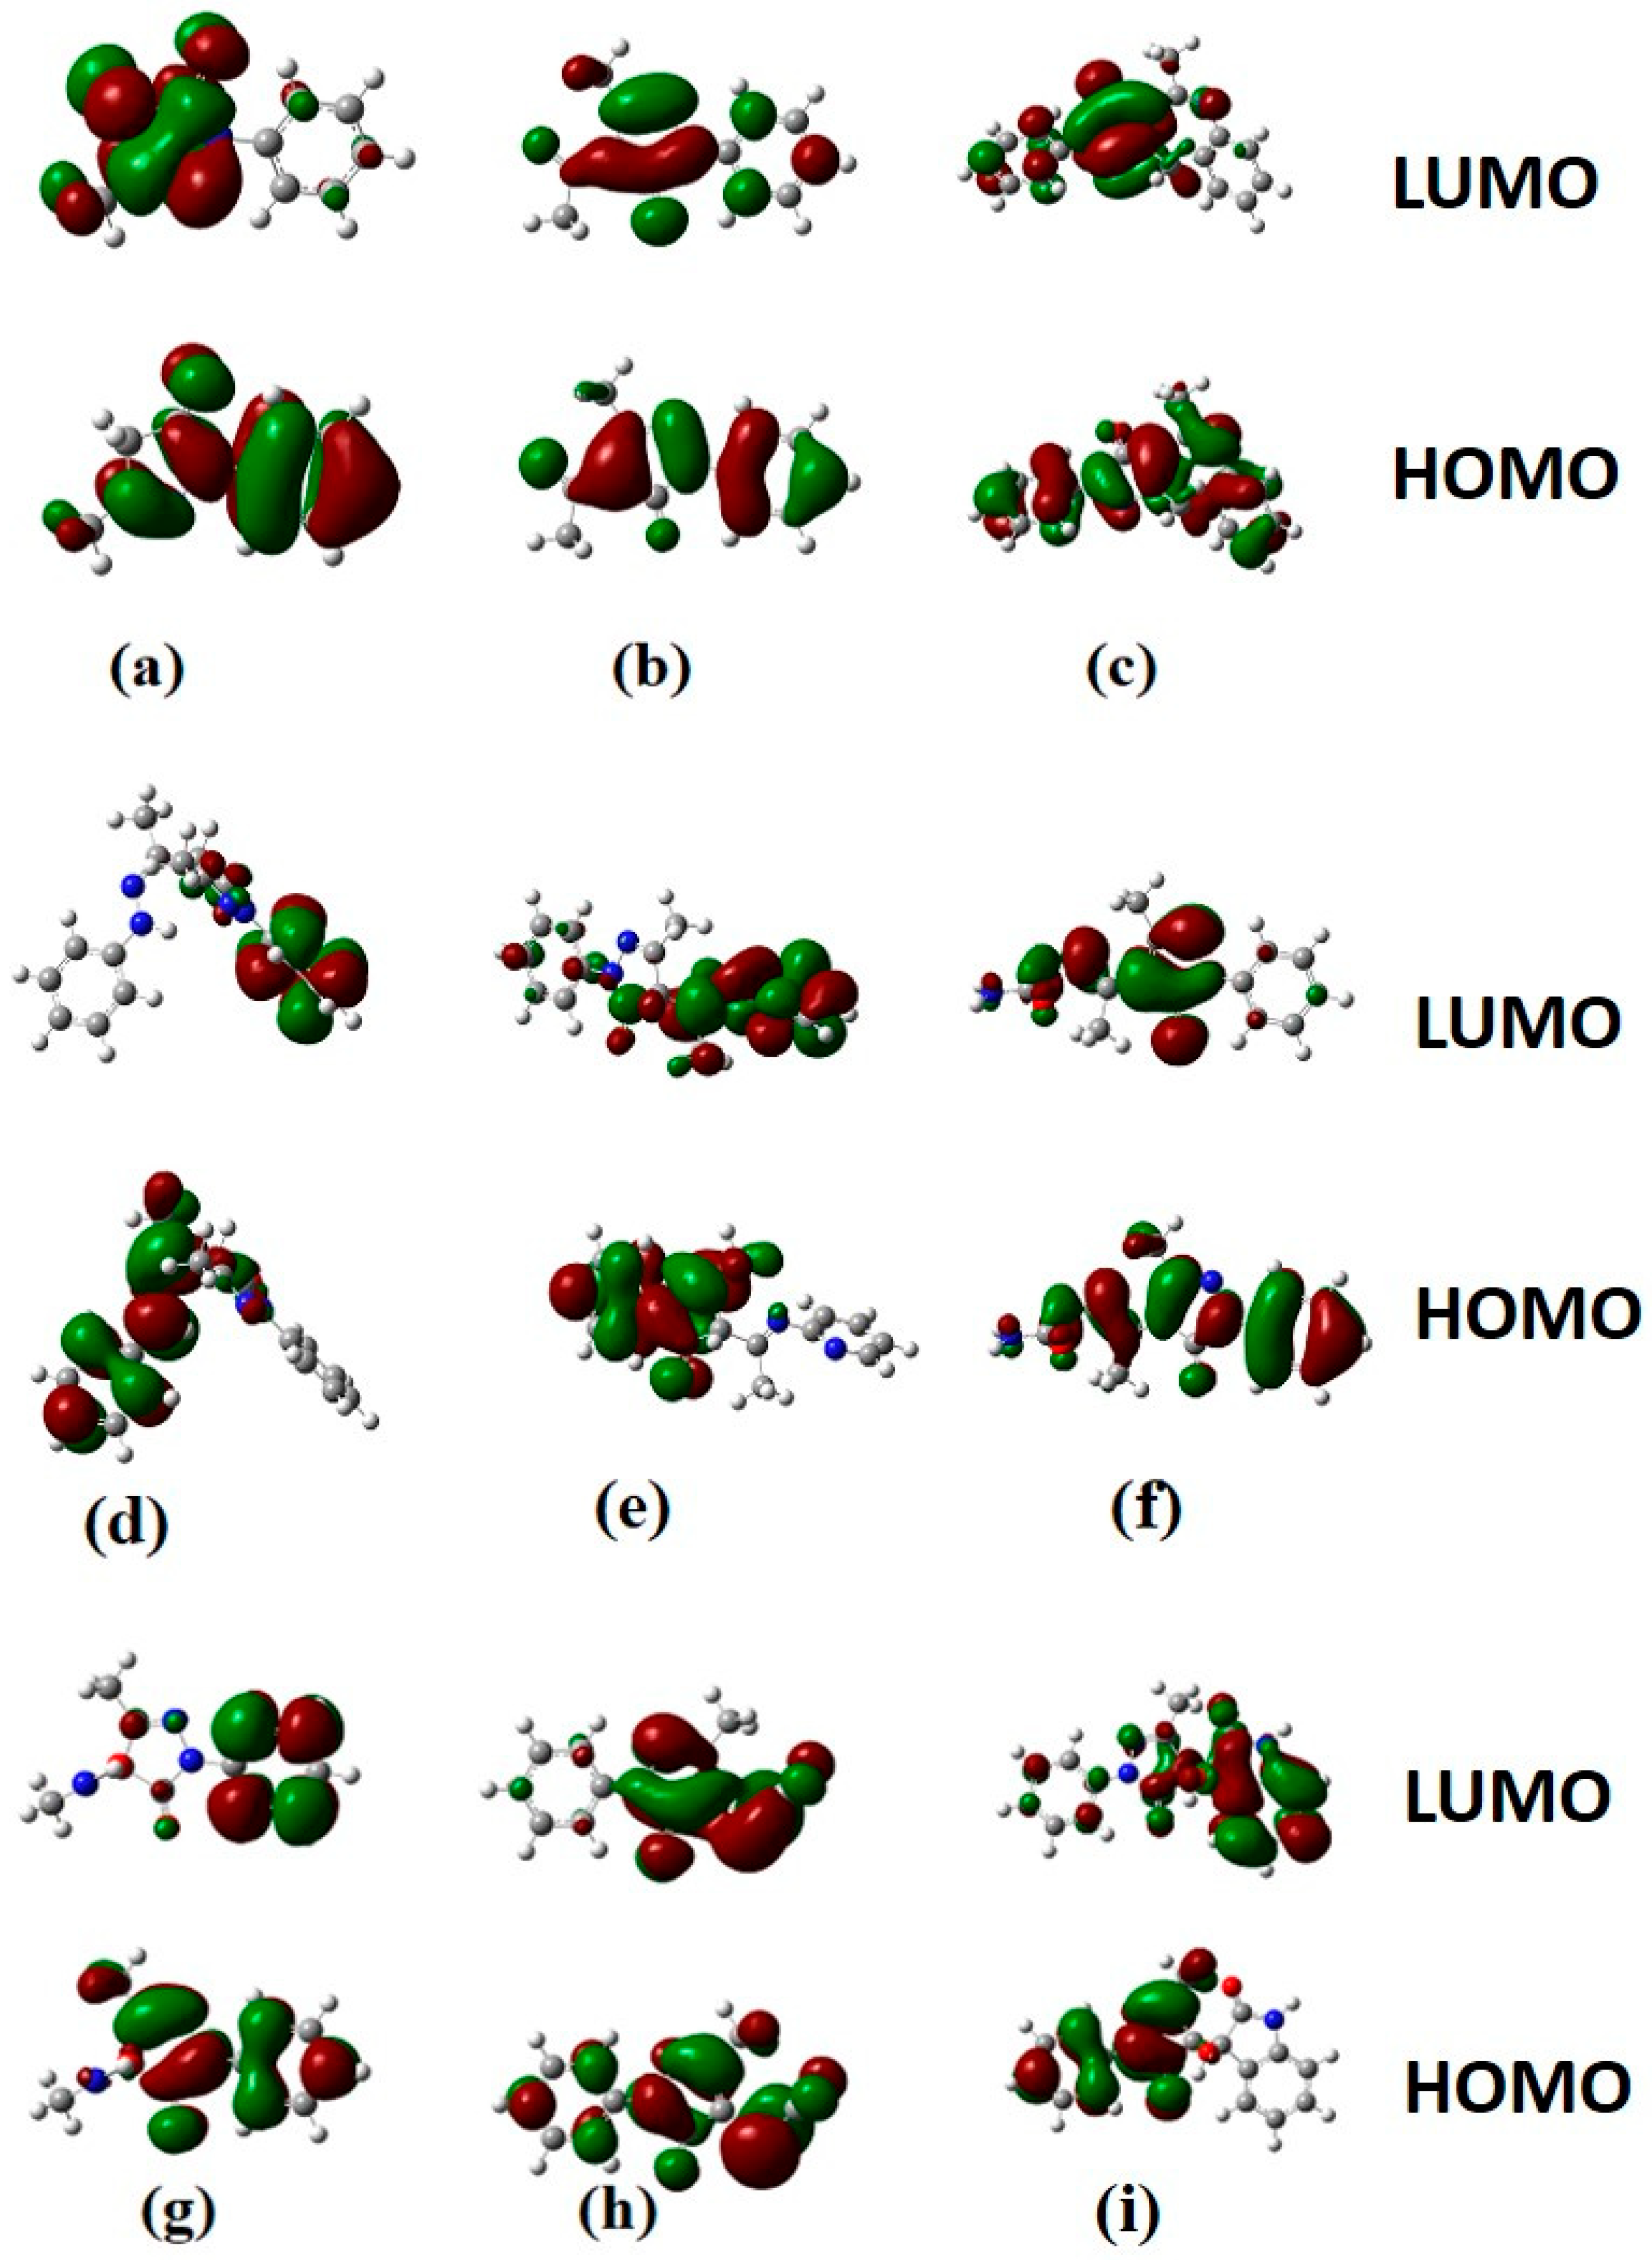
From the three assays used for the evaluation of antioxidant activities of the compounds, it is observed that the organic compounds generally exhibited better antioxidant activities as compared with the corresponding copper(II) complexes. Hence, for further computational studies, only the organic compounds were considered. The chemical characteristics of the organic ligands were calculated theoretically to anticipate a comparison of antioxidant activity exhibited by them. The results are presented in Table 1. The frontier molecular orbital (FMO) energies are crucial in establishing the chemical stability and reactivity of the molecules [74]. The HOMO–LUMO plots of the organic compounds L1L9 are given in Figure 5. The charge transfer in the systems is determined by the distribution of electron densities in the HOMO–LUMO plots of all of the organic molecules. A large energy gap of about 5.2351 eV is computed for the compound L2, while the other compounds are found to be in the range of 2.7697–5.2318 eV, suggesting higher reactivity for the latter group than the former, which is a good indicator of reactivity. The LUMO energies obey the downward order, as follows: −0.7129 (L6) > −0.7377 (L7) > −0.9448 (L2) > 1.0182 (L3) > −1.0776 (L8) > −1.0781 (L1) > −1.1684 (L9) > −1.1924 (L5), whereas the HOMO energies follow the range −5.3959 (L4) to −6.3094 (L8), reflecting the decreasing and the increasing of the electron acceptor and donor roles, respectively.
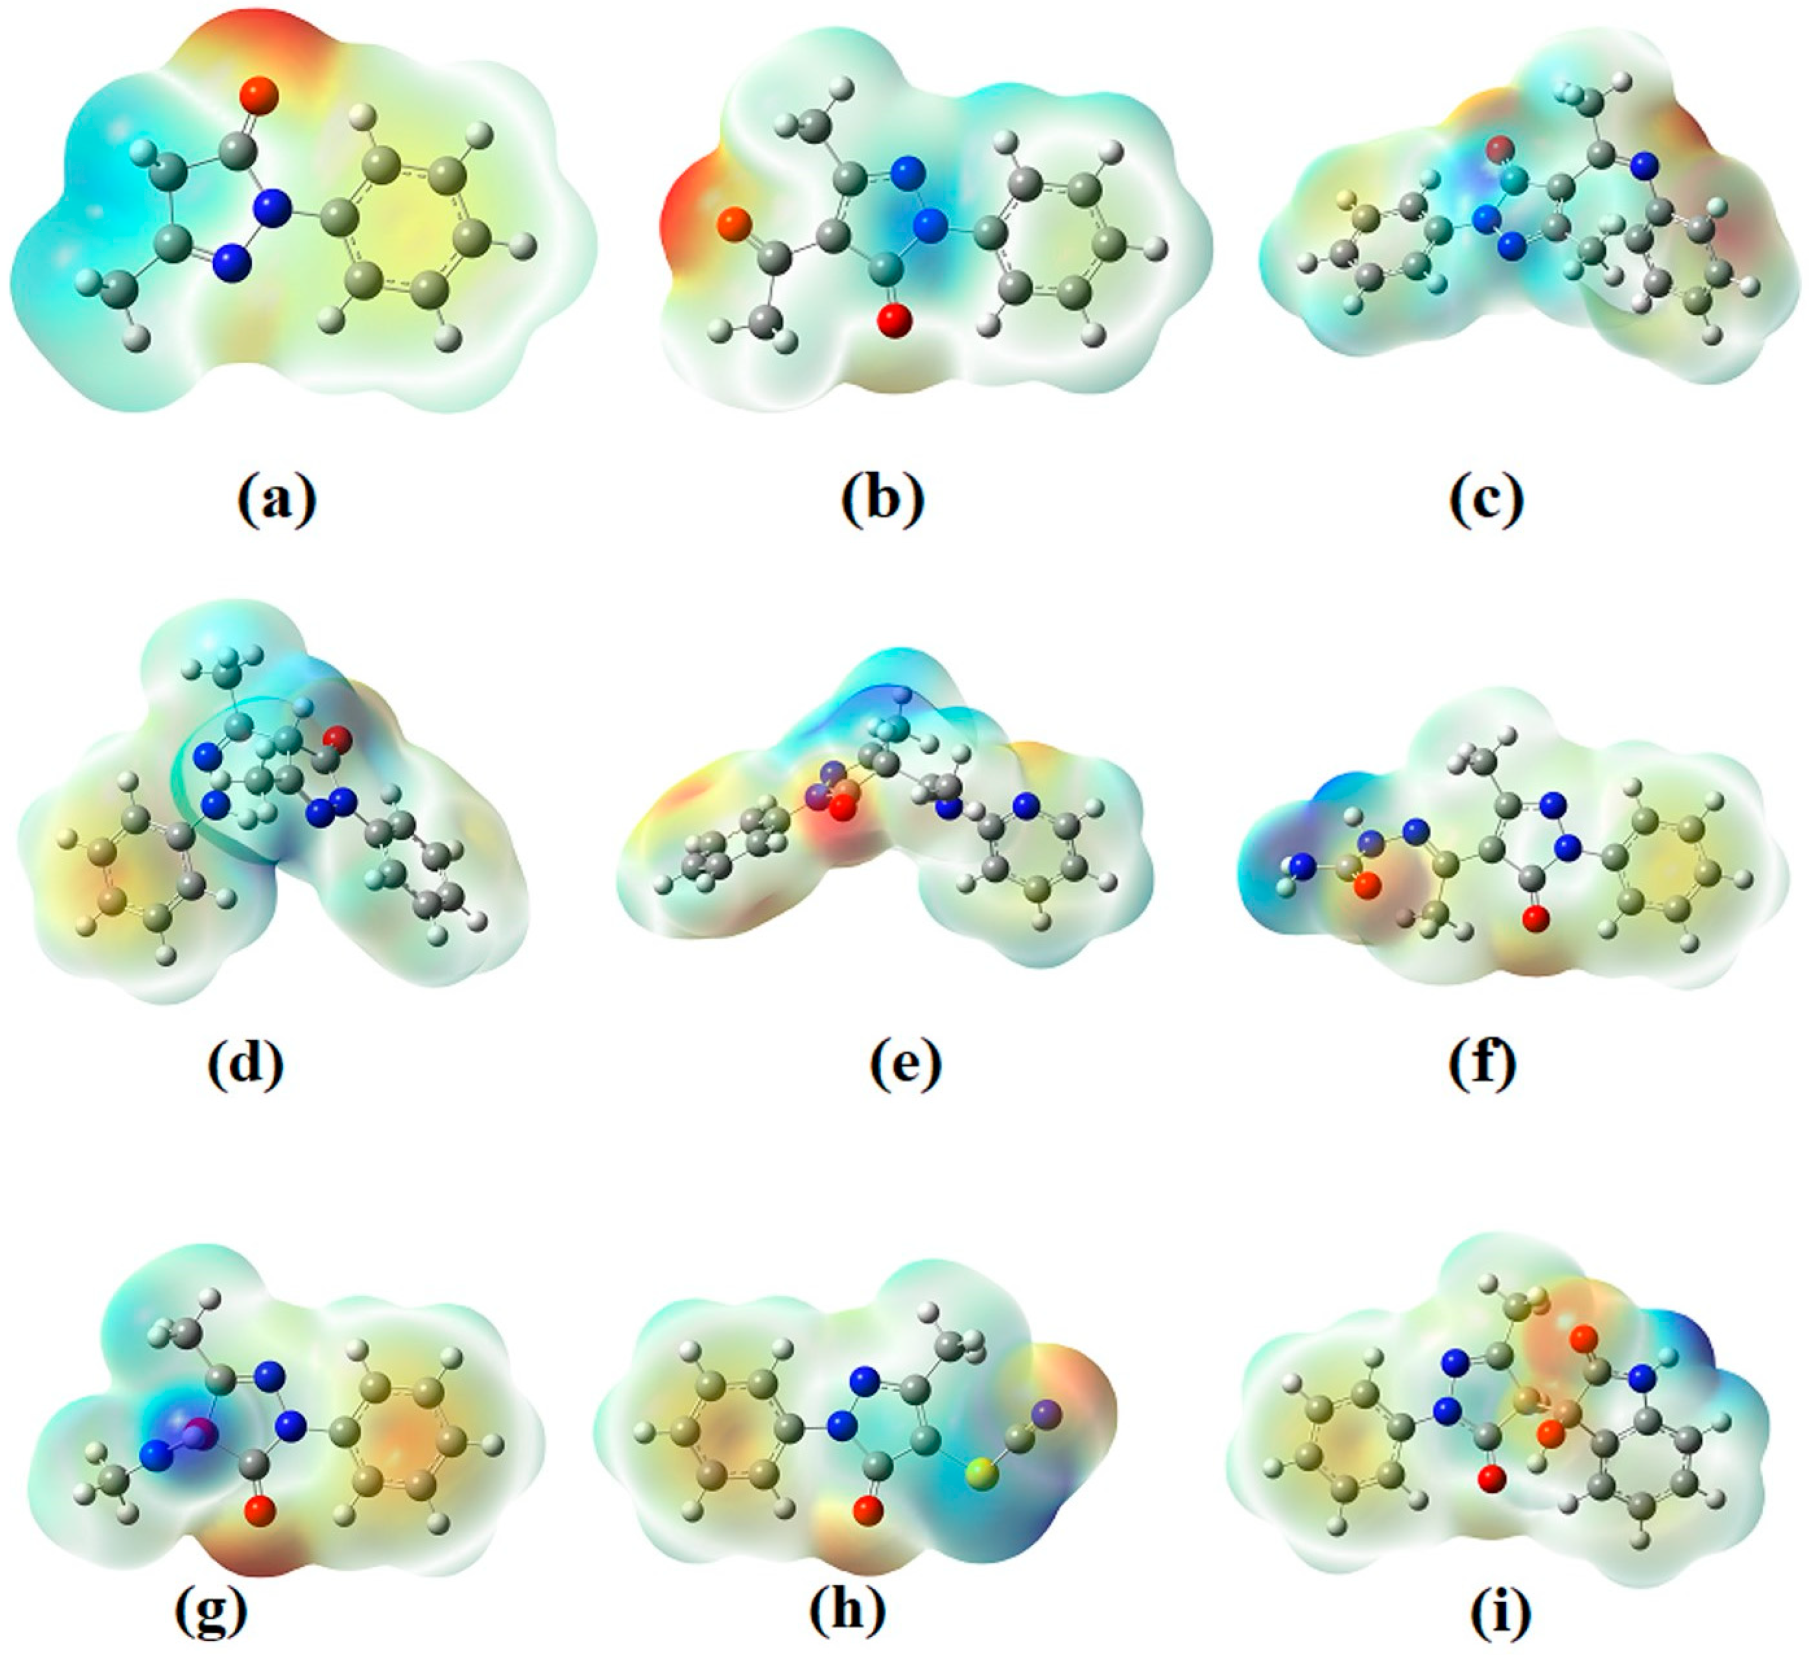
The electrophilicity varies inversely to the energy gap and the chemical hardness, but it increases with the augmentation of the square of the chemical potential. The high electrophilicity value is related to the relatively smaller energy gap. From Table 2, the possible reactivity order is established as follows: 2.0722 (L6) < 2.0794 (L7) < 2.4240 (L2) < 2.4472 (L3) < 2.5124 (L1) < 2.6412 (L9) < 2.6447 (L5) < 2.6075 (L8) < 2.8656 (L4). The molecular electrostatic potential (MEP) plots of the organic compounds L1L9 are presented in Figure 6. The plots show the isosurfaces of nucleophilic and electrophilic attack sites. The red and yellow zones represent the electronegative and blue regions are electropositive zones. From the MEP surfaces, it is very clear that most of the molecules possess reactive sites.

3.3.2. Molecular Dynamics and Docking

To study the biological activity of compounds and activity functions, the most widely used techniques in drug discovery are docking and MD simulations [75]. These predict the binding modes and the stability of the complex by its corresponding interactions and binding affinity [76]. As there is a considerable interest in evaluating the tyrosinase inhibitory activity of the newly developed antioxidant compounds, we investigated the docking and binding affinities of our compounds with tyrosinase from Bacillus megaterium (PDB ID: 3NM8) [77,78]. The binding energies of each compound are tabulated in Table 2. The interaction plots for organic ligands L1L9 are represented in Figure 7. The binding energies for the organic ligands (L1L9) are found to be in the range −6.9 (i.e., L5) to −11.5 kcal/mol (i.e., L9). As, in the experimental results (vide supra), the organic molecule L6 (binding energy −9.4 kcal/mol) has exhibited comparatively better antioxidant activity among the tested compounds, it was selected for further molecular dynamics (MD) simulation studies.
A complex with a selected ligand, L6, was subjected to molecular dynamics simulation analysis. The MD simulation was performed (150 ns) to estimate the stability of the 3NM8–L6 complex, investigation of other parameters, such as root mean square deviation (RMSD), root mean square fluctuation (RMSF), radius of gyration (Rg), hydrogen bonds, and solvent accessible surface area (SASA). Additionally, molecular mechanics Poisson–Boltzmann surface area (MMPBSA) analysis was performed.
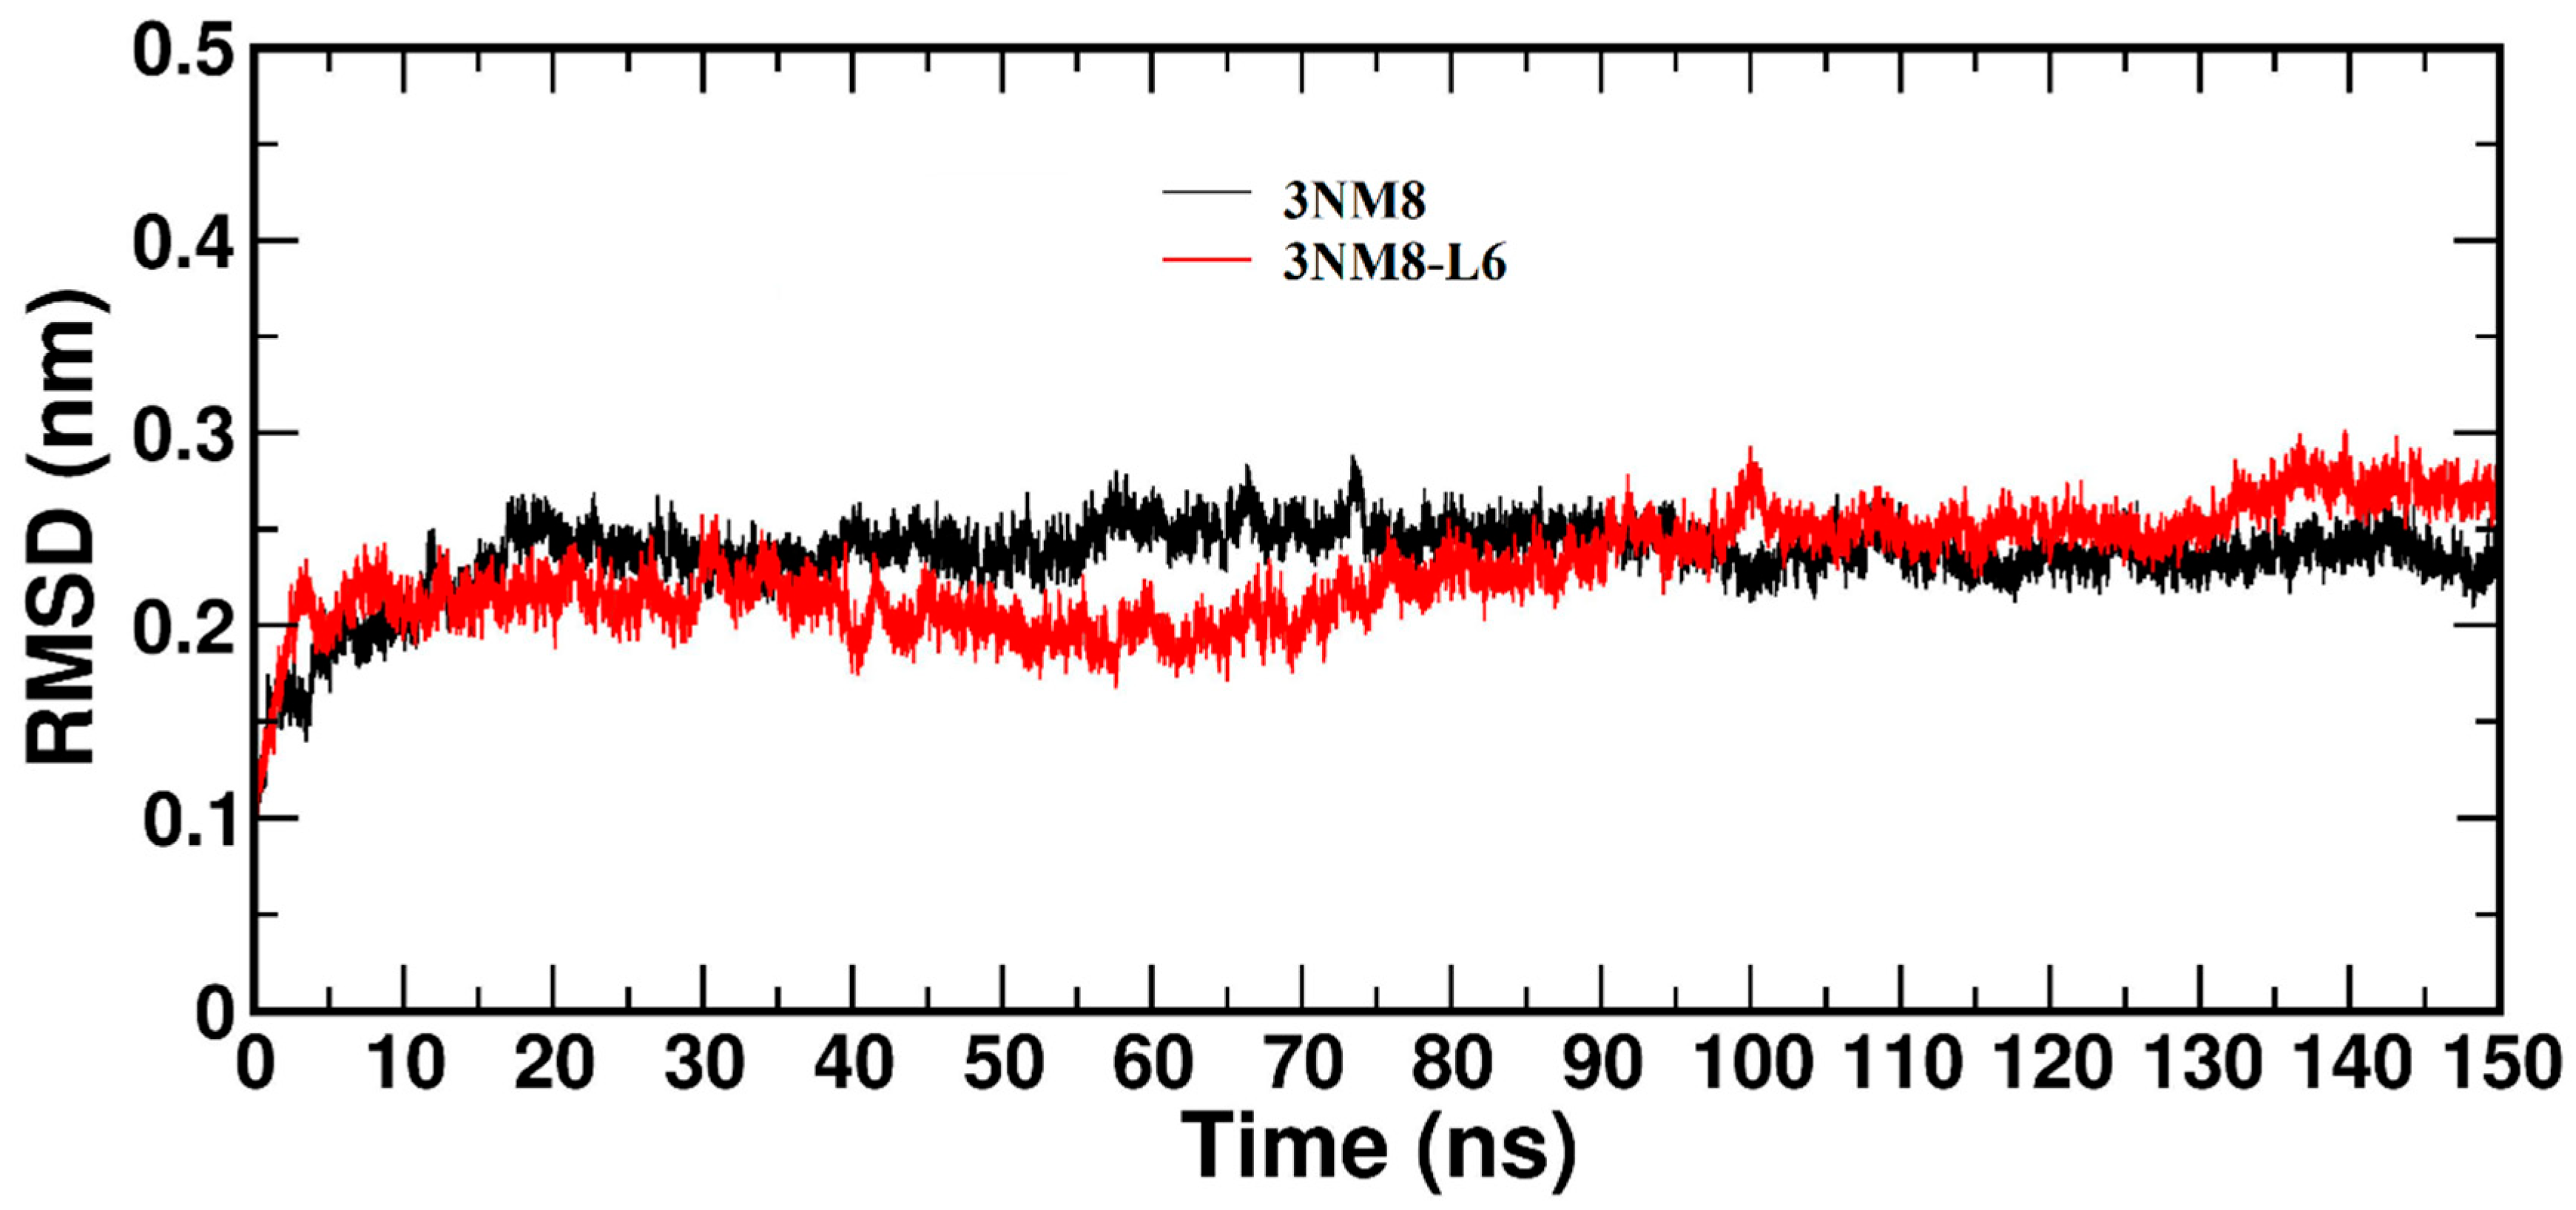
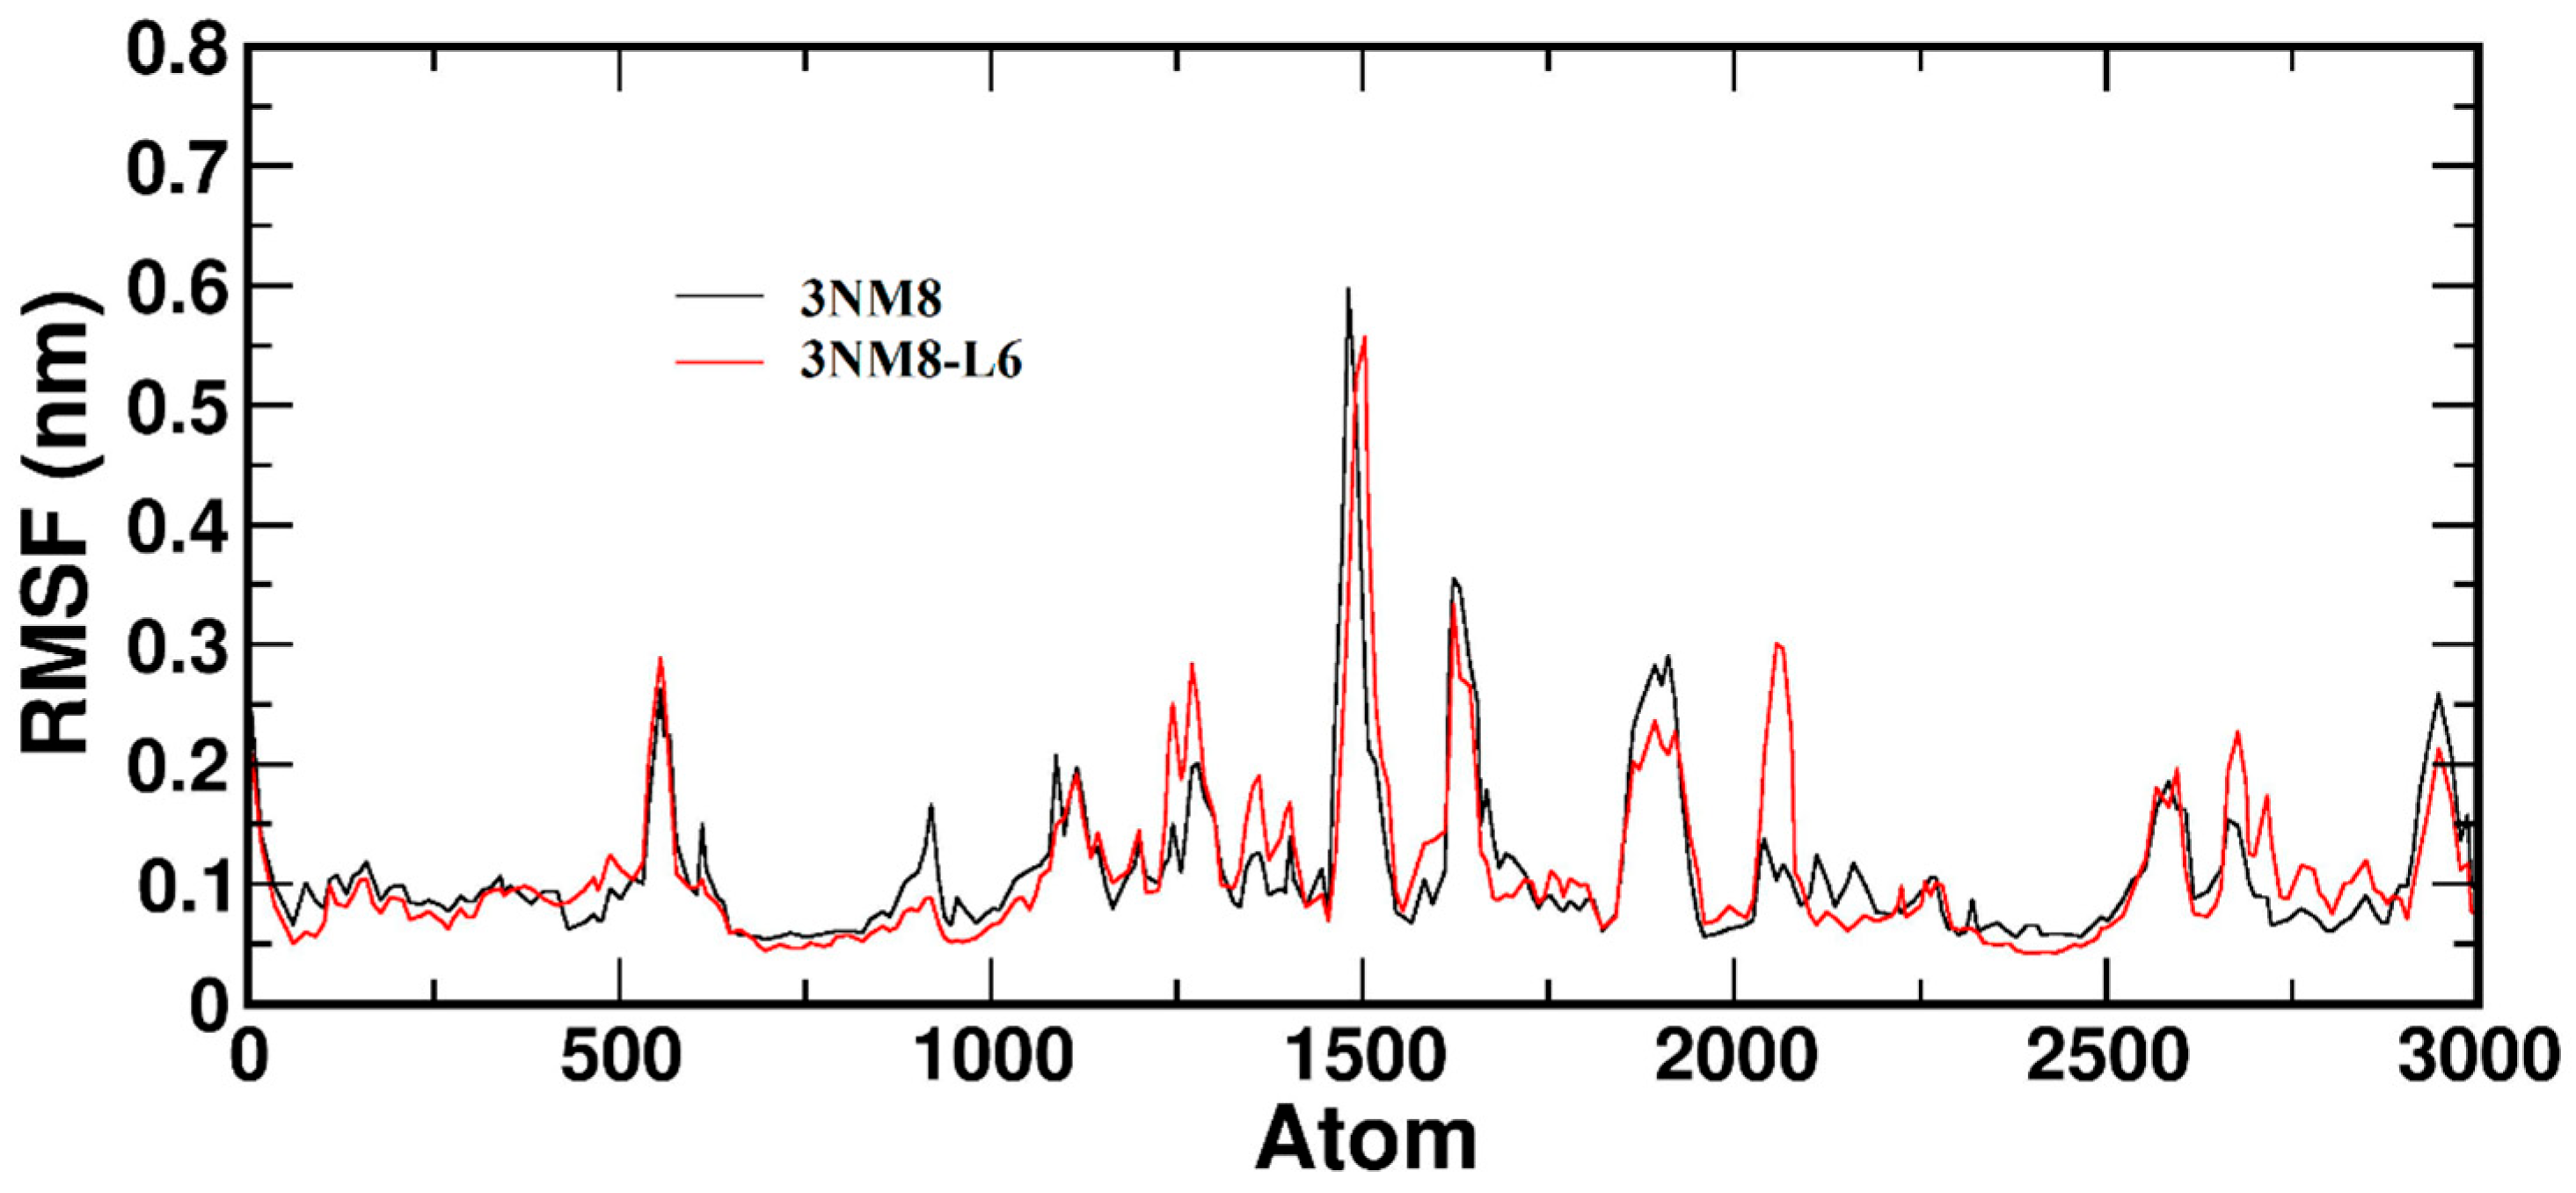
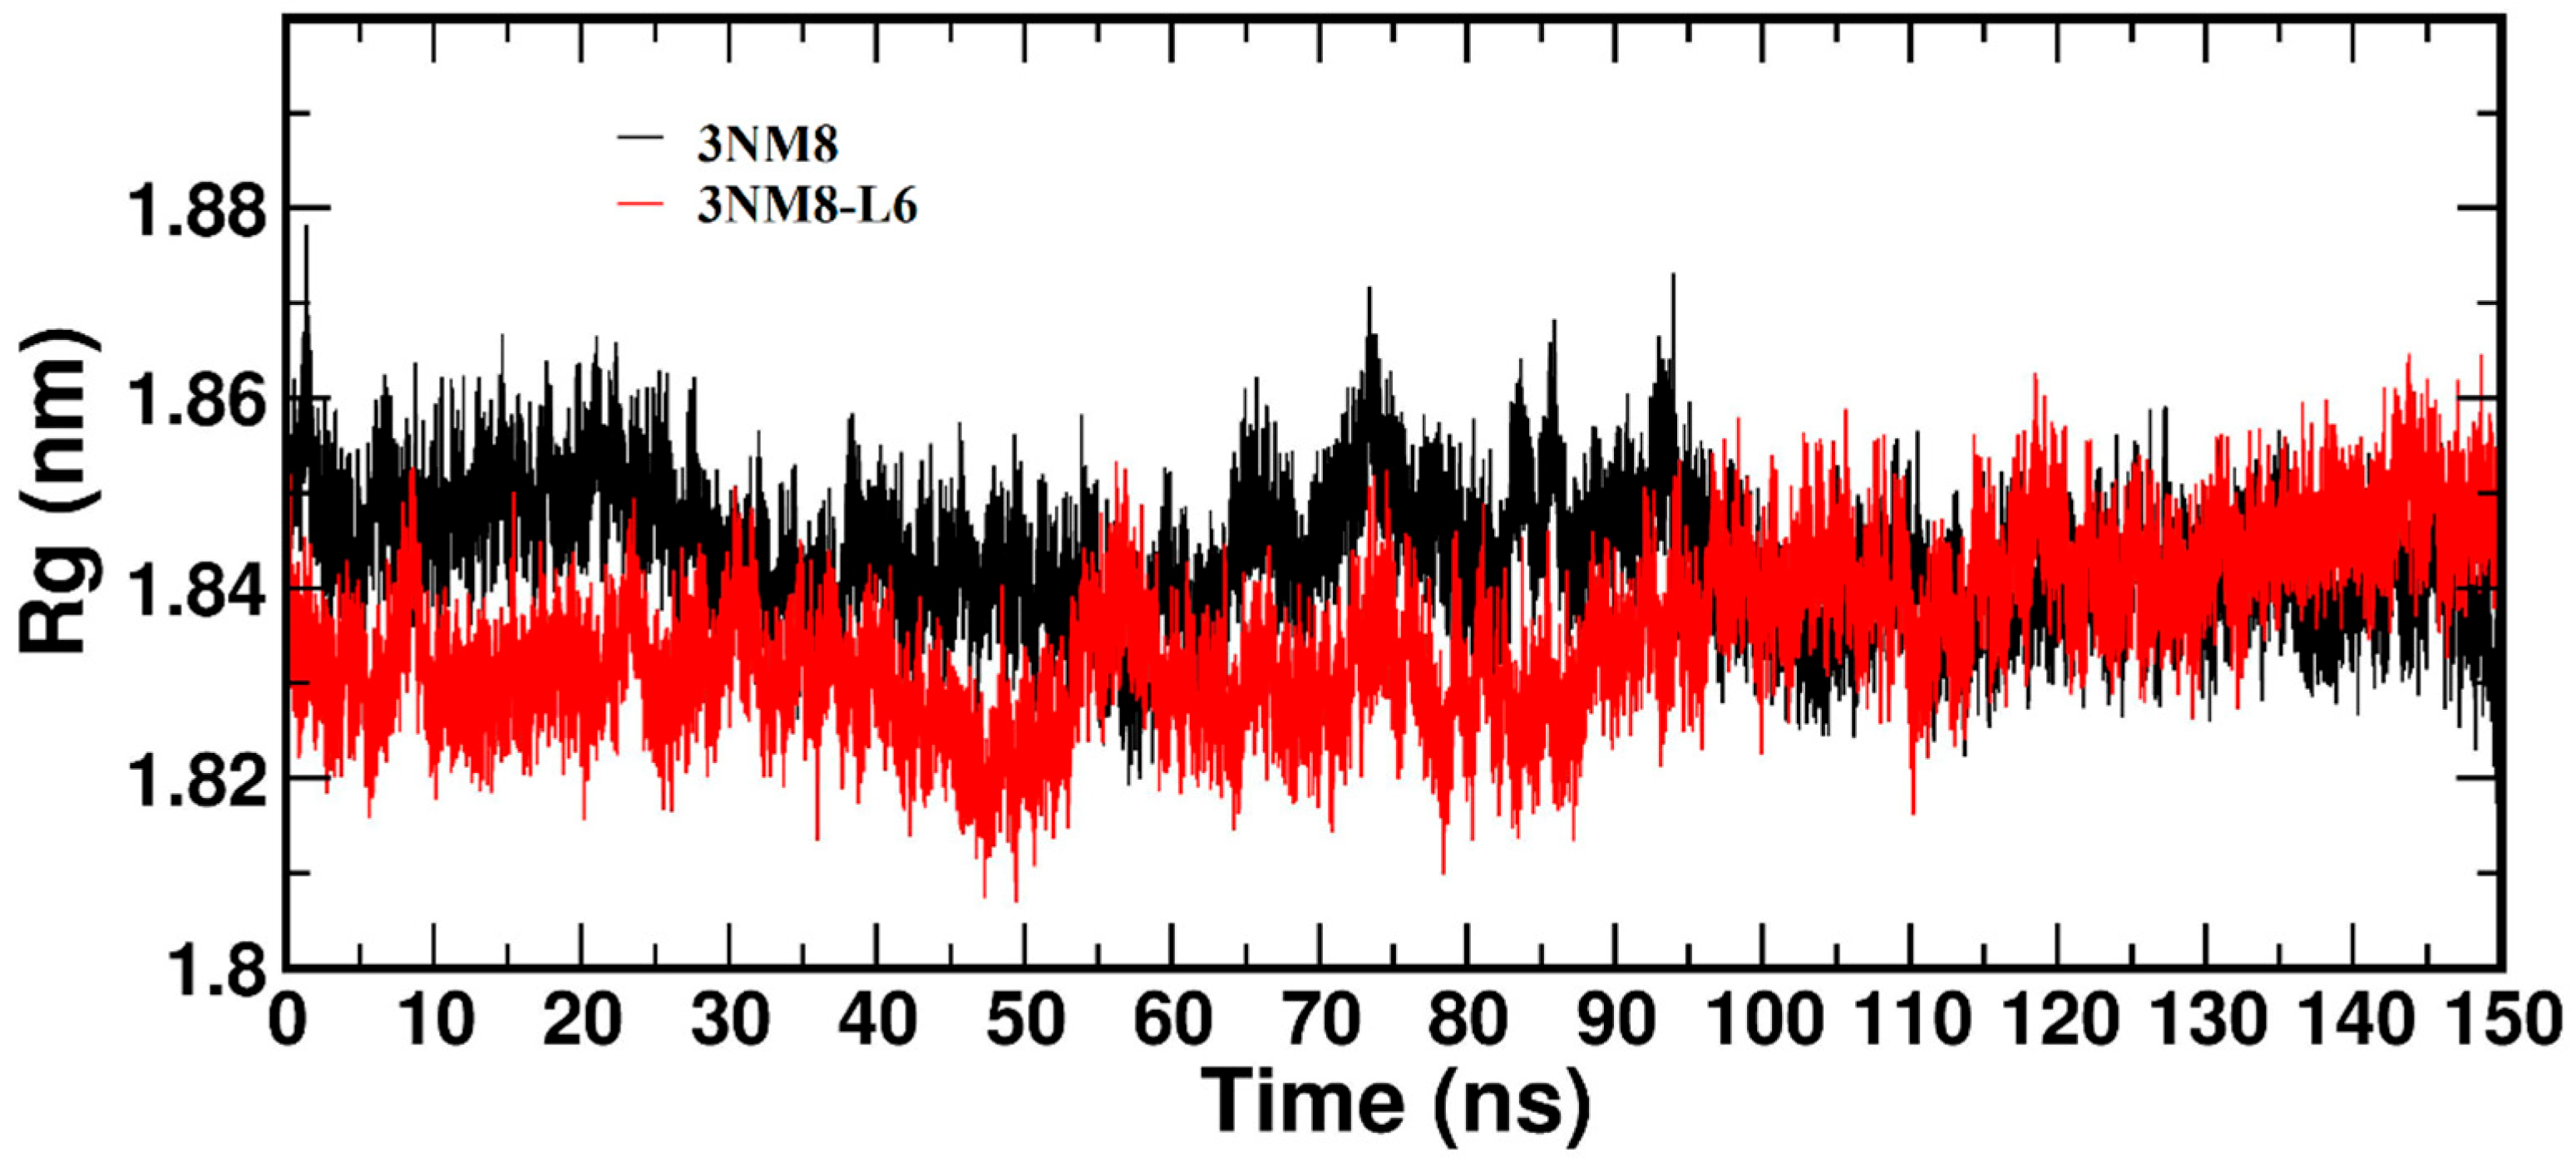
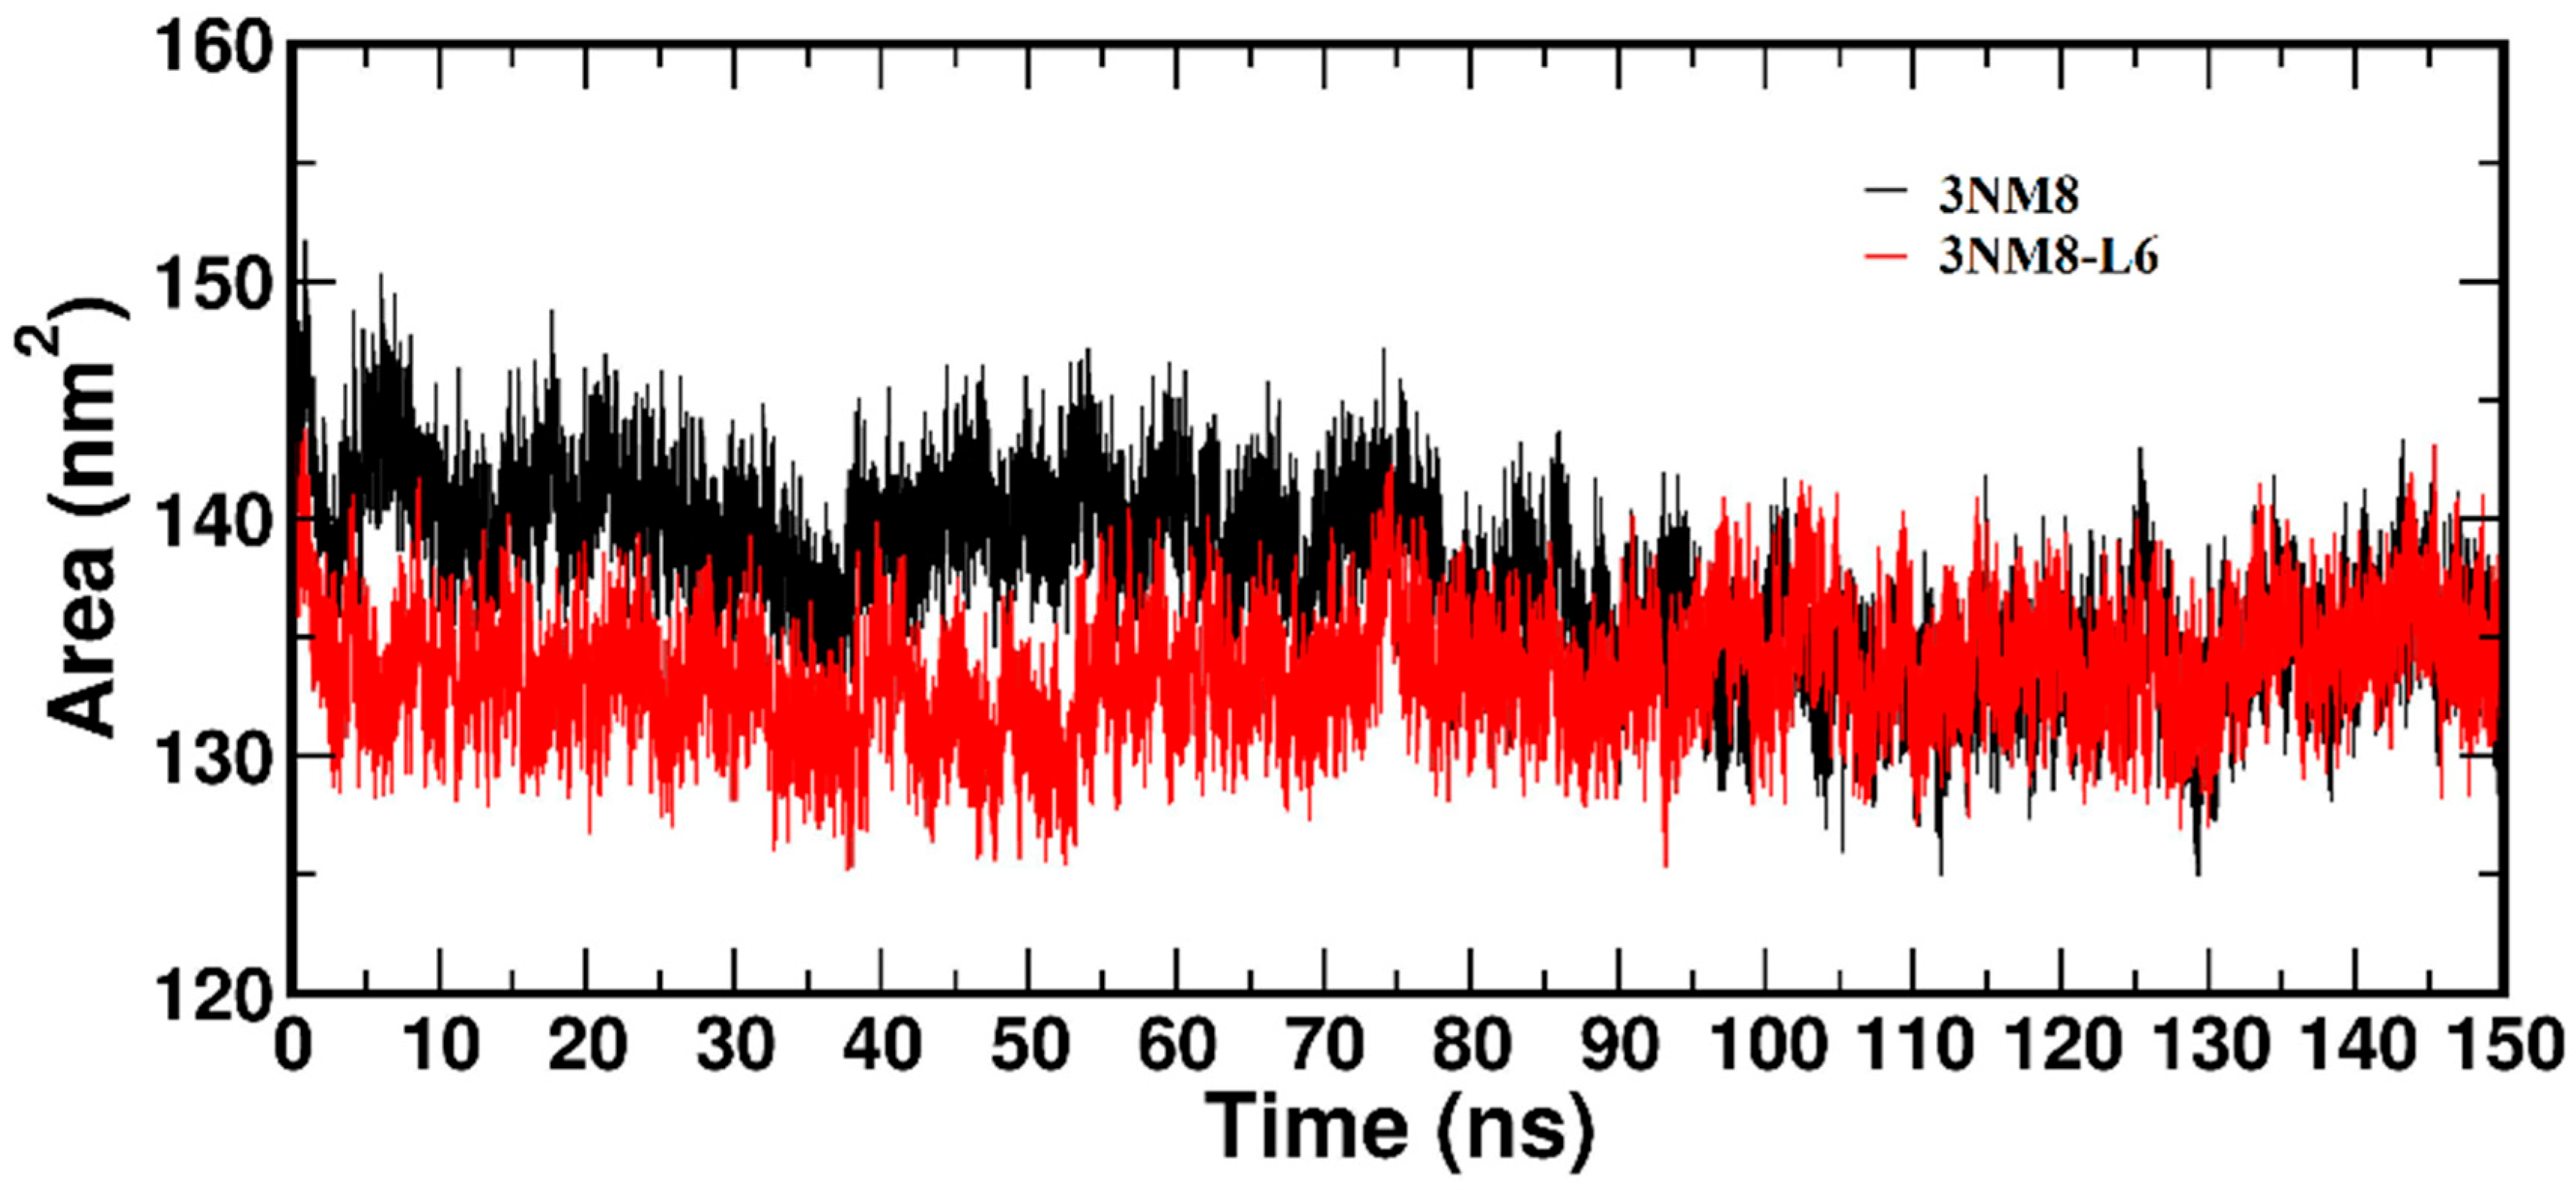
RMSD is a parameter used to estimate conformation differences, giving higher RMSD values for higher deviation. The average RMSD values (0 to 150 ns) obtained for the 3NM8 and 3NM8–L6 complex proteins are 0.21 nm and 0.22 (Figure 8), respectively. These values suggest the relative stability of the 3NM8–L6 complex during the entire simulation [79]. RMSF determines which amino acids of the protein 3NM8 produce large vibrations, destabilizing 3NM8 in the presence and absence of the L6. The RMSF (0 to 150 ns) for 3NM8 and 3NM8–L6 is depicted in Figure 9 [80]. The Rg value determines the compactness of 3NM8 and the folding and unfolding with L6. The average Rg (0 to 150 ns) for 3NM8 and 3NM8–L6 were found to be 1.05 nm [81]. The Rg of 3NM8 and 3NM8–L6 are depicted in Figure 10. SASA influences the flexibility and compactness of the protein 3NM8. To understand the modulation of inhibitors, the changes in the SASA values upon binding with compound L6 was analyzed. The SASA values ranging from 0 to 150 are shown in Figure 11. The changes are negligible in the present case, indicating that the binding of L6 does not affect the surface area of the receptor protein significantly [82]. The 3NM8–L6 complex is stabilized by H-bond formation, which is confirmed by docking and MD analysis, as depicted in Figure 12. MMPBSA gives information regarding the energy required for the L6 to bind to 3NM8 and, in the present study, the van der Waals, electrostatic, polar solvation and binding energies are found to be −107.251 ± 43.640, −11.999 ± 9.586, 58.483 ± 27.579 and −71.450 ± 38.951 kJ/mol, respectively (see Figure 13).

4. Conclusions

In conclusion, this work reports the synthesis and characterization of functional derivatives of edaravone and their copper(II) complexes, along with the assessment of their antioxidant and melanogenic inhibiting activity. This study provides an insight into the correlation of structural features of the new edaravone derivatives and their activities. Molecular structures of the synthesized organic compounds and corresponding copper(II) complexes were determined based on the spectral and analytical characterization methods, including IR, NMR, UV–vis, mass spectrometry and elemental analysis. The antioxidant activity of all of the compounds was evaluated by HPSA, DPPH and ABTS assays. In the HPSA assay, the edaravone-derivative-containing semicarbazone group, i.e., L6, exhibited the highest activity, with IC50 = 7.61 µg.mL−1. Remarkably, the organic compounds were found to be better antioxidants in this assay as compared with the corresponding copper(II) complexes. In the DPPH assay, the organic derivatives L4, L6, and L7 exhibited highest radical scavenging activity (IC50 = 2.94–5.84 µg.mL−1), which is attributed to their proton-donating ability to DPPH. In the ABTS assay, the best of organic compounds L1, L4, L6, and L7 exhibited IC50 values in the range of 38.70–51.88 µg.mL−1, while the corresponding copper(II) complexes showed considerably higher activity, the complex C7, which contains an edaravone–oxime ligand exhibited the finest activity (i.e., IC50 = 18.23 µg.mL−1). Owing to their higher antioxidant activity, all of the organic ligands were subjected to DFT analysis to determine the frontier orbital energy levels as well as important chemical properties, such as band gap, hardness, chemical potential and electrophilicity index. A clear influence of substituents on these properties was observed. The reactive sites on the molecules were identified using MEP plots. Owing to their remarkable antioxidant activities, the potential anti-melanogenic properties of all of the organic compounds was investigated by docking the DFT optimized structures with the protein tyrosinase. All of the compounds exhibited favorable binding energies, indicating their potential use as anti-melanogenic agents. Further, the derivative, L6, which exhibited the best antioxidant activity, was further subjected to molecular dynamics simulation analysis. The MD simulation was performed (150 ns) to estimate the stability of a protein–ligand complex (i.e., 3NM8–L6), and other parameters, such as RMSD, RMSF, Rg, hydrogen-bond interactions, SASA and MMPBSA were analyzed. Overall, this new series of compounds exhibited strong free radical scavenging activity and shown to possibly prevent melanogenesis by strongly binding with tyrosinase protein, indicating their potential application in the production of improved antioxidants and cosmeceuticals.

Supplementary Materials

The following supporting information can be downloaded at: https://www.mdpi.com/article/10.3390/antiox13091148/s1, IR, UV-vis, NMR, and Mass spectroscopic data of the reported compounds and their antioxidant activity results (HPSA, DPPH, and ABTS assays).

Author Contributions

R.D.M.: formal analysis, investigation, data curation, validation, writing original draft. S.A.A.: formal analysis, data curation. N.V.K.: conceptualization, investigation, data curation, funding acquisition, methodology, project administration, resources, supervision, validation, visualization, writing—original draft, writing—review and editing. D.G.B.: formal analysis, data curation. S.P.M.: investigation, data curation, resources, validation, writing—review and editing. I.I.I.: resources, validation, writing—review and editing. J.S.A.-O.: formal analysis, investigation, data curation, validation, resources, writing original draft. Y.S.M.: formal analysis, investigation, data curation, writing original draft. All authors have read and agreed to the published version of the manuscript.

Funding

This research received no external funding.

Institutional Review Board Statement

Not applicable.

Informed Consent Statement

Not applicable.

Data Availability Statement

The original contributions presented in the study are included in the article/Supplementary Materials, further inquiries can be directed to the corresponding author/s.

Acknowledgments

D.M.R. and N.V.K. thank Amrita Vishwa Vidyapeetham, Amritapuri. D.G.B., S.P.M. and I.I.I. thank the Faculty of Chemistry at the “Paisii Hilendarski” University of Plovdiv and J.S.A. thanks Princess Nourah bint Abdulrahman University, Riyadh for the support.

Conflicts of Interest

The authors declare no conflict of interest.

References

  1. Bailly, C.; Hecquet, P.-E.; Kouach, M.; Thuru, X.; Goossens, J.-F. Chemical Reactivity and Uses of 1-Phenyl-3-Methyl-5-Pyrazolone (PMP), Also Known as Edaravone. Bioorganic Med. Chem. 2020, 28, 115463. [Google Scholar] [CrossRef] [PubMed]
  2. Mohan, D.; Kulkarni, N. Recent Developments in the Design of Functional Derivatives of Edaravone and Exploration of Their Antioxidant Activities. Mol. Divers. 2024. [Google Scholar] [CrossRef] [PubMed]
  3. Watanabe, T.; Tahara, M.; Todo, S. The Novel Antioxidant Edaravone: From Bench to Bedside. Cardiovasc. Ther. 2008, 26, 101–114. [Google Scholar] [CrossRef] [PubMed]
  4. Yamashita, T.; Abe, K. Update on Antioxidant Therapy with Edaravone: Expanding Applications in Neurodegenerative Diseases. Int. J. Mol. Sci. 2024, 25, 2945. [Google Scholar] [CrossRef] [PubMed]
  5. Canadian Agency for Drugs and Technologies in Health. Pharmacoeconomic Review Report: Edaravone (Radicava): (Mitsubishi Tanabe Pharma Corporation): Indication: For the treatment of Amyotrophic Lateral Sclerosis (ALS) [Internet]; Canadian Agency for Drugs and Technologies in Health: Ottawa, ON, Canada, 2019. [Google Scholar] [PubMed]
  6. Nourelden, A.Z.; Kamal, I.; Hagrass, A.I.; Tawfik, A.G.; Elhady, M.M.; Fathallah, A.H.; Eshag, M.M.E.; Zaazouee, M.S. Safety and Efficacy of Edaravone in Patients with Amyotrophic Lateral Sclerosis: A Systematic Review and Meta-Analysis. Neurol. Sci. 2023, 44, 3429–3442. [Google Scholar] [CrossRef] [PubMed]
  7. Cho, H.; Shukla, S. Role of Edaravone as a Treatment Option for Patients with Amyotrophic Lateral Sclerosis. Pharmaceuticals 2020, 14, 29. [Google Scholar] [CrossRef] [PubMed]
  8. Bailly, C. Potential Use of Edaravone to Reduce Specific Side Effects of Chemo-, Radio- and Immuno-Therapy of Cancers. Int. Immunopharmacol. 2019, 77, 105967. [Google Scholar] [CrossRef]
  9. Cha, S.J.; Kim, K. Effects of the Edaravone, a Drug Approved for the Treatment of Amyotrophic Lateral Sclerosis, on Mitochondrial Function and Neuroprotection. Antioxidants 2022, 11, 195. [Google Scholar] [CrossRef]
  10. Chen, C.; Li, M.; Lin, L.; Chen, S.; Chen, Y.; Hong, L. Clinical Effects and Safety of Edaravone in Treatment of Acute Ischaemic Stroke: A Meta-analysis of Randomized Controlled Trials. J. Clin. Pharm. Ther. 2021, 46, 907–917. [Google Scholar] [CrossRef]
  11. Jayasinghe, M.; Jena, R.; Singhal, M.; Jain, S.; Karnakoti, S.; Silva, M.S.; Kayani, A.M.A. Ethnical Disparities in Response to Edaravone in Patients With Amyotrophic Lateral Sclerosis. Curēus 2022, 14, e25960. [Google Scholar] [CrossRef]
  12. Rahim, M.; Madi, F.; Nouar, L.; Haiahem, S.; Fateh, D.; Khatmi, D. β-Cyclodextrin Interaction with Edaravone: Molecular Modeling Study. In Advances in Quantum Chemistry; Academic Press: Cambridge, MA, USA, 2014; pp. 269–278. [Google Scholar]
  13. Pérez-González, A.; Galano, A. On the Outstanding Antioxidant Capacity of Edaravone Derivatives through Single Electron Transfer Reactions. J. Phys. Chem. B 2012, 116, 1180–1188. [Google Scholar] [CrossRef] [PubMed]
  14. Barajas-Carrillo, V.W.; Estolano-Cobián, A.; Díaz-Rubio, L.; Ayllón-Gutiérrez, R.R.; Salazar-Aranda, R.; Díaz-Molina, R.; García-González, V.; Almanza-Reyes, H.; Rivero, I.A.; Marrero, J.G.; et al. Antioxidant and Acetylcholinesterase Inhibition Activity of Aliphatic and Aromatic Edaravone Derivatives. Med. Chem. Res. 2020, 30, 610–623. [Google Scholar] [CrossRef]
  15. Minnelli, C.; Laudadio, E.; Galeazzi, R.; Rusciano, D.; Armeni, T.; Stipa, P.; Cantarini, M.; Mobbili, G. Synthesis, Characterization and Antioxidant Properties of a New Lipophilic Derivative of Edaravone. Antioxidants 2019, 8, 258. [Google Scholar] [CrossRef] [PubMed]
  16. Polkam, N.; Ramaswamy, V.R.; Rayam, P.; Allaka, T.R.; Anantaraju, H.S.; Dharmarajan, S.; Perumal, Y.; Gandamalla, D.; Yellu, N.R.; Balasubramanian, S.; et al. Synthesis, Molecular Properties Prediction and Anticancer, Antioxidant Evaluation of New Edaravone Derivatives. Bioorganic Med. Chem. Lett. 2016, 26, 2562–2568. [Google Scholar] [CrossRef] [PubMed]
  17. Mustafa, G.; Zia-Ur-Rehman, M.; Sumrra, S.H.; Ashfaq, M.; Zafar, W.; Ashfaq, M. A Critical Review on Recent Trends on Pharmacological Applications of Pyrazolone Endowed Derivatives. J. Mol. Struct. 2022, 1262, 133044. [Google Scholar] [CrossRef]
  18. Minnelli, C.; Laudadio, E.; Fiorini, R.; Galeazzi, R.; Armeni, T.; Stipa, P.; Rusciano, D.; Mobbili, G. Influence of a Lipophilic Edaravone on Physical State and Activity of Antioxidant Liposomes: An Experimental and in Silico Study. Colloids Surf. B Biointerfaces 2022, 210, 112217. [Google Scholar] [CrossRef]
  19. Laudadio, E.; Minnelli, C.; Mobbili, G.; Sabbatini, G.; Stipa, P.; Rusciano, D.; Galeazzi, R. Salt Effects on Mixed Composition Membranes Containing an Antioxidant Lipophilic Edaravone Derivative: A Computational-Experimental Study. Org. Biomol. Chem. 2022, 20, 5784–5795. [Google Scholar] [CrossRef]
  20. Sheng, X.; Hua, K.; Yang, C.; Wang, X.; Ji, H.; Xu, J.; Huang, Z.; Zhang, Y. Novel Hybrids of 3-n-Butylphthalide and Edaravone: Design, Synthesis and Evaluations as Potential Anti-Ischemic Stroke Agents. Bioorganic Med. Chem. Lett. 2015, 25, 3535–3540. [Google Scholar] [CrossRef]
  21. Li, X.; Wang, X.; Miao, L.; Guo, Y.; Yuan, R.; Tian, H. Design, Synthesis, and Neuroprotective Effects of Novel Hybrid Compounds Containing Edaravone Analogue and 3-n-Butylphthalide Ring-Opened Derivatives. Biochem. Biophys. Res. Commun. 2021, 556, 99–105. [Google Scholar] [CrossRef]
  22. Qiang, X.; Li, Y.; Yang, X.; Luo, L.; Xu, R.; Zheng, Y.; Cao, Z.; Tan, Z.; Deng, Y. DL -3- n -Butylphthalide-Edaravone Hybrids as Novel Dual Inhibitors of Amyloid- β Aggregation and Monoamine Oxidases with High Antioxidant Potency for Alzheimer’s Therapy. Bioorganic Med. Chem. Lett. 2017, 27, 718–722. [Google Scholar] [CrossRef]
  23. Hua, K.; Sheng, X.; Li, T.-T.; Wang, L.-N.; Zhang, Y.-H.; Huang, Z.-J.; Ji, H. The Edaravone and 3-n-Butylphthalide Ring-Opening Derivative 10b Effectively Attenuates Cerebral Ischemia Injury in Rats. Acta Pharmacol. Sin. 2015, 36, 917–927. [Google Scholar] [CrossRef] [PubMed]
  24. Jia, J.; Wu, J.; Ji, D.; Jiao, W.; Wang, X.; Huang, Z.; Zhang, Y. Synthesis and Biological Evaluation of Hybrids from Optically Active Ring-Opened 3-N-Butylphthalide Derivatives and 4-Fluro-Edaravone as Potential Anti-Acute Ischemic Stroke Agents. Bioorganic Med. Chem. 2022, 69, 116891. [Google Scholar] [CrossRef] [PubMed]
  25. Qian, Y.; Lyu, Y.; Jiang, M.; Tang, B.; Nie, T.; Lu, S. Human Urinary Kallidinogenase or Edaravone Combined with Butylphthalide in the Treatment of Acute Ischemic Stroke. Brain Behav. 2019, 9, e01438. [Google Scholar] [CrossRef] [PubMed]
  26. Guan, Y.; Li, P.; Liu, Y.; Guo, L.; Wu, Q.; Cheng, Y. Protective Multi-target Effects of DL-3-n-butylphthalide Combined with 3-methyl-1-phenyl-2-pyrazolin-5-one in Mice with Ischemic Stroke. Mol. Med. Rep. 2021, 24, 1–13. [Google Scholar] [CrossRef] [PubMed]
  27. Lapshina, M.A.; Shevtsova, E.F.; Grigoriev, V.V.; Aksinenko, A.Y.; Ustyugov, A.A.; Steinberg, D.A.; Maleev, G.V.; Dubrovskaya, E.S.; Goreva, T.V.; Epishina, T.A.; et al. New Adamantane-Containing Edaravone Conjugates as Potential Neuroprotective Agents for ALS Treatments. Molecules 2023, 28, 7567. [Google Scholar] [CrossRef]
  28. Zondagh, L.S.; Malan, S.F.; Joubert, J. Design, Synthesis and Biological Evaluation of Edaravone Derivatives Bearing the N-Benzyl Pyridinium Moiety as Multifunctional Anti-Alzheimer’s Agents. J. Enzym. Inhib. Med. Chem. 2020, 35, 1596–1605. [Google Scholar] [CrossRef]
  29. Thawabteh, A.M.; Jibreen, A.; Karaman, D.; Thawabteh, A.; Karaman, R. Skin Pigmentation Types, Causes and Treatment—A Review. Molecules 2023, 28, 4839. [Google Scholar] [CrossRef]
  30. Pillaiyar, T.; Namasivayam, V.; Manickam, M.; Jung, S.-H. Inhibitors of Melanogenesis: An Updated Review. J. Med. Chem. 2018, 61, 7395–7418. [Google Scholar] [CrossRef]
  31. Maddaleno, A.S.; Camargo, J.; Mitjans, M.; Vinardell, M.P. Melanogenesis and Melasma Treatment. Cosmetics 2021, 8, 82. [Google Scholar] [CrossRef]
  32. Gillbro, J.M.; Olsson, M.J. The Melanogenesis and Mechanisms of Skin-lightening Agents—Existing and New Approaches. Int. J. Cosmet. Sci. 2011, 33, 210–221. [Google Scholar] [CrossRef]
  33. Kao, Y.-Y.; Chuang, T.-F.; Chao, S.-H.; Yang, J.-H.; Lin, Y.-C.; Huang, H.-Y. Evaluation of the Antioxidant and Melanogenesis Inhibitory Properties of Pracparatum Mungo (Lu-Do Huang). J. Tradit. Complement. Med. 2013, 3, 163–170. [Google Scholar] [CrossRef] [PubMed]
  34. Mermer, A.; Demirci, S. Recent Advances in Triazoles as Tyrosinase Inhibitors. Eur. J. Med. Chem. 2023, 259, 115655. [Google Scholar] [CrossRef] [PubMed]
  35. Denat, L.; Kadekaro, A.L.; Marrot, L.; Leachman, S.A.; Abdel-Malek, Z.A. Melanocytes as Instigators and Victims of Oxidative Stress. J. Investig. Dermatol. 2014, 134, 1512–1518. [Google Scholar] [CrossRef] [PubMed]
  36. Upadhyay, P.R.; Starner, R.J.; Swope, V.B.; Wakamatsu, K.; Ito, S.; Abdel-Malek, Z.A. Differential Induction of Reactive Oxygen Species and Expression of Antioxidant Enzymes in Human Melanocytes Correlate with Melanin Content: Implications on the Response to Solar UV and Melanoma Susceptibility. Antioxidants 2022, 11, 1204. [Google Scholar] [CrossRef] [PubMed]
  37. Snyman, M.; Walsdorf, R.E.; Wix, S.N.; Gill, J.G. The Metabolism of Melanin Synthesis—From Melanocytes to Melanoma. Pigment. Cell Melanoma Res. 2024, 37, 438–452. [Google Scholar] [CrossRef] [PubMed]
  38. Samsonowicz, M.; Kalinowska, M.; Gryko, K. Enhanced Antioxidant Activity of Ursolic Acid by Complexation with Copper (II): Experimental and Theoretical Study. Materials 2021, 14, 264. [Google Scholar] [CrossRef]
  39. Hamadouche, S.; Merouani, H.; May, A.A.; Ouddai, N.; Alam, M.; Micoli, L.; Erto, A.; Benguerba, Y. Theoretical Exploration of Enhanced Antioxidant Activity in Copper Complexes of Tetrahydroxystilbenes: Insights into Mechanisms and Molecular Interactions. ACS Omega 2024, 9, 9076–9089. [Google Scholar] [CrossRef]
  40. Rodríguez-Arce, E.; Saldías, M. Antioxidant Properties of Flavonoid Metal Complexes and Their Potential Inclusion in the Development of Novel Strategies for the Treatment against Neurodegenerative Diseases. Biomed. Pharmacother. 2021, 143, 112236. [Google Scholar] [CrossRef]
  41. El-Lateef, H.M.A.; El-Dabea, T.; Khalaf, M.M.; Abu-Dief, A.M. Recent Overview of Potent Antioxidant Activity of Coordination Compounds. Antioxidants 2023, 12, 213. [Google Scholar] [CrossRef]
  42. Williams, D.B.G.; Lawton, M. Drying of Organic Solvents: Quantitative Evaluation of the Efficiency of Several Desiccants. J. Org. Chem. 2010, 75, 8351–8354. [Google Scholar] [CrossRef]
  43. Vogel, A.I. A Textbook of Quantitative Inorganic Analysis; John Wiley & Sons Inc.: New York, NY, USA, 1966. [Google Scholar]
  44. Ruch, R.J.; Cheng, S.-J.; Klaunig, J.E. Prevention of Cytotoxicity and Inhibition of Intercellular Communication by Antioxidant Catechins Isolated from Chinese Green Tea. Carcinogenesis 1989, 10, 1003–1008. [Google Scholar] [CrossRef] [PubMed]
  45. Manolov, S.; Ivanov, I.; Bojilov, D. Synthesis of New 1,2,3,4-Tetrahydroquinoline Hybrid of Ibuprofen and Its Biological Evaluation. Molbank 2022, 2022, M1350. [Google Scholar] [CrossRef]
  46. Docheva, M.; Dagnon, S.; Statkova-Abeghe, S. Flavonoid Content and Radical Scavenging Potential of Extracts Prepared from Tobacco Cultivars and Waste. Nat. Prod. Res. 2014, 28, 1328–1334. [Google Scholar] [CrossRef] [PubMed]
  47. Re, R.; Pellegrini, N.; Proteggente, A.; Pannala, A.; Yang, M.; Rice-Evans, C. Antioxidant Activity Applying an Improved ABTS Radical Cation Decolorization Assay. Free. Radic. Biol. Med. 1999, 26, 1231–1237. [Google Scholar] [CrossRef]
  48. Frisch, M.J.; Trucks, G.W.; Schlegel, H.B.; Scuseria, G.E.; Robb, M.A.; Cheeseman, J.R.; Scalmani, G.; Barone, V.; Petersson, G.A.; Nakatsuji, H.; et al. Gaussian 16, Revision A.03; Gaussian, Inc.: Wallingford, CT, USA, 2016. [Google Scholar]
  49. Dennington, R.; Keith, T.A.; Millam, J.M. GaussView, Version 6.1; Semichem Inc.: Shawnee Mission, KS, USA, 2016. [Google Scholar]
  50. Ullah, Z.; Sattar, F.; Kim, H.J.; Jang, S.; Mary, Y.S.; Zhan, X.; Kwon, H.W. Computational Study of Pd–Cd Bimetallic Crystals: Spectroscopic Properties, Hirshfeld Surface Analysis, Non-Covalent Interaction, and Sensor Activity. J. Mol. Liq. 2022, 365, 120111. [Google Scholar] [CrossRef]
  51. Trott, O.; Olson, A.J. AutoDock Vina: Improving the Speed and Accuracy of Docking with a New Scoring Function, Efficient Optimization, and Multithreading. J. Comput. Chem. 2009, 31, 455–461. [Google Scholar] [CrossRef]
  52. Sendovski, M.; Kanteev, M.; Ben-Yosef, V.S.; Adir, N.; Fishman, A. First Structures of an Active Bacterial Tyrosinase Reveal Copper Plasticity. J. Mol. Biol. 2011, 405, 227–237. [Google Scholar] [CrossRef]
  53. Schüttelkopf, A.W.; Van Aalten, D.M.F. PRODRG: A Tool for High-Throughput Crystallography of Protein–Ligand Complexes. Acta Crystallogr. Sect. D Biol. Crystallogr. 2004, 60, 1355–1363. [Google Scholar] [CrossRef]
  54. Mary, Y.S.; Mary, Y.S.; Rad, A.S.; Yadav, R.; Celik, I.; Sarala, S. Theoretical Investigation on the Reactive and Interaction Properties of Sorafenib—DFT, AIM, Spectroscopic and Hirshfeld Analysis, Docking and Dynamics Simulation. J. Mol. Liq. 2021, 330, 115652. [Google Scholar] [CrossRef]
  55. Prasanth, D.S.N.B.K.; Murahari, M.; Chandramohan, V.; Panda, S.P.; Atmakuri, L.R.; Guntupalli, C. In Silicoidentification of Potential Inhibitors fromCinnamonagainst Main Protease and Spike Glycoprotein of SARS CoV-2. J. Biomol. Struct. Dyn. 2020, 39, 4618–4632. [Google Scholar] [CrossRef]
  56. Kumari, R.; Kumar, R.; Lynn, A. G_mmpbsa—A GROMACS Tool for High-Throughput MM-PBSA Calculations. J. Chem. Inf. Model. 2014, 54, 1951–1962. [Google Scholar] [CrossRef] [PubMed]
  57. Nakum, K.; Jadeja, R.N. Synthesis, Characterization, and Electrochemical Study of a Mononuclear Cu(II) Complex with a 4-Acyl Pyrazolone Ligand. Z. Für Naturforschung B 2018, 73, 713–718. [Google Scholar] [CrossRef]
  58. Patel, J.D.; Shah, P.J. Synthesis, Characterization of Some Metal Complexes of 4-Acetylsemicarbazone-1-Phenyl-3-Methyl-2-Pyrazolin-5-One. Asian J. Chem. 2010, 22, 3069–3075. [Google Scholar]
  59. Mao, X.; Ni, J.; Xu, B.; Ding, C. K2S2O8-Promoted Direct Thiocyanation of Pyrazolin-5-Ones with Ammonium Thiocyanate at Room Temperature. Org. Chem. Front. 2020, 7, 350–354. [Google Scholar] [CrossRef]
  60. Prajuli, R.; Banerjee, J.; Khanal, H. Synthesis of Some Pyrazolone Derivatives and Evaluation of Its Antibacterial and Cytotoxic Activity. Orient. J. Chem. 2015, 31, 2099–2106. [Google Scholar] [CrossRef]
  61. Reshma, G.; Padmanabhan, V.; Varma, A.R.; Gouri; Nair, U.R.; Parvathy, P.B.; Kulkarni, N.V.; Senthurpandi, D. Synthesis and Structure of Mono and Bis {1,3-Bis(2- Pyridylimino)Isoindoline} Supported 3d Transition Metal Complexes. J. Mol. Struct. 2021, 1226, 129344. [Google Scholar] [CrossRef]
  62. Hegde, V.; Sreekala, C.O.; Kulkarni, N.V.; Senthurpandi, D.; Mathew, J. Synthesis and Characterization of a Series of Cobalt Complexes: Investigation of Their Efficacy as Sensitizers in Dye-Sensitized Solar Cell Applications. J. Mol. Struct. 2022, 1266, 133512. [Google Scholar] [CrossRef]
  63. Swathy, S.; Chandran, H.; Reshma, G.; Nakul, S.; Kumar, M.; Krishnan, M.A.; Kulkarni, N.V.; Senthurpandi, D.; Contractor, S.S.; Arakera, S.B. First Row Transition Metal Complexes of Bis(3,5-Dimethyl Pyrazolyl)Methane: Synthesis, Molecular Structure and Antibacterial Properties. J. Mol. Struct. 2022, 1251, 132018. [Google Scholar] [CrossRef]
  64. Hegde, V.; Sreekala, C.O.; Kulkarni, N.V.; Mathew, J. Bis(Pyrazolyl)Methane Supported Cobalt (II) Complexes as Sensitizers in Dye-Sensitized Solar Cells. J. Photochem. Photobiology. A Chem. 2024, 449, 115389. [Google Scholar] [CrossRef]
  65. Kulkarni, N.V.; Revankar, V.K.; Kirasur, B.N.; Hugar, M.H. Transition Metal Complexes of Thiosemicarbazones with Quinoxaline Hub: An Emphasis on Antidiabetic Property. Med. Chem. Res. 2011, 21, 663–671. [Google Scholar] [CrossRef]
  66. Kulkarni, N.V.; Kamath, A.; Budagumpi, S.; Revankar, V.K. Pyrazole Bridged Binuclear Transition Metal Complexes: Synthesis, Characterization, Antimicrobial Activity and DNA Binding/Cleavage Studies. J. Mol. Struct. 2011, 1006, 580–588. [Google Scholar] [CrossRef]
  67. Chalana, A.; Rai, R.K.; Karri, R.; Jha, K.K.; Kumar, B.; Roy, G. Interplay of the Intermolecular and Intramolecular Interactions in Stabilizing the Thione-Based Copper(I) Complexes and Their Significance in Protecting the Biomolecules against Metal-Mediated Oxidative Damage. Polyhedron 2022, 215, 115647. [Google Scholar] [CrossRef]
  68. Galano, A.; Macías-Ruvalcaba, N.A.; Campos, O.N.M.; Pedraza-Chaverri, J. Mechanism of the OH Radical Scavenging Activity of Nordihydroguaiaretic Acid: A Combined Theoretical and Experimental Study. J. Phys. Chem. B 2010, 114, 6625–6635. [Google Scholar] [CrossRef] [PubMed]
  69. Prior, R.L.; Wu, X.; Schaich, K. Standardized Methods for the Determination of Antioxidant Capacity and Phenolics in Foods and Dietary Supplements. J. Agric. Food Chem. 2005, 53, 4290–4302. [Google Scholar] [CrossRef] [PubMed]
  70. Jiménez, A.; Selga, A.; Torres, J.L.; Julià, L. Reducing Activity of Polyphenols with Stable Radicals of the TTM Series. Electron Transfer versus H-Abstraction Reactions in Flavan-3-Ols. Org. Lett. 2004, 6, 4583–4586. [Google Scholar] [CrossRef]
  71. Halliwell, B.; Gutteridge, J.M. Free Radicals in Biology and Medicine; Oxford University Press: Cary, NC, USA, 1985. [Google Scholar]
  72. Ravichandran, H.; Sivalingam, S.; Elumalai; Pramodh, A. Characterization of in Vitro Antioxidant Potential ofAzadirachta Indica and Abutilon Indicum by Different Assay Methods. J. Pharm. Res. 2012, 5, 3227–3231. [Google Scholar]
  73. Cano, A.; Maestre, A.B.; Hernández-Ruiz, J.; Arnao, M.B. ABTS/TAC Methodology: Main Milestones and Recent Applications. Processes 2023, 11, 185. [Google Scholar] [CrossRef]
  74. Roy, D.R.; Parthasarathi, R.; Padmanabhan, J.; Sarkar, U.; Subramanian, V.; Chattaraj, P.K. Careful Scrutiny of the Philicity Concept. J. Phys. Chem. A 2006, 110, 1084–1093. [Google Scholar] [CrossRef]
  75. Morris, G.M.; Huey, R.; Lindstrom, W.; Sanner, M.F.; Belew, R.K.; Goodsell, D.S.; Olson, A.J. AutoDock4 and AutoDockTools4: Automated Docking with Selective Receptor Flexibility. J. Comput. Chem. 2009, 30, 2785–2791. [Google Scholar] [CrossRef]
  76. Daina, A.; Michielin, O.; Zoete, V. iLOGP: A Simple, Robust, and Efficient Description of n-Octanol/Water Partition Coefficient for Drug Design Using the GB/SA Approach. J. Chem. Inf. Model. 2014, 54, 3284–3301. [Google Scholar] [CrossRef]
  77. Zolghadri, S.; Bahrami, A.; Khan, M.T.H.; Munoz-Munoz, J.; Garcia-Molina, F.; Garcia-Canovas, F.; Saboury, A.A. A Comprehensive Review on Tyrosinase Inhibitors. J. Enzym. Inhib. Med. Chem. 2019, 34, 279–309. [Google Scholar] [CrossRef] [PubMed]
  78. Balaguer, A.; Chisvert, A.; Salvador, A. Environmentally Friendly LC for the Simultaneous Determination of Ascorbic Acid and Its Derivatives in Skin-whitening Cosmetics. J. Sep. Sci. 2008, 31, 229–236. [Google Scholar] [CrossRef] [PubMed]
  79. Al-Otaibi, J.S.; Mary, Y.S.; Mary, S.; Trivedi, R.; Chakraborty, B.; Yadav, R.; Celik, I.; Soman, S. DFT and MD Investigations of the Biomolecules of Phenothiazine Derivatives: Interactions with Gold and Water Molecules and Investigations in Search of Effective Drug for SARS-CoV-2. J. Biomol. Struct. Dyn. 2022, 41, 4522–4533. [Google Scholar] [CrossRef] [PubMed]
  80. Al-Otaibi, J.S.; Mary, Y.S.; Mary, Y.S.; Yadav, R. Structural and Reactivity Studies of Pravadoline –An Ionic Liquid, with Reference to Its Wavefunction-Relative Properties Using DFT and MD Simulation. J. Mol. Struct. 2021, 1245, 131074. [Google Scholar] [CrossRef]
  81. Mary, Y.S.; Mary, Y.S.; Armaković, S.; Armaković, S.J.; Yadav, R.; Celik, I.; Mane, P.; Chakraborty, B. Stability and Reactivity Study of Bio-Molecules Brucine and Colchicine towards Electrophile and Nucleophile Attacks: Insight from DFT and MD Simulations. J. Mol. Liq. 2021, 335, 116192. [Google Scholar] [CrossRef]
  82. Smitha, M.; Mary, Y.S.; Mary, Y.S.; Serdaroglu, G.; Chowdhury, P.; Rana, M.; Umamahesvari, H.; Sarojini, B.K.; Mohan, B.J.; Pavithran, R. Modeling the DFT Structural and Reactivity Studies of a Pyrimidine -6-Carboxylate Derivative with Reference to Its Wavefunction-Dependent, MD Simulations and Evaluation for Potential Antimicrobial Activity. J. Mol. Struct. 2021, 1237, 130397. [Google Scholar] [CrossRef]
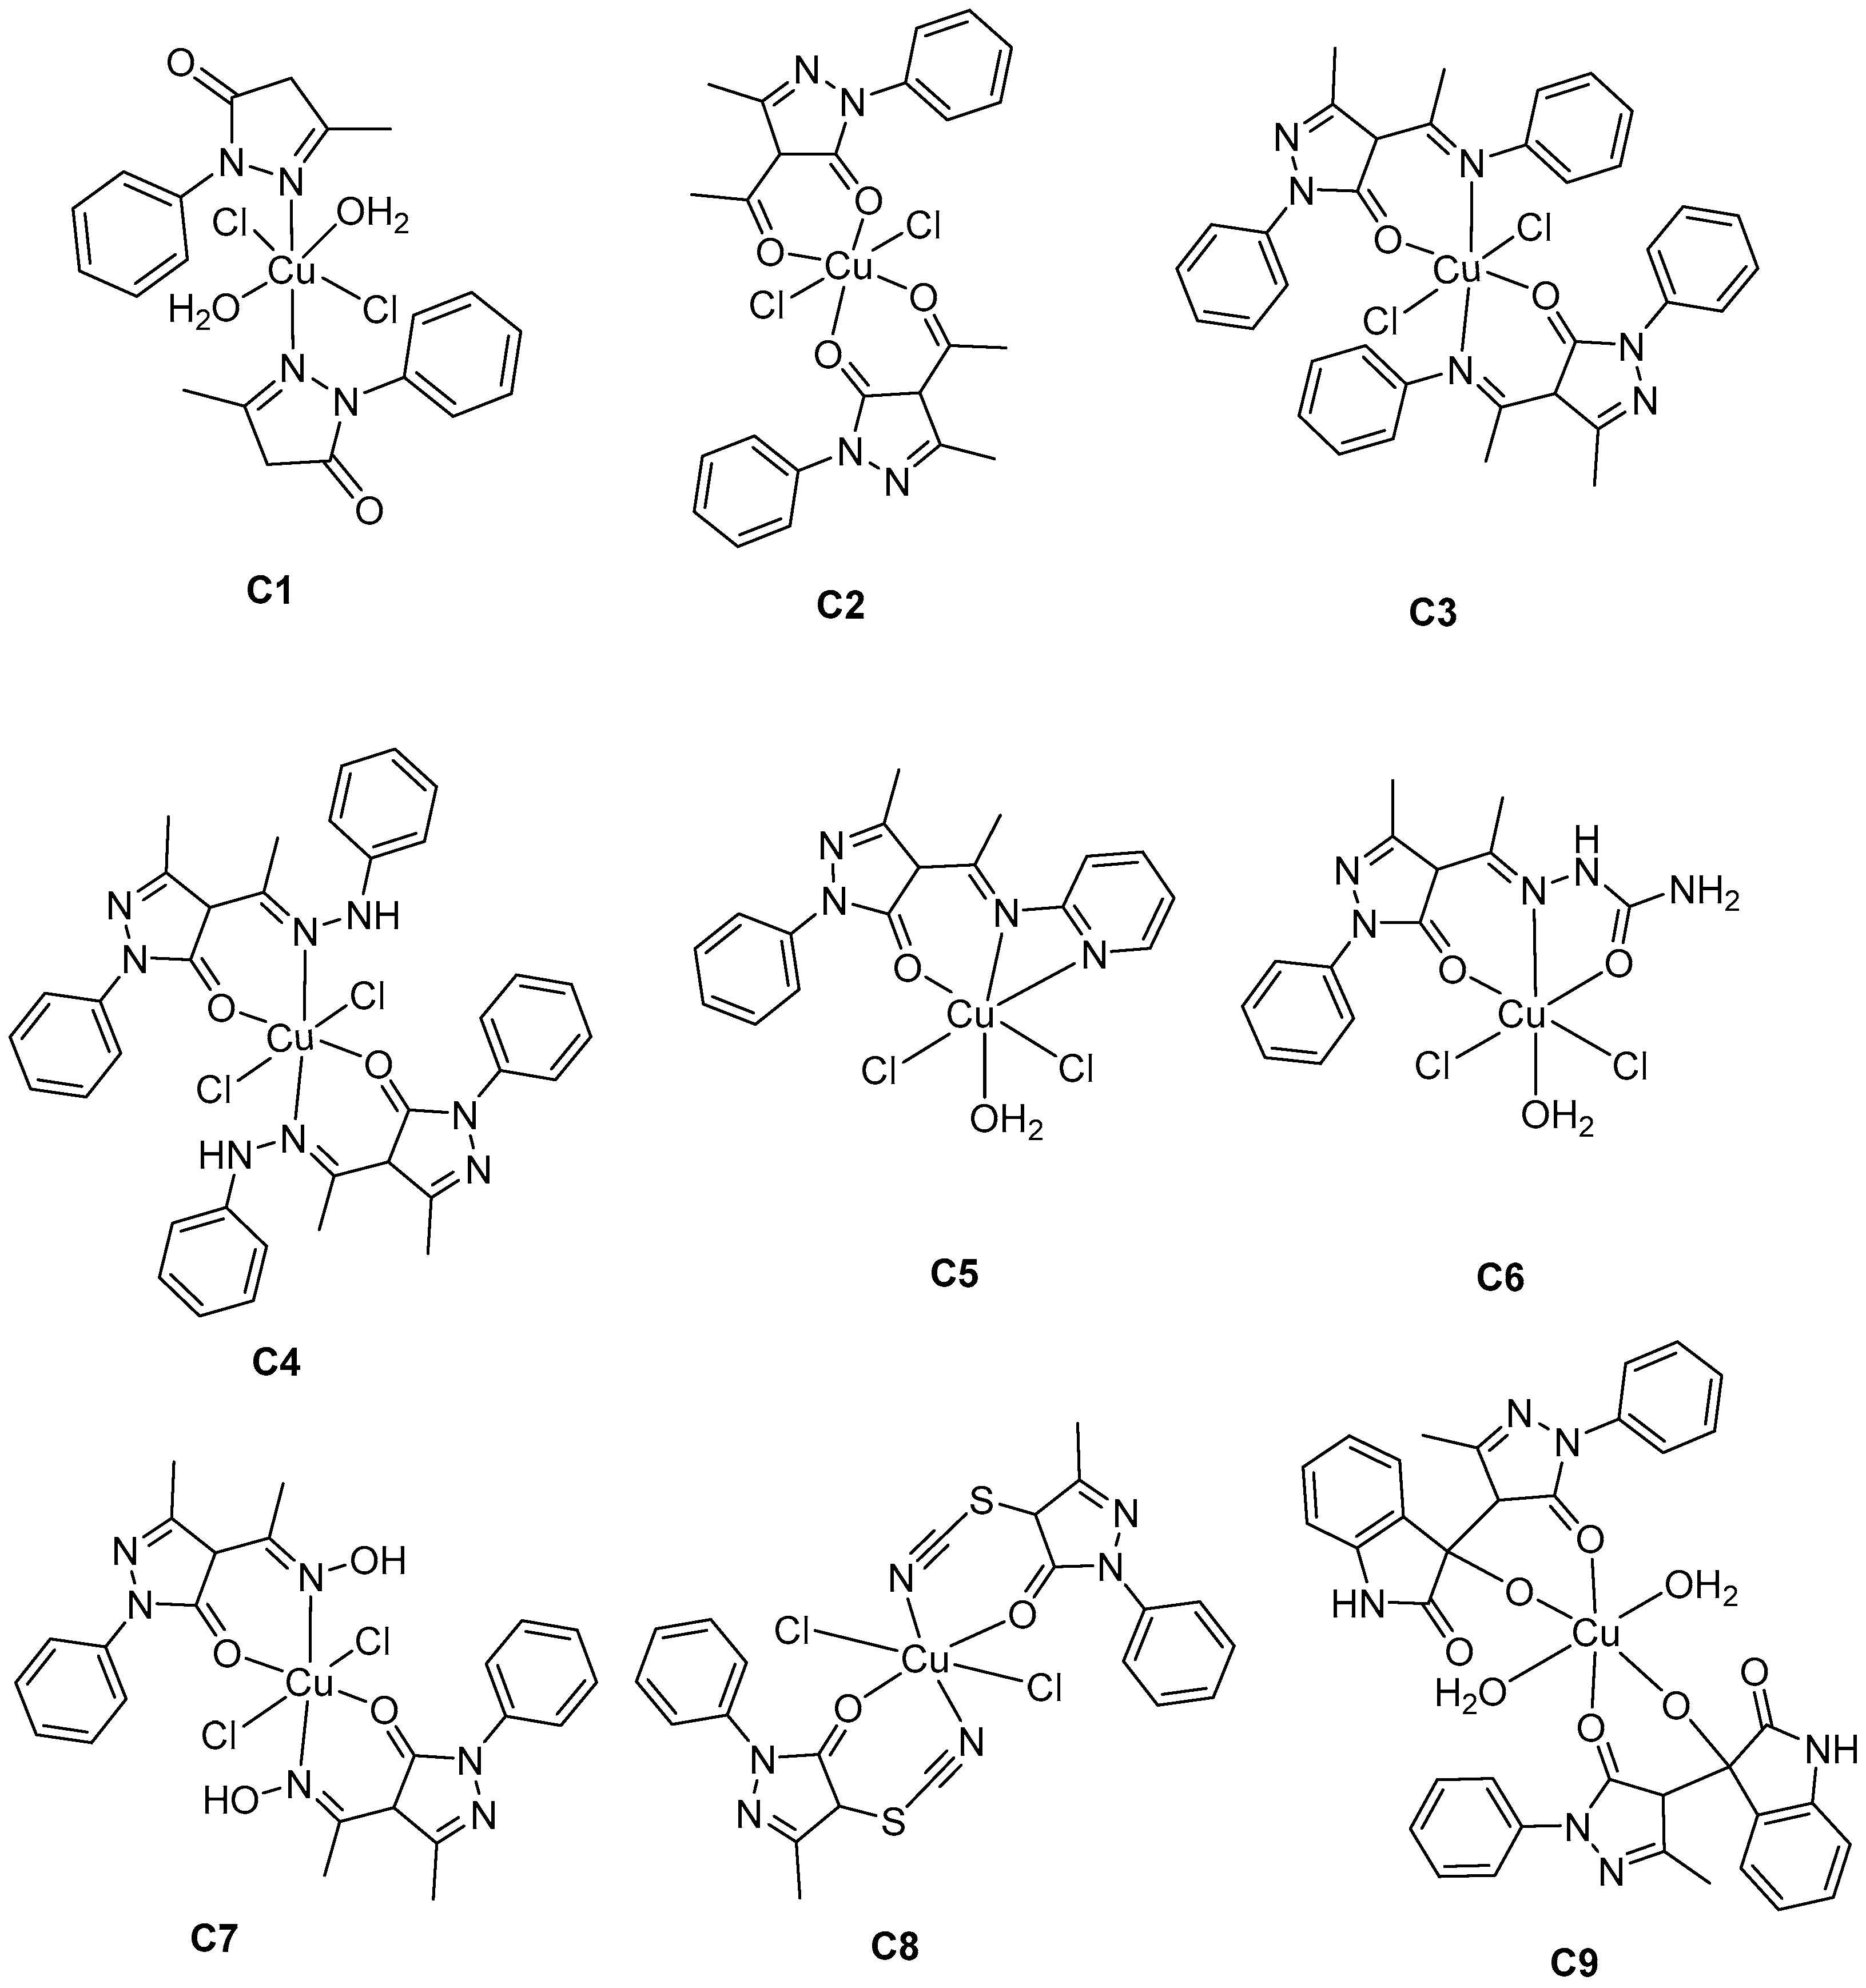
Figure 1. Proposed structures of copper complexes C1C9 (based on the spectral and analytical characterization).
Antioxidants 13 01148 g001
Scheme 1. Synthetic route of compounds L2L9. Reaction conditions (i) AcCl, Ca(OH)2, THF, 4 h, reflux; (ii) aniline, MeOH, H+, 12 h, reflux; (iii) phenyl hydrazine, MeOH, H+, 12 h, reflux; (iv) 2-aminopyridine, MeOH, H+, 12 h, reflux; (v) semicarbazide, MeOH, H+, 12 h, reflux; (vi) hydroxylamine, MeOH, H+, 12 h, reflux; (vii) NH4SCN, K2S2O8, MeOH, 12 h, RT; and (viii) Isatin, NaOH, MeOH, 12 h, reflux.
Antioxidants 13 01148 sch001
Figure 2. Results of the HPSA of edaravone derivatives (L1L9) and their Cu(II) complexes (C1C9). Values are presented as IC50, µg.mL−1. Ascorbic acid (IC50 = 24.84 µg.mL−1) was used as a standard. Different letters for the same method indicate significant difference at p < 0.05 levels by Duncan’s test. Duncan’s test allows us to use edaravone (L1) as a standard by which to compare the antioxidant activity of its derivatives (L1L9) and Cu(II) complexes (C1C9).
Antioxidants 13 01148 g002
Figure 3. Results of DPPH assay of edaravone derivatives (L1L9) and their Cu(II) complexes (C1C9). Values are presented as IC50, µg.mL−1. Edaravone (L1) was used as a standard. Different letters for the same method indicate significant difference at p < 0.05 levels by Duncan’s test.
Antioxidants 13 01148 g003
Figure 4. Results of ABTS assay of edaravone derivatives (L1L9) and their Cu(II) complexes (C1C9). Values are presented as IC50, µg.mL−1. Edaravone (L1) was used as a standard. Different letters for the same method indicate significant difference at p < 0.05 levels by Duncan’s test.
Antioxidants 13 01148 g004
Figure 5. HOMO–LUMO plots of DFT optimized structures of (a) L1, (b) L2, (c) L3, (d) L4, (e) L5, (f) L6, (g) L7, (h) L8, and (i) L9.
Antioxidants 13 01148 g005
Figure 6. The molecular electrostatic potential (MEP) plots of the organic compounds (color code: carbon – grey, nitrogen – blue, oxygen – red, hydrogen – white, sulfur – yellow) (a) L1, (b) L2, (c) L3, (d) L4, (e) L5, (f) L6, (g) L7, (h) L8, and (i) L9.
Antioxidants 13 01148 g006
Figure 7. Interaction plots of 3NM8 with (a) L1, (b) L2, (c) L3, (d) L4, (e) L5, (f) L6, (g) L7, (h) L8, and (i) L9.
Antioxidants 13 01148 g007
Figure 8. Root mean square deviation of the backbone atoms of 3NM8 and 3NM8–L6 complex.
Antioxidants 13 01148 g008
Figure 9. Root mean square fluctuation of the c-alpha atoms of 3NM8 and 3NM8–L6.
Antioxidants 13 01148 g009
Figure 10. Rg of the backbone atoms of 3NM8 and 3NM8–L6.
Antioxidants 13 01148 g010
Figure 11. SASA of the backbone atoms of 3NM8 and 3NM8–L6.
Antioxidants 13 01148 g011
Figure 12. H-bonds of complex 3NM8–L6.
Antioxidants 13 01148 g012
Figure 13. (a) Last frame of MD trajectory (150 ns). (b) Active site MMPBSA values of 3NM8–L6.
Antioxidants 13 01148 g013
Table 1. The frontier orbital energy levels and chemical properties of the compounds derived from the DFT studies.
CompoundEHOMO
(eV)
ELUMO (eV)ELUMO–EHOMO Gap (eV)HardnessChemical PotentialElectrophilicity Index
L1−5.8392−1.07814.76112.3806−3.45872.5124
L2−6.1799−0.94485.23512.6176−3.56242.4240
L3−5.8819−1.01824.86372.4319−3.45012.4472
L4−5.3959−1.38484.01112.0056−3.39042.8656
L5−5.7557−1.19244.56332.2817−3.47412.6447
L6−5.7461−0.71295.03322.5166−3.22952.0722
L7−5.6623−0.73774.92462.4623−3.20002.0794
L8−6.3094−1.07765.23182.6159−3.69352.6075
L9−5.9097−1.16844.74132.3707−3.53912.6416
Table 2. Binding energies of synthesized compounds with the protein tyrosinase from Bacillus megaterium (PDB ID: 3NM8).
CompoundsBinding Energy (kcal/mol)
L1−7.8
L2−9.2
L3−7.6
L4−7.3
L5−6.9
L6−9.4
L7−8.9
L8−8.0
L9−11.5
Disclaimer/Publisher’s Note: The statements, opinions and data contained in all publications are solely those of the individual author(s) and contributor(s) and not of MDPI and/or the editor(s). MDPI and/or the editor(s) disclaim responsibility for any injury to people or property resulting from any ideas, methods, instructions or products referred to in the content.