Abstract
Ferroptosis, a regulated form of cell death characterized by lipid peroxidation and iron accumulation, is increasingly recognized for its role in disease pathogenesis. The unfolded protein response (UPR) has been implicated in both endoplasmic reticulum (ER) stress and ferroptosis-mediated cell fate decisions; yet, the specific mechanism remains poorly understood. In this study, we demonstrated that ER stress induced by tunicamycin and ferroptosis triggered by erastin both activate the UPR, leading to the induction of ferroptotic cell death. This cell death was mitigated by the application of chemical chaperones and a ferroptosis inhibitor. Among the three arms of the UPR, the PERK-eIF2α-ATF4 signaling axis was identified as a crucial mediator in this process. Mechanistically, the ATF4-driven induction of DDIT4 plays a pivotal role, facilitating ferroptosis via the inhibition of the mTORC1 pathway. Furthermore, acetaminophen (APAP)-induced hepatotoxicity was investigated as a model of eIF2α-ATF4-mediated ferroptosis. Our findings reveal that the inhibition of eIF2α-ATF4 or ferroptosis protects against APAP-induced liver damage, underscoring the therapeutic potential of targeting these pathways. Overall, this study not only clarifies the intricate role of the PERK-eIF2α-ATF4 axis in ER-stress-and erastin-induced ferroptosis but also extends these findings to a clinically relevant model, providing a foundation for potential therapeutic interventions in conditions characterized by dysregulated ferroptosis and ER stress.
1. Introduction
Ferroptosis is a distinct mode of cell death that fundamentally differs from apoptosis and autophagy [1,2]. It is characterized by the iron-dependent peroxidation of unsaturated fatty acids in the cell membrane [3], a process that leads to extensive lipid damage, disrupting cellular integrity and, ultimately, resulting in cell death [4]. This form of cell death is regulated through multiple mechanisms, including an iron metabolism, mitochondrial function, redox homeostasis, and various signaling pathways that respond to the stresses from different cellular organelles including the mitochondria and ER [5,6].
The ER is an essential organelle in eukaryotic cells, central to protein synthesis and folding, lipid metabolism, and calcium regulation [7,8]. When its function is impaired by various factors, ER stress occurs due to the accumulation of misfolded and unfolded proteins, triggering the UPR [9,10]. The UPR in mammals comprises three signaling pathways initiated by the ER transmembrane proteins: PKR-like ER kinase (PERK) [11], inositol-requiring transmembrane kinase/endoribonuclease-1α (IRE1α) [12], and activating transcription factor 6 (ATF6) [13]. Although the UPR initially protects cells by attempting to restore homeostasis following stress, prolonged or unresolved stress can lead to apoptotic cell death through the PERK-eIF2α-ATF4-CHOP or IRE1α-ASK-JNK pathways [14,15]. Notably, although CHOP (also known as DDIT3) is well-known for its role in inducing apoptosis, our previous finding indicates that neither ATF4 nor CHOP directly targets major apoptotic genes in mouse embryonic fibroblasts (MEFs) subjected to tunicamycin (Tm)- or thapsigargin-induced ER stress [16]. Instead, they contribute to the increased production of reactive oxygen species (ROS) to induce cell death, suggesting that mechanisms other than apoptosis also might be involved in ER-stress-mediated cell death [16].
Emerging evidence underscores a complex interplay between ferroptosis and ER-stress-mediated cell death [17]. Notably, the pharmacological inhibition of the cystine–glutamate exchange can trigger both ER stress and ferroptosis through an eIF2α-ATF4-dependent upregulation of the CHAC1 gene, leading to glutathione depletion [18,19]. Furthermore, the activation of PERK has been shown to regulate the sensitivity of hepatocellular carcinoma cells to high-LET carbon ions, influencing cell fate decisions toward either apoptosis or ferroptosis [20]. Similarly, the activation of the eIF2α-ATF4 pathway is implicated in promoting ferroptosis in various cell types, including glioma cells [21], cardiomyocytes [22], and prostate cancer cells [23]. Conversely, there are indications that ER stress can negatively regulate ferroptosis, potentially as a protective mechanism against stress via the ATF4-dependent activation of HSPA5 [24,25]. Moreover, ATF4 has been observed to protect neuronal cells from death by modulating ferroptosis [26]. These observations suggest a dual role for the PERK-eIF2α-ATF4 pathways in ferroptosis, necessitating further investigation to delineate their specific roles in ferroptosis and related pathologies.
In this study, our aim was to investigate the interplay between ER stress and ferroptotic signaling, with the hypothesis that the activation of the PERK branch of the UPR under ER stress promotes ferroptosis through an ATF4-dependent mechanism. We explored this relationship both in an in vitro and in vivo animal model.
2. Materials and Methods
2.1. Animal Protocols
Eight-to-ten-week-old male C57BL/6 mice were purchased from Orient (RaonBio, Yongin, Republic of Korea). The mice were housed in an environment maintained at 25 ± 2 °C with free access to food (5053, Pico lab, Gray Summit, MO, USA) and water under a 12 h light/dark cycle with lights on from 7:00 to 19:00. All animal care and experimental procedures were conducted according to the protocols and guidelines approved by the Soonchunhyang University Animal Care and Use Committee (SCH25-0006).
The APAP-induced acute liver injury murine model was established by fasting mice overnight (17:00–09:00, 16 h) before being intraperitoneally (I.P.) injected with vehicle or 2BAct (10 mg/kg) or Ferrostatin-1 (Fer-1) (10 mg/kg) (n = 3–6 for each group). After 1 h of pretreatment, PBS (21-040-CV, Corning, VA, USA) or APAP (200 mg/kg) was administered via I.P. injection. Fasting had been maintained continuously post-injection for 3 or 6 h before the mice were sacrificed.
2.2. Hepatic Damage Assay
Activity of alanine aminotransferase (ALT) and aspartate aminotransferase (AST) in serum, as indicators of hepatic injury, were measured using the EnzyChrom ALT assay kit (EALT-100, BioAssay Systems, Hayward, CA, USA) and EnzyChrom AST assay kit (EASTR-100, Bi-oAssay Systems, Hayward, CA, USA) from BioAssay Systems under the guidance of the manufacturer’s instruction.
2.3. Chemicals and Reagents
Erastin (E7781, Sigma-Aldrich, St. Louis, MO, USA), SB202190 (S7067, Sigma-Aldrich, St. Louis, MO, USA), GSK2606414 (GSK) (516535, Sigma-Aldrich, St. Louis, MO, USA), Tm (T7765, MilliporeSigma, Burlington, MA, USA), MTT (M2128, Sigma-Aldrich, St. Louis, MO, USA), and ISRIB (SML0843, Sigma-Aldrich, St. Louis, MO, USA) were purchased from Sigma-Aldrich. RSL3 (S8155, Selleck Chemicals, Houston, TX, USA), Fer-1 (S7243, Selleck Chemicals, Houston, TX, USA), and Z-VAD (S7023, Selleck Chemicals, Houston, TX, USA) were purchased from Selleck Chemicals. Tauroursodeoxycholic acid (TUDCA) (T1567, TCI, Tokyo, Japan) was obtained from TCI. 4-phenylbutyric acid (4-PBA) was purchased from MedChemExpress (HY-A0281, MCE, Shanghai, China). Torin1 was from Tocris-Biotech (4247, Tocris-Biotech, Minneapolis, MN, USA). APAP was from TCI (H0190, TCI, Tokyo, Japan). 2BAct was synthesized and confirmed to be over 99% pure using 1H NMR, HPLC, and LCMS analyses by the Medicinal Chemistry Team at Daegu-Gyeongbuk Medical Innovation Foundation (Daegu, Republic of Korea).
2.4. Cell Culture
Alpha mouse liver 12 (AML12) cells (CRL-2254, American Type Culture Collection (ATCC), Manassas, VA, USA) were cultured in DMEM/F12 (11320033, Thermo Fisher Scientific, Waltham, MA, USA) containing 10% fetal bovine serum (FBS) (35-015-CV, Corning, NY, USA), 1% penicillin/streptomycin solution (30-002-CI, Corning, NY, USA), 1% ITS Liquid Media Supplement (I3146, Sigma-Aldrich, St. Louis, MO, USA), and 40 ng/mL dexamethasone (52-02-2, Sigma-Aldrich, St. Louis, MO, USA). The human hepatocellular carcinoma cell line HepG2 was purchased from ATCC (HB-8065, ATCC, Manassas, VA, USA) and maintained in DMEM (10-013-CV, Corning, NY, USA) supplemented with 10% FBS and 1% penicillin/streptomycin solution. Perk+/+ (wild-type) and Perk−/− (knock-out) MEFs were cultured in DMEM medium supplemented with 10% FBS and 1% MEM nonessential amino acid solution (11140050, Gibco, NY, USA). Atf4+/+ (wild-type) and Atf4−/− (knock-out) MEFs were cultured in DMEM medium supplemented with 10% FBS, 1% penicillin/streptomycin, 1% MEM nonessential amino acid solution, and 2.2 μL β-mercaptoethanol (21985023, Thermo Fisher Scientific, Waltham, MA, USA). Ire1α+/+ (wild-type), Ire1α−/− (knock-out), Atf6α+/+ (wild-type), and Atf6α−/− (knock-out) mouse hepatocytes, which were kindly provided by Dr. S. H. Back (University of Ulsan, Ulsan, Republic of Korea), were maintained in medium 199 (M4530, Sigma-Aldrich, St. Louis, MO, USA) with 10% FBS and 1% MEM nonessential amino acid solution. For cystine deprivation, the experiment was carried out by incubating cells in DMEM, high glucose, no glutamine, no methionine, no cystine (21013024, Thermo Fisher Scientific, Waltham, MA, USA) with 10% dialyzed FBS (F0392, Sigma Aldrich, St. Louis, MO, USA), that was supplemented with L-glutamine (G7513, Sigma-Aldrich, St. Louis, MO, USA) to a final concentration of 4 mM and L-methionine (4500-M, Millipore, Burlington, MA, USA) to a final concentration of 200 µM. Cells were grown in humidified incubators, at 37 °C with 5% CO2.
2.5. Real-Time Quantitative RT-PCR
Total RNA was prepared using Trizol reagent (15596026, Thermo Fisher Scientific, Waltham, MA, USA); 2 µg of total RNA was used to synthesize the first-strand cDNA with oligo (dT) primers and Moloney murine leukemia virus reverse-transcriptase (M1701, Promega, Madison, WI, USA), according to the manufacturer’s instructions. Real-time quantitative RT-PCR (qRT-PCR) was performed with TOPreal qPCR 2X PreMIX (SYBR Green with low ROX) (RT500M, Enzymnomics, Daejeon, Republic of Korea) on an ABI 7500 Fast Real-Time PCR System (Thermo Fisher Scientific, Waltham, MA, USA).
The primers used in this study are listed in Table 1.

Table 1.
List of primers for qRT-PCR analysis of gene expression. F—forward, R—reverse, bs—bases.
2.6. Western Blot Analysis
Cell pellets and liver tissue were lysed using prepared RIPA buffer (89900, Thermo Fisher Scientific, Waltham, MA, USA) containing phosphatase and protease inhibitors (PPC1010, Sigma Aldrich, St. Louis, MO, USA), and the total protein concentration was determined by BCA protein assay reagents (23225, Pierce Biotechnology, Rockford, IL, USA) using bovine serum albumin (BSA) as the standard. Samples were boiled at 95 °C in 2x×Laemmli Sample Buffer (1610737, Bio-Rad, Hercules, CA, USA) for 5 min. Proteins were resolved by SDS-PAGE and transferred to polyvinylidene difluoride membranes (IPVH00010, Millipore, Burlington, MA, USA). The membranes were blocked with 5% nonfat milk (BD232100, BD bioscience, San Diego, CA, USA) in phosphate-buffered saline-Tween 20 (PBS-T), and then the membranes were incubated with primary antibodies as follows: p-PERK (1:1000, Cat#12814, Signalway antibody, Greenbelt, MD, USA), PERK (1:1000, Cat#5683, Cell Signaling, Danvers, MA, USA), p-eIF2α (1:1000, Cat#9721, Cell Signaling, Danvers, MA, USA), eIF2α (1:1000, Cat#9722, Cell Signaling, Danvers, MA, USA), ATF4 (1:1000, Cat#10835-1-AP, Proteintech, Rosemont, IL, USA), GRP78 (1:1000, Cat#ADI-SPA-826, Enzo Life Sciences, Farmingdale, NY, USA), DDIT3 (1:500, Cat#sc-7351, Santa Cruz, Dallas, TX, USA), p-IRE1α (1:1000, Cat#NB100-2323, Novus Biologicals, Centennial, CO, USA), total-IRE1α (1:500, Cat#sc-390960, Santa Cruz, Dallas, TX, USA), ATF6 (1:1000, #Cat24169-AP, Proteintech, Rosemont, IL, USA), XBP-1(s) (1:1000, Cat#647502, BioLegend, San Diego, CA, USA), GPX4 (1:2000, Cat#Ab125066, Abcam, Cambridge, UK), SLC7A11 (1:1000, Cat#PA1-16775, Thermo Fisher Scientific, Waltham, MA, USA), MDA (1:1000, Cat#6463, Abcam, Cambridge, UK), 4-HNE (1:1000, Cat#46545, Abcam, Cambridge, UK), CHAC1 (1:1000, Cat#15207-AP, Proteintech, Rosemont, IL, USA), DDIT4 (1:1000, Cat#10638-1-AP, Proteintech, Rosemont, IL, USA), cleaved caspase-3 (1:1000, Cat#9661, Cell signaling, Danvers, MA, USA), caspase-3 (1:1000, Cat#9662, Cell signaling, Danvers, MA, USA), p-mTOR (1:1000, Cat#2971, Cell signaling, Danvers, MA, USA), total-mTOR (1:1000, Cat#2972, Cell signaling, Danvers, MA, USA), p-4EBP1 (1:1000, Cat#9455, Cell signaling, Danvers, MA, USA), total-4EBP1 (1:1000, Cat#9452, Cell signaling, Danvers, MA, USA), p-S6 ribosomal protein (1:2000, Cat#5364, Cell signaling, Danvers, MA, USA), S6 ribosomal protein (1:2000, Cat#2317, Cell signaling, Danvers, MA, USA), and β-actin (1:2000, #Cat4967, Cell signaling, Danvers, MA, USA) as a loading control. These were incubated overnight at 4 °C. Membranes were washed with 1X PBS-T 3 times for 10 min and incubated with HRP-conjugated mouse or rabbit secondary antibodies (115-035-003, 111-035-003, Jackson ImmunoResearch Laboratories, West Grove, PA, USA). Chemiluminescence signals were read using an Azure Biosystems C300 analyzer (Azure Biosystems, Dublin, CA, USA) with an ECL substrate (1859700, Pierce Biotechnology, Rockford, IL, USA).
Small Interfering RNA Transfection
Small interfering RNA (siRNA) against mouse Ddit4 (siDdit4) (sc-142310, Santa Cruz, Dallas, TX, USA) was purchased from Santa Cruz Biotechnology, and negative control siRNA (scRNA) (AM4611, Ambion, Austin, TX, USA) was purchased from Ambion. Cells were transfected using the Lipofectamine™ 2000 (11668027, Thermo Fisher Scientific, Waltham, MA, USA) in accordance with the manufacturer’s protocol. After 36 h transfection, cells were treated with indicated drug.
2.7. Adenovirus Infection
Adenovirus expressing GFP (Ad-GFP) or ATF4 (Ad-ATF4) were obtained from Research Animal Resource Center (Korea Institute of Science and Technology, Seoul, Republic of Korea). Cells were plated the day prior infection. Infection with adenovirus expressing either GFP or mouse ATF4 was carried at a multiplicity of infection of 1000. After 24 h infection, the cells were washed twice and treated with erastin for 24 h.
2.8. Cell Viability
Cell viability was detected using an MTT assay. Cells were seeded in a 96-well plate at density of 70–80% confluence. After treatment, 20 μL of MTT (5 mg/mL) in PBS solution was directly to the cell culture medium and allowed to incubate for 1 h. The medium was then removed, and solvent (isopropanol) was added to the cells and absorbance was measured at 570 nm with SpectraMax iD3 (Molecular Devices, Sunnyvale, CA, USA).
2.9. Measurement of Lipid ROS
Cells were seeded into 12-well plates and cultured overnight. On the next day, cells were treated with chemicals for the indicated times. Then, cells were trypsinized, washed, suspended in PBS containing 5 μM of BODIPY™ 581/591 C11 (D3861, Thermo Fisher Scientific, Waltham, MA, USA), and incubated at 37 °C for 30 min. Cells were pelleted and resuspended in PBS. Oxidation of the polyunsaturated butadienyl portion of the dye results in a shift of the fluorescence emission peak from ~590 nm to ~510 nm. To measure the lipid peroxidation, fluorescence from cells was assessed by flow cytometry (BD Biosciences, San Jose, CA, USA) using a 488 nm laser on FL1 detector. The data were analyzed using FlowJo software 10.8.0.
2.10. Iron Measurement
The intracellular iron concentration in cell lysates was assessed using an iron colorimetric assay kit (K390-100, Biovision, Milpitas, CA, USA) purchased from Biovision according to the manufacturer’s instructions. In this assay, ferric carrier proteins dissociate ferrous iron into solution in the presence of acid buffer. After reduction to the ferrous form (Fe2+), iron reacts with Ferene S to produce a stable-colored complex and give absorbance at 593 nm. Iron level in cellular extracts was quantified via comparison to a calibration curve generated using iron standard.
2.11. Transmission Electron Microscopy (TEM)
Cells were seeded in 6-well plates dishes at a density of 5 × 10⁵ cells/dish and cultured overnight. On the next day, cells were treated with erastin in indicated times. For TEM, cells were fixed overnight in 2.5% glutaraldehyde in 0.1 M cacodylate buffer (pH 7.3). Cells were rinsed three times with 0.1 M cacodylate buffer (pH 7.3) and postfixed with 2% osmium tetroxide for 1 h. Next, samples were dehydrated with a series of graded ethyl alcohol solutions. The samples were next embedded in EPON 812. Ultrathin sections (70–80 nm) were obtained using an ultramicrotome, co-stained with uranyl acetate and lead citrate, and examined using a transmission electron microscope (JEM-1010; JEOL, Tokyo, Japan).
2.12. Histology and Immunohistochemistry
Paraformaldehyde (SM-P01-100, GeneAll, Seoul, Republic of Korea)-fixed liver tissues were processed through a series of ethanol gradients and xylene, then embedded in paraffin (39601095, Leica, Nussloch, Germany). Paraffin-embedded tissue was sectioned at 5 μm using Automatic Rotary Microtome (Leica, Nussloch, Germany), then deparaffinized and rehydrated prior to downstream staining.
For H&E staining, rehydrated tissue sections were stained with hematoxylin (MA0101010, Clearview, McKinney, TX, USA) and eosin (MA0101015, Clearview, McKinney, TX, USA) to assess the severity of liver injury.
For immunohistochemistry (IHC) to detect 4-HNE, rehydrated tissue sections were incubated briefly with 3% H2O2 (081-04215, FUJIFILM Wako Chemicals, Osaka, Japan) for 10 min to block endogenous peroxidase. The sections then underwent heat-mediated antigen retrieval by immersion in sodium citrate buffer (pH 6.0) (SR2135, Biosesang, Daejeon, Republic of Korea) under 15 psi pressure for 20 min. Subsequently, the sections were cooled down to room temperature before being blocked with blocking buffer (5% Fish Serum Blocking Buffer (37527, Thermo Fisher Scientific, Waltham, MA, USA), 0.1% BSA (SM-BOV-100, Solmate, Gwangju, Republic of Korea), and 0.02% Triton X-100 (TRX506.100, Bioshop, Seoul, Republic of Korea) in PBS) for 1 h. The primary antibody 4-HNE (ab46545, Abcam, Cambridge, UK) was then incubated overnight with the sections at 4 °C. Following washing with PBS, the sections were incubated with HRP-conjugated rabbit secondary antibodies (111-035-003, Jackson ImmunoResearch Laboratories, West Grove, PA, USA) at room temperature for 2 h. Sections were developed using DAB staining kit (SK-4100, Vector Laboratories, Newark, CA, USA) before being lightly counterstained with hematoxylin. After dehydration using a series of ethanol and clearance using xylene, the obtained slides were mounted using mounting medium (SP15-100, Thermo Fisher Chemical, Waltham, MA, USA).
H&E images and IHC images were captured using a BX61 microscope (Olympus, Tokyo, Japan). The percentage of damage areas and 4-HNE positive areas were assessed using ImageJ software (version number; 1.53 k).
2.13. RNA Sequencing
The gene expression profiles of GSE29929, GSE227134, and GSE104601 were obtained from NCBI-GEO database. The gene expression profile of PRJNA744757 was retrieved from NCBI-SRA and analyzed to obtain raw read count data by using Galaxy website (https://usegalaxy.org/, accessed on 12 February 2024). In our RNA sequencing (RNA-seq) experiment, total RNA from 3 DMSO-treated samples and 3 erastin-treated samples was sequenced and analyzed by BGI Genomics Co., Ltd. (Hong Kong). Log2 fold change and p-value were calculated using DESeq2 package in R software version 4.4.1. Gene set enrichment analysis (GSEA) was performed using fgsea package in R software. The Venn diagram was created using Interactive Venn tool (https://www.interactivenn.net/, accessed on 12 February 2024). The heatmap was generated using Morpheus website (https://software.broadinstitute.org/morpheus/ accessed on 12 February 2024).
2.14. Statistical Analysis
Data were analyzed with Graphpad Prism 9.5.1 (GraphPad Software, San Diego, CA, USA). All values are expressed as means ± SD. Statistical analyses were performed using Student t-test or one-way ANOVA or two-way ANOVA with Tukey post hoc tests.
3. Results
The UPR pathways play important roles in ferroptosis signaling upon ER stress or erastin-induced ferroptosis
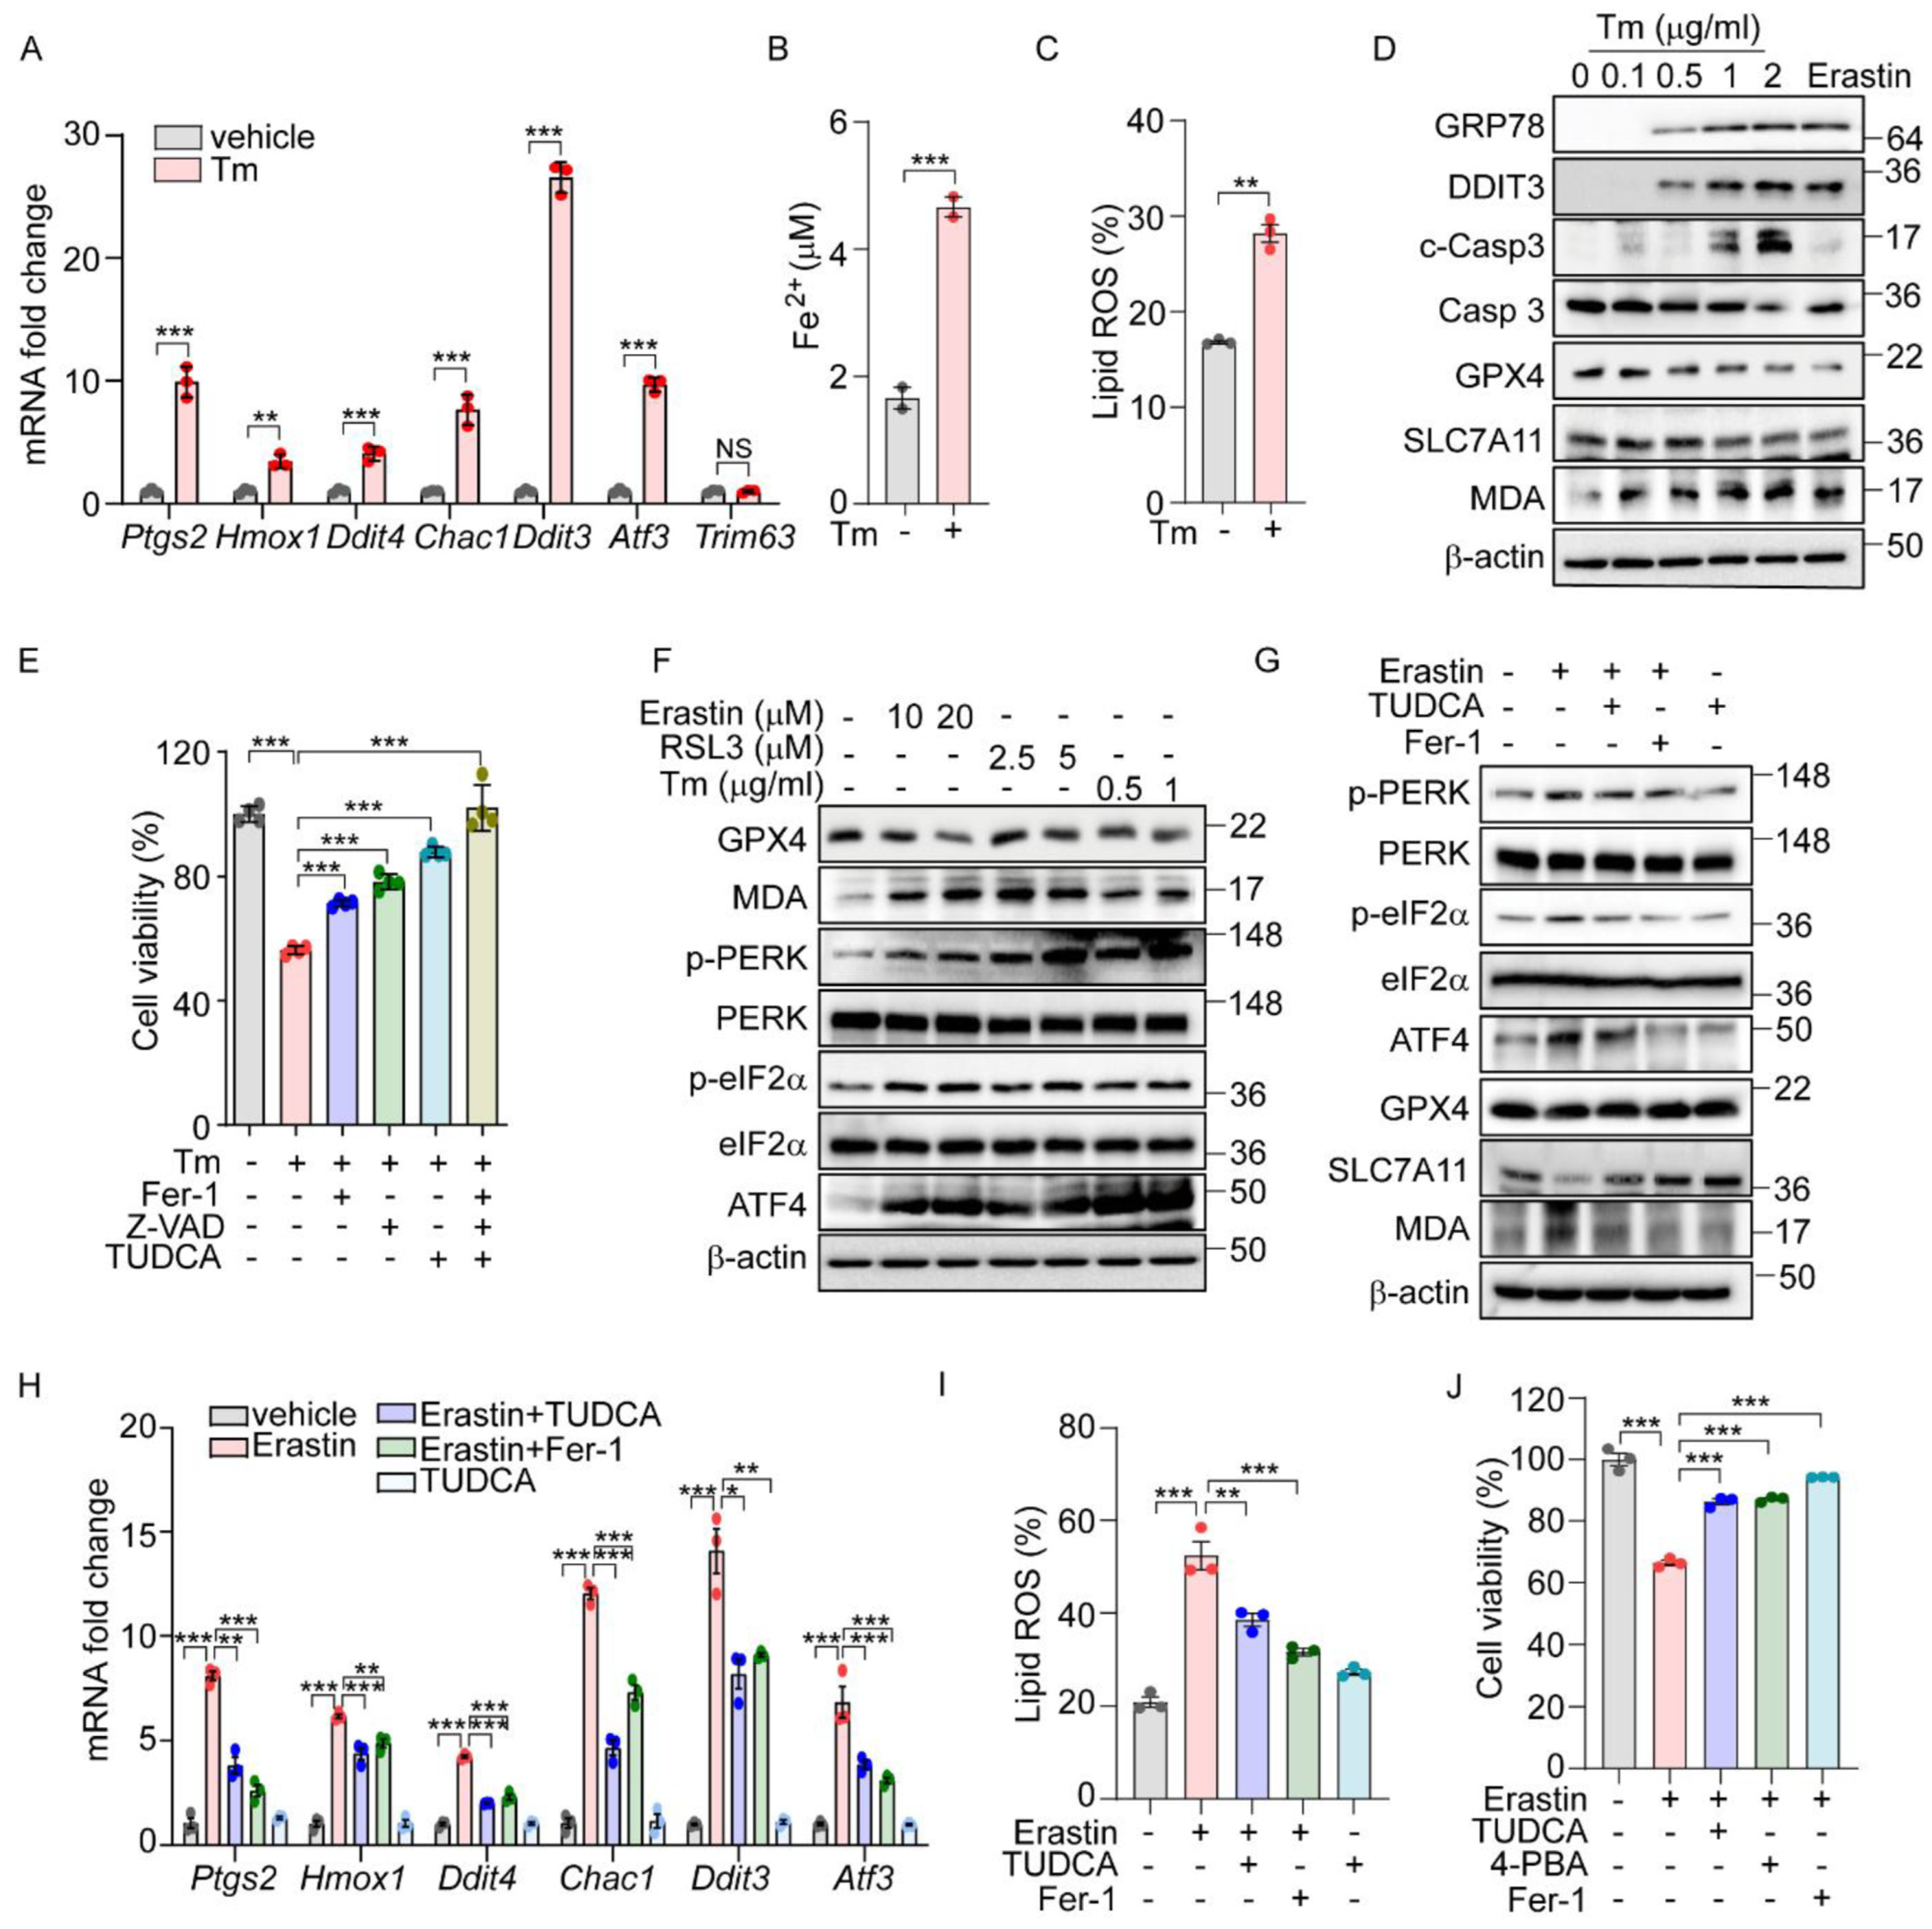
Previously, we demonstrated that the PERK-eIF2α-ATF4 signaling pathway triggers ROS-mediated apoptosis in response to ER stress [16]. Interestingly, our ChIP-Seq analysis did not identify the direct targeting of apoptotic genes by ATF4. Recent studies suggest that ATF4 regulates several ferroptosis-related genes, indicating that ER stress may also induce cell death through an ATF4-mediated ferroptotic pathway. To further explore this possibility, we analyzed gene expression profiles from two public datasets: GSE29929, which examines chemically induced ER stress in the liver, and GSE227134, which investigates similar stress conditions in MEFs [27,28]. Both datasets demonstrated the significant enrichment of the UPR and ferroptosis signaling pathways (Supplementary Figure S1A,B). In alignment with these data, treatment with Tm, an N-glycosylation inhibitor known to induce ER stress, significantly altered the expression of ferroptosis-associated genes such as Ptgs2, Hmox1, and Chac1, as well as ER-stress-related genes including Ddit3, and Atf3, but did not affect the expression of the Trim63 gene which is not implicated in either ER stress or ferroptosis (Figure 1A). This treatment also led to a significant increase in hallmark indicators of ferroptosis, including iron level and lipid peroxidation (Figure 1B,C). Concurrently, we observed an upregulation of ER stress marker proteins such as GRP78 and DDIT3, alongside a decrease in GPX4 and SLC7A11 protein levels but an increase in Malondialdehyde (MDA) levels (Figure 1D). These observations mirror the effects seen with erastin treatment, suggesting a similar activation of ferroptosis signaling pathways. Interestingly, cell death induced by Tm was effectively mitigated by both Z-VAD (an apoptosis inhibitor) and ferrostatin-1 (Fer-1, a ferroptosis inhibitor) (Figure 1E). In contrast, cleaved caspase 3 was detected following Tm treatment but not after erastin treatment (Figure 1D), and caspase 3 cleavage was inhibited only by Z-VAD, not by Fer-1 (Supplementary Figure S1C). In addition, we observed a protective effect from TUDCA, a chemical chaperone known to relieve ER stress (Figure 1E). These findings indicate that ER stress not only triggers apoptosis but also actively induces the ferroptosis signaling pathway, leading to ferroptotic cell death.
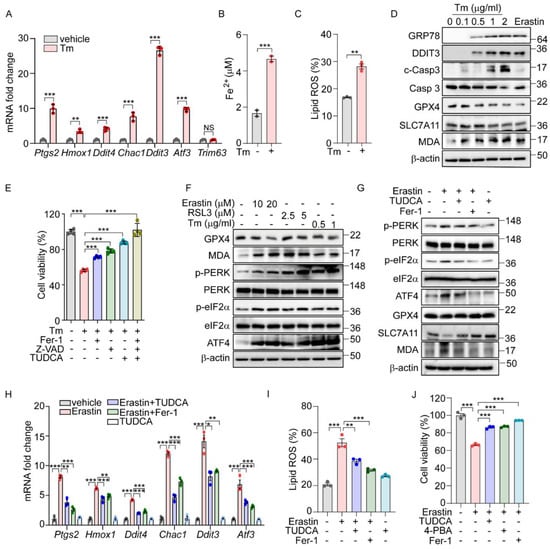
Figure 1.
The UPR is involved in ferroptosis signaling pathway. (A–C) AML12 cells were treated with Tm (1 μg/mL) for 12 h. (A) Quantification of mRNA levels of indicated genes. (B) Intracellular ferrous iron level. (C) Lipid ROS was stained with BODIPY™ 581/591 C11 and measured by flow cytometry. (D) Protein levels of ER stress markers (GRP78 and DDIT3), apoptosis marker (cleaved caspase 3), and ferroptosis markers (GPX4, SLC7A11, and MDA) assessed by Western blot in AML12 cells after Tm treatment (0, 0.1, 0.5, 1, and 2 μg/mL) for 12 h or treatment with erastin (10 μM) for 24 h. (E) Cell viability in AML12 cells assessed by MTT after Tm (1 μg/mL) treatment in the presence or absence of Fer-1 (5 μM), Z-VAD (20 μM), or TUDCA (2 mM) for 12 h. (F) Western blot analysis of indicated proteins in AML12 cells after treatment with erastin (10 and 20 μM) for 24 h, RSL3 (2.5 and 5 μM) for 24 h, and Tm (0.5 and 1 μg/mL) for 12 h. (G–J) AML12 cells was treated with erastin (10 μM) in the presence or absence of TUDCA (1 mM), Fer-1 (5 μM), or 4-PBA (0.5 mM) for 24 h. (G) Western blot analysis of indicated proteins. (H) Quantification of mRNA levels of indicated genes. (I) Lipid ROS was stained with BODIPY™ 581/591 C11 and measured by flow cytometry. (J) Cell viability assesed by MTT. Data are mean ± SD (n = 3); * p < 0.05, ** p < 0.01, *** p < 0.001, and NS, not significant.
We next explored whether the UPR is activated in chemically induced ferroptotic cell death. Treatment with erastin and RSL3, recognized inducers of ferroptosis, resulted in a dose-dependent decrease in the GPX4 level and a corresponding increase in the MDA level (Figure 1F). Additionally, both chemicals, along with Tm, led to the elevated phosphorylation of PERK and eIF2α, as well as increased ATF4 levels (Figure 1F). Notably, the enhanced phosphorylation of IRE1α and the presence of spliced forms of XBP1 and ATF6 were specifically observed following treatments with erastin and Tm, but not with RSL3 (Supplementary Figure S2A). This suggests that the activation of the IRE1α and ATF6 pathways may not be directly linked to the downstream effects of GPX4 in the ferroptotic pathway.
To further investigate the role of ER stress and the UPR in ferroptosis induced by erastin, we employed TUDCA. The treatment with TUDCA or Fer-1 effectively reversed the erastin-triggered alterations in the expression of ferroptosis-associated proteins, including GPX4, SLC7A11, and the level of MDA. Additionally, these treatments significantly reduced the elevated levels of phosphorylated PERK, eIF2α, and ATF4 induced by erastin, confirming their effectiveness in mitigating the cellular stress responses (Figure 1G). The elevated levels of ferroptosis-related genes and lipid peroxidation brought about by erastin or RSL3 were markedly reduced by Fer-1 or TUDCA (Figure 1H,I and Supplementary Figure S2C). Moreover, the reduction in cell viability observed following erastin treatment was significantly reversed with these treatments (Figure 1J). Corroborating these findings, treatment with another chemical chaperone, 4-PBA, similarly inhibited the activation of the UPR signaling pathway (Supplementary Figure S2B), reduced lipid peroxidation (Supplementary Figure S2D), and improved cell viability triggered by erastin (Figure 1J). These results strongly support that ferroptosis induced by erastin contributes to ER stress, subsequently triggering the PERK-eIF2α-ATF4 signaling pathway, which plays a crucial role in mediating ferroptotic cell death.
The PERK arm of the UPR is important for the induction of the ferroptotic pathway by erastin.
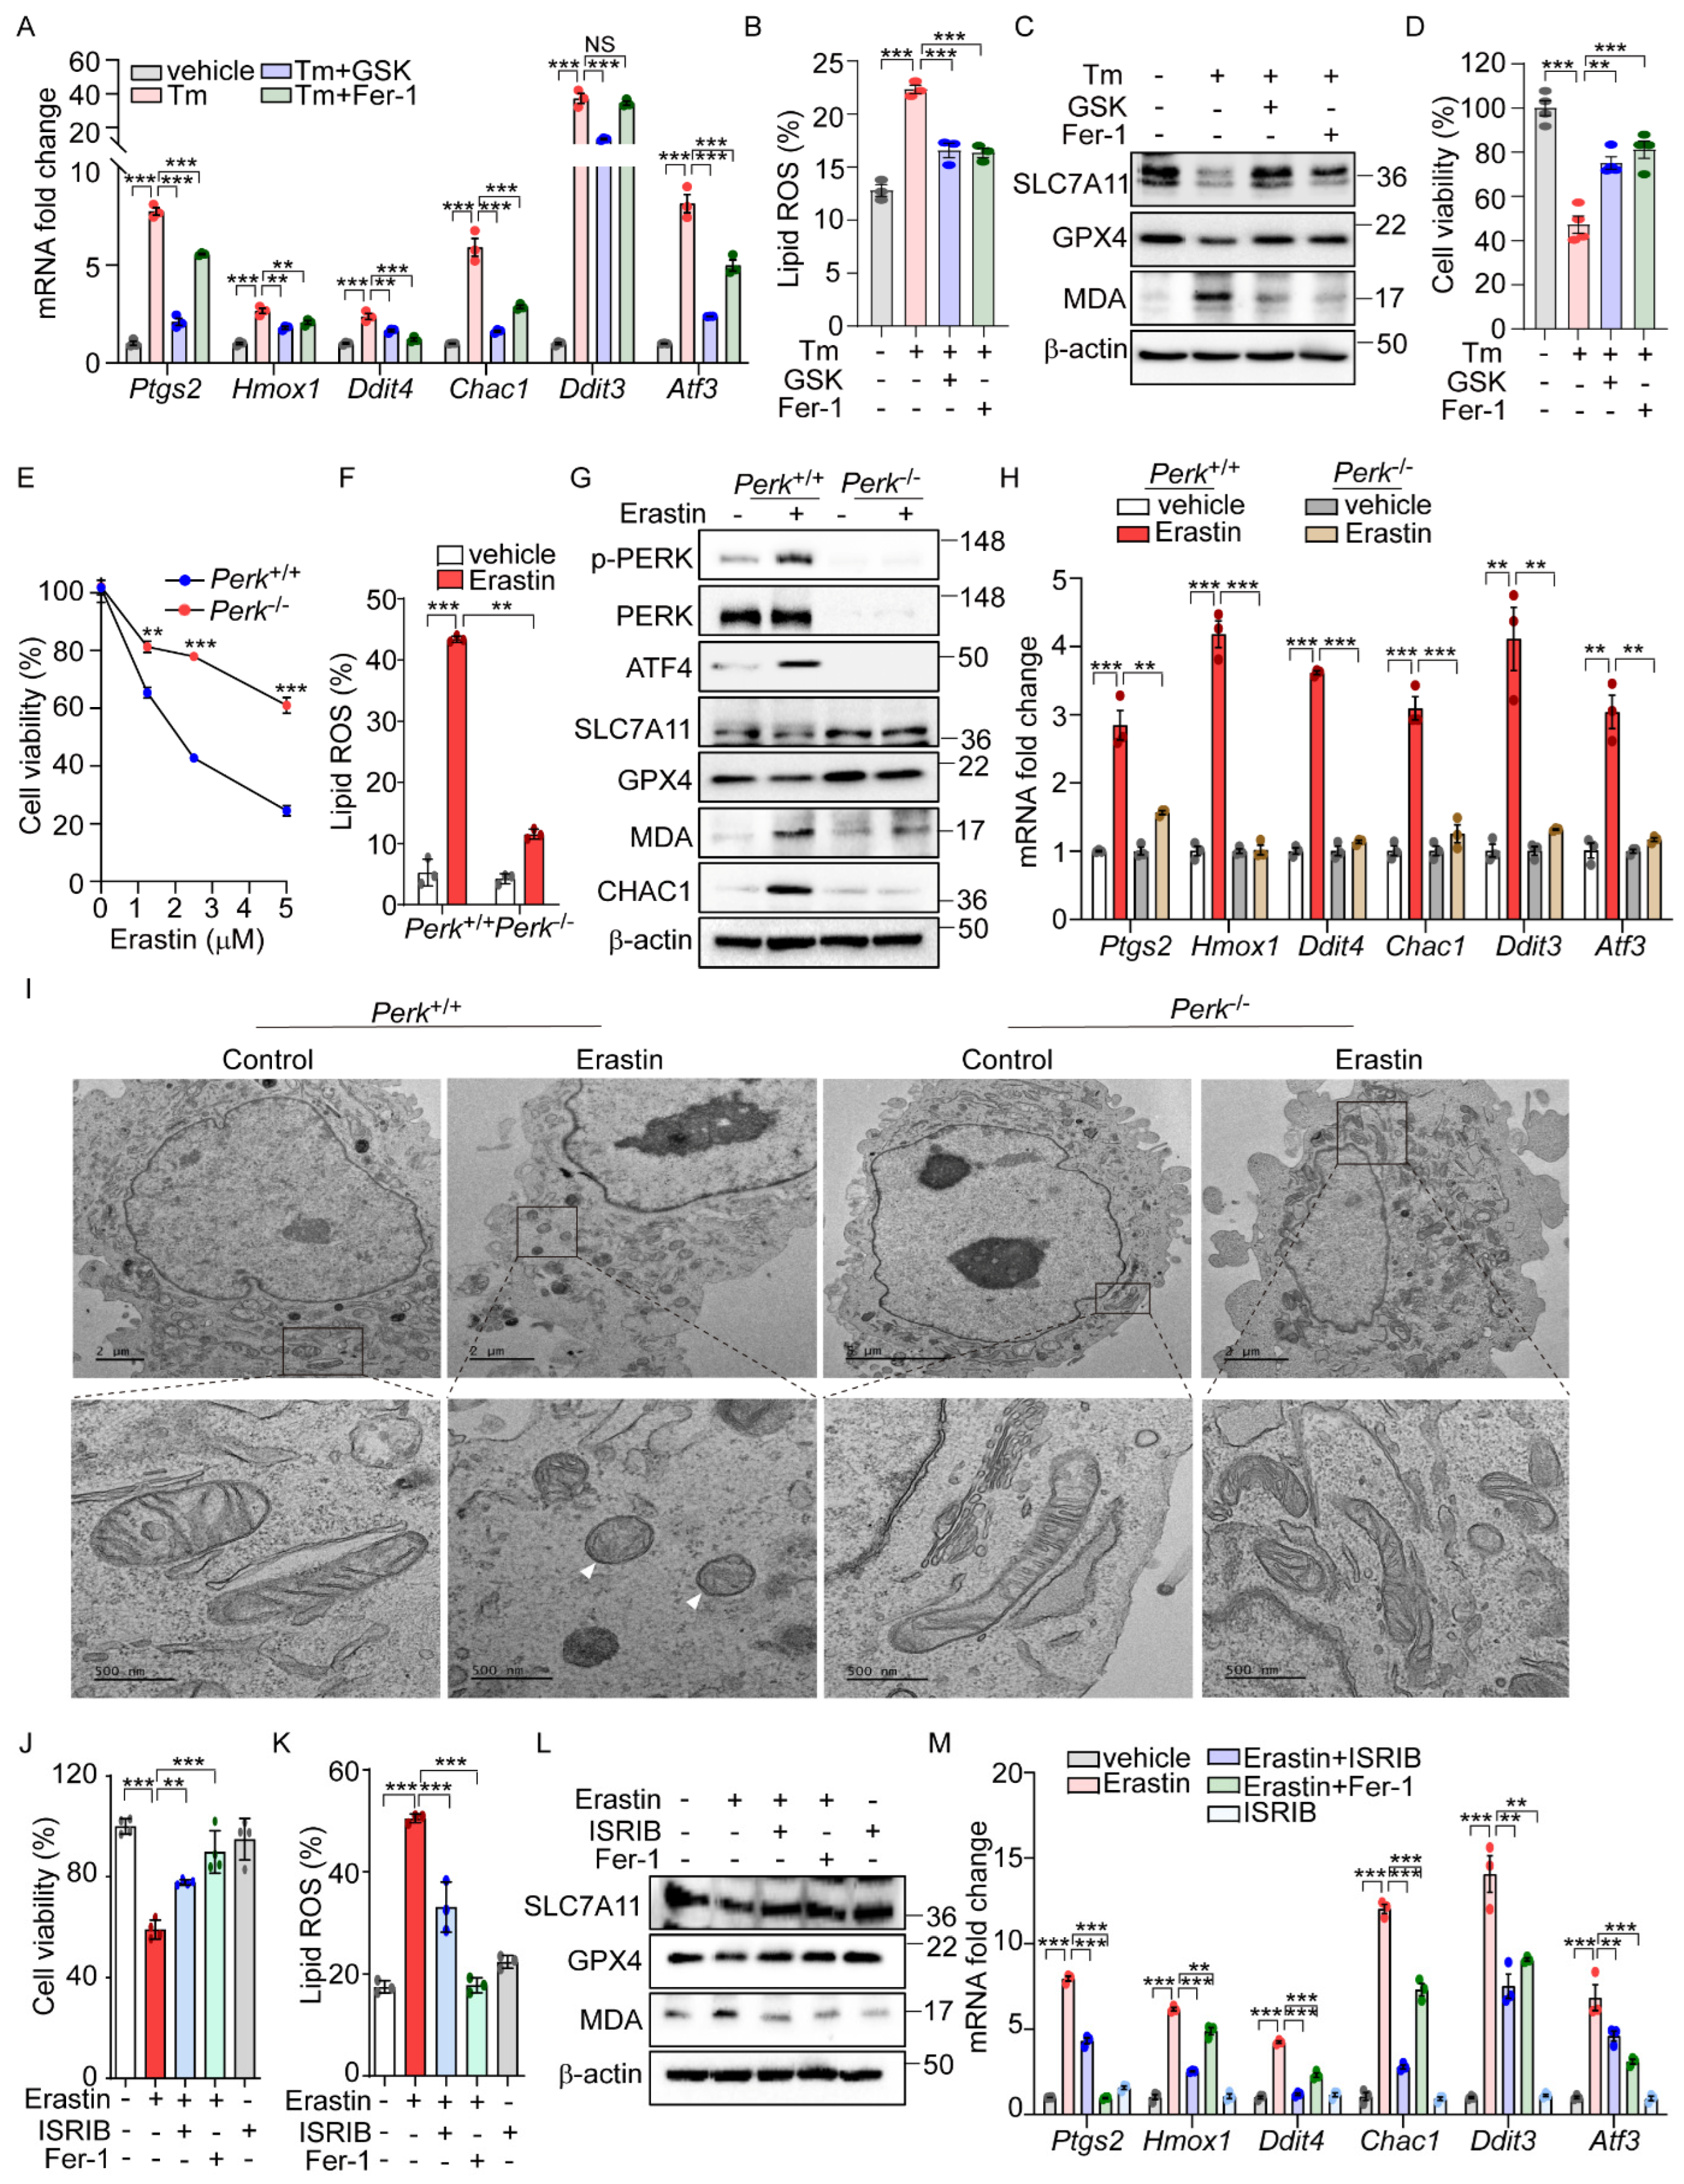
Our analysis of datasets GSE29929 and GSE227134 revealed the significant enrichment of both the UPR and ferroptosis signaling pathways (Supplementary Figure S1A,B). However, in PERK knockout (KO) liver and MEFs under ER stress, the ferroptosis signaling pathway was not significantly activated, suggesting the potential role of PERK in ER-stress-mediated ferroptosis. Further emphasizing PERK’s importance, we demonstrated that GSK2606414 [29], a well-known PERK inhibitor, effectively reduced the induction of ferroptosis-related genes and lipid peroxidation by Tm treatment to levels comparable to those achieved by Fer-1 (Figure 2A,B). GSK2606414 reversed the reductions in SLC7A11 and GPX4 protein levels and the increase in MDA levels induced by Tm treatment, showing effects similar to those observed with Fer-1 treatment (Figure 2C). In addition, the diminished cell viability by Tm treatment was significantly recovered following GSK2606414 administration, similar to the recovery observed with Fer-1 treatment (Figure 2D). These findings collectively suggest that the PERK signaling pathway is involved in mediating ferroptotic cell death under ER stress conditions.
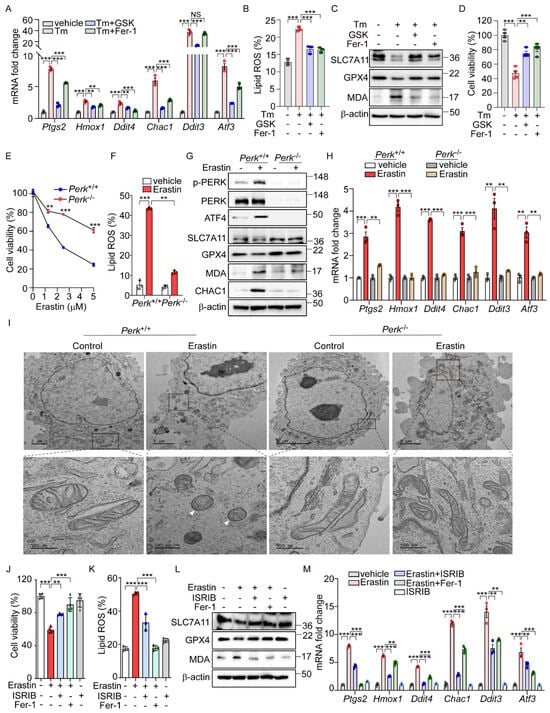
Figure 2.
PERK and its downsteam pathway is involved in the activation of ferroptic signaling. (A–D) AML12 cells were treated with Tm (1 μg/mL) in the presence or absence of GSK2606414 (0.5 μM) or Fer-1 (5 μM) for 12 h. (A) Quantification of mRNA levels of indicated genes. (B) Lipid ROS was stained with BODIPY™ 581/591 C11 and measured by flow cytometry. (C) Western blot analysis of indicated proteins. (D) Cell viability assessed by MTT. (E) Perk+/+ and Perk−/− MEFs were treated with erastin (0, 1, 2.5, and 5 μM) for 6 h, and cell viability was analyzed by MTT assay. (F–I) Erastin (2.5 μM) was treated in Perk+/+ and Perk−/− cells for 6 h. (F) Lipid ROS was stained with BODIPY™ 581/591 C11 and measured by flow cytometry. (G) Western blot analysis of indicated proteins. (H) Quantification of mRNA levels of indicated genes. (I) Representative images of transmission electron microscopy images. White arrows indicate mitochondrial shrinkage, increased electron density, and rupture of the outer mitochondrial membrane. (J–M) AML12 cells were treated with erastin (10 μM) in the presence or absence of ISRIB (1 μM) or Fer-1 (5 μM) for 24 h. (J) Cell viability assessed by MTT. (K) Lipid ROS was stained with BODIPY™ 581/591 C11 and measured by flow cytometry. (L) Western blot analysis of indicated proteins. (M) Quantification of mRNA levels of indicated genes. Data are mean ± SD (n = 3); ** p < 0.01, *** p < 0.001, and NS, not significant.
To further investigate the role of PERK signaling in erastin-induced ferroptosis, we examined ferroptotic cell death in cells with genetic deficiencies in Ire1α, Atf6α, and Perk. While no significant differences in cell viability were observed between Ire1α+/+ and Ire1α−/− or between Atf6+/+ and Atf6−/− cells (Figure S3A,B), there was a notable improvement in cell viability in Perk-deficient cells following erastin treatment (Figure 2E). Consistent with these findings, lipid peroxidation induced by erastin was markedly reduced in Perk−/− compared to Perk+/+ cells (Figure 2F). Additionally, Fer-1 treatment exhibited a protective effect on cell viability and lipid peroxidation in both Perk+/+ and Perk−/− cells (Supplementary Figure S3C,D). Not only did erastin treatment induce cell death and lipid peroxidation, but cystine deprivation also caused these effects—albeit to a lesser extent in Perk−/− cells compared to Perk +/+cells (Supplementary Figure S3E). In addition, Fer-1 treatment restored cell viability and reduced lipid peroxidation in both cell types (Supplementary Figure S3E). Furthermore, changes in the protein levels of SLC7A11, GPX4, CHAC1, and MDA seen in Perk+/+ cells were notably reversed in Perk−/− cells after erastin treatment (Figure 2G). The erastin-induced upregulation of ferroptosis-related genes was also significantly diminished in Perk−/− compared to Perk+/+ cells (Figure 2H). We further investigated the impact of inhibiting PERK activity on erastin-induced ferroptosis by using GSK2606414. As effectively as Fer-1, treatment with GSK2606414 protected cells from ferroptotic death and significantly reversed the elevated levels of Ptgs2 mRNA and lipid peroxidation, as well as corrected the altered levels of SLC7A11, GPX4, and MDA caused by erastin (Supplementary Figure S4A–D). These results strongly suggest the important role of PERK signaling in mediating the cellular response to ER-stress-mediated as well as erastin-induced ferroptosis.
Contrary to the effects of a PERK inhibitor, treatment with the PERK activator SB202190 alone induced cell death, which was prevented by Fer-1 or Z-VAD (Supplementary Figure S4E), suggesting that PERK activation leads to cell death through both ferroptosis and apoptosis. In addition, SB202190 increased Ptgs2 expression and lipid peroxidation, decreased GPX4 protein levels, and elevated MDA levels and CHAC1 protein levels, suggesting that PERK activation may be involved in initiating ferroptotic signaling and cell death (Supplementary Figure S4F–I).
Given that changes in mitochondrial morphology are recognized as a hallmark of ferroptosis [1], we investigated whether PERK signaling could induce morphological alterations in the mitochondria. The aberrant mitochondrial morphology in Perk+/+ cells after erastin treatment was significantly improved in Perk−/− cells treated with erastin (Figure 2I). Moreover, cells exposed to erastin exhibited dense and deformed mitochondria, which were substantially rescued by GSK2606414 (Supplementary Figure S4J). Conversely, activating PERK with SB202190 alone induced mitochondrial morphological distortions similar to those observed in erastin-treated cells (Supplementary Figure S4J). Overall, the activation of the PERK signaling pathway may contribute to the induction of ferroptotic signaling, which is accompanied by mitochondrial dysfunction.
To further confirm the role of PERK downstream signaling in erastin-induced ferroptosis, we used the chemical modulation of the eIF2α signaling pathway. Similar to the observations in Perk−/− cells, treatment with ISRIB, an inhibitor of eIF2α-ATF4 signaling, effectively rescued the decreased cell viability caused by erastin to a similar extent as Fer-1 treatment [30]. (Figure 2J). Additionally, both ISRIB and Fer-1 significantly reduced the levels of lipid peroxidation induced by erastin (Figure 2K). ISRIB also restored the altered expression patterns of SLC7A11, GPX4, and MDA triggered by erastin (Figure 2L), and effectively prevented the increase in ferroptosis-related gene expression induced by erastin (Figure 2M). These results provide strong evidence that the PERK-eIF2a phosphorylation signaling pathway is a key mediator of erastin-induced ferroptosis.
3.1. ATF4 Is a Key Gene Involved in Erastin-Induced Ferroptosis
Given that ATF4 acts as a primary mediator in the PERK-eIF2α signaling pathway [31], we investigated the role of ATF4 in erastin-induced ferroptosis. We observed that Atf4−/− cells exhibited significant resistance to the ferroptotic cell death induced by erastin, compared to Atf4+/+ cells (Figure 3A). In addition, the elevated levels of Ptgs2 mRNA and lipid peroxidation observed in Atf4+/+ were significantly reduced in Atf4−/− cells (Figure 3B,C). Furthermore, the erastin-induced alterations in SLC7A11, GPX4, and MDA levels observed in Atf4+/+ cells were not observed in Atf4−/− cells (Figure 3D,E).
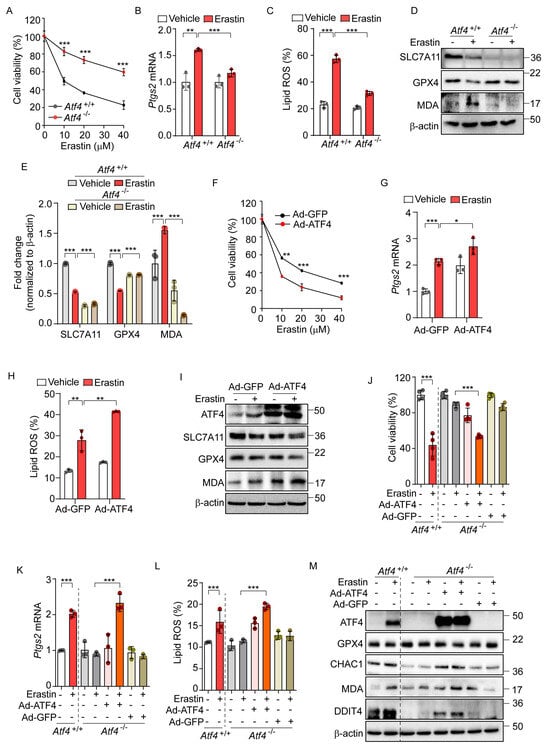
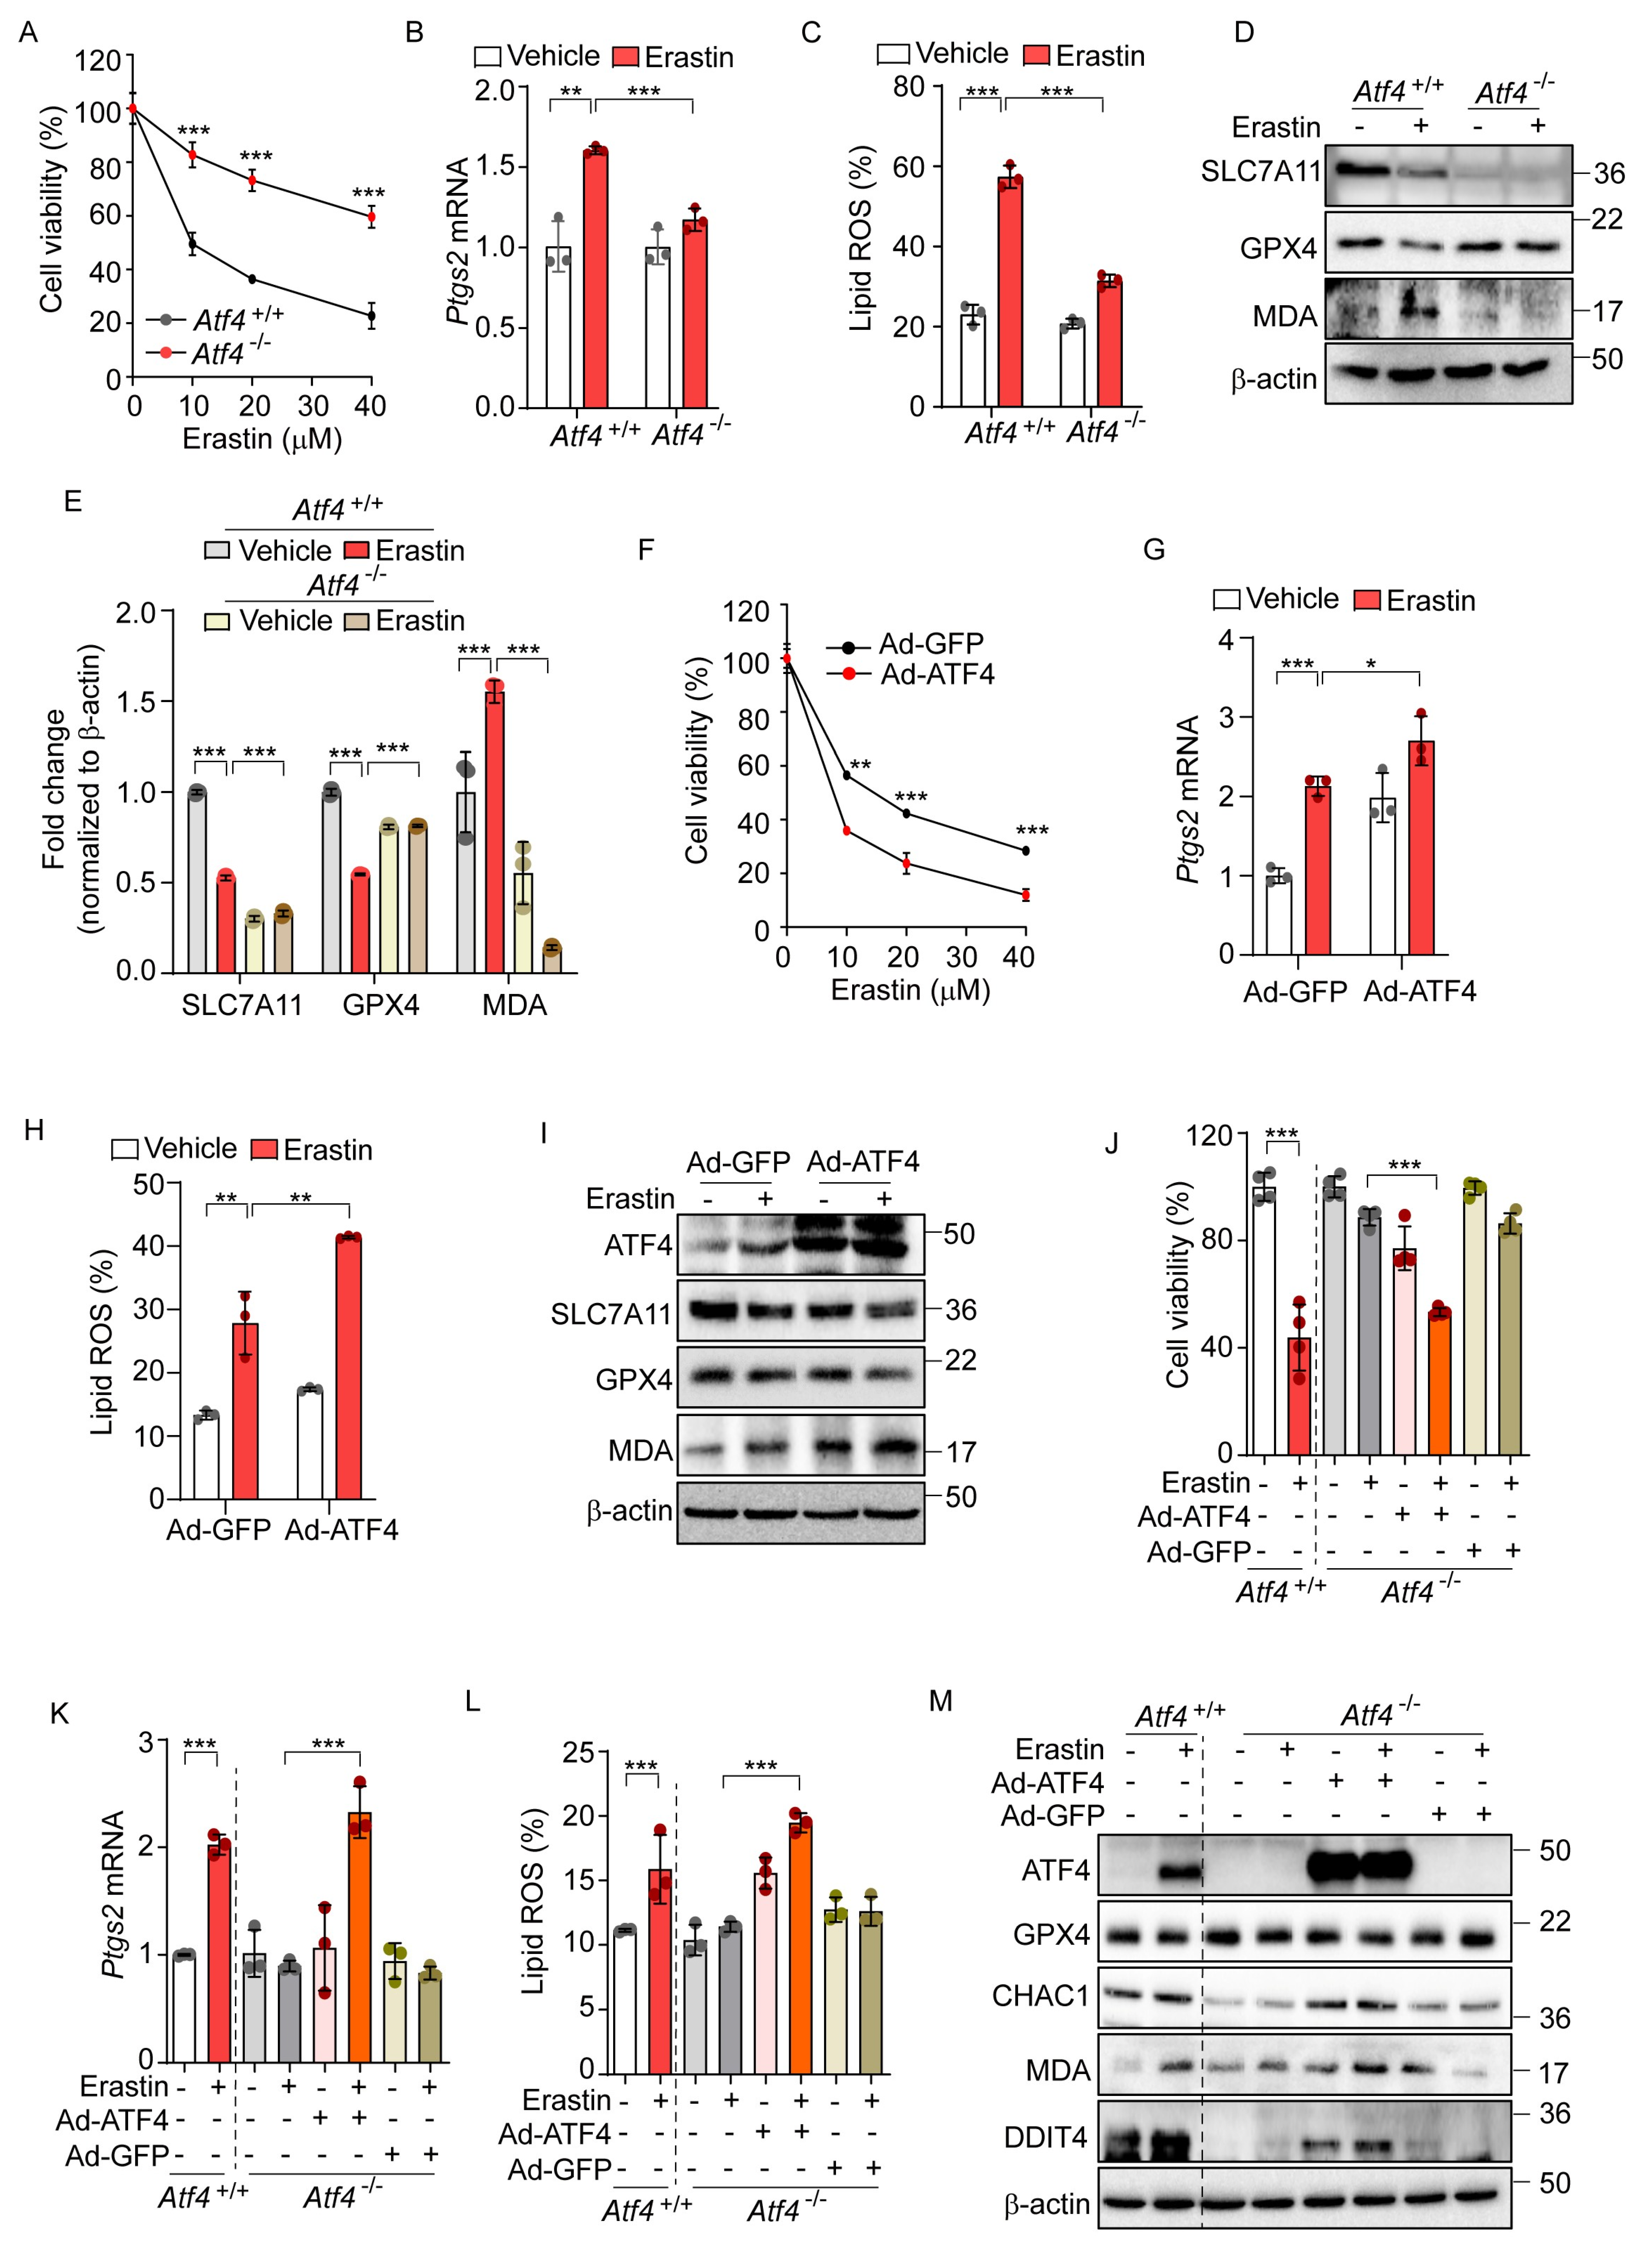
Figure 3.
ATF4 is an important transcription factor for erastin-induced ferroptotic pathway. (A) Cell viability assessed by MTT in Atf4+/+ and Atf4−/− MEFs treated with erastin (0, 10, 20, and 40 μM) for 24 h. (B–E) Atf4+/+ and Atf4−/− MEFs were treated with erastin (10 μM) for 24 h. (B) Quantification of mRNA levels of Ptgs2. (C) Lipid ROS was stained with BODIPY™ 581/591 C11 and measured by flow cytometry. (D) Western blot analysis of indicated proteins. (E) Protein expression in panel (D) was quantified by image J. (F–I) Wild-type MEFs were infected with Ad-GFP or Ad-ATF4 for 24 h. (F) Cell viability assessed by MTT after treatment with erastin (0, 10, 20, and 40 μM) for 24 h. (G) Quantification of mRNA levels of Ptgs2 after erastin (10 μM) treatment for 24 h. (H) Lipid ROS was stained with BODIPY™ 581/591 C11 and measured by flow cytometry. (I) Western blot analysis of indicated proteins after erastin (10 μM) treatment for 24 h. (J–M) To rescue the expression of ATF4, Ad-GFP, or Ad-ATF4 were infected in Atf4−/− cells in the presence or absence of erastin (10 μM) for 24 h. (J) Cell viability assessed by MTT. (K) Quantification of mRNA level of Ptgs2. (L) Lipid ROS was stained with BODIPY™ 581/591 C11 and measured by flow cytometry. (M) Western blot analysis of indicated proteins. Data are mean ± SD (n = 3); * p < 0.05, ** p < 0.01 and *** p < 0.001.
To further investigate the role of ATF4 in ferroptosis, we employed an adenovirus to overexpress ATF4 (Ad-ATF4), which resulted in enhanced cell death as well as elevated levels of Ptgs2 expression and lipid peroxidation relative to a control virus expressing GFP (Ad-GFP) upon erastin treatment (Figure 3F–H). Ad-ATF4 significantly altered the expression of ferroptosis-related proteins and MDA levels upon erastin treatment compared to cells infected with Ad-GFP (Figure 3I). In subsequent experiments, we reintroduced ATF4 into Atf4−/− cells, which had previously shown resistance to erastin-induced ferroptotic cell death. Unlike their counterparts infected with Ad-GFP, Atf4−/− cells with Ad-ATF4 showed a markedly increased sensitivity to ferroptosis, comparable to that of Atf4+/+ cells (Figure 3J). These cells also demonstrated enhanced responsiveness to the erastin-triggered ferroptotic pathway, exhibiting increased Ptgs2 mRNA levels, elevated lipid peroxidation, and altered expressions of GPX4, CHAC1, and DDIT4 proteins and the MDA level in response to erastin treatment, similarly to Atf4+/+ cells (Figure 3K–M). These results suggest that ATF4 is involved in the activation of ferroptosis signaling and may potentially contribute to ferroptosis-mediated cell death.
3.2. ATF4-Induced Activation of DDIT4 Suppresses the mTOR Pathway and Triggers Ferroptosis
Previous research has shown that the sustained activation of the mTOR pathway can inhibit ferroptosis through the promotion of GPX4 protein synthesis [31,32]. Considering the known crosstalk between the eIF2α-ATF4 and the mTOR signaling pathway [31], we hypothesized that eIF2α-ATF4 might mediate ferroptosis through the modulation of mTOR signaling. To explore this hypothesis, we first assessed the relationship between the mTOR pathway and ferroptosis using the mTOR inhibitor, Torin1. Consistent with expectations, Torin1 treatment significantly diminished mTOR signaling, as evidenced by the reduced levels of phosphorylated S6 and 4EBP1, and simultaneously activated ferroptosis, indicated by the decreased GPX4 protein level (Figure 4A). The co-administration of Torin1 and erastin resulted in increased lipid peroxidation, cell death, and upregulation of the Ptgs2 mRNA level, showing enhanced effects compared to the treatment with erastin alone (Figure 4B–D). These enhancements were significantly mitigated by Fer-1. Similarly, the combination of Torin1 and RSL3 led to increased lipid peroxidation and cell death compared to RSL3 alone (Supplementary Figure S5A,B). In addition, Z-VAD and Fer-1 treatment improved cell survival caused by Torin1 treatment (Supplementary Figure S5C). Interestingly, Torin1 treatment alone exhibited only marginal effects on lipid peroxidation, cell viability, and Ptgs2 gene expression levels, suggesting that mTOR inhibition by itself has a limited impact on ferroptosis. Nonetheless, these findings imply that the inhibition of the mTOR pathway plays a role in the ferroptotic signaling cascade and may potentially enhance its activation.
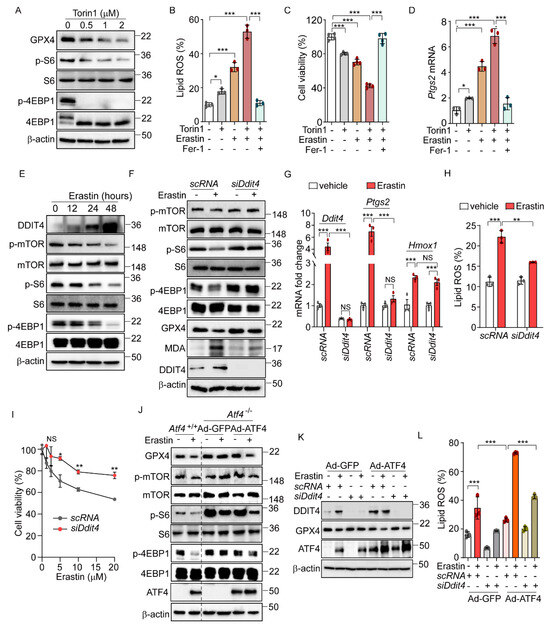
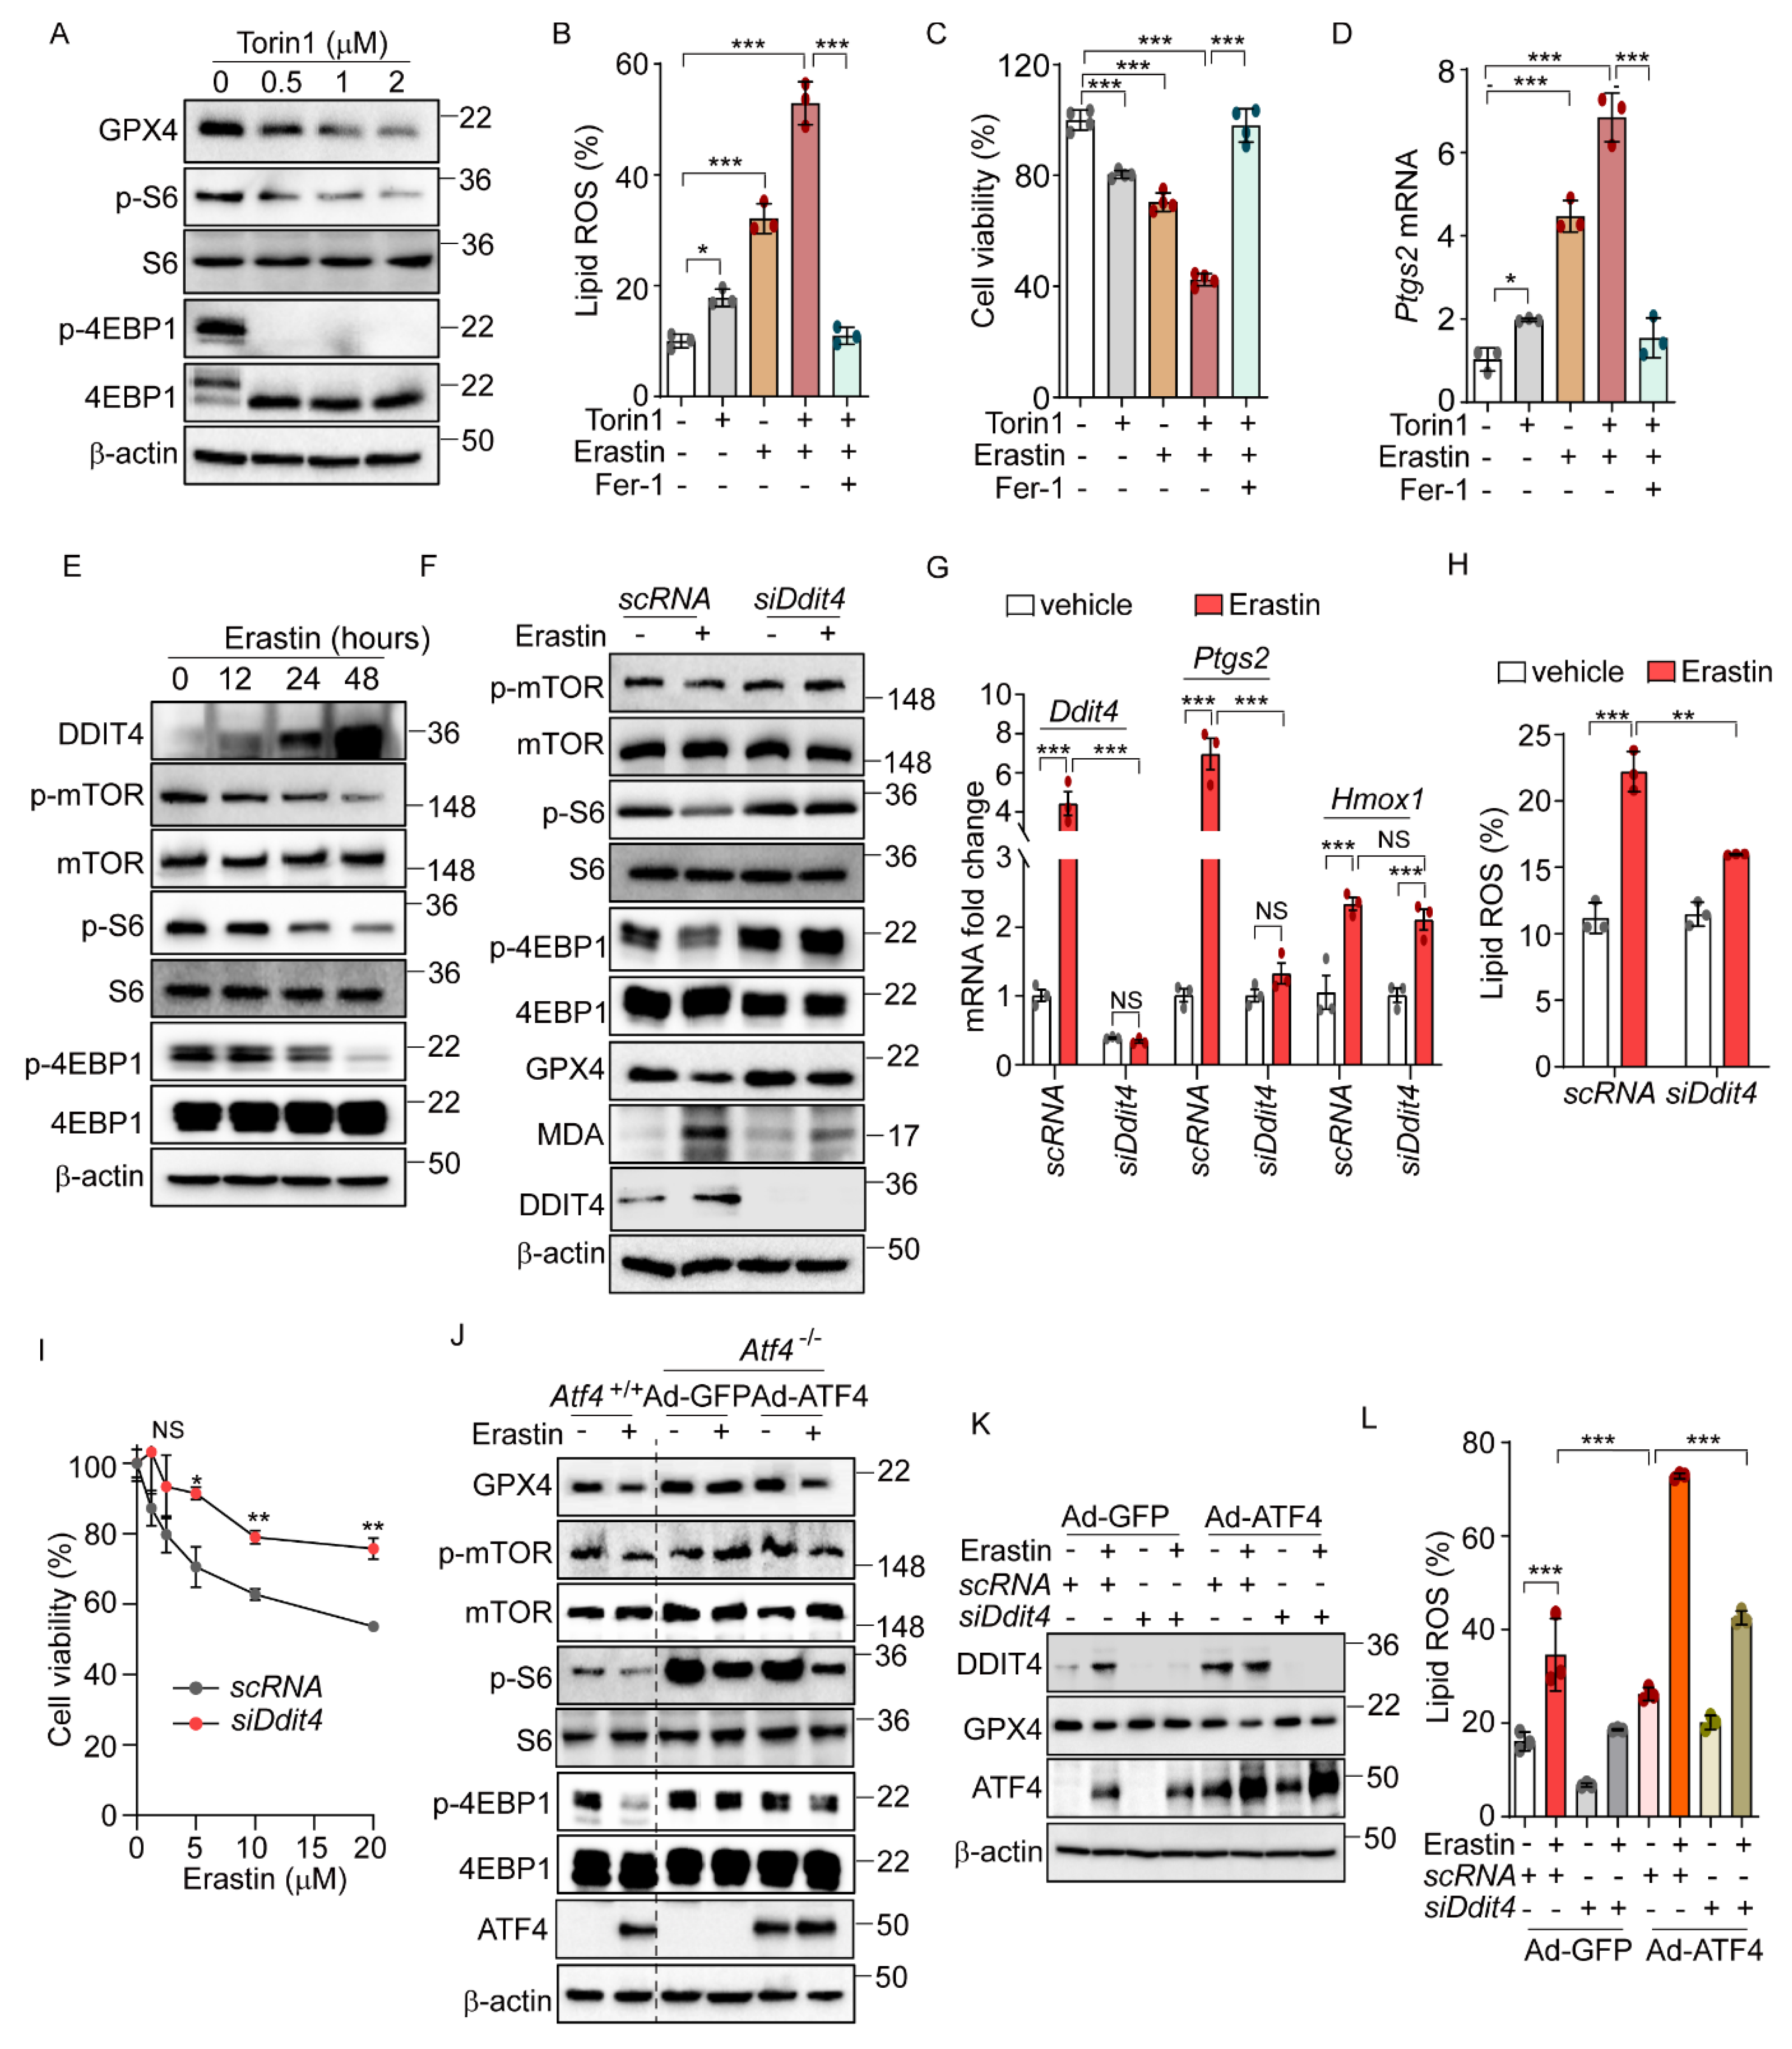
Figure 4.
ATF4-induced DDIT4 and subsequent mTORC1 inhibition trigger ferroptotic signaling. (A) Western blot analysis of indicated proteins in AML12 cells after Torin1 treatment (0, 0.5, 1, and 2 μM) for 24 h. (B–D) AML12 cells were treated with erastin (5 μM) or Torin1 (0.5 μM) in the presence or absence of Fer-1 (10 μM) for 16 h. (B) Lipid ROS was stained with BODIPY™ 581/591 C11 and measured by flow cytometry. (C) Cell viability assessed by MTT. (D) Quantification of mRNA level of Ptgs2. (E) Western blot analysis of indicated proteins in AML12 after treatment with erastin (10 μM) at indicated times. (F–I) For knockdown Ddit4, AML12 cells were transfected with control siRNA (scRNA) or siDdit4 for 36 h. (F) Western blot analysis of indicated proteins after erastin (10 μM) treatment for 24 h. (G) Quantification of mRNA level of indicated genes. (H) Lipid ROS was stained with BODIPY™ 581/591 C11 and measured by flow cytometry. (I) Cell viability assessed by MTT assay after erastin treatment (0, 1.25, 2.5, 5, 10, and 20 μM) for 24 h. (J) Atf4−/− cells were infected with Ad-GFP or Ad-ATF4 and then treated with erastin (10 μM) for 24 h. Western blot analysis of indicated proteins. (K–L) Ad-GFP and Ad-ATF4 were infected in scRNA or siDdit4-transfected AML12 cells followed by erastin (10 μM) treatment for 24 h. (K) Western blot analysis of indicated proteins. (L) Lipid ROS was stained with BODIPY™ 581/591 C11 and measured by flow cytometry. Data are mean ± SD (n = 3); * p < 0.05, ** p < 0.01, *** p < 0.001, and NS, not significant.
Next, we investigated the crosstalk between eIF2α-ATF4-mediated ferroptosis and mTOR signaling. Previous research indicated that DDIT4 inhibits mTOR signaling [33,34]. Given that DDIT4 is a target of ATF4 [16], we hypothesized that the ATF4-mediated upregulation of DDIT4 could suppress mTOR signaling, thereby enhancing the ferroptotic pathway induced by erastin. Erastin treatment induced a time-dependent increase in DDIT4 expression, accompanied by decreased levels of phosphorylated mTOR, S6, and 4EBP1 (Figure 4E). Notably, these erastin-induced changes in mTOR-pathway-related proteins were not observed in Atf4−/− cells, and treatment with Fer-1 did not affect these proteins in Atf4−/− cells (Supplementary Figure S5D). To further explore the role of DDIT4 in the mTOR inhibition induced by erastin, we used siDdit4 to silence its expression. This intervention effectively restored the reduced phosphorylation levels of mTOR, S6, and 4EBP1, as well as normalized the altered levels of GPX4 and MDA that had been changed by erastin (Figure 4F). Additionally, silencing Ddit4 reversed the elevated expression of ferroptosis-related genes and reduced the increased lipid peroxidation level caused by erastin (Figure 4G,H). Moreover, the decrease in cell viability induced by erastin was significantly improved upon Ddit4 silencing (Figure 4I). Interestingly, Ddit4 silencing significantly, though not completely, restores the lipid peroxidation and cell viability changes induced by erastin treatment, suggesting that, while DDIT4 plays an important role in erastin-mediated ferroptosis, additional signaling pathways may also be involved.
Further investigation into the relationship between mTOR signaling and ATF4-mediated ferroptosis revealed that erastin treatment failed to alter the levels of GPX4 or the phosphorylation status of mTOR, S6, and 4EBP1 in Atf4−/− cells infected with Ad-GFP (Figure 4J). However, restoring the ATF4 level via Ad-ATF4 infection led to decreased levels of GPX4 and phosphorylated mTOR, S6, and 4EBP1 by erastin, suggesting that ATF4 mediates the erastin-induced mTOR inhibition and the subsequent activation of ferroptosis signaling (Figure 4J). In line with these findings, silencing Ddit4 inhibited the erastin-induced reduction in GPX4, and ATF4 overexpression did not reverse this effect (Figure 4K). Additionally, the increased lipid peroxidation triggered by erastin and Ad-ATF4 was significantly reduced by Ddit4 silencing (Figure 4L). These results suggest the role of the ATF4-induced DDIT4 expression in reducing mTOR signaling and sensitizing cells to ferroptosis upon erastin treatment. Interestingly, we found that Gpx4 mRNA levels were increased in Atf4−/−, siDdit4, and Perk−/− cells compared to their respective control cells (Supplementary Figure S5E–G). This observation suggests that the enhanced resistance of these cells to erastin-induced ferroptosis may be mediated not only by the inhibition of mTOR signaling but also by a PERK/ATF4/DDIT4-dependent increase in Gpx4 mRNA levels.
3.3. eIF2α-ATF4 Mediates Acetaminophen-Induced Ferroptosis in the Hepatocytes
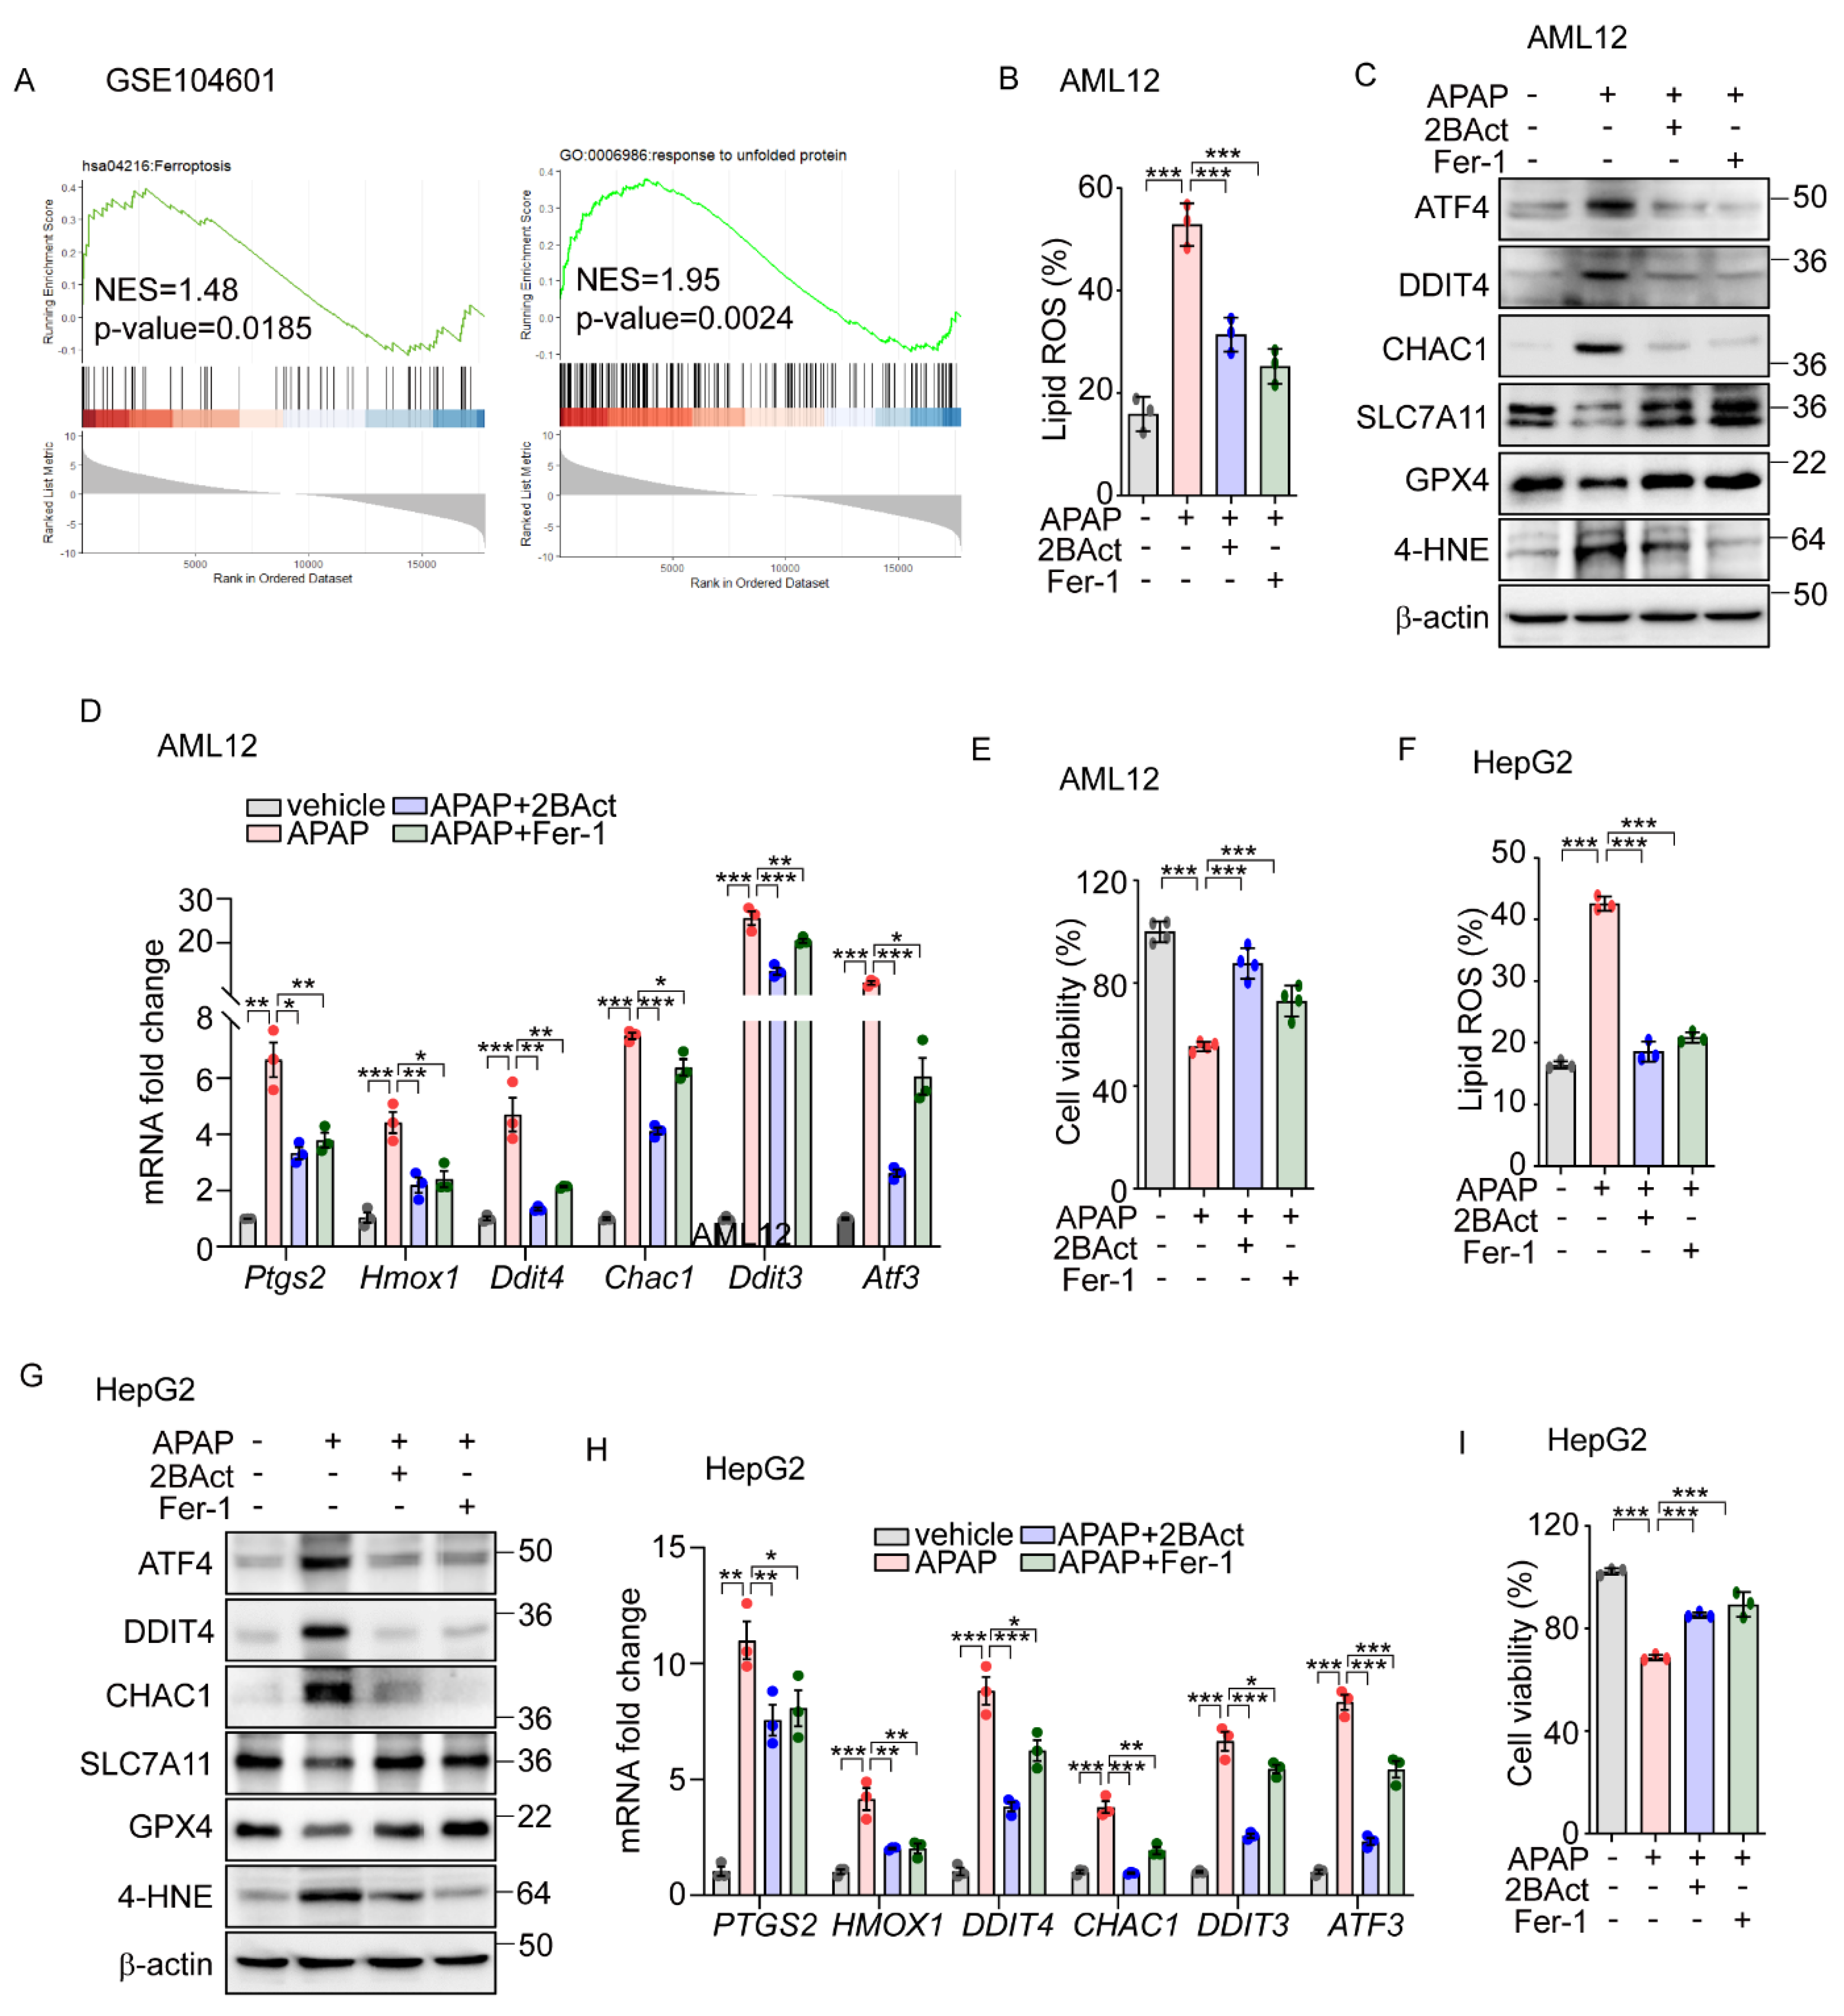
To investigate the physiological impacts of eIF2α-ATF4 regulation on ferroptosis, we employed a model of APAP-induced liver injury. APAP is commonly used for pain and fever relief and is safe within therapeutic doses; however, at excessive doses, it can cause severe hepatic toxicity and even acute liver failure [35]. Recent research suggests that an overdose of APAP can initiate ferroptosis, leading to significant liver damage [36,37]. To explore the role of eIF2α-ATF4 in APAP-induced ferroptosis further, we first analyzed data from GSE104601 [38], which evaluates the effects of APAP on human primary hepatocytes. This analysis revealed the significant enrichment of ferroptosis and UPR signaling pathways in hepatocytes following APAP exposure (Figure 5A). Corroborating these findings, we observed increased lipid peroxidation (Figure 5B) and altered protein levels of GPX4, CHAC1, SLC7A11, and DDIT4, as well as elevated levels of 4-HNE (Figure 5C) and the upregulation of ferroptosis-related genes (Figure 5D) in the murine hepatocyte cell line AML12 following APAP treatment. These effects were significantly mitigated by the eIF2α-ATF4 inhibitor 2BAct [39], with an efficacy comparable to that of Fer-1 (Figure 5B–D). Furthermore, the reduction in cell viability induced by APAP was significantly reversed with treatments of 2BAct and Fer-1 (Figure 5E). These results suggest that APAP-induced damage involves both eIF2α-ATF4 and ferroptosis activation.
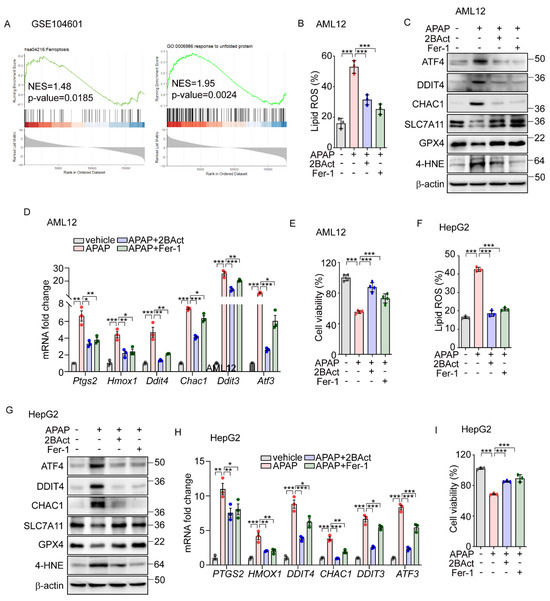
Figure 5.
Acentaminophen-induced ferroptosis is attenuated by inhibition of ISR in murine and human hepatocytes. (A) GSEA plot of transcriptomes from human liver organoids treated with APAP (10 mM) for 24 h. (B–E) APAP (20 mM) was treated for 12 h in the presence or absence of 2BAct (5 μM) or Fer-1 (5 μM) in AML12 cells. (B) Lipid ROS was stained with BODIPY™ 581/591 C11 and measured by flow cytometry. (C) Western blot analysis of indicated proteins. (D) Quantification of mRNA level of indicated genes. (E) Cell viability assessed by MTT. (F–I) APAP (20 mM) was treated for 24 h in the presence or absence of 2BAct (5 μM) or Fer-1 (5 μM) in HepG2 cells. (F) Lipid ROS was stained with BODIPY™ 581/591 C11 and measured by flow cytometry. (G) Western blot analysis of indicated proteins. (H) Quantification of mRNA level of indicated genes. (I) Cell viability assessed by MTT. Data are mean ± SD (n = 3); * p < 0.05, ** p < 0.01 and *** p < 0.001.
Building on data analysis from human primary hepatocytes (Figure 5A), we extended our investigation to determine whether APAP-induced eIF2α-ATF4 signaling and ferroptosis also impact human hepatocyte function. In human-hepatoma-cell-line HepG2 cells, APAP treatment significantly elevated the lipid peroxidation level which was significantly decreased by Fer-1 and 2BAct (Figure 5F). Similarly, these interventions normalized the altered protein levels of DDIT4, CHAC1, SLC7A11, and GPX4, and the amount of 4-HNE (Figure 5G). Additionally, the expression levels of ferroptosis-related genes were effectively restored by these treatments (Figure 5H). Furthermore, reductions in cell viability induced by APAP were significantly reversed by treatments with Fer-1 and 2BAct (Figure 5I). These results robustly suggest the crucial role of ferroptosis in APAP-induced hepatocyte dysfunction and highlight the mediating role of eIF2α-ATF4 signaling in this pathological process.
3.4. Inhibition of eIF2α-ATF4 Protects the Liver from Acetaminophen-Induced Ferroptotic Damage
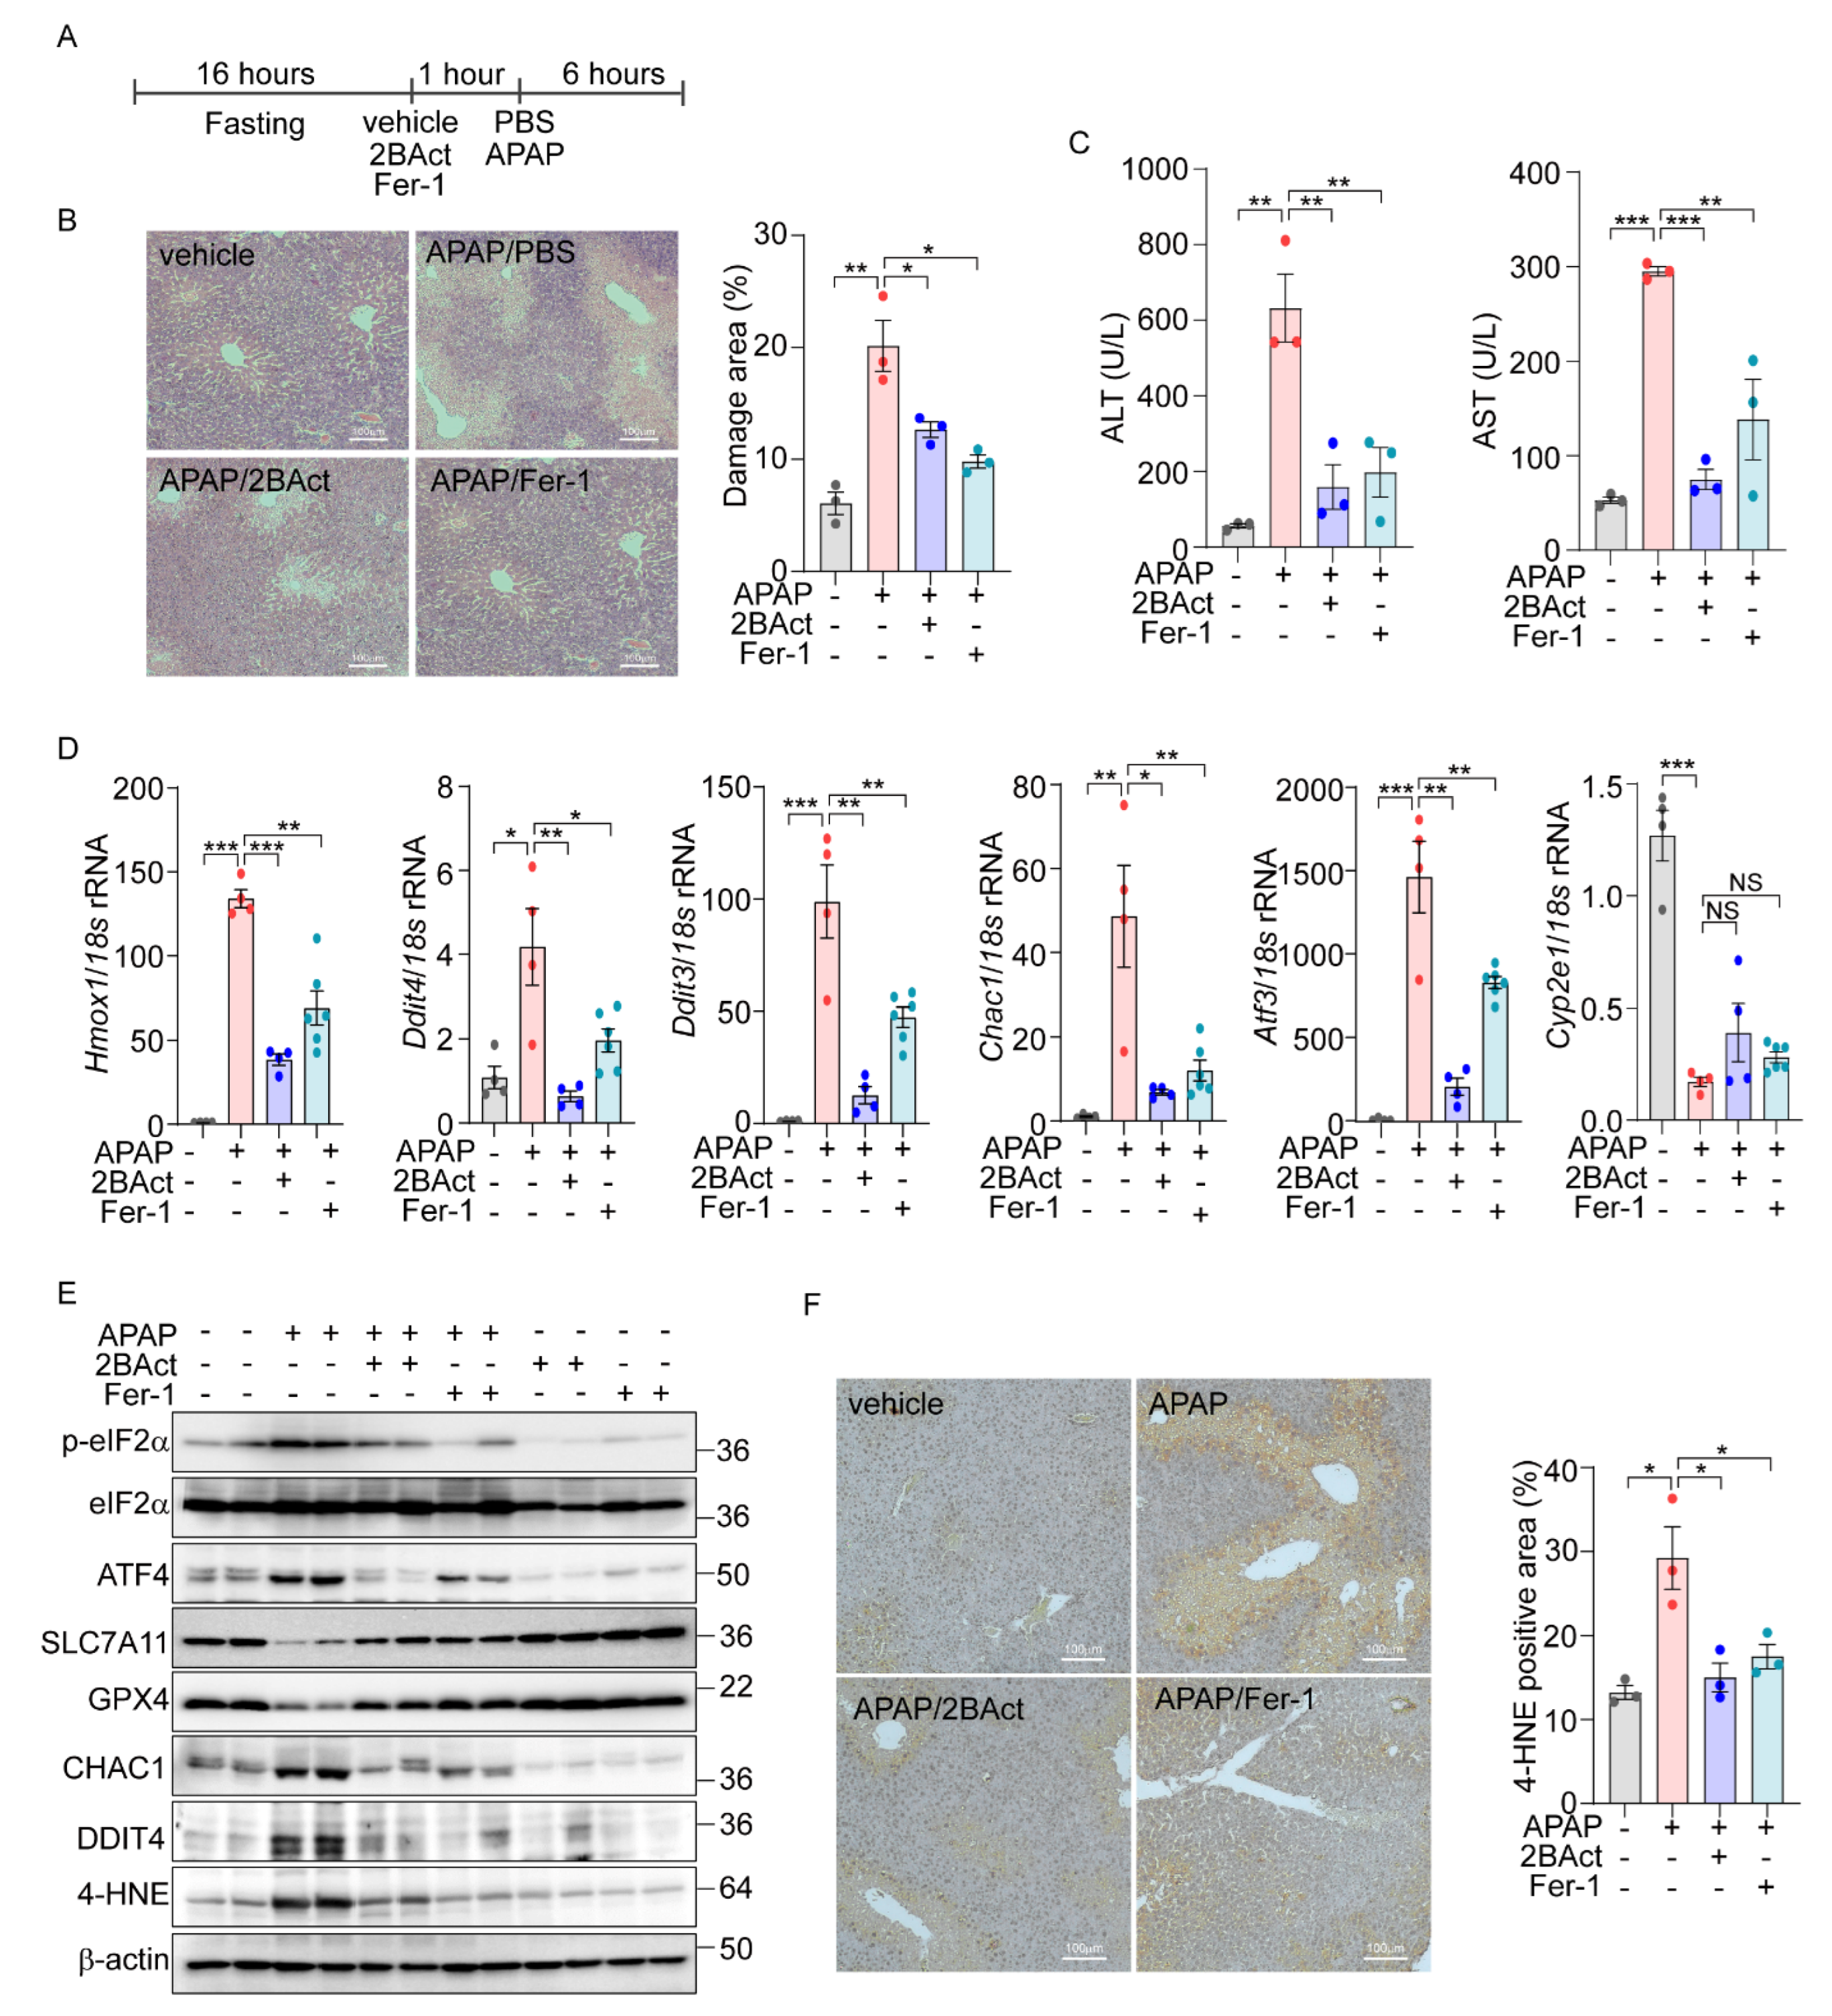
Next, we sought to translate our in vitro findings on eIF2α-ATF4-mediated ferroptosis into an in vivo context. Utilizing public datasets (PRJNA744757) from C57BL/6 wild-type mice treated with APAP (300 mg/kg) [40] and our own RNA-Seq data from MEFs treated with erastin, we conducted Gene Set Enrichment Analysis (GSEA). Our analysis revealed a significant upregulation of the KEGG ferroptosis pathway (mmu04216) in both APAP- and Erastin-treated samples (Supplementary Figure S6A). Additionally, the GO biological process associated with the response to unfolded protein showed significant upregulation, mirroring the cellular stress responses observed in vitro. Next, we overlapped differentially expressed genes from the in vivo datasets with ATF4 target genes identified previously [16]. This analysis revealed 86 overlapping genes, 20 of which were directly regulated by ATF4 (Supplementary Figure S6B). The expression patterns of these ATF4-regulated genes were visualized in heatmaps, providing a direct link between our in vitro discoveries and their physiological manifestations in vivo. Subsequently, we examined the specific induction of eIF2α-ATF4 signaling and ferroptosis in the liver after APAP administration. There was a notable upregulation of eIF2α-ATF4 and ferroptosis marker genes at 3 and 6 h post-injection, indicating active eIF2α-ATF4 and ferroptosis signaling pathways (Supplementary Figure S6C,D). To determine if inhibiting these pathways could mitigate APAP-induced liver damage, mice were pretreated with the eIF2α-ATF4 inhibitor 2BAct and the ferroptosis inhibitor Fer-1 (Figure 6A). Consistent with previous studies, APAP treatment led to increased necrosis in the liver, which was significantly mitigated by Fer-1. Similarly, 2BAct treatment effectively reduced the extent of necrotic areas caused by APAP (Figure 6B). In addition, the elevated ALT and AST levels induced by APAP were significantly decreased with these treatments (Figure 6C).
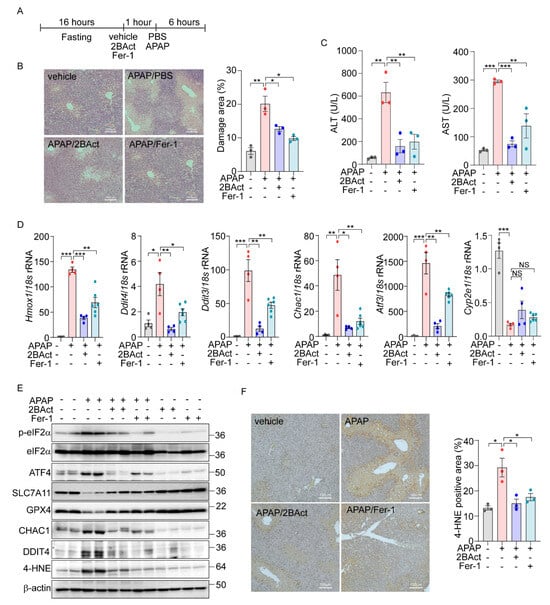
Figure 6.
Acetaminophen-induced liver damage is mediated by eIF2a-ATF4-driven ferroptosis. (A–F) 16 h-fasted-C57BL6/J mice (8–10 weeks) were intraperitoneally injected with vehicle, 2BAct (10 mg/kg), or Fer-1 (10 mg/kg) 1 h prior to PBS or APAP (200 mg/kg) injection. (A) Schematic diagram of experimental design. (B) Representative image of liver sections stained with Hematoxylin and Eosin (H&E). The percentage of damage areas were quantified by ImageJ software. (C) Serum levels of AST and ALT. (D) Quantification of mRNA level of indicated genes. (E) Western blot analysis of indicated proteins. (F) Representative image of liver section immunohistochemically stained against 4-HNE. The percentage of 4-HNE positive areas were quantified by ImageJ software. Data are mean ± SD (n = 3–6); * p < 0.05, ** p < 0.01 and *** p < 0.001.
Further, we assessed the impact of Fer-1 and 2BAct on the gene expression levels associated with ferroptosis and eIF2α-ATF4 signaling pathway. Treatment with these inhibitors significantly attenuated the APAP-induced upregulation of ferroptosis-related and eIF2α-ATF4-specific genes (Figure 6D). Notably, the expression of Cyp2e1, essential for the metabolic activation of APAP, remained unchanged, indicating that the protective mechanism of the inhibitors does not alter APAP metabolism.
Protein expression analyses also supported these findings, with significant changes in the levels of ferroptosis markers such as SLC7A11, GPX4, CHAC1, and DDIT4 observed following APAP exposure. These alterations were effectively reversed by treatment with 2BAct and Fer-1 (Figure 6E and Supplementary Figure S6E). Moreover, the concentration of 4-HNE was significantly elevated in APAP-treated livers but was markedly reduced by the 2BAct and Fer-1 treatment (Figure 6E and Supplementary Figure S6E). The localization of the 4-HNE expression to zone 3 of the liver, which is most susceptible to APAP damage, was also significantly diminished following inhibitor treatment (Figure 6F). These comprehensive findings strongly support the conclusion that APAP-induced liver damage is mediated through eIF2α-ATF4-induced ferroptosis.
4. Discussion
Ferroptosis is a specific type of cell death that is characterized by the accumulation of lipid peroxides and cellular iron [41]. Although a relationship between ferroptosis and ER stress is recognized, the specifics of their interaction have yet to be fully delineated. In our study, we established that the PERK-eIF2α-ATF4 signaling pathway plays an important role in mediating both ER-stress- and erastin-induced ferroptosis. Our findings demonstrated that both the genetic and pharmacological inhibition of this pathway significantly alleviated ER-stress- and erastin-induced ferroptosis. Conversely, the activation of this pathway markedly enhanced ferroptotic cell death. Central to this pathway, ATF4 emerged as a key regulator, orchestrating erastin-induced ferroptosis by suppressing mTORC1 signaling via DDIT4 induction. Additionally, our findings revealed that APAP also triggers hepatocyte and liver damage through eIF2α-ATF4-mediated ferroptosis. This expands the relevance of eIF2α-ATF4 and ferroptosis beyond the context of experimental inducers like erastin to clinically relevant scenarios involving common medications, underscoring the potential for targeted therapies that modulate these pathways to mitigate drug-induced liver injuries.
Since the discovery of ferroptosis in 2012 [41], significant progress has been made in elucidating its underlying mechanisms, which include excessive intracellular iron accumulation, glutathione (GSH) depletion, glutathione peroxidase 4 (GPX4) inactivation, and increased lipid peroxidation. The role of the eIF2α-ATF4 signaling pathway in ferroptosis has been explored; yet, their exact contributions remain contentious. Several studies have shown that ATF4 may drive ferroptosis. For instance, ATF4 was necessary for ferroptosis induced by cystine starvation, erastin, and artesunate [18,34,42,43,44]. Moreover, eIF2α-ATF4 activation has been implicated in conditions such as diabetic myocardial ischemia/reperfusion injury and traumatic brain injury, suggesting a broader role for ATF4 in stress-related ferroptotic signaling [45,46]. Conversely, other research indicates that ATF4 can confer protection against ferroptosis. The activation of ATF4 by YAP/TAZ has been shown to shield hepatocellular carcinoma cells from sorafenib-induced ferroptosis [47]. Similarly, ATF4 knockdown increased the susceptibility to ferroptosis in glioma cells treated with erastin and sorafenib [26]. Additional studies have demonstrated that the ATF4-induced expression of HSPA5, also known as BiP, can prevent GPX4 degradation and protect against ferroptosis in pancreatic ductal adenocarcinoma and glioma cells [24,25,26]. A recent study also highlighted ATF4’s protective role in preventing ferroptosis in cardiomyopathy caused by a Cox10 deficiency [48]. Given these conflicting roles, it is crucial that we clarify whether eIF2α-ATF4 activation exerts a protective or detrimental effect on ferroptosis. In this study, we demonstrate that the PERK-eIF2α-ATF4 signaling pathway plays a critical role in both erastin-induced ferroptosis as well as APAP-induced hepatotoxicity. While our findings underscore the role of the eIF2α-ATF4 signaling pathway in mediating ferroptosis, the potential protective effects of eIF2α-ATF4 against ferroptosis cannot be disregarded. This apparent discrepancy may stem from the dual nature of stress responses, which might initially protect cells from adverse effects but could lead to cell death under severe and prolonged stress conditions. Further research is necessary in order to resolve these ambiguities and fully understand the intricate dynamics of eIF2α-ATF4 signaling in ferroptosis.
Cell death is an essential physiological process that plays a critical role in normal development, tissue homeostasis, and the elimination of damaged or unwanted cells [2]. There are several forms of cell death, including apoptosis, necrosis, autophagy-dependent cell death, and, more recently discovered, ferroptosis [49]. It is established that prolonged and severe ER stress can lead to cell death through the apoptotic pathway. While the IRE1α/XBP1 signaling pathway has been shown to induce apoptosis via TRAF2-ASK1 activation or the RIDD pathway [50,51], many studies have highlighted the significance of the ATF4-CHOP signaling pathway in ER-stress-mediated cell death [52,53,54]. As a transcription factor, CHOP is known to activate several apoptotic genes, including PUMA [55], Bim [56], and DR5 [57]. Additionally, ATF4 is also implicated in ER-stress-mediated apoptosis by promoting the transactivation of CHOP. Interestingly, we observed that ChIP-seq analysis for ATF4 and CHOP did not identify the major apoptotic genes but identified those genes involved in protein synthesis and some genes related to ferroptosis [16]. In that study, we found that sustained ATF4 levels increased the translation rate, leading to energy consumption and increased ROS levels, which caused apoptotic cell death. Interestingly, we also identified various ferroptosis-related genes as targets of ATF4 [16]. In line with those observations, in this study, we found that ER-stress-induced cell death was prevented by ferrostatin-1 or Z-VAD, suggesting that the induction of ATF4 could also activate the ferroptotic as well as apoptotic signaling pathway leading to cell death. Therefore, it is likely that the activation of ATF4 by ER stress can lead to cell death and either ROS- or CHOP-dependent apoptosis or DDIT4-dependent ferroptosis. However, we cannot rule out the possibility that ROS generated by PERK-eIF2α-ATF4 activation may also contribute to the activation of additional cell death pathways beyond ferroptosis and apoptosis, warranting further investigation. Furthermore, it is plausible that PERK-eIF2α-ATF4 activation could influence iron-mediated ferroptosis; however, this was not explored in the current study. Given its significance, we plan to research this in future studies.
Although we showed that the activation of eIF2α-ATF4 by PERK is involved in erastin-induced ferroptotic cell death, we cannot exclude the role of other eIF2α kinases in the ferroptotic signaling pathway induction. In fact, there are some reports that GCN2, HRI, and PKR may be involved in the stress-induced ferroptosis [16,25,34,58]; however, the exact mechanisms for how these kinases affect ferroptosis are not known. In this study, we showed that the activation of PERK by erastin caused mitochondrial morphological changes but still do not know how PERK activation induced mitochondrial morphological changes. Interestingly, PERK activation was shown to stimulate the cristae formation upon several stimuli [59,60,61]. In contrast, in line with our observations, there is another report that intermittent hypoxia in neuronal cells caused a mitochondrial cristae defect which was restored by the treatment of the PERK inhibitor [62]. Therefore, it is necessary that we elucidate the exact role of PERK in ferroptosis-related mitochondrial morphological changes.
Since its discovery, ferroptosis has been implicated in a range of physiological roles including tumor suppression, immunity, and protection against ischemic organ damage [4]. Our study extends this focus to drug-induced liver injury, specifically exploring how APAP induces hepatotoxicity through eIF2α-ATF4-mediated ferroptosis. APAP overdose is a leading cause of drug-induced liver failure in the United States, though the precise mechanisms of cell death have remained somewhat elusive [35]. Our findings reveal that APAP triggers an induction of the eIF2α-ATF4 signaling pathway and promotes ferroptosis. The link between eIF2α-ATF4 and ferroptosis was substantiated by our observations that inhibiting eIF2α-ATF4 signaling could attenuate ferroptosis activation and mitigate subsequent liver damage. Importantly, treatments targeting eIF2α-ATF4 and ferroptosis did not alter the Cyp2e1 expression, indicating that these interventions do not affect APAP metabolism or the generation of NAPQI—the highly reactive metabolite primarily responsible for APAP-induced hepatotoxicity [63]. NAPQI is known to form protein adducts and induce mitochondrial oxidative stress and dysfunction, which, in turn, might activate the eIF2α-ATF4 signaling pathway and promote ferroptosis. These insights position the eIF2α-ATF4 signaling pathway as a potential therapeutic target for preventing liver injury from APAP overdoses. The discovery will open new avenues for using eIF2α-ATF4 inhibitors to treat or prevent liver damage, especially from drug-induced causes. However, further research is necessary in order to understand the role of the eIF2α-ATF4 signaling pathway across various models of liver damage and to determine the long-term safety of eIF2α-ATF4-targeted therapies in clinical settings.
In conclusion, our study elucidates the molecular mechanisms underlying the induction of ferroptosis by erastin, and the role of the UPR in this process, and extends these findings to a clinically relevant model of drug-induced liver injury using APAP. We demonstrate that a substantial portion of erastin-induced ferroptosis is mediated through the PERK-eIF2α-ATF4 signaling pathway and that similar pathways are activated by APAP to induce hepatotoxicity. Importantly, inhibiting the eIF2α-ATF4 signaling pathway can protect cells from ferroptotic death induced by both erastin and APAP. These insights not only advance our understanding of ferroptosis but also highlight the therapeutic potential of targeting components of the eIF2α-ATF4 signaling pathway to treat or prevent diseases associated with abnormal ferroptosis, such as drug-induced liver injury. Further research is required in order to explore how the ER-stress-induced eIF2α-ATF4 signaling pathway interacts with ferroptotic signaling pathways and to identify potential therapeutic targets for diseases characterized by these complex cellular dynamics.
Supplementary Materials
The following supporting information can be downloaded at: https://www.mdpi.com/article/10.3390/antiox14030307/s1.
Author Contributions
J.H. and H.T.C. contributed to the conception and design of the experiments and were responsible for data collection, analysis, and interpretation. T.-H.T.N., K.A.N., F.K., J.P., S.P. and Y.J. contributed methodology, investigation, and data curation. T.-H.T.N., K.A.N., Y.J., J.H. and H.T.C. drafted the article. All authors have read and agreed to the published version of the manuscript.
Funding
This work was supported by the Priority Research Centers Program through the National Research Foundation of Korea (NRF) funded by the Ministry of Education (2018R1A5A2025272, RS-2023-00244373 to H.T.C.) and (2022R1A2C1010676, 2019R1A5A8083404 to J.H.).
Institutional Review Board Statement
The animal study protocol was approved by the Institutional Ethics Committee of Soonchunhyang University (SCH25-0006 and 0301-2022).
Data Availability Statement
The data are available in the article itself and its Supplementary Materials.
Conflicts of Interest
The authors declare no conflict of interest.
References
- Stockwell, B.R. Ferroptosis turns 10: Emerging mechanisms, physiological functions, and therapeutic applications. Cell 2022, 185, 2401–2421. [Google Scholar] [CrossRef] [PubMed]
- Tang, D.; Kang, R.; Berghe, T.V.; Vandenabeele, P.; Kroemer, G. The molecular machinery of regulated cell death. Cell Res. 2019, 29, 347–364. [Google Scholar] [CrossRef]
- Feng, H.; Stockwell, B.R. Unsolved mysteries: How does lipid peroxidation cause ferroptosis? PLoS Biol. 2018, 16, e2006203. [Google Scholar] [CrossRef]
- Jiang, X.; Stockwell, B.R.; Conrad, M. Ferroptosis: Mechanisms, biology and role in disease. Nat. Rev. Mol. Cell Biol. 2021, 22, 266–282. [Google Scholar] [CrossRef]
- Dixon, S.J.; Olzmann, J.A. The cell biology of ferroptosis. Nat. Rev. Mol. Cell Biol. 2024, 25, 424–442. [Google Scholar] [CrossRef] [PubMed]
- Chen, X.; Kang, R.; Kroemer, G.; Tang, D. Organelle-specific regulation of ferroptosis. Cell Death Differ. 2021, 28, 2843–2856. [Google Scholar] [CrossRef] [PubMed]
- Yong, J.; Johnson, J.D.; Arvan, P.; Han, J.; Kaufman, R.J. Therapeutic opportunities for pancreatic beta-cell ER stress in diabetes mellitus. Nat. Rev. Endocrinol. 2021, 17, 455–467. [Google Scholar] [CrossRef]
- Sano, R.; Reed, J.C. ER stress-induced cell death mechanisms. Biochim. Biophys. Acta 2013, 1833, 3460–3470. [Google Scholar] [CrossRef]
- Fu, X.; Cui, J.; Meng, X.; Jiang, P.; Zheng, Q.; Zhao, W.; Chen, X. Endoplasmic reticulum stress, cell death and tumor: Association between endoplasmic reticulum stress and the apoptosis pathway in tumors (Review). Oncol. Rep. 2021, 45, 801–808. [Google Scholar] [CrossRef]
- Han, J.; Kaufman, R.J. Physiological/pathological ramifications of transcription factors in the unfolded protein response. Genes. Dev. 2017, 31, 1417–1438. [Google Scholar] [CrossRef] [PubMed]
- Harding, H.P.; Zhang, Y.; Ron, D. Protein translation and folding are coupled by an endoplasmic-reticulum-resident kinase. Nature 1999, 397, 271–274. [Google Scholar] [CrossRef]
- Cox, J.S.; Shamu, C.E.; Walter, P. Transcriptional induction of genes encoding endoplasmic reticulum resident proteins requires a transmembrane protein kinase. Cell 1993, 73, 1197–1206. [Google Scholar] [CrossRef] [PubMed]
- Wang, Y.; Shen, J.; Arenzana, N.; Tirasophon, W.; Kaufman, R.J.; Prywes, R. Activation of ATF6 and an ATF6 DNA binding site by the endoplasmic reticulum stress response. J. Biol. Chem. 2000, 275, 27013–27020. [Google Scholar] [CrossRef] [PubMed]
- Hetz, C.; Papa, F.R. The Unfolded Protein Response and Cell Fate Control. Mol. Cell 2018, 69, 169–181. [Google Scholar] [CrossRef] [PubMed]
- Hetz, C.; Zhang, K.; Kaufman, R.J. Mechanisms, regulation and functions of the unfolded protein response. Nat. Rev. Mol. Cell Biol. 2020, 21, 421–438. [Google Scholar] [CrossRef]
- Han, J.; Back, S.H.; Hur, J.; Lin, Y.H.; Gildersleeve, R.; Shan, J.; Yuan, C.L.; Krokowski, D.; Wang, S.; Hatzoglou, M.; et al. ER-stress-induced transcriptional regulation increases protein synthesis leading to cell death. Nat. Cell Biol. 2013, 15, 481–490. [Google Scholar] [CrossRef]
- Lee, Y.S.; Lee, D.H.; Choudry, H.A.; Bartlett, D.L.; Lee, Y.J. Ferroptosis-Induced Endoplasmic Reticulum Stress: Cross-talk between Ferroptosis and Apoptosis. Mol. Cancer Res. 2018, 16, 1073–1076. [Google Scholar] [CrossRef]
- Dixon, S.J.; Patel, D.N.; Welsch, M.; Skouta, R.; Lee, E.D.; Hayano, M.; Thomas, A.G.; Gleason, C.E.; Tatonetti, N.P.; Slusher, B.S.; et al. Pharmacological inhibition of cystine-glutamate exchange induces endoplasmic reticulum stress and ferroptosis. eLife 2014, 3, e02523. [Google Scholar] [CrossRef]
- Rahmani, M.; Davis, E.M.; Crabtree, T.R.; Habibi, J.R.; Nguyen, T.K.; Dent, P.; Grant, S. The kinase inhibitor sorafenib induces cell death through a process involving induction of endoplasmic reticulum stress. Mol. Cell Biol. 2007, 27, 5499–5513. [Google Scholar] [CrossRef]
- Zheng, X.; Liu, B.; Liu, X.; Li, P.; Zhang, P.; Ye, F.; Zhao, T.; Kuang, Y.; Chen, W.; Jin, X.; et al. PERK Regulates the Sensitivity of Hepatocellular Carcinoma Cells to High-LET Carbon Ions via either Apoptosis or Ferroptosis. J. Cancer 2022, 13, 669–680. [Google Scholar] [CrossRef]
- Xu, Y.; Zhang, N.; Chen, C.; Xu, X.; Luo, A.; Yan, Y.; Lu, Y.; Liu, J.; Ou, X.; Tan, Y.; et al. Sevoflurane Induces Ferroptosis of Glioma Cells Through Activating the ATF4-CHAC1 Pathway. Front. Oncol. 2022, 12, 859621. [Google Scholar] [CrossRef] [PubMed]
- Kitakata, H.; Endo, J.; Matsushima, H.; Yamamoto, S.; Ikura, H.; Hirai, A.; Koh, S.; Ichihara, G.; Hiraide, T.; Moriyama, H.; et al. MITOL/MARCH5 determines the susceptibility of cardiomyocytes to doxorubicin-induced ferroptosis by regulating GSH homeostasis. J. Mol. Cell Cardiol. 2021, 161, 116–129. [Google Scholar] [CrossRef] [PubMed]
- He, S.; Zhang, M.; Ye, Y.; Zhuang, J.; Ma, X.; Song, Y.; Xia, W. ChaC glutathione specific gamma-glutamylcyclotransferase 1 inhibits cell viability and increases the sensitivity of prostate cancer cells to docetaxel by inducing endoplasmic reticulum stress and ferroptosis. Exp. Ther. Med. 2021, 22, 997. [Google Scholar] [CrossRef]
- Zhu, S.; Zhang, Q.; Sun, X.; Zeh, H.J., 3rd; Lotze, M.T.; Kang, R.; Tang, D. HSPA5 Regulates Ferroptotic Cell Death in Cancer Cells. Cancer Res. 2017, 77, 2064–2077. [Google Scholar] [CrossRef] [PubMed]
- Chen, Y.; Mi, Y.; Zhang, X.; Ma, Q.; Song, Y.; Zhang, L.; Wang, D.; Xing, J.; Hou, B.; Li, H.; et al. Dihydroartemisinin-induced unfolded protein response feedback attenuates ferroptosis via PERK/ATF4/HSPA5 pathway in glioma cells. J. Exp. Clin. Cancer Res. 2019, 38, 402. [Google Scholar] [CrossRef]
- Chen, D.; Fan, Z.; Rauh, M.; Buchfelder, M.; Eyupoglu, I.Y.; Savaskan, N. ATF4 promotes angiogenesis and neuronal cell death and confers ferroptosis in a xCT-dependent manner. Oncogene 2017, 36, 5593–5608. [Google Scholar] [CrossRef]
- Teske, B.F.; Wek, S.A.; Bunpo, P.; Cundiff, J.K.; McClintick, J.N.; Anthony, T.G.; Wek, R.C. The eIF2 kinase PERK and the integrated stress response facilitate activation of ATF6 during endoplasmic reticulum stress. Mol. Biol. Cell 2011, 22, 4390–4405. [Google Scholar] [CrossRef]
- Perea, V.; Baron, K.R.; Dolina, V.; Aviles, G.; Kim, G.; Rosarda, J.D.; Guo, X.; Kampmann, M.; Wiseman, R.L. Pharmacologic activation of a compensatory integrated stress response kinase promotes mitochondrial remodeling in PERK-deficient cells. Cell Chem. Biol. 2023, 30, 1571–1584.e5. [Google Scholar] [CrossRef]
- Axten, J.M.; Medina, J.R.; Feng, Y.; Shu, A.; Romeril, S.P.; Grant, S.W.; Li, W.H.; Heerding, D.A.; Minthorn, E.; Mencken, T.; et al. Discovery of 7-methyl-5-(1-[3-(trifluoromethyl)phenyl]acetyl-2,3-dihydro-1H-indol-5-yl)-7H-pyrrolo[2,3-d]pyrimidin-4-amine (GSK2606414), a potent and selective first-in-class inhibitor of protein kinase R (PKR)-like endoplasmic reticulum kinase (PERK). J. Med. Chem. 2012, 55, 7193–7207. [Google Scholar] [CrossRef]
- Sidrauski, C.; Acosta-Alvear, D.; Khoutorsky, A.; Vedantham, P.; Hearn, B.R.; Li, H.; Gamache, K.; Gallagher, C.M.; Ang, K.K.; Wilson, C.; et al. Pharmacological brake-release of mRNA translation enhances cognitive memory. eLife 2013, 2, e00498. [Google Scholar] [CrossRef]
- Kilberg, M.S.; Shan, J.; Su, N. ATF4-dependent transcription mediates signaling of amino acid limitation. Trends Endocrinol. Metab. 2009, 20, 436–443. [Google Scholar] [CrossRef]
- Zhang, Y.; Swanda, R.V.; Nie, L.; Liu, X.; Wang, C.; Lee, H.; Lei, G.; Mao, C.; Koppula, P.; Cheng, W.; et al. mTORC1 couples cyst(e)ine availability with GPX4 protein synthesis and ferroptosis regulation. Nat. Commun. 2021, 12, 1589. [Google Scholar] [CrossRef] [PubMed]
- Katiyar, S.; Liu, E.; Knutzen, C.A.; Lang, E.S.; Lombardo, C.R.; Sankar, S.; Toth, J.I.; Petroski, M.D.; Ronai, Z.; Chiang, G.G. REDD1, an inhibitor of mTOR signalling, is regulated by the CUL4A-DDB1 ubiquitin ligase. EMBO Rep. 2009, 10, 866–872. [Google Scholar] [CrossRef]
- Whitney, M.L.; Jefferson, L.S.; Kimball, S.R. ATF4 is necessary and sufficient for ER stress-induced upregulation of REDD1 expression. Biochem. Biophys. Res. Commun. 2009, 379, 451–455. [Google Scholar] [CrossRef]
- Larson, A.M.; Polson, J.; Fontana, R.J.; Davern, T.J.; Lalani, E.; Hynan, L.S.; Reisch, J.S.; Schiodt, F.V.; Ostapowicz, G.; Shakil, A.O.; et al. Acetaminophen-induced acute liver failure: Results of a United States multicenter, prospective study. Hepatology 2005, 42, 1364–1372. [Google Scholar] [CrossRef] [PubMed]
- Yamada, N.; Karasawa, T.; Kimura, H.; Watanabe, S.; Komada, T.; Kamata, R.; Sampilvanjil, A.; Ito, J.; Nakagawa, K.; Kuwata, H.; et al. Ferroptosis driven by radical oxidation of n-6 polyunsaturated fatty acids mediates acetaminophen-induced acute liver failure. Cell Death Dis. 2020, 11, 144. [Google Scholar] [CrossRef] [PubMed]
- Lorincz, T.; Jemnitz, K.; Kardon, T.; Mandl, J.; Szarka, A. Ferroptosis is Involved in Acetaminophen Induced Cell Death. Pathol. Oncol. Res. 2015, 21, 1115–1121. [Google Scholar] [CrossRef]
- Jiang, J.; Messner, S.; Kelm, J.M.; van Herwijnen, M.; Jennen, D.G.J.; Kleinjans, J.C.; de Kok, T.M. Human 3D multicellular microtissues: An upgraded model for the in vitro mechanistic investigation of inflammation-associated drug toxicity. Toxicol. Lett. 2019, 312, 34–44. [Google Scholar] [CrossRef]
- Wong, Y.L.; LeBon, L.; Basso, A.M.; Kohlhaas, K.L.; Nikkel, A.L.; Robb, H.M.; Donnelly-Roberts, D.L.; Prakash, J.; Swensen, A.M.; Rubinstein, N.D.; et al. eIF2B activator prevents neurological defects caused by a chronic integrated stress response. eLife 2019, 8, e42940. [Google Scholar] [CrossRef]
- Niu, B.; Lei, X.; Xu, Q.; Ju, Y.; Xu, D.; Mao, L.; Li, J.; Zheng, Y.; Sun, N.; Zhang, X.; et al. Protecting mitochondria via inhibiting VDAC1 oligomerization alleviates ferroptosis in acetaminophen-induced acute liver injury. Cell Biol. Toxicol. 2022, 38, 505–530. [Google Scholar] [CrossRef]
- Dixon, S.J.; Lemberg, K.M.; Lamprecht, M.R.; Skouta, R.; Zaitsev, E.M.; Gleason, C.E.; Patel, D.N.; Bauer, A.J.; Cantley, A.M.; Yang, W.S.; et al. Ferroptosis: An iron-dependent form of nonapoptotic cell death. Cell 2012, 149, 1060–1072. [Google Scholar] [CrossRef] [PubMed]
- Chen, M.S.; Wang, S.F.; Hsu, C.Y.; Yin, P.H.; Yeh, T.S.; Lee, H.C.; Tseng, L.M. CHAC1 degradation of glutathione enhances cystine-starvation-induced necroptosis and ferroptosis in human triple negative breast cancer cells via the GCN2-eIF2alpha-ATF4 pathway. Oncotarget 2017, 8, 114588–114602. [Google Scholar] [CrossRef]
- Cho, I.J.; Kim, D.; Kim, E.O.; Jegal, K.H.; Kim, J.K.; Park, S.M.; Zhao, R.; Ki, S.H.; Kim, S.C.; Ku, S.K. Cystine and Methionine Deficiency Promotes Ferroptosis by Inducing B-Cell Translocation Gene 1. Antioxidants 2021, 10, 1543. [Google Scholar] [CrossRef] [PubMed]
- Wang, N.; Zeng, G.Z.; Yin, J.L.; Bian, Z.X. Artesunate activates the ATF4-CHOP-CHAC1 pathway and affects ferroptosis in Burkitt’s Lymphoma. Biochem. Biophys. Res. Commun. 2019, 519, 533–539. [Google Scholar] [CrossRef] [PubMed]
- Li, W.; Li, W.; Leng, Y.; Xiong, Y.; Xia, Z. Ferroptosis Is Involved in Diabetes Myocardial Ischemia/Reperfusion Injury Through Endoplasmic Reticulum Stress. DNA Cell Biol. 2020, 39, 210–225. [Google Scholar] [CrossRef]
- Ratan, R.R. The Chemical Biology of Ferroptosis in the Central Nervous System. Cell Chem. Biol. 2020, 27, 479–498. [Google Scholar] [CrossRef]
- Gao, R.; Kalathur, R.K.R.; Coto-Llerena, M.; Ercan, C.; Buechel, D.; Shuang, S.; Piscuoglio, S.; Dill, M.T.; Camargo, F.D.; Christofori, G.; et al. YAP/TAZ and ATF4 drive resistance to Sorafenib in hepatocellular carcinoma by preventing ferroptosis. EMBO Mol. Med. 2021, 13, e14351. [Google Scholar] [CrossRef]
- Ahola, S.; Rivera Mejias, P.; Hermans, S.; Chandragiri, S.; Giavalisco, P.; Nolte, H.; Langer, T. OMA1-mediated integrated stress response protects against ferroptosis in mitochondrial cardiomyopathy. Cell Metab. 2022, 34, 1875–1891.e1877. [Google Scholar] [CrossRef]
- Li, J.; Cao, F.; Yin, H.L.; Huang, Z.J.; Lin, Z.T.; Mao, N.; Sun, B.; Wang, G. Ferroptosis: Past, present and future. Cell Death Dis. 2020, 11, 88. [Google Scholar] [CrossRef]
- Sisinni, L.; Pietrafesa, M.; Lepore, S.; Maddalena, F.; Condelli, V.; Esposito, F.; Landriscina, M. Endoplasmic Reticulum Stress and Unfolded Protein Response in Breast Cancer: The Balance between Apoptosis and Autophagy and Its Role in Drug Resistance. Int. J. Mol. Sci. 2019, 20, 857. [Google Scholar] [CrossRef]
- Gomora-Garcia, J.C.; Geronimo-Olvera, C.; Perez-Martinez, X.; Massieu, L. IRE1alpha RIDD activity induced under ER stress drives neuronal death by the degradation of 14-3-3 theta mRNA in cortical neurons during glucose deprivation. Cell Death Discov. 2021, 7, 131. [Google Scholar] [CrossRef] [PubMed]
- Galehdar, Z.; Swan, P.; Fuerth, B.; Callaghan, S.M.; Park, D.S.; Cregan, S.P. Neuronal apoptosis induced by endoplasmic reticulum stress is regulated by ATF4-CHOP-mediated induction of the Bcl-2 homology 3-only member PUMA. J. Neurosci. 2010, 30, 16938–16948. [Google Scholar] [CrossRef]
- Wang, M.G.; Fan, R.F.; Li, W.H.; Zhang, D.; Yang, D.B.; Wang, Z.Y.; Wang, L. Activation of PERK-eIF2alpha-ATF4-CHOP axis triggered by excessive ER stress contributes to lead-induced nephrotoxicity. Biochim. Biophys. Acta Mol. Cell Res. 2019, 1866, 713–726. [Google Scholar] [CrossRef]
- Iurlaro, R.; Munoz-Pinedo, C. Cell death induced by endoplasmic reticulum stress. FEBS J. 2016, 283, 2640–2652. [Google Scholar] [CrossRef] [PubMed]
- Cazanave, S.C.; Elmi, N.A.; Akazawa, Y.; Bronk, S.F.; Mott, J.L.; Gores, G.J. CHOP and AP-1 cooperatively mediate PUMA expression during lipoapoptosis. Am. J. Physiol. Gastrointest. Liver Physiol. 2010, 299, G236–G243. [Google Scholar] [CrossRef]
- Puthalakath, H.; O’Reilly, L.A.; Gunn, P.; Lee, L.; Kelly, P.N.; Huntington, N.D.; Hughes, P.D.; Michalak, E.M.; McKimm-Breschkin, J.; Motoyama, N.; et al. ER stress triggers apoptosis by activating BH3-only protein Bim. Cell 2007, 129, 1337–1349. [Google Scholar] [CrossRef] [PubMed]
- Yamaguchi, H.; Wang, H.G. CHOP is involved in endoplasmic reticulum stress-induced apoptosis by enhancing DR5 expression in human carcinoma cells. J. Biol. Chem. 2004, 279, 45495–45502. [Google Scholar] [CrossRef]
- Lei, J.; Song, S.; Chen, Z.; Shu, S.; Liu, Q.; Hu, W. The protective mechanism of protein kinase R to inhibit neuronal ferroptosis in cerebral injury from subarachnoid hemorrhage. Brain Behav. 2022, 12, e2722. [Google Scholar] [CrossRef]
- Hirata, Y.; Iwasaki, T.; Makimura, Y.; Okajima, S.; Oh-Hashi, K.; Takemori, H. Inhibition of double-stranded RNA-dependent protein kinase prevents oxytosis and ferroptosis in mouse hippocampal HT22 cells. Toxicology 2019, 418, 1–10. [Google Scholar] [CrossRef]
- Kato, H.; Okabe, K.; Miyake, M.; Hattori, K.; Fukaya, T.; Tanimoto, K.; Beini, S.; Mizuguchi, M.; Torii, S.; Arakawa, S.; et al. ER-resident sensor PERK is essential for mitochondrial thermogenesis in brown adipose tissue. Life Sci. Alliance 2020, 3, e201900576. [Google Scholar] [CrossRef]
- Balsa, E.; Soustek, M.S.; Thomas, A.; Cogliati, S.; Garcia-Poyatos, C.; Martin-Garcia, E.; Jedrychowski, M.; Gygi, S.P.; Enriquez, J.A.; Puigserver, P. ER and Nutrient Stress Promote Assembly of Respiratory Chain Supercomplexes through the PERK-eIF2alpha Axis. Mol. Cell 2019, 74, 877–890.e6. [Google Scholar] [CrossRef] [PubMed]
- Xu, L.; Bi, Y.; Xu, Y.; Wu, Y.; Du, X.; Mou, Y.; Chen, J. Suppression of CHOP Reduces Neuronal Apoptosis and Rescues Cognitive Impairment Induced by Intermittent Hypoxia by Inhibiting Bax and Bak Activation. Neural Plast. 2021, 2021, 4090441. [Google Scholar] [CrossRef] [PubMed]
- Jaeschke, H.; McGill, M.R.; Ramachandran, A. Oxidant stress, mitochondria, and cell death mechanisms in drug-induced liver injury: Lessons learned from acetaminophen hepatotoxicity. Drug Metab. Rev. 2012, 44, 88–106. [Google Scholar] [CrossRef] [PubMed]
Disclaimer/Publisher’s Note: The statements, opinions and data contained in all publications are solely those of the individual author(s) and contributor(s) and not of MDPI and/or the editor(s). MDPI and/or the editor(s) disclaim responsibility for any injury to people or property resulting from any ideas, methods, instructions or products referred to in the content. |
© 2025 by the authors. Licensee MDPI, Basel, Switzerland. This article is an open access article distributed under the terms and conditions of the Creative Commons Attribution (CC BY) license (https://creativecommons.org/licenses/by/4.0/).