Article

Possible A2E Mutagenic Effects on RPE Mitochondrial DNA from Innovative RNA-Seq Bioinformatics Pipeline

1
Department of Biomedical and Dental Sciences and Morphofunctional Imaging, Division of Medical Biotechnologies and Preventive Medicine, University of Messina, 98125 Messina, Italy
2
Department of Biomolecular strategies, genetics and avant-garde therapies, I.E.ME.S.T., 90139 Palermo, Italy
3
Department of Chemical, Biological, Pharmaceutical and Environmental Sciences, University of Messina, 98125 Messina, Italy
4
Department of Biomedicine Neuroscience and Advanced Diagnostics, University of Palermo, 90127 Palermo, Italy
*
Author to whom correspondence should be addressed.
Antioxidants 2020, 9(11), 1158; https://doi.org/10.3390/antiox9111158
Submission received: 28 September 2020 / Revised: 12 November 2020 / Accepted: 18 November 2020 / Published: 20 November 2020
(This article belongs to the Special Issue Oxidative Stress and Inflammation in Retinal Degeneration)

Abstract

:
Mitochondria are subject to continuous oxidative stress stimuli that, over time, can impair their genome and lead to several pathologies, like retinal degenerations. Our main purpose was the identification of mtDNA variants that might be induced by intense oxidative stress determined by N-retinylidene-N-retinylethanolamine (A2E), together with molecular pathways involving the genes carrying them, possibly linked to retinal degeneration. We performed a variant analysis comparison between transcriptome profiles of human retinal pigment epithelial (RPE) cells exposed to A2E and untreated ones, hypothesizing that it might act as a mutagenic compound towards mtDNA. To optimize analysis, we proposed an integrated approach that foresaw the complementary use of the most recent algorithms applied to mtDNA data, characterized by a mixed output coming from several tools and databases. An increased number of variants emerged following treatment. Variants mainly occurred within mtDNA coding sequences, corresponding with either the polypeptide-encoding genes or the RNA. Time-dependent impairments foresaw the involvement of all oxidative phosphorylation complexes, suggesting a serious damage to adenosine triphosphate (ATP) biosynthesis, that can result in cell death. The obtained results could be incorporated into clinical diagnostic settings, as they are hypothesized to modulate the phenotypic expression of mtDNA pathogenic variants, drastically improving the field of precision molecular medicine.

1. Introduction

1.1. Mitochondria Represent the Most Intriguing Organelle of Eucaryotic Cell

Mitochondria represent one of the most crucial and interesting organelles of eukaryotic cells. The major role of mitochondria consists of production of cellular adenosine triphosphate (ATP) and the establishment of membrane potential by oxidative phosphorylation [1]. Such activities can be realized thanks to the involvement of a huge number of proteins, most of which are encoded by the nuclear genome and then translocated to mitochondria [2]. However, the most exciting aspect of mitochondria resides in the uniqueness of its own genome (mtDNA), a double-stranded circular molecule of about 16,600 nt encoding for only thirteen polypeptides of the oxidative phosphorylation complex (OXPHOS), along with twenty-two tRNAs and two rRNAs (12S and 16S). The most polymorphic site of mtDNA is the non-coding portion situated within a 1 kb noncoding region (NCR), which can regulate both transcription and translation [3].

1.2. mtDNA Damage is Linked to Heterogeneous Clinical Phenotypes

Today, it is well known that a protracted accumulation of lower levels of mtDNA damage and mtDNA copy reduction could be linked to the etiopathogenesis of neurodegenerative and metabolic age-related diseases [4]. Mitochondrial damages, showing an incidence of about 1:4300, primarily affect oxidative phosphorylation but, due to several mitochondrial proteins encoded by the nuclear genome, the derived clinical phenotypes are significantly heterogeneous [5]. Despite the actual number of about 15,000 variants reported in the constantly updated MITOMAP human mitochondrial genome database [6], only a few hundred are confirmed as disease causing. These mutations are at the basis of a wide spectrum of maternally inherited diseases, characterized by high heterogeneity of both pathological phenotype and penetrance, primarily deriving from shifts and differences in the mutant load, due to stochastic segregation of mtDNA during cellular divisions. Consequently, the mutation load could range from 100% mutant load (homoplasmy) to the coexistence of both mutant and wildtype molecules (heteroplasmy), also varying across different tissues and organs. An increase in the level of heteroplasmy corresponds to a decrease in energy production to the minimum threshold needed for cell physiological homeostasis, leading to the onset of symptoms [7].

1.3. Next Generation Sequencing Techniques could Reveal a Relevant Role of mtDNA Impairments in Retinal Degenerations

Several reports highlighted mtDNA damage as an important contributing factor in retinal degeneration-related pathologies [8,9]. It was stated that mtDNA is more disposed to damage than nuclear DNA, and it seems that retinal mtDNA damage preferentially occurs in the macula rather than in the periphery [10]. Another challenge is represented by mutagenesis of mtDNA related to the efficacy of DNA repair enzymes, encoded by the nuclear genome but imported into the mitochondria to exert their function [11]. Therefore, DNA damage response in mitochondria (mtDDR) in retinal diseases presents many unknown molecular aspects that should be unveiled. Today, the advances in next generation sequencing (NGS) techniques has permitted to perform reliable analysis of mtDNA, improving sample output and sensitivity of variant detection [12], even if several limits remain. Main challenge that will be faced working with mtDNA massive parallel sequencing regard variants unrelated to exhibited phenotype, detection and interpretation of low heteroplasmy and homoplasmy levels and identification of variants of unknown significance (VUS) [13].

1.4. Evaluating mtDNA Damage by Mitochondrial Transcript Analysis in Photo-Induced Oxidative Stressed RPE Cells could Shed Light on the Role of Mitochondria in Retinal Dystrophies

To better understand how high ROS levels induced by oxidative stress can damage mtDNA, influencing retinal degeneration onset and progress, we performed a variant analysis comparison from transcriptome profiles of human RPE cells exposed to the oxidant agent N-retinylidene-N-retinylethanolamine (A2E) and untreated ones. The RPE cells are highly susceptible to oxidative/nitrosative stress, because they are frequently exposed to blue light and reside in an environment with high oxygen tension [14]. The most reliable model depicting cellular causes of this condition regards the blue light induced mitochondrial fusion/fission imbalance towards mitochondrial fragmentation. This phenomenon correlated with the dysregulation of mitochondria-shaping and mitochondria dynamics-related protein levels, together with up-regulation of mitochondrial mitotic proteins and down-regulation of fusion proteins [15]. Moreover, blue light could destroy mitochondrial calcium homeostasis, impairing the transmembrane potential (MPP) and increasing mitochondrial membrane permeability [16]. The first stages of RPE degeneration usually imply the accumulation of metabolic waste between choroidal and RPE layers, called drusen. Drusen consist of mixtures of high photo-sensitive lipofuscin, involved in the first photo-sensitive reactions, caused by the generation of singlet oxygen and superoxide anion. A2E is one of the most abundant components of drusen, and a direct transmittal of light to the retina by drusen determines its cleavage at the pyridinium ring, inducing oxidative stress [17,18,19]. Thus, the main purpose of our study was the identification of mtDNA variants that might be induced by intense oxidative stress, together with their possible related molecular pathways most likely linked to retinal degeneration onset and/or progression. We tried to reach this objective using an innovative pipeline, starting from RNA-Seq data and focusing on mitochondrial transcripts.

2. Materials and Methods

2.1. Cell Culture Samples

Human Retinal Pigment Epithelial Cells (H-RPE, Clonetics™, Lonza, Walkersville, MD, USA) were cultivated and then grown for 24 h until confluence, as previously described [20]. Successively, a group of cells was treated with A2E 20 μM for 3 h and 6 h before rinsing with medium, while a control group was incubated without the oxidant compound. Lastly, confluent cultures were transferred to PBS-CMG and then subjected to blue light delivered by a tungsten halogen source (470 ± 20 nm; 0.4 mW/mm2) for 30 min, in order to induce phototoxicity of A2E, and incubated at 37 °C for 24 h. Each sample of cells foresaw three biological replicates.

2.2. MTT Assay

The cell viability was evaluated by the mitochondrial-dependent reduction of methylthiazolyldiphenyl-tetrazolium bromide (MTT) (Sigma-Aldrich, St. Louis, MO, USA) to formazan insoluble crystals, following an already defined protocol [20]. Ultimately, a Dynatech microplate reader allowed us to estimate absorbance at 570 nm, and the results were expressed as a percentage of viable cells compared with control conditions in the absence of A2E. Multiple t-tests were performed for statistical comparisons (p < 0.05), considering three independent experiments, each one characterized by three replicates.

2.3. Whole RNA Extraction and RNA-Seq Profiling

Total RNA was isolated, checked for degradation and contamination, and quantified as previously reported [20]. The RNA-seq samples were classified in 3 factor groups, made of human RPE cells before A2E treatment and at the different time points of 3 h and 6 h, respectively. Each group was biologically replicated three times, for a total of 9 samples. Both 3 h and 6 h time points were chosen considering experiments previously realized by our research group (unpublished data), confirmed by outcomes derived from MTT assay in this work. Such results highlighted that in wider time intervals the death rate of oxidative stressed cells might be so high as to invalidate the following data analysis. Libraries were generated using 1 µg of total RNA by the TruSeq Stranded Total RNA Sample Prep Kit with Ribo-Zero H/M/R (Illumina, San Diego, CA, USA), following manufacturer’s protocols. The concluding step foresaw the sequencing of the libraries on an HiSeq 2500 Sequencer (Illumina, San Diego, CA, USA), using the HiSeq SBS Kit v4 (Illumina, San Diego, CA, USA).

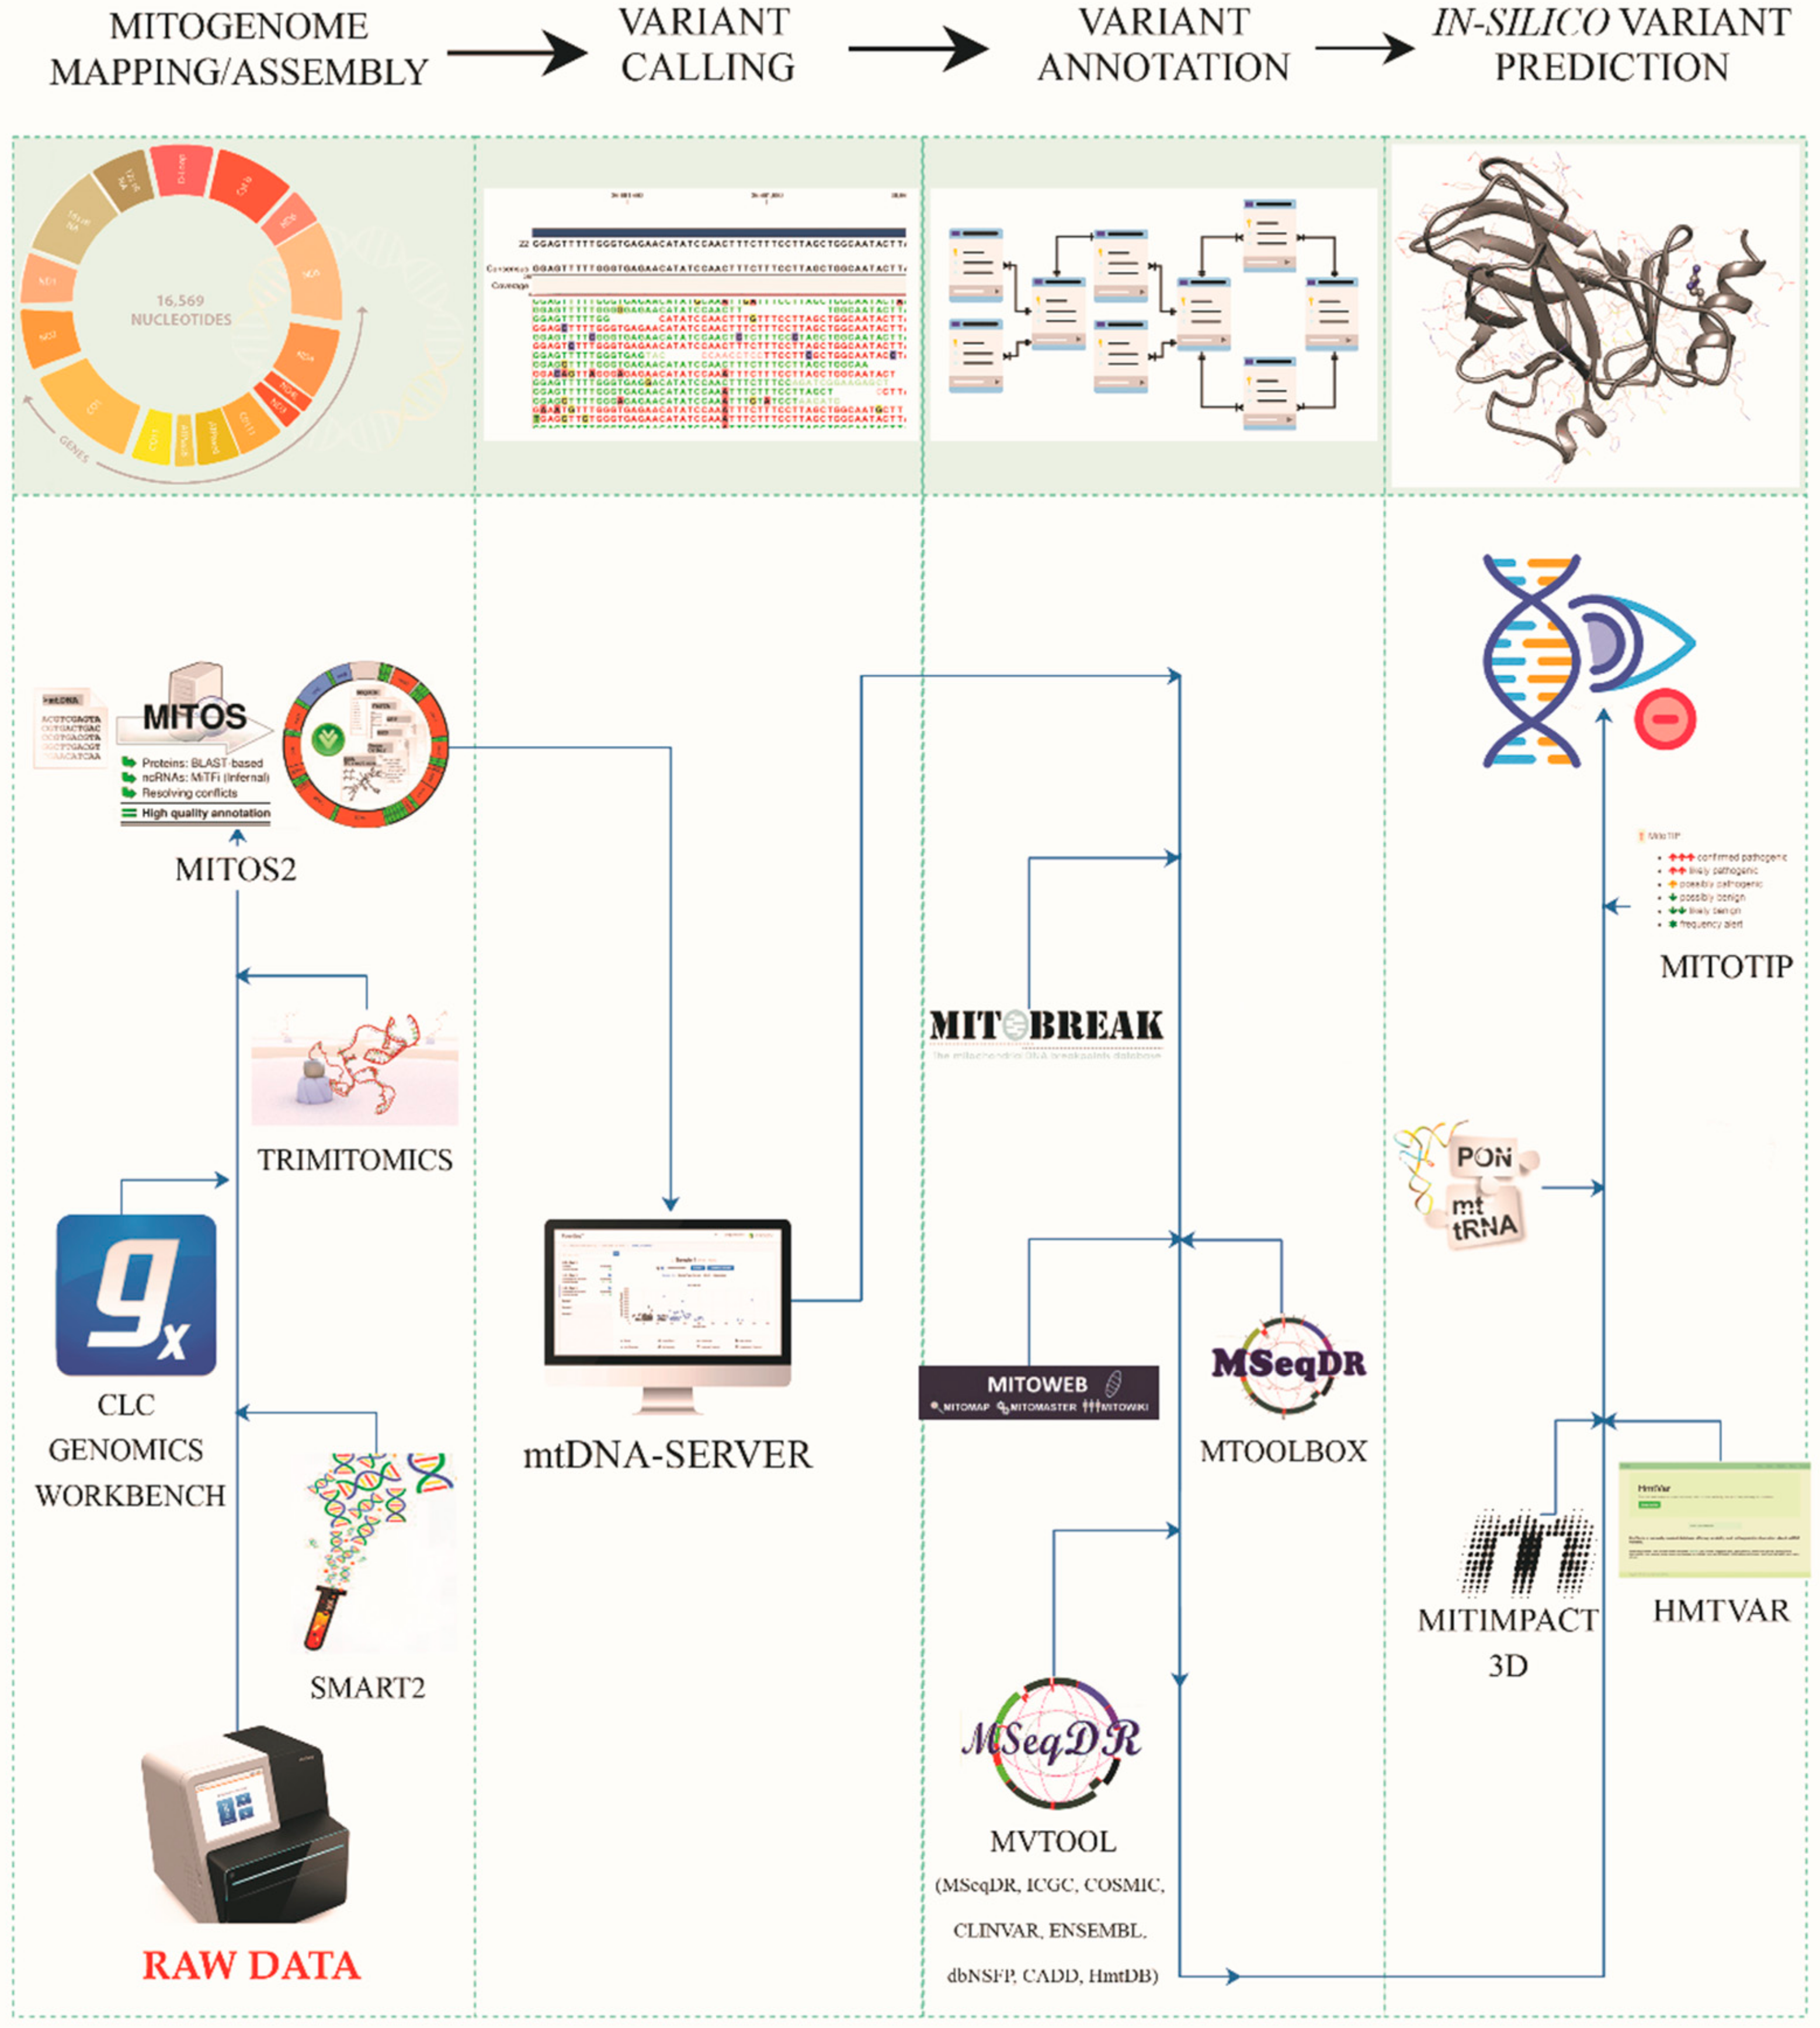
2.4. Mitogenome Assembly/Mapping

To perform an accurate and reliable analysis of mtDNA variants produced by transcriptome experiments, obtaining a higher quality output, we propose an integrated approach that foresees the complementary use of the most recent algorithms applied to mtDNA data, adapting them to a mitochondrial transcript source of data. A schematic workflow of the entire pipeline is reported in Figure 1.
Generated raw sequences were filtered for low-quality reads (average per base Phred score < 30) and adaptor sequences. The quality of the analyzed data was assessed by FastQC (v.0.11.9) [21] and QualiMap (v.2.2.1) [22], while trimming was performed by Trimmomatic (v.0.39). Filtered data was, then, assembled/aligned by CLC Genomics Workbench v.20.0.4 [23], Multi-Sample Statistical Mitogenome Assembly with Repeats (SMART2) [24] and an adapted version of TRIMITOMICS pipeline [25]. Previously, data analyses were realized using the Revised Cambridge Reference Sequence (rCRS), available as sequence number NC_012920 (formerly AC_000021.2) in GenBank’s RefSeq database. This specific rCRS, made of 16,569 bp, is the most commonly used standard comparison sequence for human mtDNA research (Figure 2). It is a single reference individual from haplogroup H2a2 and has been used as a standard for reporting variants for over 30 years.
Mapping analysis with the CLC platform was conducted using the following settings: quality trim limit = 0.01, ambiguity trim maximum value = 2. The map to annotated reference was as follows: mismatch cost = 2, insertion and deletion costs = 3, minimum length fraction and minimum similarity fraction = 0.8, maximum number of hits for a read = 10, strand-specific = both.
SMART2, the most recent pipeline able to assemble de novo and annotate complete a circular mitochondrial genome sequence from NGS sequencing data, was set as follows: automatic selection of number of read pairs per bootstrap, with doubling strategy starting with 100 k; number of bootstrap samples = 1; minimum seed kmer coverage = 20; coverage-based filtering method = intersection; kmer size = 31; number of threads = 16; genetic code = 02-vertebrate.
The most powerful pipeline we used was TRIMITOMICS, particularly interesting for the assembly of mitochondrial gene cassettes and whole coding sequences from RNA-Seq reads. It is based on free algorithms used stepwise, depending on the success of mitogenome assembly in the preceding step. The first step foresaw the use of NOVOPlasty v.3.8.2 organelle assembler, set as follows: Genome Range = 1–16,569; k-mer = 31; max memory = 16; extend seed directly = no; variance detection = no. If a complete or partial mtDNA was not obtained, the RNA-Seq reads were firstly mapped to their respective reference genome with Bowtie2 v.2.4.1 algorithm, using standard settings, and then assembled with Trinity v.2.10.0, following a genome guided approach with default presets, with the exception of the parameter “max intron length = 10,000”. If none of the previously cited methods successfully produced mitogenome, the complete transcriptome would have been assembled by Velvet v.1.2.10, considering a range of kmer sizes (31, 51, 71). Mitochondrial contigs were then extracted from de novo generated transcriptome assemblies by BlastN, using the reference mtDNA. If the complete genome was not retrieved by any of the described approaches, the obtained partial results were joined or put together as a meta-assembly with MAFFT v.7.464 to improve the output.

2.5. Variant Detection by mtDNA-Server

Once obtained, assembled mtDNAs were firstly validated and then analyzed for variant calling by mtDNA-Server, a highly scalable Hadoop-based server for mtDNA NGS data processing [26]. HadoopBAM split input into several chunks and, for each one, only reads with Phred score > 20 and length > 25 were maintained, while reads marked as duplicates were filtered out. Afterwards, all passed bases for each site were counted per strand (A, C, G, T, N – unknown - and d – deletion-). Heteroplasmy detection was performed following different approaches: initially, sites presenting coverage < 10 bases per strand and mitochondrial hotspots around 309, 315 and 3107 were filtered out, according to reference sequence. For survived sites with an allele coverage of 3 bp per strand and a variant allele frequency (VAF) ≥ 1% (strand independent), a machine learning model was applied, considering sequencing errors per base in each strand. Then, all sites showing a log likelihood ratio (LLR) ≥ 5 were marked as heteroplasmic sites. Moreover, the Wilson and the Agresti-Coull confidence intervals were calculated for heteroplasmic variants, and the assigned heteroplasmy level was a weighted mean of heteroplasmy of both strands. An important feature of the mtDNA-Server regards the intra-sample contamination check, based on current phylogeny to avoid erroneous interpretations and conclusions. In the case of contaminations caused by different mtDNA sequences, the two VAF-based profiles generated by the mtDNA-Server (VAF < 50% for the minor, VAF > 50% for the major) led to different valid haplogroups.

2.6. Variant Annotation and Prioritization

This critical step was performed following several practical rules: (1) particular attention to low heteroplasmy levels, (2) evaluation of variant frequency both in the general population and in particular haplogroups, (3) analysis of additional data supporting the modulation of clinical penetrance, such as mitochondrial haplogroup, 4) consideration of inter-species nucleotide and/or amino acid conservation.
The most complete tool we used to realize these purposes was the MSeqDR mtDNA Variant Tool set (mvTool), built upon the MSeqDR infrastructure [27]. It supports all mtDNA nomenclatures, converts variants to standard rCRS- and HGVS-based nomenclatures, and annotates novel mtDNA variants [28]. For already annotated mitogenome variants, mvTool extracted and provided updated population data and pathogenetic classifications from MSeqDR Consortium members [29], the Human Mitochondrial Database (HmtDB) [30], dbNSFP [31], ClinVar [32], Mitomap [33], the 1000 Genomes Project data and GeneDx [34], with resources coming from around 50,000 germline mtDNAs. For variants that had not been annotated before, mvTool conducted new predictions by calling Ensembl Variant Effect Predictor (VEP) [35] and stored its genomic annotations in an internal database that mvTool searched first. Additionally, for input including all mitogenome variants of a given sample, exact mtDNA haplogroup assignment was obtained by PhyMer sub-tool.
Furthermore, we applied a de novo annotation pipeline to evaluate and improve existing annotations, trying to reduce inconsistencies and errors, such as missing gene annotations, missing or incorrect information of the reading direction (strand), mistaken identity of tRNAs, erroneous gene designations and inconsistencies in gene names. To reach this purpose, the MITOchondrial genome annotation Server 2 (MITOS2) was used [36]. It exploits a novel strategy based on aggregating BLAST searches with previously annotated protein sequences to detect protein coding genes, tRNAs and rRNA. Each structured RNA is then annotated using specific covariance models.
Nevertheless, to simplify variant frequency interpretation of a general population, frequently challenging due to mtDNA genetics feature (heteroplasmy level, incomplete penetrance, influence of mitochondrial haplogroup background), we enriched our analytic pipeline with tools and databases focusing on haplogroup classification. The already cited Mitomap advised whether a variant was identified at >1% in at least one of the macro-lineages or over 10% in the major haplogroups for tRNA variants. Results from this step of prioritization were then corroborated by data coming from MToolBox, which applied a computational strategy to realign already assembled mitochondrial genomes to detect InDels and to assess the heteroplasmic fraction (HF) of each variant allele with the related confidence interval (CI), before haplogroup assignment and variant prioritization [37]. This latter step was realized by aligning each sample-specific reconstructed contig against the related macro-haplogroup-specific consensus sequence. This process could detect private variants through a prioritization process, justifying further clinical investigation. Prioritization also considered the pathogenicity of each mutated allele, computed with different algorithms, and the nucleotide variability of each variant site, while the amino acid variability was considered only if the variant site was codogenic.
Finally, to complete the variant data, we retrieved records from the MitoBreak database, focusing on mtDNA rearrangements following breakpoints from linear mtDNAs, circular deleted mtDNAs (deletions) and circular partially duplicated mtDNAs (duplications) [38].

2.7. In Silico Predictions and Variant Consequences

Currently, massive mtDNA screening by NGS is showing a relevant number of novel variants of unknown significance (VUS), whose clinical interpretation is more complicated than nuclear VUS, due to the already cited challenging mitogenome characteristics and due to limited guidelines for mtDNA compared to those provided for nuclear VUS.
Thus, to obtain reliable results, we performed a combined approach made of complementary in-silico prediction tools. These tools evaluated the variant functional impact by algorithms based on interspecies sequence conservation and/or structure analysis.
The most complete and continuously updated tool we used in this step was MitImpact 3D v.3.0.2, a collection of pre-computed pathogenicity prediction scores for all possible nucleotide changes that determine non-synonymous substitution, in human mitochondrial protein coding genes [39]. We evaluated the following MitImpact 3D missense pathogenicity predictors and machine learning based approach meta-predictors: SIFT (v.5.0.3) [40], PolyPhen2 (v.2.2.2) [41], MutationAssessor (v.2.0) [42], PANTHER [43], FatHmm (v.2.2, “weighted” and “unweighted” setting) [44], PROVEAN (v.1.3) [45], CADD (v.1.2) [46], EFIN [47], SNAP [48], PhD-SNP [49], MutationTaster v.2 [50], COVEC (v.0.4) [51], SNPdryad [52], DEOGEN2 [53], Mitoclass.1 [54], CAROL [55], Meta-SNP [56], Condel [57], APOGEE (v.1.0) [58], ClinVar, dbSNP (v.151) [59], PhyloP and PhastCons evolutionary conservation indices (UCSC Gene Tables, group: Comparative Genomics; track: Conservation; tables: phyloP100wayAll and PhastCons100way) [60], SiteVar human mtDNA site-specific variability [61], MISTIC Mutual Information scores [62], COSMIC somatic variants (ver. 87) [63], TransFIC [64], CHASM [65]. Additionally, the tool permitted the evaluation of compensated pathogenic deviations (CPDs), amino acid substitutions described as pathogenic in human populations but that seem wild-type residues in non-human ortholog proteins, as well as intra-protein sites that significantly co-variate each other with two different algorithms, EV Mutation [66] and I-COMS [67].
The wide range of data output from MitImpact 3D was then enriched by HmtVAR [68], which hosts variability and pathogenicity data on human mtDNA variants, integrated with records retrieved from several online databases and in-house pathogenicity assessments, on the basis of various evaluation criteria. HmtVAR also presents manually curated tRNA variant attributes, but the most relevant resources dedicated to mitochondrial tRNAs that we explored were MITOTIP and PON-mt-tRNA.
MITOTIP mixed secondary structure information, structural analogies with other tRNA variants and conservation scores, providing the best prediction performances regarding specificity and sensitivity [69].
PON-mt-RNA, instead, is a posterior probability-based algorithm which computed a multifactorial score associating various features, such as sequence context and evidence of segregation, RNA secondary structure and tertiary interaction, functional assays, and evolutionary conservation [70].

2.8. Sub-Pathway Analysis

To emphasize the mitochondrial sub-pathways whose oxidative stress-induced alteration could be involved in retinal degenerations, the GO term enrichment analysis for mutated mtDNA genes was performed using the ClueGO (v. 2.5.7) (INSERM, Paris, France) [71] and CluePedia (v. 1.5.7) (INSERM, Paris, France) [72] plugins in Cytoscape (ver. 3.8.0) (National Institute of General Medical Sciences, Bethesda, MD, USA) [73]. ClueGO options have been set as follow: CLINVAR, GO (Biological Process, Cellular Component, Molecular Function and Immune System Process), INTERPRO, KEGG, REACTOME (Pathways and Reactions), WIKIPATHWAYS and CORUM 3.0 as selected ontologies; GO Tree Interval Min Level = 2 and Max Level = 9; GO Term/Pathway Selection Min # Genes = 2 and % Genes = 3.000; GO Term/Pathway Network Connectivity (Kappa Score) = 0.4; Statistics Options set on Enrichment/Depletion (Two-Sided hypergeometric test), with pV correction = Bonferroni step-down. CluePedia was used following default settings. Finally, only GO terms with p < 0.01 were selected.

3. Results

3.1. A2E Treatment Determined a Substantial Negative Effect on RPE Cells Survival

The MTT assay highlighted a significant impact of A2E treatment on RPE cells viability in a time-dependent manner. In contrast to the control group, the viability of treated RPE cells was significantly decreased (p < 0.05), especially after 6 h from treatment (Figure 3).

3.2. Alignment and Assembly of mtDNAs

Once the quality of RNA (average RIN = 7.0) was assessed, the following sequencing globally generated about 100 million quality reads (mean mapping quality = 28), with a relevant number uniquely mapped to mtDNA, ranging from nearly two hundred reads generated from the 3 h treated sample (3h_RPE) to about 450,000 reads produced by Illumina paired-end experiment on untreated RPE cell transcriptome. Even if CLC Genomics Workbench and SMART2 were able to map mtDNA in all samples, the best efficiency was achieved by Trimitomics adapted workflow. It benefited from its ability to specifically work on RNA-Seq data and from the greater depth of initial raw data (not shown), highlighting elevated requirements requested by Bowtie2, NOVOPlasty, Trinity and Velvet algorithms. As is already known, gene expression profiling experiments that are looking for a quick snapshot of highly expressed genes may need 5–25 million reads per sample but, in order to achieve more detailed information such as alternative splicing, typically require 30–60 million reads per sample. Thus, such ranges reached by all samples ensured the good quality of the output. A detailed report of the alignment and assembly statistics is available in Table 1. Once produced, all partial or fully assembled mitogenomes were merged to obtain only one meta-mitogenome for each sample, needed for subsequent steps.

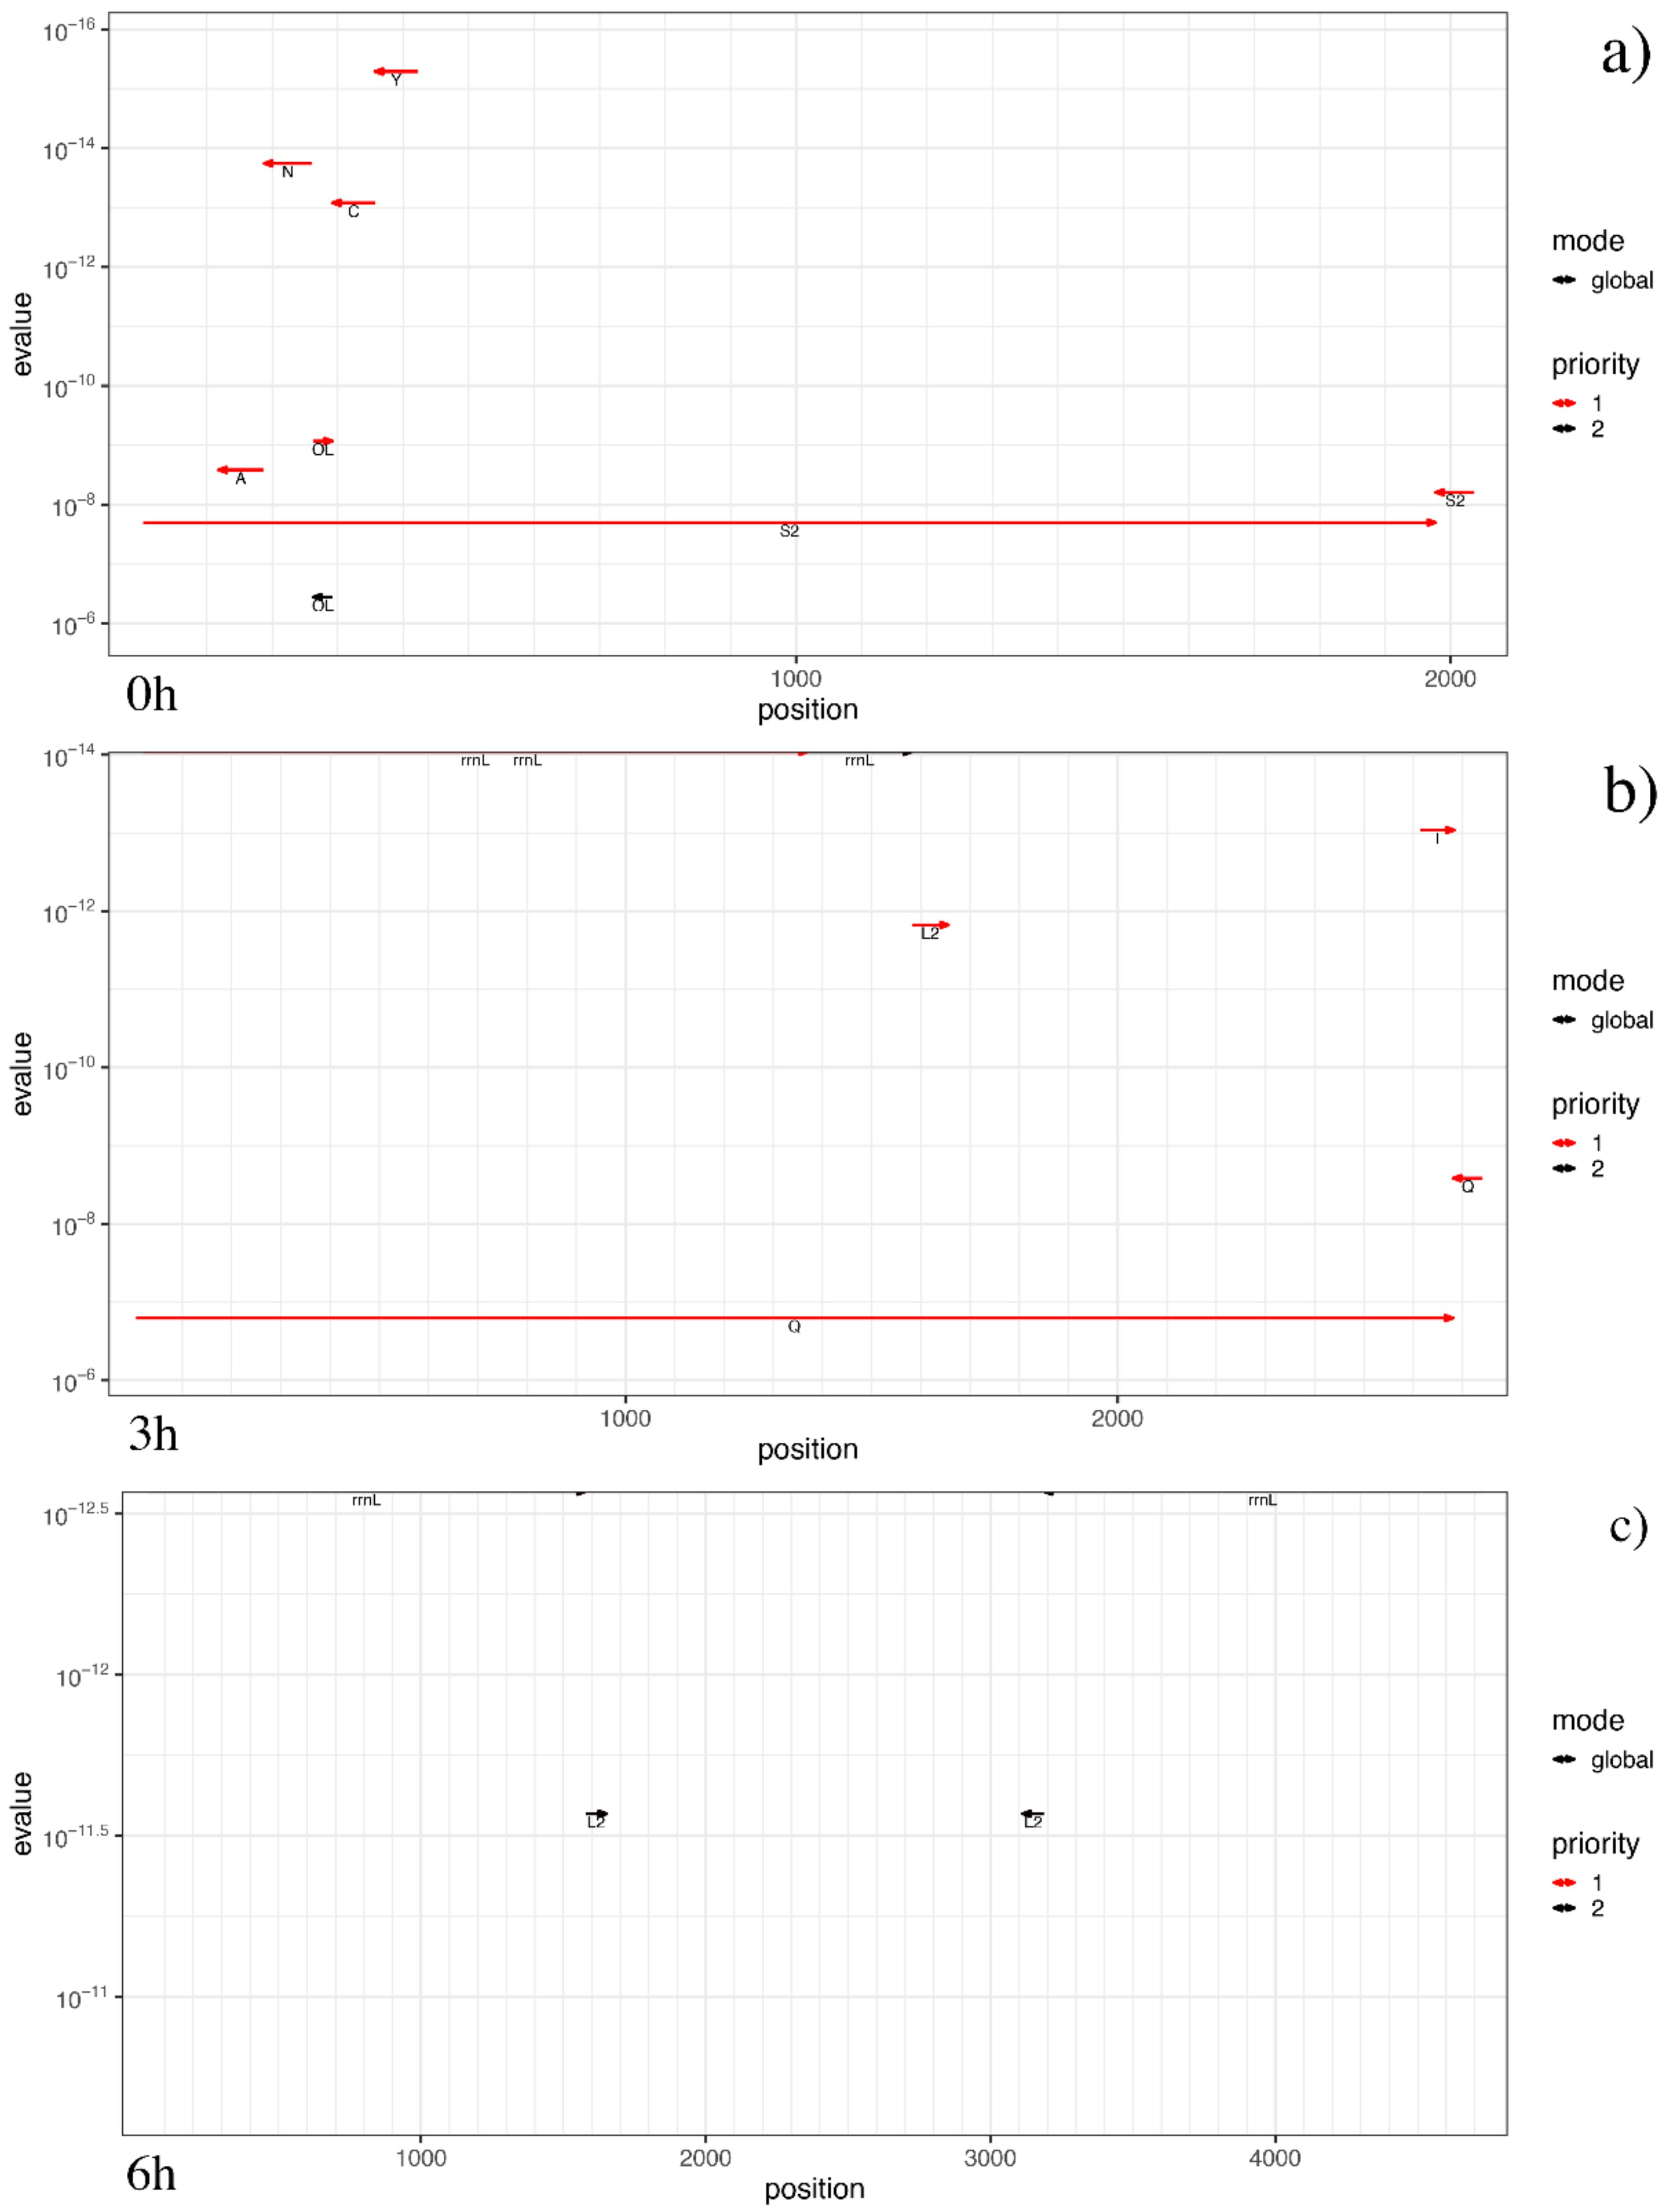
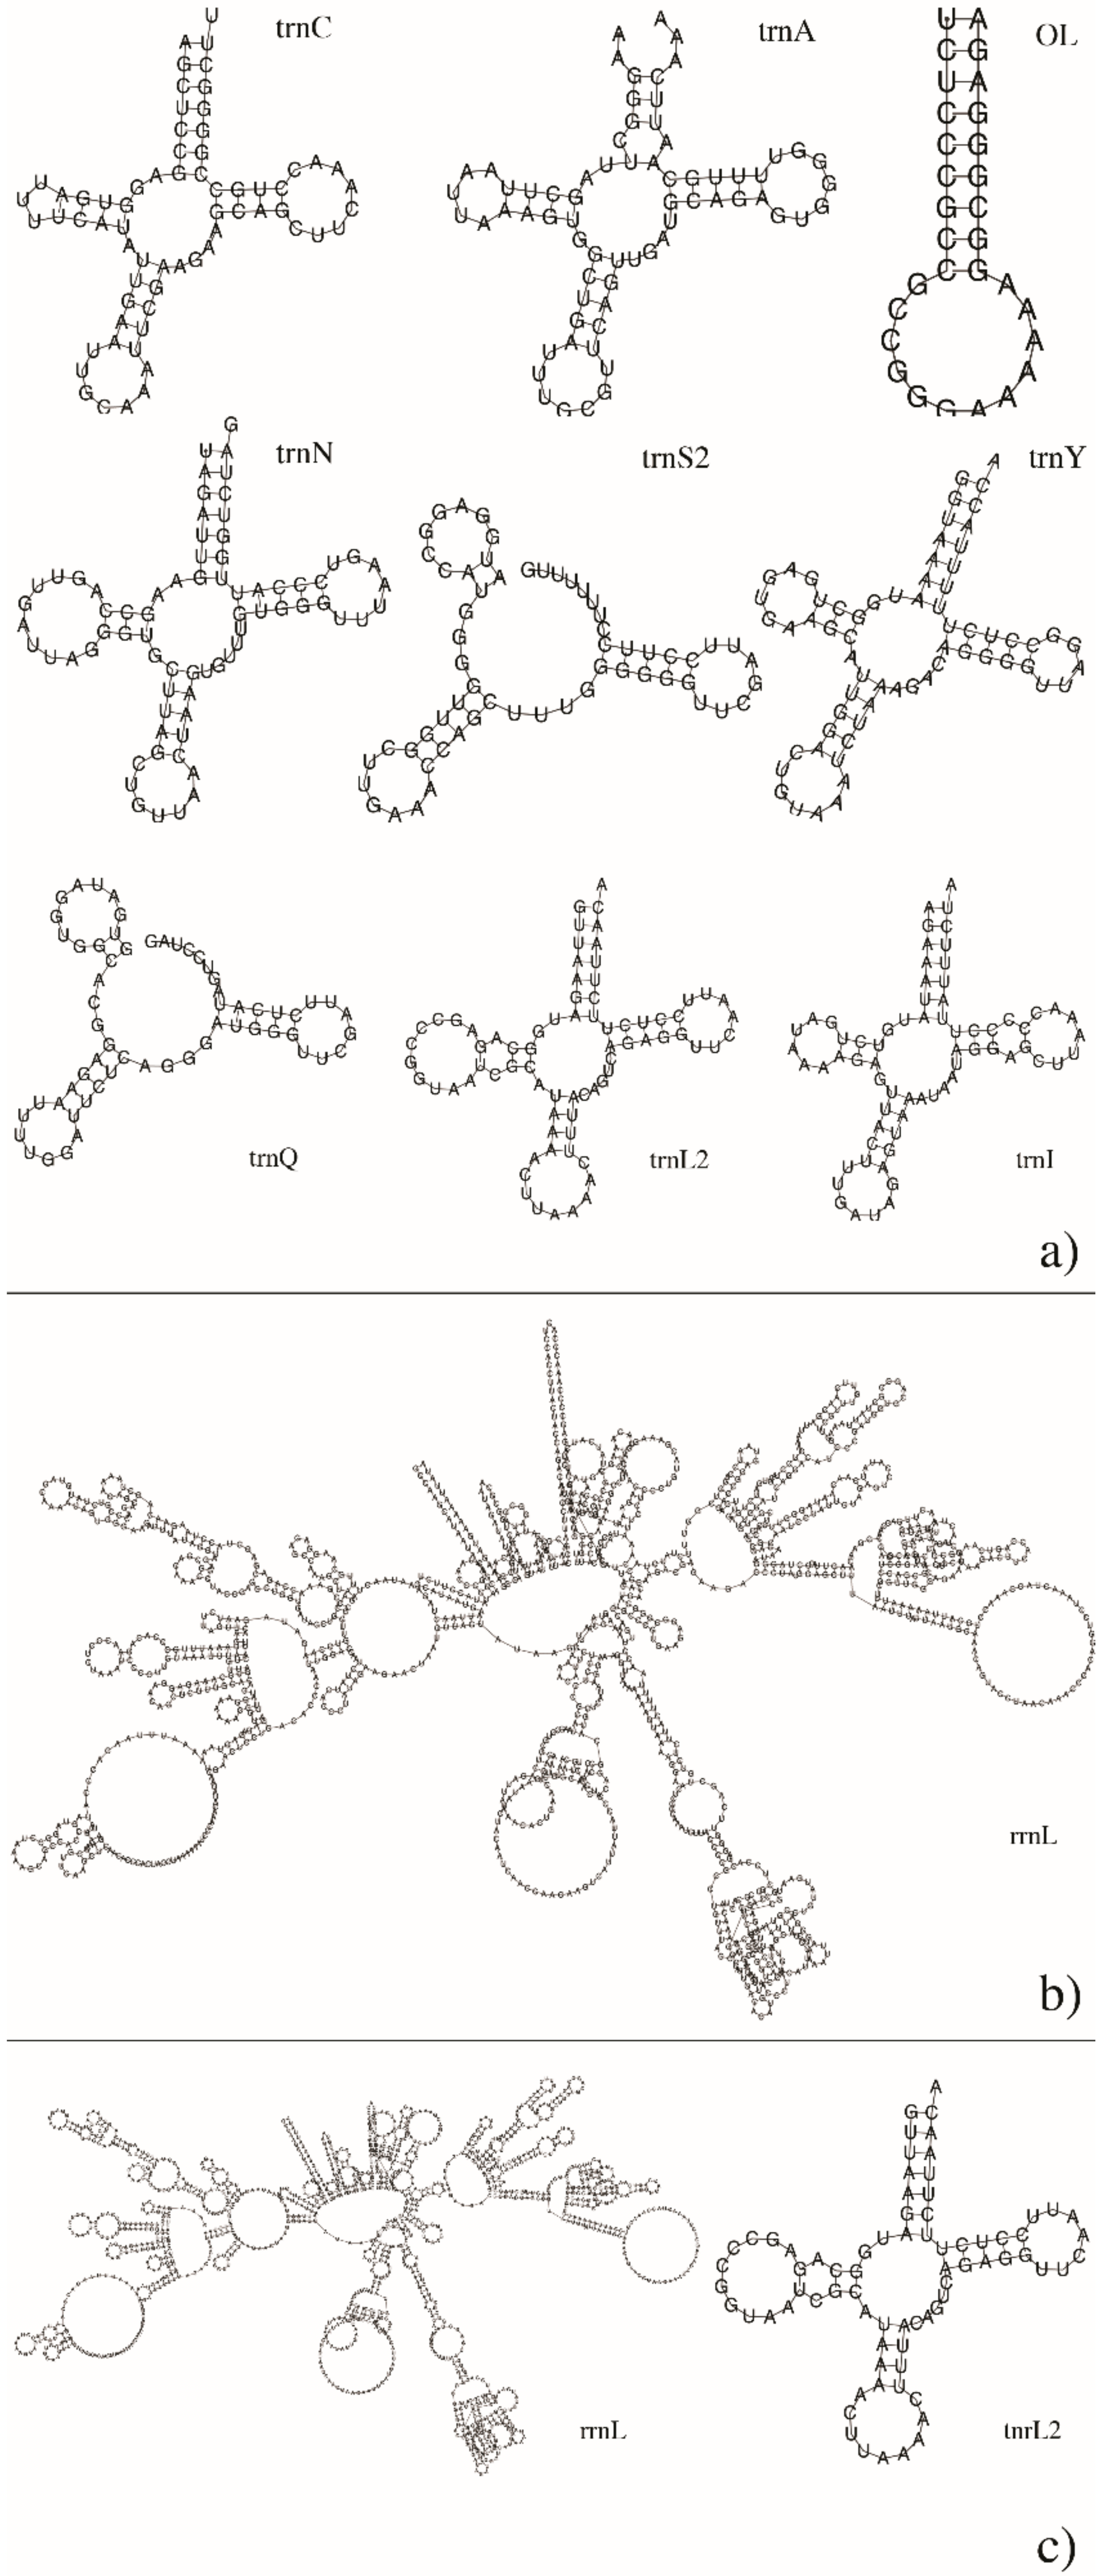
3.3. Mitogenome Annotations

The annotation of protein coding genes reached the best results in the untreated sample, in two genes with high quality score (~102 for LAGLI and ~106 for COX1) and the origin of heavy strand synthesis (OH) was detected. Curiously, in both time-related treated samples, the only protein coding gene identified with high quality was NAD1. The complete protein plots are shown in Figure 4. Furthermore, both treated samples were the most reliable in rRNA computation (e-values ~ 10−14–10−12.5), while the untreated one showed the highest number of annotated tRNAs, as well as the widest positions covered among mitogenomes. Interestingly, data annotation highlighted the longest tRNAs in both untreated and 3h_treated samples, even if with a good but not optimal significance (e-values ~ 10−7). Details on rRNA and tRNA annotations are shown in the non-coding plots of Figure 5. Intriguingly, we were also able to compute the secondary structure of several rRNAs and tRNAs for each sample, the most significant of which are represented in Figure 6. It is clear, especially for rRNAs, how changes in several nucleotides led to different RNA folding.

3.4. MtDNA Variant Calling and Annotations

The mtDNA-Server highlighted excellent results from previous alignment/assembly steps, reaching the highest coverage around the 7500 nt position in the untreated sample (Figure 7). Both time-dependent treated samples showed elevated level of heteroplasmic sites, with the highest peaks reached by MT-CO1 and MT-CO3 loci in 3 h treated, and by MT-CYB locus in 6 h treated (Figure 8).
RNA-seq analyses evidenced the highest number of heteroplasmic mtDNA variants in both treated samples (n3h = 320, n6h = 195), with the highest peak of unique annotated variants at 6 h (n = 45). Transitions were the most detected variants (only one T>G transversion was found), with an overrepresentation of A>G (n = 48) and C>T (n = 21) (Table S1). This result is in line with what is already known in literature [74]. VEP reached the highest number of annotated variants (n0h = 23, n3h = 24 and n6h = 29), while MSeqDR, the most experimental data-rich database, identified just one more variant in the treated than the untreated group (n0h = 20, n3h = 21 and n6h = 21), with 17 and 18 of them, respectively, in 3 h and 6 h treatment, also reported in the dbSNP database. These variants were prevalently in protein coding genes (n~20) with, respectively, 5 and 12 missense in 3 h and 6 h treated samples. Interestingly, the 6 h treatment resulted as the only showing a relevant variant in a rRNA coding gene. Regarding functional predicted consequences, four variants highlighted a possible pathogenic effect (m.11467 A>G; m.12372 G>A; m.14766 C>T; m.15326 A>G), while eight variants in untreated (m.73 A>G; m.150 C>T; m.263 A>G; m.456 C>T; m.2857 T>C; m.5656 A>G; m.16270 C>T; m.16304 T>G), in 3 h treated (m.73 A>G; m.150 C>T; m.263 A>G; m.750 A>G; m.951 G>A; m.5656 A>G; m.16270 C>T; m.16354 C>T) samples, and 13 (m.73 A>G; m.150 C>T; m.263 A>G; m.497 C>T; m.1438 A>G; m.3197 T>C; m.5656 A>G; m.12196 C>T; m.12308 A>G; m.16224 T>C; m.16270 C>T; m.16311 T>C; m.16519 T>C) and in the 6 h treatment one might exert a modifier role. Variant annotation summaries for all RNA-Seq samples are available in Table 2, while advanced details are available in Table S1.

3.5. In Silico Functional Consequences and Pathogenicity Predictions

The next step of the performed pipeline foresaw the use of in-silico predictions, to clarify the possible consequences of identified variants, especially ones which lack certain effects such as VUS.
Even if about 50 unique variants were detected by mvTool and MITIMPACT 3D throughout all samples, only about half of them were evaluated as damaging in investigated databases. In particular, the highest number of deleterious variants were identified by PROVEAN (18), Meta-SNP (20), PhD-SNP and SNAP (21), CADD and MToolBox (25), and Condel (28). Interestingly, 19 variants were computed by EVmutation, quantifying simultaneously the effects of multiple mutations by explicitly modeling interactions between all the pairs of residues in proteins (and bases in RNAs). The impact of the latter analysis was further corroborated by the total absence of CPD, which increased the probability that hypothesized effects of detected variants were truly positive. Curiously, HmtVAR classified most of the identified variants as coding sequence (29) and regulatory (11), providing important evidence on the different kinds of impact probably determined by these variants. Furthermore, pathogenic or likely pathogenic variants were detected in both treated samples, and two tRNA variants found in 6 h treated samples were also found in the Pon-mt-tRNA database. The scenario could also represent an important finding as the most of variants seem to be new mutations, as appeared from both dbSNP and CLINVAR (Table 3).
Regarding haplogroup classification, RPE cell transcriptomes showed a putative assignment to U5b1b1+@16192 haplogroup, as outputted by the mtDNA-Server.

3.6. Sub-Pathways Analysis of mtDNA Mutated Genes Suggested a Positive Regulation of ATP Metabolism

All the 25 clustered sub-pathways obtained from enrichment of mtDNA mutated genes, derived from transcript analysis, thanks to Cytoscape and its plugins ClueGO and CluePedia gave statistically significant results (Figure 9). Among them, seven pathways showed the highest probability of association (Bonferroni step-down corrected p < 0.001), highlighting the most altered functions of mitochondria of RPE stressed cells: “Positive regulation of hydrogen peroxide metabolic process” (p = 1.45 × 10⁻³), “Regulation of hydrogen peroxide biosynthetic process” (p = 1.80 × 10⁻³), “positive regulation of hydrogen peroxide biosynthetic process” (p = 1.03 × 10⁻³), “positive regulation of necrotic cell death” (p = 1.80 × 10⁻³), “regulation of nucleotide biosynthetic process” (p = 1.55 × 10⁻³), “positive regulation of cofactor metabolic process” (p = 1.80 × 10⁻³) and “positive regulation of ATP metabolic process”, that represented the hub-pathway with the highest significance (p = 8.10 × 10⁻¹¹). Further details on significant pathways are available in Table S2.

4. Discussion

The advent of “omics” sciences and the development of specific bioinformatics algorithms gave systematics to analyses involving mtDNA and its linkage to related diseases [75]. Among disorders already known to be determined by mtDNA variants [76], the best characterized are oxidative stress induced ones, such as Alzheimer’s, Parkinson’s and other neurodegenerative disorders [77].
One of the not totally explored field of neurodegenerative pathologies associated to mtDNA impairments regards the inherited retinal dystrophies (IRDs) [78,79,80]. The only available data are related to Leber Hereditary Optic Neuropathy (LHON) and to age-related degenerations, like AMD [81], even if clear molecular mechanisms linking mtDNA alterations to these pathologies are already not clear.
In order to shed light on such molecular aspects, we evaluated the possible mutagenic effects of blue light photoactivated A2E on RPE cells in a time-dependent experiment. We analyzed mitochondrial transcripts and, with an innovative bioinformatic pipeline, we derived mtDNA information, permitting a comparison of the possible mtDNA damage after 3 and 6 h from treatment versus untreated cells.
It is well known that blue-violet light (415–455 nm) within the solar spectrum exerts a toxic effect to the retina, generating the highest amount of ROS and the highest level of mitochondrial dysfunction [82]. Moreover, the exposure of cells to A2E determines an increased production of ROS and NOS, determining a mitochondria-related oxidative stress [83].
Such effects were confirmed by our A2E treatment, showing a huge decrease in cell viability within the time range of six hours. The most challenging aspect of this scenario is represented by molecular mechanisms able to induce such mitochondrial impairments. We hypothesized that A2E might act as a mutagenic compound towards mtDNA, as supposed by the increased number of variants that emerged after 3 h and 6 h from treatment compared to untreated RPE cells. This hypothesis is supported by intrinsic characteristics of both interacting protagonists, mtDNA and A2E. The mtDNA is greatly susceptible to damage, due to the absence of histones, localization within the matrix, high rate of transcription with the lack of intron and DNA damage response (DDR), less efficient than in the nucleus [84,85]. The A2E presents an aldehydic component within its chemical structure, which can cross-link with different chemical moieties on DNA, forming adducts to deoxyguanosine, deoxyadenosine and deoxycytidine, leading to many toxic consequences such as mutagenesis [85,86,87].
The mitochondrial assembly pipeline was able to compute entirely both cox1 and lagli encoding genes only in untreated cells, while in both time-related treated RPE cells only the nad1 gene (absent in untreated samples). A2E can act as proapoptotic molecule, specifically targeting cytochrome oxidase (COX) and inhibiting oxygen consumption synergistically with light [88], probably explaining the lack of full cox1 sequence, and the wealth of variants in computed portion, as observed after 3 h of treatment. The lagli, instead, is a maturase domain of enzymes promoting RNA splicing and intron homing [89], two fundamental cellular activities probably impaired during treatment, denoting the progress of apoptotic process. The detection of the nad1 gene sequence in both 3 h and 6 h treated samples could reflect the abundance of mutant forms of NAD+, following the oxidative stress condition of RPE cells. Even if the de novo pathway of NAD+ biosynthesis seems to be unaffected in retinal aging and various conditions of retinal degenerations, the salvage pathway was found to be significantly altered, determining a significant decline in oxidative phosphorylation and an up-regulation of glycolytic respiration [90,91]. The final effect of these impairments is the mitochondrial ATP production decrease in the presence of A2E [92].
Differences in the assembly of mtDNA between untreated and treated RPE cells were also evidenced in 16S (rrnL) and tRNA genes. Mitochondrially encoded 16S rRNA is required for the biosynthesis of mitochondrial-derived peptide humanin, exerting cytoprotective and neuroprotective activities [85]. Thus, its detection in both time-dependent treated samples could represent a final attempt to avoid the advancing cell death, also represented by the almost total absence of tRNAs (in the 6 h treated sample only the L2 connector of tRNAs was computed).
As already cited, the effects of A2E on RPE are also time-dependent, and its accumulation exacerbates the effects of mitochondrial dysfunction [93]. Cells do not die immediately but suffer genotoxic damages with the formation and accumulation of mutagenic DNA lesions (double strand breaks and FPG sensitive lesions) [94,95,96]. Failure in repair of damaged mtDNA may turn into mutation, which can be maternally inherited. For example, if base excision repair (BER) fails in removing 8-oxoG, a major oxidative modification of mtDNA, this one can be further oxidized to produce its more stable and mutagenic forms, which may interfere with mtDNA replication [84].
As we demonstrated, it is very likely that the damage induced in mtDNA will be localized in a coding sequence corresponding with either the polypeptide-encoding genes or the RNA, thereby limiting the biosynthesis of fully functional proteins [8]. Generally, mtDNA mutations determine a clinically observable phenotype only if the proportion of mutant mtDNA exceeds a high threshold value, often 80–90%. Most of homoplasmic mtDNA mutations are neutral polymorphisms, but several of them or combinations of them in mtDNA haplogroups could be associated with the onset or progression of retinal diseases [8]. Nevertheless, most mtDNA mutation-related pathologies are heteroplasmic, with heteroplasmic subjects with high percentage of mutant mtDNA manifesting the increasing risk of vision loss [97].
Untreated samples showed the highest frequency of heteroplasmic variants in MT-TL1, encoding for the tRNAleucine1, belonging to no protein complexes, but known to present the most frequent mutations which cause many mitochondria-related diseases, except retinal ones [98]. After treatment, the damage sites reached all oxidative phosphorylation system (OXPHOS) complexes. The complex IV of cytochrome c oxidase evidenced the highest heteroplasmic variant frequency in MT-CO1 and MT-CO3 genes after 3 h from treatment. Subsequently, at the end of the experiment (6 h), all the other complexes presented the highest rate of heteroplasmic variants in several protein encoding genes. In detail, they were the NADH dehydrogenase subunit 5 (MT-ND5) encoding gene belonging to the first complex, the cytochrome b (MT-CYB) encoding gene involved in the third complex, and the ATP synthetase subunit 6 (MT-ATP6) constituting a part of the fifth complex.
As evidenced by pathway analysis, mutated mtDNA genes play a pivotal role in the positive regulation of ATP metabolic process, suggesting a huge impairment in the energetic balance of the cell. It is very probable that mtDNA damage affects genes encoding the mitochondrial electron transport chain at various levels, resulting in ROS overproduction, which leads to more damage to mtDNA. Such injuries, as already cited, could be worsened by A2E or other radical species such as hydrogen peroxide, whose biosynthesis resulted from pathway analysis, and whose role was already linked to decreased redox function in RPE cells [84]. Thus, when antioxidants enzymes or DNA repair systems fail, accumulated damage to mtDNA can result in mitochondrial dysfunctions, energy crisis, cell degeneration and death, as observed in many retinal diseases [8].

5. Conclusions

The continuously updated next generation sequencing technologies allowed researchers to access to the entire mtDNA sequencing data, which is constantly being increased. We used, for the first time, an integrated approach starting from RNA rather from DNA, trying to maximize the innovation of our work.
However, sequencing the whole cell transcriptome instead of mtDNA could determine several limitations: (1) RNA-Seq would result in a much lower coverage with the same amount of sequencing mtDNA data; (2) it is more difficult to cover the full-length mtDNA, including all regulatory regions; (3) deletions and rearrangements could be lost from the transcriptomics data.
Furthermore, there are several critical restrictions that should be evaluated during mtDNA damage analysis interpretation, such as DNA fragmentation, greater diversity in both the number of mitochondria per cell as well as the number of mtDNA copies per mitochondria, mitochondrial haplogroups, identification of helper or synergistic mutations and co-occurrences of variants.
Taking into account such critical issues, we highlighted how a high oxidant environment can alter the physiological activities of mitochondria, acting on its own mtDNA. Thus, trying to clarify how a frequently retinal produced compound such as A2E could exert mutagenic effects on RPE mtDNA, we hypothesized new scenarios that might link unknown molecular aspects of the cell to the onset/progress of eye-related neurodegenerative pathologies.
These powerful results, along with further pathway analyses to decrypt the biological role of the involved genes, should be incorporated into clinical diagnostic settings, as they are hypothesized to modulate the phenotypic expression of mtDNA pathogenic variants. In this way, an integrative analysis of mitochondrial genome, together with the nuclear genome, could drastically improve the field of precision molecular medicine, with the final goal being to improve patients’ healthcare.

Supplementary Materials

The following are available online at https://www.mdpi.com/2076-3921/9/11/1158/s1, Table S1: MtDNA Variant Calling and Annotations details; Table S2: Details of Sub-Pathways Analysis of mtDNA Mutated Genes.

Author Contributions

Conceptualization, L.D.; methodology, L.D.; software, L.D. and C.S.; validation, C.S. and S.A.; formal analysis, L.D., A.P. and F.S.; investigation, L.D.; resources, C.S.; data curation, L.D.; writing—original draft preparation, L.D.; writing—review and editing, C.S. and R.D.; visualization, S.A. and R.D.; supervision, A.S.; project administration, A.S. All authors have read and agreed to the published version of the manuscript.

Funding

This research received no external funding.

Conflicts of Interest

The authors declare no conflict of interest.

Data Deposition

According to the journal guidelines, RNA-Seq data was deposited in NCBI’s Sequence Read Archive (SRA) and assigned to the project identifier PRJNA622997.

References

  1. Agrawal, A.; Mabalirajan, U. Rejuvenating cellular respiration for optimizing respiratory function: Targeting mitochondria. Am. J. Physiol. Lung. Cell Mol. Physiol. 2016, 310, L103–L113. [Google Scholar] [CrossRef] [PubMed] [Green Version]
  2. Dennerlein, S.; Wang, C.; Rehling, P. Plasticity of Mitochondrial Translation. Trends Cell Biol. 2017, 27, 712–721. [Google Scholar] [CrossRef] [PubMed]
  3. Farge, G.; Falkenberg, M. Organization of DNA in Mammalian Mitochondria. Int. J. Mol. Sci. 2019, 20, 2770. [Google Scholar] [CrossRef] [PubMed] [Green Version]
  4. Nissanka, N.; Moraes, C.T. Mitochondrial DNA damage and reactive oxygen species in neurodegenerative disease. FEBS Lett. 2018, 592, 728–742. [Google Scholar] [CrossRef] [PubMed]
  5. El-Hattab, A.W.; Craigen, W.J.; Scaglia, F. Mitochondrial DNA maintenance defects. Biochim. Biophys. Acta Mol. Basis. Dis. 2017, 1863, 1539–1555. [Google Scholar] [CrossRef] [PubMed]
  6. Brandon, M.C.; Lott, M.T.; Nguyen, K.C.; Spolim, S.; Navathe, S.B.; Baldi, P.; Wallace, D.C. MITOMAP: A human mitochondrial genome database—2004 update. Nucleic Acids Res. 2005, 33, D611–D613. [Google Scholar] [CrossRef] [PubMed] [Green Version]
  7. Chinnery, P.F.; Hudson, G. Mitochondrial genetics. Br. Med. Bull. 2013, 106, 135–159. [Google Scholar] [CrossRef] [Green Version]
  8. Kaarniranta, K.; Uusitalo, H.; Blasiak, J.; Felszeghy, S.; Kannan, R.; Kauppinen, A.; Salminen, A.; Sinha, D.; Ferrington, D. Mechanisms of mitochondrial dysfunction and their impact on age-related macular degeneration. Prog. Retin. Eye Res. 2020, 100858. [Google Scholar] [CrossRef]
  9. Yang, T.C.; Yarmishyn, A.A.; Yang, Y.P.; Lu, P.C.; Chou, S.J.; Wang, M.L.; Lin, T.C.; Hwang, D.K.; Chou, Y.B.; Chen, S.J.; et al. Mitochondrial transport mediates survival of retinal ganglion cells in affected LHON patients. Hum. Mol. Genet. 2020, 29, 1454–1464. [Google Scholar] [CrossRef]
  10. Huang, C.H.; Su, S.L.; Hsieh, M.C.; Cheng, W.L.; Chang, C.C.; Wu, H.L.; Kuo, C.L.; Lin, T.T.; Liu, C.S. Depleted leukocyte mitochondrial DNA copy number in metabolic syndrome. J. Atheroscler. Thromb. 2011, 18, 867–873. [Google Scholar] [CrossRef] [Green Version]
  11. Caston, R.A.; Demple, B. Risky repair: DNA-protein crosslinks formed by mitochondrial base excision DNA repair enzymes acting on free radical lesions. Free Radic. Biol. Med. 2017, 107, 146–150. [Google Scholar] [CrossRef] [PubMed]
  12. Duan, M.; Chen, L.; Ge, Q.; Lu, N.; Li, J.; Pan, X.; Qiao, Y.; Tu, J.; Lu, Z. Evaluating heteroplasmic variations of the mitochondrial genome from whole genome sequencing data. Gene 2019, 699, 145–154. [Google Scholar] [CrossRef] [PubMed]
  13. Carroll, C.J.; Brilhante, V.; Suomalainen, A. Next-generation sequencing for mitochondrial disorders. Br. J. Pharmacol. 2014, 171, 1837–1853. [Google Scholar] [CrossRef] [PubMed] [Green Version]
  14. Alaimo, A.; Linares, G.G.; Bujjamer, J.M.; Gorojod, R.M.; Alcon, S.P.; Martinez, J.H.; Baldessari, A.; Grecco, H.E.; Kotler, M.L. Toxicity of blue led light and A2E is associated to mitochondrial dynamics impairment in ARPE-19 cells: Implications for age-related macular degeneration. Arch. Toxicol. 2019, 93, 1401–1415. [Google Scholar] [CrossRef] [PubMed]
  15. Ouyang, X.; Yang, J.; Hong, Z.; Wu, Y.; Xie, Y.; Wang, G. Mechanisms of blue light-induced eye hazard and protective measures: A review. Biomed. Pharmacother. 2020, 130, 110577. [Google Scholar] [CrossRef]
  16. Grebenova, D.; Kuzelova, K.; Smetana, K.; Pluskalova, M.; Cajthamlova, H.; Marinov, I.; Fuchs, O.; Soucek, J.; Jarolim, P.; Hrkal, Z. Mitochondrial and endoplasmic reticulum stress-induced apoptotic pathways are activated by 5-aminolevulinic acid-based photodynamic therapy in HL60 leukemia cells. J. Photochem. Photobiol. B 2003, 69, 71–85. [Google Scholar] [CrossRef]
  17. Lin, C.H.; Wu, M.R.; Huang, W.J.; Chow, D.S.; Hsiao, G.; Cheng, Y.W. Low-Luminance Blue Light-Enhanced Phototoxicity in A2E-Laden RPE Cell Cultures and Rats. Int. J. Mol. Sci. 2019, 20, 1799. [Google Scholar] [CrossRef] [Green Version]
  18. Donato, L.; Scimone, C.; Alibrandi, S.; Nicocia, G.; Rinaldi, C.; Sidoti, A.; D’Angelo, R. Discovery of GLO1 New Related Genes and Pathways by RNA-Seq on A2E-Stressed Retinal Epithelial Cells Could Improve Knowledge on Retinitis Pigmentosa. Antioxidants (Basel) 2020, 9, 416. [Google Scholar] [CrossRef]
  19. Donato, L.; Scimone, C.; Alibrandi, S.; Rinaldi, C.; Sidoti, A.; D’Angelo, R. Transcriptome Analyses of lncRNAs in A2E-Stressed Retinal Epithelial Cells Unveil Advanced Links between Metabolic Impairments Related to Oxidative Stress and Retinitis Pigmentosa. Antioxidants (Basel) 2020, 9, 318. [Google Scholar] [CrossRef] [Green Version]
  20. Donato, L.; D’Angelo, R.; Alibrandi, S.; Rinaldi, C.; Sidoti, A.; Scimone, C. Effects of A2E-Induced Oxidative Stress on Retinal Epithelial Cells: New Insights on Differential Gene Response and Retinal Dystrophies. Antioxidants (Basel) 2020, 9, 307. [Google Scholar] [CrossRef] [Green Version]
  21. FastQC - Babraham Bioinformatics. Available online: https://www.bioinformatics.babraham.ac.uk/projects/fastqc/ (accessed on 19 November 2020).
  22. Okonechnikov, K.; Conesa, A.; Garcia-Alcalde, F. Qualimap 2: Advanced multi-sample quality control for high-throughput sequencing data. Bioinformatics 2016, 32, 292–294. [Google Scholar] [CrossRef] [PubMed]
  23. CLC Genomics Workbench 20.0.4. Available online: https://digitalinsights.qiagen.com (accessed on 19 November 2020).
  24. Alqahtani, F.; Mandoiu, I.I. Statistical Mitogenome Assembly with RepeaTs. J. Comput. Biol. 2020. [Google Scholar] [CrossRef] [PubMed]
  25. Plese, B.; Rossi, M.E.; Kenny, N.J.; Taboada, S.; Koutsouveli, V.; Riesgo, A. Trimitomics: An efficient pipeline for mitochondrial assembly from transcriptomic reads in nonmodel species. Mol. Ecol. Resour. 2019, 19, 1230–1239. [Google Scholar] [CrossRef] [PubMed] [Green Version]
  26. Weissensteiner, H.; Forer, L.; Fuchsberger, C.; Schopf, B.; Kloss-Brandstatter, A.; Specht, G.; Kronenberg, F.; Schonherr, S. mtDNA-Server: Next-generation sequencing data analysis of human mitochondrial DNA in the cloud. Nucleic Acids Res. 2016, 44, W64–W69. [Google Scholar] [CrossRef] [PubMed]
  27. MSeqDR: The Mitochondrial Disease Sequence Data Resource Consortium. Available online: https://mseqdr.org (accessed on 19 November 2020).
  28. Shen, L.; Attimonelli, M.; Bai, R.; Lott, M.T.; Wallace, D.C.; Falk, M.J.; Gai, X. MSeqDR mvTool: A mitochondrial DNA Web and API resource for comprehensive variant annotation, universal nomenclature collation, and reference genome conversion. Hum. Mutat. 2018, 39, 806–810. [Google Scholar] [CrossRef]
  29. Shen, L.; Diroma, M.A.; Gonzalez, M.; Navarro-Gomez, D.; Leipzig, J.; Lott, M.T.; van Oven, M.; Wallace, D.C.; Muraresku, C.C.; Zolkipli-Cunningham, Z.; et al. MSeqDR: A Centralized Knowledge Repository and Bioinformatics Web Resource to Facilitate Genomic Investigations in Mitochondrial Disease. Hum. Mutat. 2016, 37, 540–548. [Google Scholar] [CrossRef] [Green Version]
  30. Clima, R.; Preste, R.; Calabrese, C.; Diroma, M.A.; Santorsola, M.; Scioscia, G.; Simone, D.; Shen, L.; Gasparre, G.; Attimonelli, M. HmtDB 2016: Data update, a better performing query system and human mitochondrial DNA haplogroup predictor. Nucleic Acids Res. 2017, 45, D698–D706. [Google Scholar] [CrossRef]
  31. Liu, X.; Wu, C.; Li, C.; Boerwinkle, E. dbNSFP v3.0: A One-Stop Database of Functional Predictions and Annotations for Human Nonsynonymous and Splice-Site SNVs. Hum. Mutat. 2016, 37, 235–241. [Google Scholar] [CrossRef] [Green Version]
  32. Landrum, M.J.; Lee, J.M.; Benson, M.; Brown, G.R.; Chao, C.; Chitipiralla, S.; Gu, B.; Hart, J.; Hoffman, D.; Jang, W.; et al. ClinVar: Improving access to variant interpretations and supporting evidence. Nucleic Acids Res. 2018, 46, D1062–D1067. [Google Scholar] [CrossRef] [Green Version]
  33. Ruiz-Pesini, E.; Lott, M.T.; Procaccio, V.; Poole, J.C.; Brandon, M.C.; Mishmar, D.; Yi, C.; Kreuziger, J.; Baldi, P.; Wallace, D.C. An enhanced MITOMAP with a global mtDNA mutational phylogeny. Nucleic Acids Res. 2007, 35, D823–D828. [Google Scholar] [CrossRef] [Green Version]
  34. Belsare, S.; Levy-Sakin, M.; Mostovoy, Y.; Durinck, S.; Chaudhuri, S.; Xiao, M.; Peterson, A.S.; Kwok, P.Y.; Seshagiri, S.; Wall, J.D. Evaluating the quality of the 1000 genomes project data. BMC Genom. 2019, 20, 620. [Google Scholar] [CrossRef] [PubMed] [Green Version]
  35. Yates, A.; Akanni, W.; Amode, M.R.; Barrell, D.; Billis, K.; Carvalho-Silva, D.; Cummins, C.; Clapham, P.; Fitzgerald, S.; Gil, L.; et al. Ensembl 2016. Nucleic Acids Res. 2016, 44, D710–D716. [Google Scholar] [CrossRef] [PubMed]
  36. MITOS WebServer. Available online: http://mitos2.bioinf.uni-leipzig.de/index.py (accessed on 19 November 2020).
  37. Calabrese, C.; Simone, D.; Diroma, M.A.; Santorsola, M.; Gutta, C.; Gasparre, G.; Picardi, E.; Pesole, G.; Attimonelli, M. MToolBox: A highly automated pipeline for heteroplasmy annotation and prioritization analysis of human mitochondrial variants in high-throughput sequencing. Bioinformatics 2014, 30, 3115–3117. [Google Scholar] [CrossRef] [PubMed]
  38. Damas, J.; Carneiro, J.; Amorim, A.; Pereira, F. MitoBreak: The mitochondrial DNA breakpoints database. Nucleic Acids Res. 2014, 42, D1261–D1268. [Google Scholar] [CrossRef] [PubMed] [Green Version]
  39. Castellana, S.; Ronai, J.; Mazza, T. MitImpact: An exhaustive collection of pre-computed pathogenicity predictions of human mitochondrial non-synonymous variants. Hum. Mutat. 2015, 36, E2413–E2422. [Google Scholar] [CrossRef] [PubMed]
  40. Vaser, R.; Adusumalli, S.; Leng, S.N.; Sikic, M.; Ng, P.C. SIFT missense predictions for genomes. Nat. Protoc. 2016, 11, 1–9. [Google Scholar] [CrossRef]
  41. Adzhubei, I.; Jordan, D.M.; Sunyaev, S.R. Predicting functional effect of human missense mutations using PolyPhen-2. Curr. Protoc. Hum. Genet. 2013, 76. [Google Scholar] [CrossRef] [Green Version]
  42. Reva, B.; Antipin, Y.; Sander, C. Predicting the functional impact of protein mutations: Application to cancer genomics. Nucleic Acids Res. 2011, 39, e118. [Google Scholar] [CrossRef] [Green Version]
  43. Tang, H.; Thomas, P.D. PANTHER-PSEP: Predicting disease-causing genetic variants using position-specific evolutionary preservation. Bioinformatics 2016, 32, 2230–2232. [Google Scholar] [CrossRef]
  44. Rogers, M.F.; Shihab, H.A.; Mort, M.; Cooper, D.N.; Gaunt, T.R.; Campbell, C. FATHMM-XF: Accurate prediction of pathogenic point mutations via extended features. Bioinformatics 2018, 34, 511–513. [Google Scholar] [CrossRef] [Green Version]
  45. Choi, Y.; Chan, A.P. PROVEAN web server: A tool to predict the functional effect of amino acid substitutions and indels. Bioinformatics 2015, 31, 2745–2747. [Google Scholar] [CrossRef] [PubMed] [Green Version]
  46. Rentzsch, P.; Witten, D.; Cooper, G.M.; Shendure, J.; Kircher, M. CADD: Predicting the deleteriousness of variants throughout the human genome. Nucleic Acids Res. 2019, 47, D886–D894. [Google Scholar] [CrossRef] [PubMed]
  47. Zeng, S.; Yang, J.; Chung, B.H.; Lau, Y.L.; Yang, W. EFIN: Predicting the functional impact of nonsynonymous single nucleotide polymorphisms in human genome. BMC Genom. 2014, 15, 455. [Google Scholar] [CrossRef] [PubMed] [Green Version]
  48. Bromberg, Y.; Yachdav, G.; Rost, B. SNAP predicts effect of mutations on protein function. Bioinformatics 2008, 24, 2397–2398. [Google Scholar] [CrossRef] [Green Version]
  49. Capriotti, E.; Calabrese, R.; Casadio, R. Predicting the insurgence of human genetic diseases associated to single point protein mutations with support vector machines and evolutionary information. Bioinformatics 2006, 22, 2729–2734. [Google Scholar] [CrossRef] [PubMed] [Green Version]
  50. Schwarz, J.M.; Rodelsperger, C.; Schuelke, M.; Seelow, D. MutationTaster evaluates disease-causing potential of sequence alterations. Nat. Methods 2010, 7, 575–576. [Google Scholar] [CrossRef]
  51. Frousios, K.; Iliopoulos, C.S.; Schlitt, T.; Simpson, M.A. Predicting the functional consequences of non-synonymous DNA sequence variants—Evaluation of bioinformatics tools and development of a consensus strategy. Genomics 2013, 102, 223–228. [Google Scholar] [CrossRef] [Green Version]
  52. Wong, K.C.; Zhang, Z. SNPdryad: Predicting deleterious non-synonymous human SNPs using only orthologous protein sequences. Bioinformatics 2014, 30, 1112–1119. [Google Scholar] [CrossRef] [Green Version]
  53. Raimondi, D.; Tanyalcin, I.; Ferte, J.; Gazzo, A.; Orlando, G.; Lenaerts, T.; Rooman, M.; Vranken, W. DEOGEN2: Prediction and interactive visualization of single amino acid variant deleteriousness in human proteins. Nucleic Acids Res. 2017, 45, W201–W206. [Google Scholar] [CrossRef] [PubMed] [Green Version]
  54. Martin-Navarro, A.; Gaudioso-Simon, A.; Alvarez-Jarreta, J.; Montoya, J.; Mayordomo, E.; Ruiz-Pesini, E. Machine learning classifier for identification of damaging missense mutations exclusive to human mitochondrial DNA-encoded polypeptides. BMC Bioinform. 2017, 18, 158. [Google Scholar] [CrossRef] [Green Version]
  55. Lopes, M.C.; Joyce, C.; Ritchie, G.R.; John, S.L.; Cunningham, F.; Asimit, J.; Zeggini, E. A combined functional annotation score for non-synonymous variants. Hum. Hered. 2012, 73, 47–51. [Google Scholar] [CrossRef]
  56. Capriotti, E.; Altman, R.B.; Bromberg, Y. Collective judgment predicts disease-associated single nucleotide variants. BMC Genom. 2013, 14 (Suppl. 3), S2. [Google Scholar] [CrossRef] [PubMed] [Green Version]
  57. Yuan, X.; Bai, J.; Zhang, J.; Yang, L.; Duan, J.; Li, Y.; Gao, M. CONDEL: Detecting Copy Number Variation and Genotyping Deletion Zygosity from Single Tumor Samples using Sequence Data. IEEE/ACM Trans. Comput. Biol. Bioinform. 2018. [Google Scholar] [CrossRef] [PubMed]
  58. Castellana, S.; Fusilli, C.; Mazzoccoli, G.; Biagini, T.; Capocefalo, D.; Carella, M.; Vescovi, A.L.; Mazza, T. High-confidence assessment of functional impact of human mitochondrial non-synonymous genome variations by APOGEE. PLoS Comput. Biol. 2017, 13, e1005628. [Google Scholar] [CrossRef] [PubMed]
  59. Sherry, S.T.; Ward, M.H.; Kholodov, M.; Baker, J.; Phan, L.; Smigielski, E.M.; Sirotkin, K. dbSNP: The NCBI database of genetic variation. Nucleic Acids Res. 2001, 29, 308–311. [Google Scholar] [CrossRef] [PubMed] [Green Version]
  60. Ramani, R.; Krumholz, K.; Huang, Y.F.; Siepel, A. PhastWeb: A web interface for evolutionary conservation scoring of multiple sequence alignments using phastCons and phyloP. Bioinformatics 2019, 35, 2320–2322. [Google Scholar] [CrossRef]
  61. Accetturo, M.; Santamaria, M.; Lascaro, D.; Rubino, F.; Achilli, A.; Torroni, A.; Tommaseo-Ponzetta, M.; Attimonelli, M. Human mtDNA site-specific variability values can act as haplogroup markers. Hum. Mutat. 2006, 27, 965–974. [Google Scholar] [CrossRef]
  62. Simonetti, F.L.; Teppa, E.; Chernomoretz, A.; Nielsen, M.; Marino Buslje, C. MISTIC: Mutual information server to infer coevolution. Nucleic Acids Res. 2013, 41, W8–W14. [Google Scholar] [CrossRef] [Green Version]
  63. Tate, J.G.; Bamford, S.; Jubb, H.C.; Sondka, Z.; Beare, D.M.; Bindal, N.; Boutselakis, H.; Cole, C.G.; Creatore, C.; Dawson, E.; et al. COSMIC: The Catalogue Of Somatic Mutations In Cancer. Nucleic Acids Res. 2019, 47, D941–D947. [Google Scholar] [CrossRef] [Green Version]
  64. Gonzalez-Perez, A.; Deu-Pons, J.; Lopez-Bigas, N. Improving the prediction of the functional impact of cancer mutations by baseline tolerance transformation. Genome Med. 2012, 4, 89. [Google Scholar] [CrossRef] [Green Version]
  65. Carter, H.; Karchin, R. Predicting the functional consequences of somatic missense mutations found in tumors. Methods Mol. Biol. 2014, 1101, 135–159. [Google Scholar] [CrossRef] [PubMed]
  66. EVmutation Effects Predicted from Sequence Co-Variation. Available online: https://marks.hms.harvard.edu/evmutation/index.html (accessed on 19 November 2020).
  67. Iserte, J.; Simonetti, F.L.; Zea, D.J.; Teppa, E.; Marino-Buslje, C. I-COMS: Interprotein-COrrelated Mutations Server. Nucleic Acids Res. 2015, 43, W320–W325. [Google Scholar] [CrossRef] [PubMed] [Green Version]
  68. Preste, R.; Vitale, O.; Clima, R.; Gasparre, G.; Attimonelli, M. HmtVar: A new resource for human mitochondrial variations and pathogenicity data. Nucleic Acids Res. 2019, 47, D1202–D1210. [Google Scholar] [CrossRef] [PubMed] [Green Version]
  69. Sonney, S.; Leipzig, J.; Lott, M.T.; Zhang, S.; Procaccio, V.; Wallace, D.C.; Sondheimer, N. Predicting the pathogenicity of novel variants in mitochondrial tRNA with MitoTIP. PLoS Comput. Biol. 2017, 13, e1005867. [Google Scholar] [CrossRef] [PubMed]
  70. Niroula, A.; Vihinen, M. PON-mt-tRNA: A multifactorial probability-based method for classification of mitochondrial tRNA variations. Nucleic Acids Res. 2016, 44, 2020–2027. [Google Scholar] [CrossRef]
  71. Bindea, G.; Mlecnik, B.; Hackl, H.; Charoentong, P.; Tosolini, M.; Kirilovsky, A.; Fridman, W.H.; Pages, F.; Trajanoski, Z.; Galon, J. ClueGO: A Cytoscape plug-in to decipher functionally grouped gene ontology and pathway annotation networks. Bioinformatics 2009, 25, 1091–1093. [Google Scholar] [CrossRef] [Green Version]
  72. Bindea, G.; Galon, J.; Mlecnik, B. CluePedia Cytoscape plugin: Pathway insights using integrated experimental and in silico data. Bioinformatics 2013, 29, 661–663. [Google Scholar] [CrossRef]
  73. Shannon, P.; Markiel, A.; Ozier, O.; Baliga, N.S.; Wang, J.T.; Ramage, D.; Amin, N.; Schwikowski, B.; Ideker, T. Cytoscape: A software environment for integrated models of biomolecular interaction networks. Genome Res. 2003, 13, 2498–2504. [Google Scholar] [CrossRef]
  74. Kreutzer, D.A.; Essigmann, J.M. Oxidized, deaminated cytosines are a source of C --> T transitions in vivo. Proc. Natl. Acad. Sci. USA 1998, 95, 3578–3582. [Google Scholar] [CrossRef] [Green Version]
  75. Otten, A.B.C.; Sallevelt, S.; Carling, P.J.; Dreesen, J.; Drusedau, M.; Spierts, S.; Paulussen, A.D.C.; de Die-Smulders, C.E.M.; Herbert, M.; Chinnery, P.F.; et al. Mutation-specific effects in germline transmission of pathogenic mtDNA variants. Hum. Reprod. 2018, 33, 1331–1341. [Google Scholar] [CrossRef] [Green Version]
  76. Stewart, J.B.; Chinnery, P.F. The dynamics of mitochondrial DNA heteroplasmy: Implications for human health and disease. Nat. Rev. Genet. 2015, 16, 530–542. [Google Scholar] [CrossRef] [PubMed]
  77. Cruz, A.C.P.; Ferrasa, A.; Muotri, A.R.; Herai, R.H. Frequency and association of mitochondrial genetic variants with neurological disorders. Mitochondrion 2019, 46, 345–360. [Google Scholar] [CrossRef] [PubMed]
  78. Donato, L.; Scimone, C.; Nicocia, G.; Denaro, L.; Robledo, R.; Sidoti, A.; D’Angelo, R. GLO1 gene polymorphisms and their association with retinitis pigmentosa: A case-control study in a Sicilian population. Mol. Biol. Rep. 2018. [Google Scholar] [CrossRef] [PubMed]
  79. Donato, L.; Scimone, C.; Rinaldi, C.; Aragona, P.; Briuglia, S.; D’Ascola, A.; D’Angelo, R.; Sidoti, A. Stargardt Phenotype Associated With Two ELOVL4 Promoter Variants and ELOVL4 Downregulation: New Possible Perspective to Etiopathogenesis? Investig. Ophthalmol. Vis. Sci. 2018, 59, 843–857. [Google Scholar] [CrossRef] [PubMed] [Green Version]
  80. Scimone, C.; Donato, L.; Esposito, T.; Rinaldi, C.; D’Angelo, R.; Sidoti, A. A novel RLBP1 gene geographical area-related mutation present in a young patient with retinitis punctata albescens. Hum. Genom. 2017, 11, 18. [Google Scholar] [CrossRef]
  81. Nashine, S.; Nesburn, A.B.; Kuppermann, B.D.; Kenney, M.C. Age-related macular degeneration (AMD) mitochondria modulate epigenetic mechanisms in retinal pigment epithelial cells. Exp. Eye Res. 2019, 189, 107701. [Google Scholar] [CrossRef]
  82. Marie, M.; Bigot, K.; Angebault, C.; Barrau, C.; Gondouin, P.; Pagan, D.; Fouquet, S.; Villette, T.; Sahel, J.A.; Lenaers, G.; et al. Light action spectrum on oxidative stress and mitochondrial damage in A2E-loaded retinal pigment epithelium cells. Cell Death Dis. 2018, 9, 287. [Google Scholar] [CrossRef]
  83. Shaban, H.; Borras, C.; Vina, J.; Richter, C. Phosphatidylglycerol potently protects human retinal pigment epithelial cells against apoptosis induced by A2E, a compound suspected to cause age-related macula degeneration. Exp. Eye Res. 2002, 75, 99–108. [Google Scholar] [CrossRef]
  84. Kaarniranta, K.; Pawlowska, E.; Szczepanska, J.; Jablkowska, A.; Blasiak, J. Role of Mitochondrial DNA Damage in ROS-Mediated Pathogenesis of Age-Related Macular Degeneration (AMD). Int. J. Mol. Sci. 2019, 20. [Google Scholar] [CrossRef] [Green Version]
  85. Mehrzadi, S.; Hemati, K.; Reiter, R.J.; Hosseinzadeh, A. Mitochondrial dysfunction in age-related macular degeneration: Melatonin as a potential treatment. Expert. Opin. Ther. Targets 2020, 24, 359–378. [Google Scholar] [CrossRef]
  86. Machatha, S.G.W.; Young, S. Aldehyde Trapping Compounds and Uses Thereof. 2020. Available online: https://www.freepatentsonline.com (accessed on 20 November 2020).
  87. Marnett, L.J. Oxy radicals, lipid peroxidation and DNA damage. Toxicology 2002, 181–182, 219–222. [Google Scholar] [CrossRef]
  88. Suter, M.; Reme, C.; Grimm, C.; Wenzel, A.; Jaattela, M.; Esser, P.; Kociok, N.; Leist, M.; Richter, C. Age-related macular degeneration. The lipofusion component N-retinyl-N-retinylidene ethanolamine detaches proapoptotic proteins from mitochondria and induces apoptosis in mammalian retinal pigment epithelial cells. J. Biol. Chem. 2000, 275, 39625–39630. [Google Scholar] [CrossRef] [PubMed] [Green Version]
  89. Lambowitz, A.M.; Belfort, M. Introns as mobile genetic elements. Annu. Rev. Biochem. 1993, 62, 587–622. [Google Scholar] [CrossRef] [PubMed]
  90. Hu, X.; Calton, M.A.; Tang, S.; Vollrath, D. Depletion of Mitochondrial DNA in Differentiated Retinal Pigment Epithelial Cells. Sci. Rep. 2019, 9, 15355. [Google Scholar] [CrossRef] [PubMed] [Green Version]
  91. Jadeja, R.N.; Thounaojam, M.C.; Bartoli, M.; Martin, P.M. Implications of NAD(+) Metabolism in the Aging Retina and Retinal Degeneration. Oxid. Med. Cell Longev. 2020, 2020, 2692794. [Google Scholar] [CrossRef] [PubMed]
  92. Saadat, K.A.; Murakami, Y.; Tan, X.; Nomura, Y.; Yasukawa, T.; Okada, E.; Ikeda, Y.; Yanagi, Y. Inhibition of autophagy induces retinal pigment epithelial cell damage by the lipofuscin fluorophore A2E. FEBS Open Biol. 2014, 4, 1007–1014. [Google Scholar] [CrossRef] [Green Version]
  93. Vives-Bauza, C.; Anand, M.; Shiraz, A.K.; Magrane, J.; Gao, J.; Vollmer-Snarr, H.R.; Manfredi, G.; Finnemann, S.C. The age lipid A2E and mitochondrial dysfunction synergistically impair phagocytosis by retinal pigment epithelial cells. J. Biol. Chem. 2008, 283, 24770–24780. [Google Scholar] [CrossRef] [Green Version]
  94. Agnez-Lima, L.F.; Melo, J.T.; Silva, A.E.; Oliveira, A.H.; Timoteo, A.R.; Lima-Bessa, K.M.; Martinez, G.R.; Medeiros, M.H.; Di Mascio, P.; Galhardo, R.S.; et al. DNA damage by singlet oxygen and cellular protective mechanisms. Mutat. Res. Rev. Mutat. Res. 2012, 751, 15–28. [Google Scholar] [CrossRef]
  95. Rodgers, K.; McVey, M. Error-Prone Repair of DNA Double-Strand Breaks. J. Cell Physiol. 2016, 231, 15–24. [Google Scholar] [CrossRef] [Green Version]
  96. Sies, H.; Menck, C.F. Singlet oxygen induced DNA damage. Mutat. Res. 1992, 275, 367–375. [Google Scholar] [CrossRef]
  97. Udar, N.; Atilano, S.R.; Memarzadeh, M.; Boyer, D.S.; Chwa, M.; Lu, S.; Maguen, B.; Langberg, J.; Coskun, P.; Wallace, D.C.; et al. Mitochondrial DNA haplogroups associated with age-related macular degeneration. Investig. Ophthalmol. Vis. Sci. 2009, 50, 2966–2974. [Google Scholar] [CrossRef] [PubMed]
  98. Nguyen, N.N.Y.; Kim, S.S.; Jo, Y.H. Deregulated Mitochondrial DNA in Diseases. DNA Cell Biol. 2020, 39, 1385–1400. [Google Scholar] [CrossRef] [PubMed]
Figure 1. Proposed pipeline of mtDNA variant analysis. Figure shows applied workflow of mtDNA variant analysis, highlighting the single macro-steps with specific tools and explored databases.
Antioxidants 09 01158 g001
Figure 2. Revised Cambridge Reference Sequence (rCRS) reference mtDNA sequence. Figure shows main genomic features of Revised Cambridge Reference Sequence (rCRS), available as sequence number NC_012920 in the GenBank RefSeq database.
Antioxidants 09 01158 g002
Figure 3. Cell viability from methylthiazolyldiphenyl-tetrazolium bromide (MTT) assay. Retinal pigment epithelium (RPE) cell survival percentage is expressed as mean of replicates ± standard error of mean, considering three replicates for each independent experiment (n = 3). Multiple t-tests were performed for statistical comparisons (p < 0.05). Results were assessed at both treatment considered time points (3 h and 6 h) compared to time zero untreated group.
Antioxidants 09 01158 g003
Figure 4. Protein coding gene plots. Figure shows annotated protein coding genes after congruences detection from BLASTX. The protein plot highlights the quality value (on a log scale) for each gene and each position if it is above the threshold. Different genes are evidenced by distinctive colors, with the initial hits corresponding to the represented “mountains”. The lines shown on the top represent the reported annotation. Annotation of protein coding genes reached the best results in untreated sample (a) while, in both time-related treated samples, the only protein coding gene identified with high quality was NAD1 (b,c).
Antioxidants 09 01158 g004
Figure 5. Non-coding RNA plots. The non-coding RNA plots show the hits from computation of rRNAs and tRNAs, differentiating between the hits from the global and local (if present) search by line type. The hits are prioritized: “1” refers to features set in the first round when tools take the prediction hit of each feature, while “2” refers to all other features set afterwards in the remaining unassigned regions. Reverse log scale for the e-value was considered. The untreated sample (a) showed the highest number of annotated tRNAs, as well as the widest positions covered among mitogenomes, while both treated samples (b,c) were the most reliable in rRNA.
Antioxidants 09 01158 g005
Figure 6. Non-coding RNA secondary structure computed by MITOS2. Figures represent main secondary structures of tRNAs ((a) and right element of (c)) and rRNAs ((b) and left element of (c)) output by MITOS2 analyses on all RPE cell transcriptomes.
Antioxidants 09 01158 g006
Figure 7. MtDNA-Server coverage plots. Figure shows coverage for each RNA-Seq sample, evaluated in all time-related conditions (a = 0 h, b = 3 h, c = 6 h). Coverage analysis permitted the detection of issues with incorrect concentration of polymerase chain reaction products for the used fragments. The highest coverage was reached around the 7500 nt position in untreated sample (a).
Antioxidants 09 01158 g007
Figure 8. Results of heteroplasmic analyses by mtDNA-Server. The tool mtDNA-Server found heteroplasmic significant results in all samples, evaluated in all time-related conditions (a = 0 h, b = 3 h, c = 6 h), reaching the highest scores in 6 h treated sample. The highest peaks were reached by MT-CO1 and MT-CO3 loci in 3 h treated (b), and by MT-CYB locus in 6 h treatment (c).
Antioxidants 09 01158 g008
Figure 9. Pathway analysis by Cytoscape and its plugins. The spherical graph represents the significant pathways computed by Cytoscape, ClueGO and CluePedia. It is clear that regulation of adenosine triphosphate (ATP) biosynthesis represents the most altered pathway following the oxidative treatment with A2E.
Antioxidants 09 01158 g009
Table 1. Alignment and assembly statistics of RNA-Seq analyzed samples. Table shows main features related to mitochondrial transcripts shared in overall RNA, as well as mapping and assembly steps performed on RNA-Seq samples by CLC Genomics Workbench, SMART2 and TRIMITOMICS algorithms. Values are reported as the mean of the three algorithms and of all three biological replicates for each sample.
Statistics Feature0h_RPE3h_RPE6h_RPE
Overall Passed Reads52,752,35326,262,32419,520,749
Passed FWD Reads51,913,96916,056,48619,301,263
Passed REV Reads838,384205,838219,486
Mapping Quality OK440,014132,054162,126
Mapping Quality BAD29,37210,60315,517
Unmapped Reads000
Base Read Quality OK52,752,35316,262,32419,520,749
Base Read Quality BAD15,127,1873,805,6714,905,387
Bad Alignment000
Duplicates000
Short Reads (<25 bp)000
Mitochondrial Transcripts29,12327,09525,471
Table 2. RNA-Seq sample variant annotation summary. Table reports a summary of detected variants, together with key mitogenome variant annotations from examined databases by mvTool, MitoBreak and MitoMaster.
0h_RPE3h_RPE6h_RPE
Heteroplasmic Variants (Global)26320195
Unique annotated variants (Global)342945
mvToolMSeqDR Community Data PopulationN° Variants202121
Mitomap Disease444
Mitomap Status3 Reported,
1 Conflicting
3 Reported,
1 Conflicting
3 Reported,
1 Conflicting
HmtDB Pathogenicity8 Pending,
4 Benign
8 Pending,
4 Benign
9 Pending,
4 Benign
Disease and PhenotypesdbSNP171718
MSeqDR Clinical Significance4 Likely Pathogenic,
2 Not Provided
4 Likely Pathogenic,
2 Not Provided
4 Likely Pathogenic,
2 Not Provided
HmtDB Disease444
COSMIC111
ICGC222
VEPImpact11 Low, 4 Moderate,
8 Modifier
11 Low, 5 Moderate,
8 Modifier
11 Low, 4 Moderate,
13 Modifier
Biotype23 Protein Coding24 Protein Coding28 Protein Coding,
1 mt_rRNA
Consequence Terms16 Synonymous,
3 Missense,
4 Upstream
14 Synonymous,
5 Missense,
4 Upstream
11 Synonymous,
12 Missense,
4 Upstream,
1 Non-coding Transcript Exon
CADDRaw Raknscore111
HmtDB Patho TableN° Variants333
Pathogenicity111
MitoBreakN° Deletions010
Healthy Tissue0Aged Tissues0
Del of replication origins0None0
Location of the deleted regions0Inside the major arc0
MitoMasterN° Variants20 Transitions20 Transitions,
1 Transversion
21 Transitions
Mut Type15 Coding,
5 Non-coding
17 Coding,
4 Non-coding
16 Coding,
5 Non-coding
Patient Report444
Table 3. In-silico functional prediction analyses report. Table shows principal results on pathogenicity prediction of identified variants through all samples. The main macro-resources used are highlighted in red.
MitImpact 3D0h_RPE3h_RPE6h_RPEMitImpact 3D0h_RPE3h_RPE6h_RPEMitImpact 3D0h_RPE3h_RPE6h_RPE
N° Variants342945N° Variants342945N° Variants342945
PolyPhen 2Benign978FatHmmNeutral9810Mutation AssessorNeutral Impact534
Probably damaging558Deleterious546Low impact324
SIFTNeutral12913PROVEANNeutral9810Medium impact224
Deleterious233Deleterious549High impact333
EFIN_SPNeutral121013CADDNeutral746PhD-SNPNeutral7410
Damaging223Deleterious7810Disease786
EFIN_HDNeutral11912PANTHERNeutral10710SNAPNeutral858
Damaging334Disease436Disease678
Meta-SNPNeutral868CondelNeutral446MToolBoxNeutral656
Disease668Deleterious10810Deleterious8710
CAROLNeutral10810COVEC_WMVNeutral10810APOGEEN111011
Deleterious446Deleterious446P325
Mutation TasterPolymorphism10913CLINVARYes222Mitoclass1Neutral1079
Disease Causing232No121014Damaging457
dbSNPSNP446MitomapYes002DDG_IntraYes868
New Mutation10810No141214No668
DDG_InterYes211EV_MutationYes8510Pon-mt-tRNAN° Variants002
No121117No676Neutral or Likely Neutral//2
HmtVARN° Variants131914HmtVARN° Variants131914HmtVARN° Variants131914
CDS7148rRNA311Polymorphic220
Regulatory344tRNA002Likely Polymorphic101
Likely Pathogenic102Pathogenic010Unavailable91612
Publisher’s Note: MDPI stays neutral with regard to jurisdictional claims in published maps and institutional affiliations.

