Subcritical Water Extraction of Phenolic Compounds from Onion Skin Wastes (Allium cepa cv. Horcal): Effect of Temperature and Solvent Properties


Abstract
:
1. Introduction
2. Materials and Methods
2.1. Sample Preparation
2.2. Analytical Methods
2.2.1. Total Phenolics Content (TPC)
2.2.2. Total Flavonoids Content (TFC)
2.2.3. Antioxidant Activity (AA). FRAP Assay
2.2.4. Characterization of Phenolics and Flavonoids in Extracts
2.3. Conventional Extraction
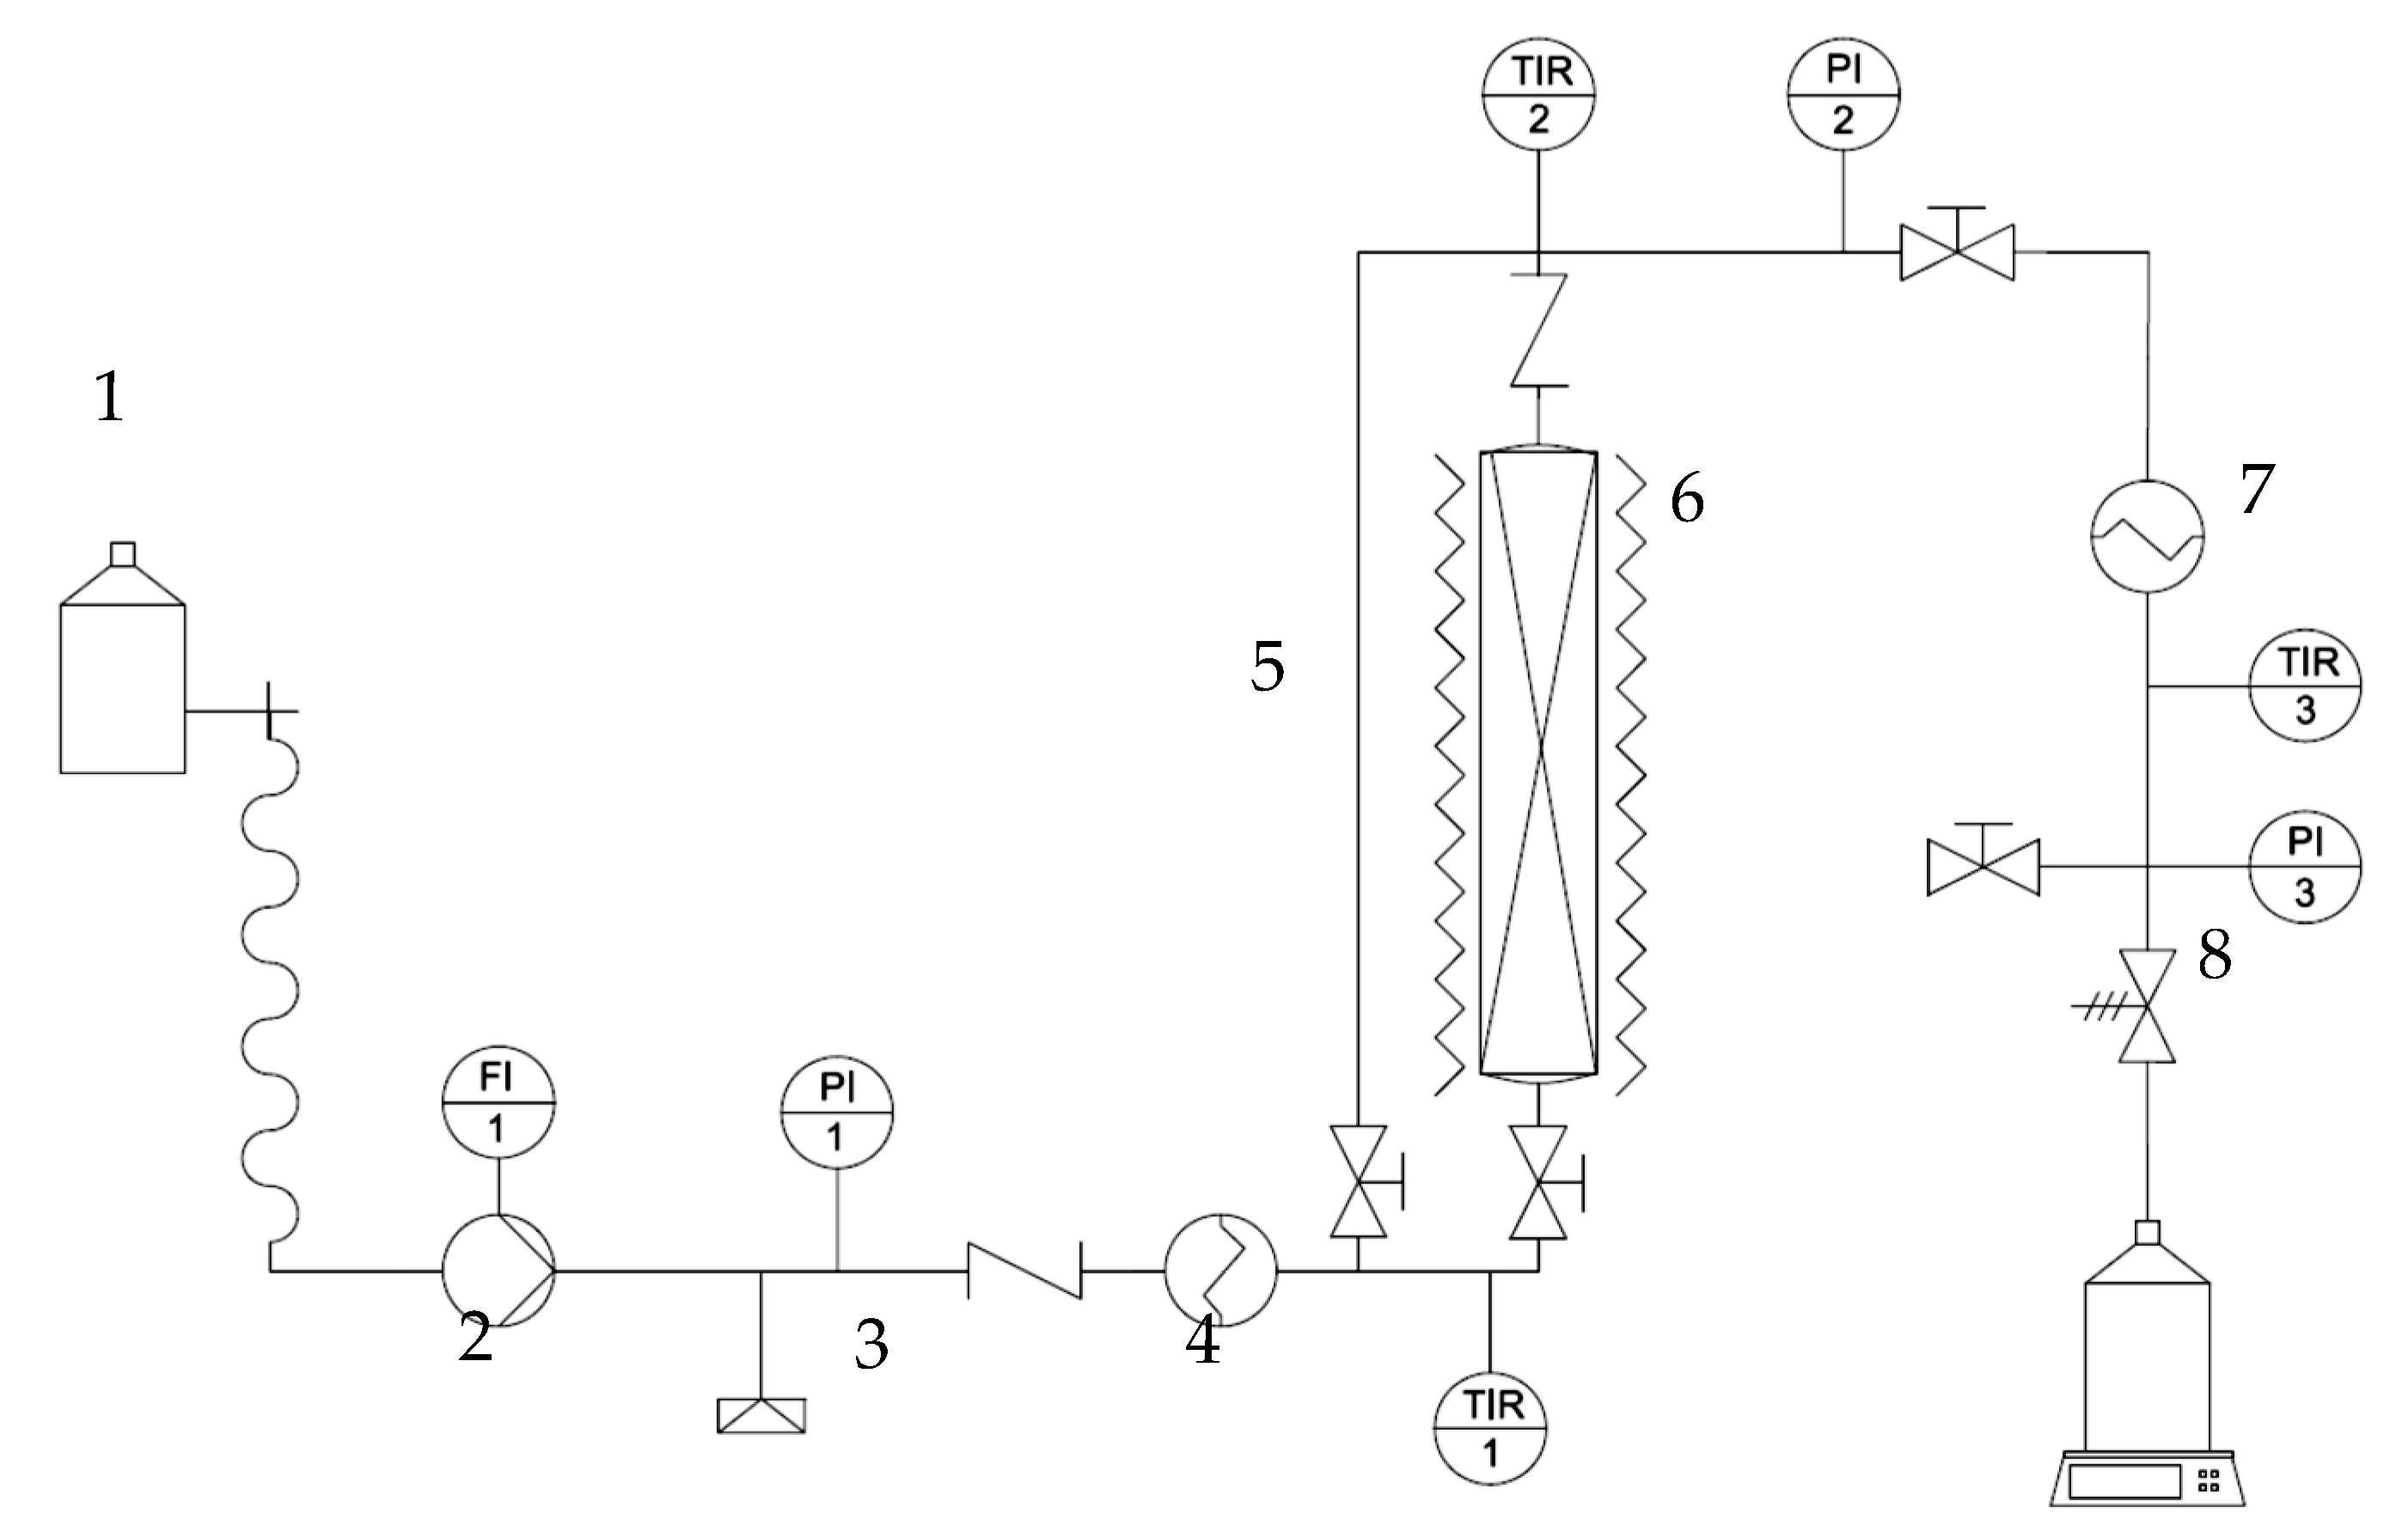
2.4. Subcritical Water Extraction
Subcritical Water Extraction Modelling
2.5. Statistical Analysis
3. Results
3.1. Extraction Experiments
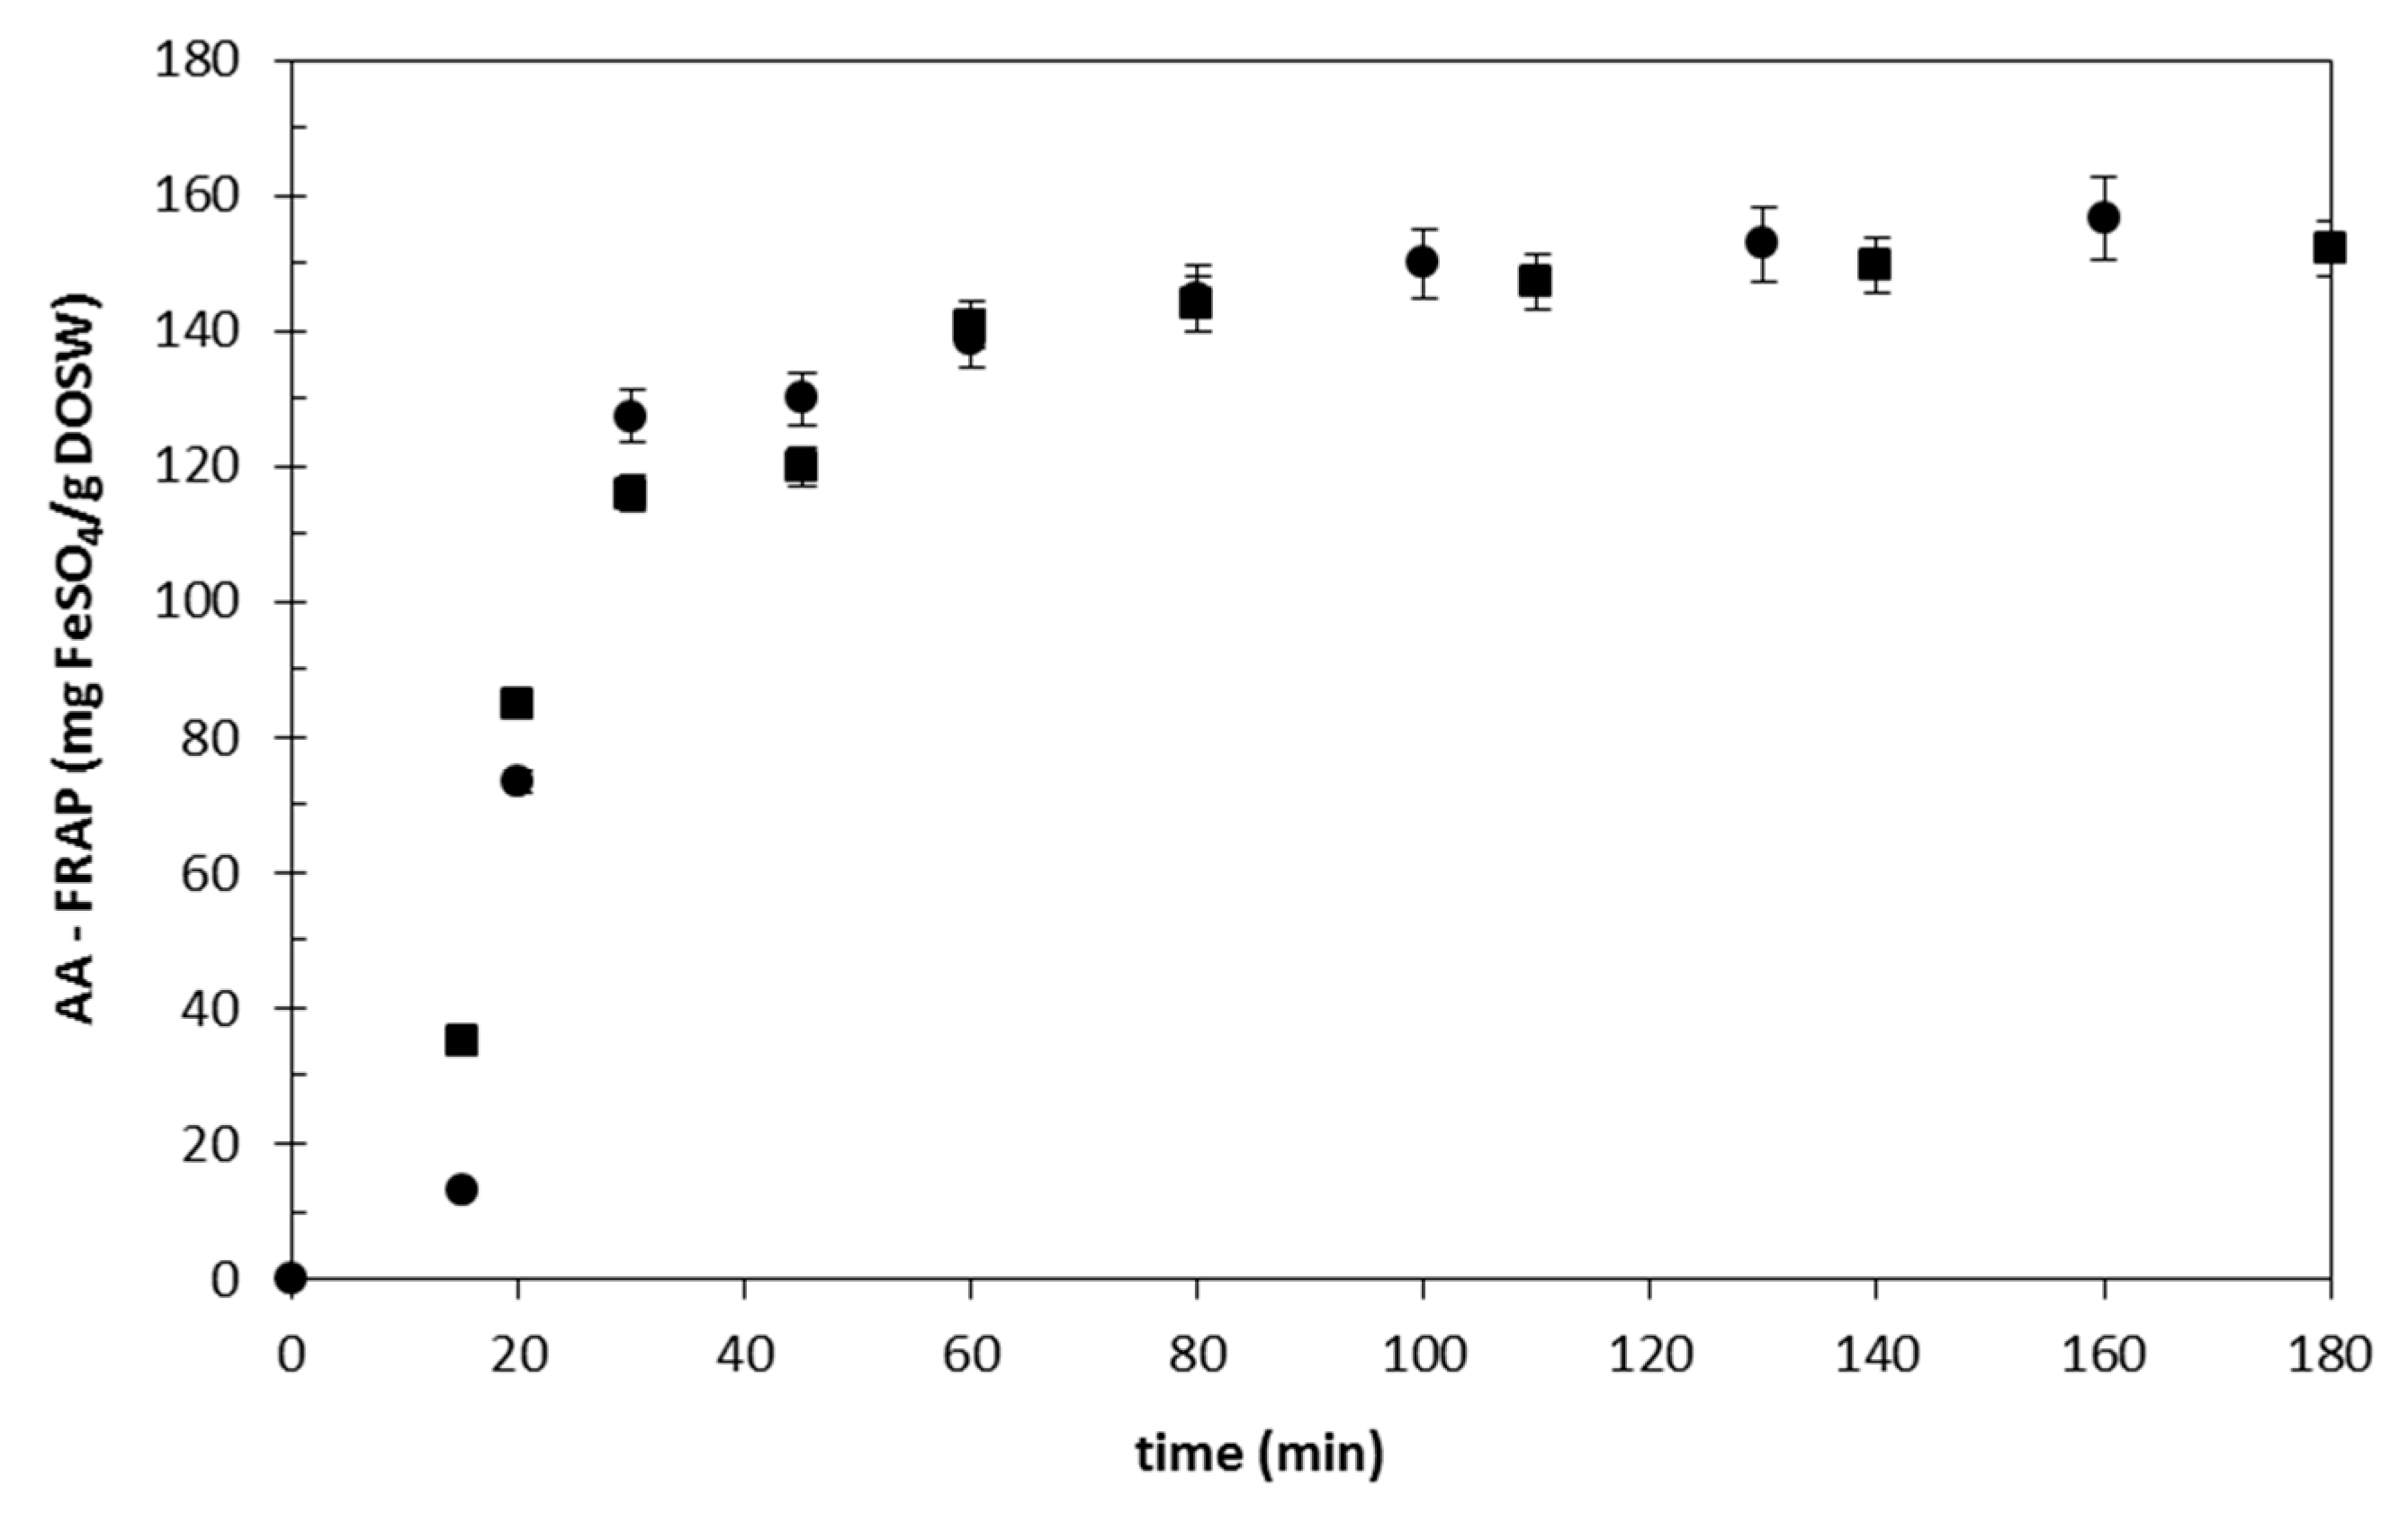
3.1.1. Conventional Extraction: Ethanol/Water 70% (v/v)
3.1.2. Subcritical Water Extraction
Effect of the Flow Rate
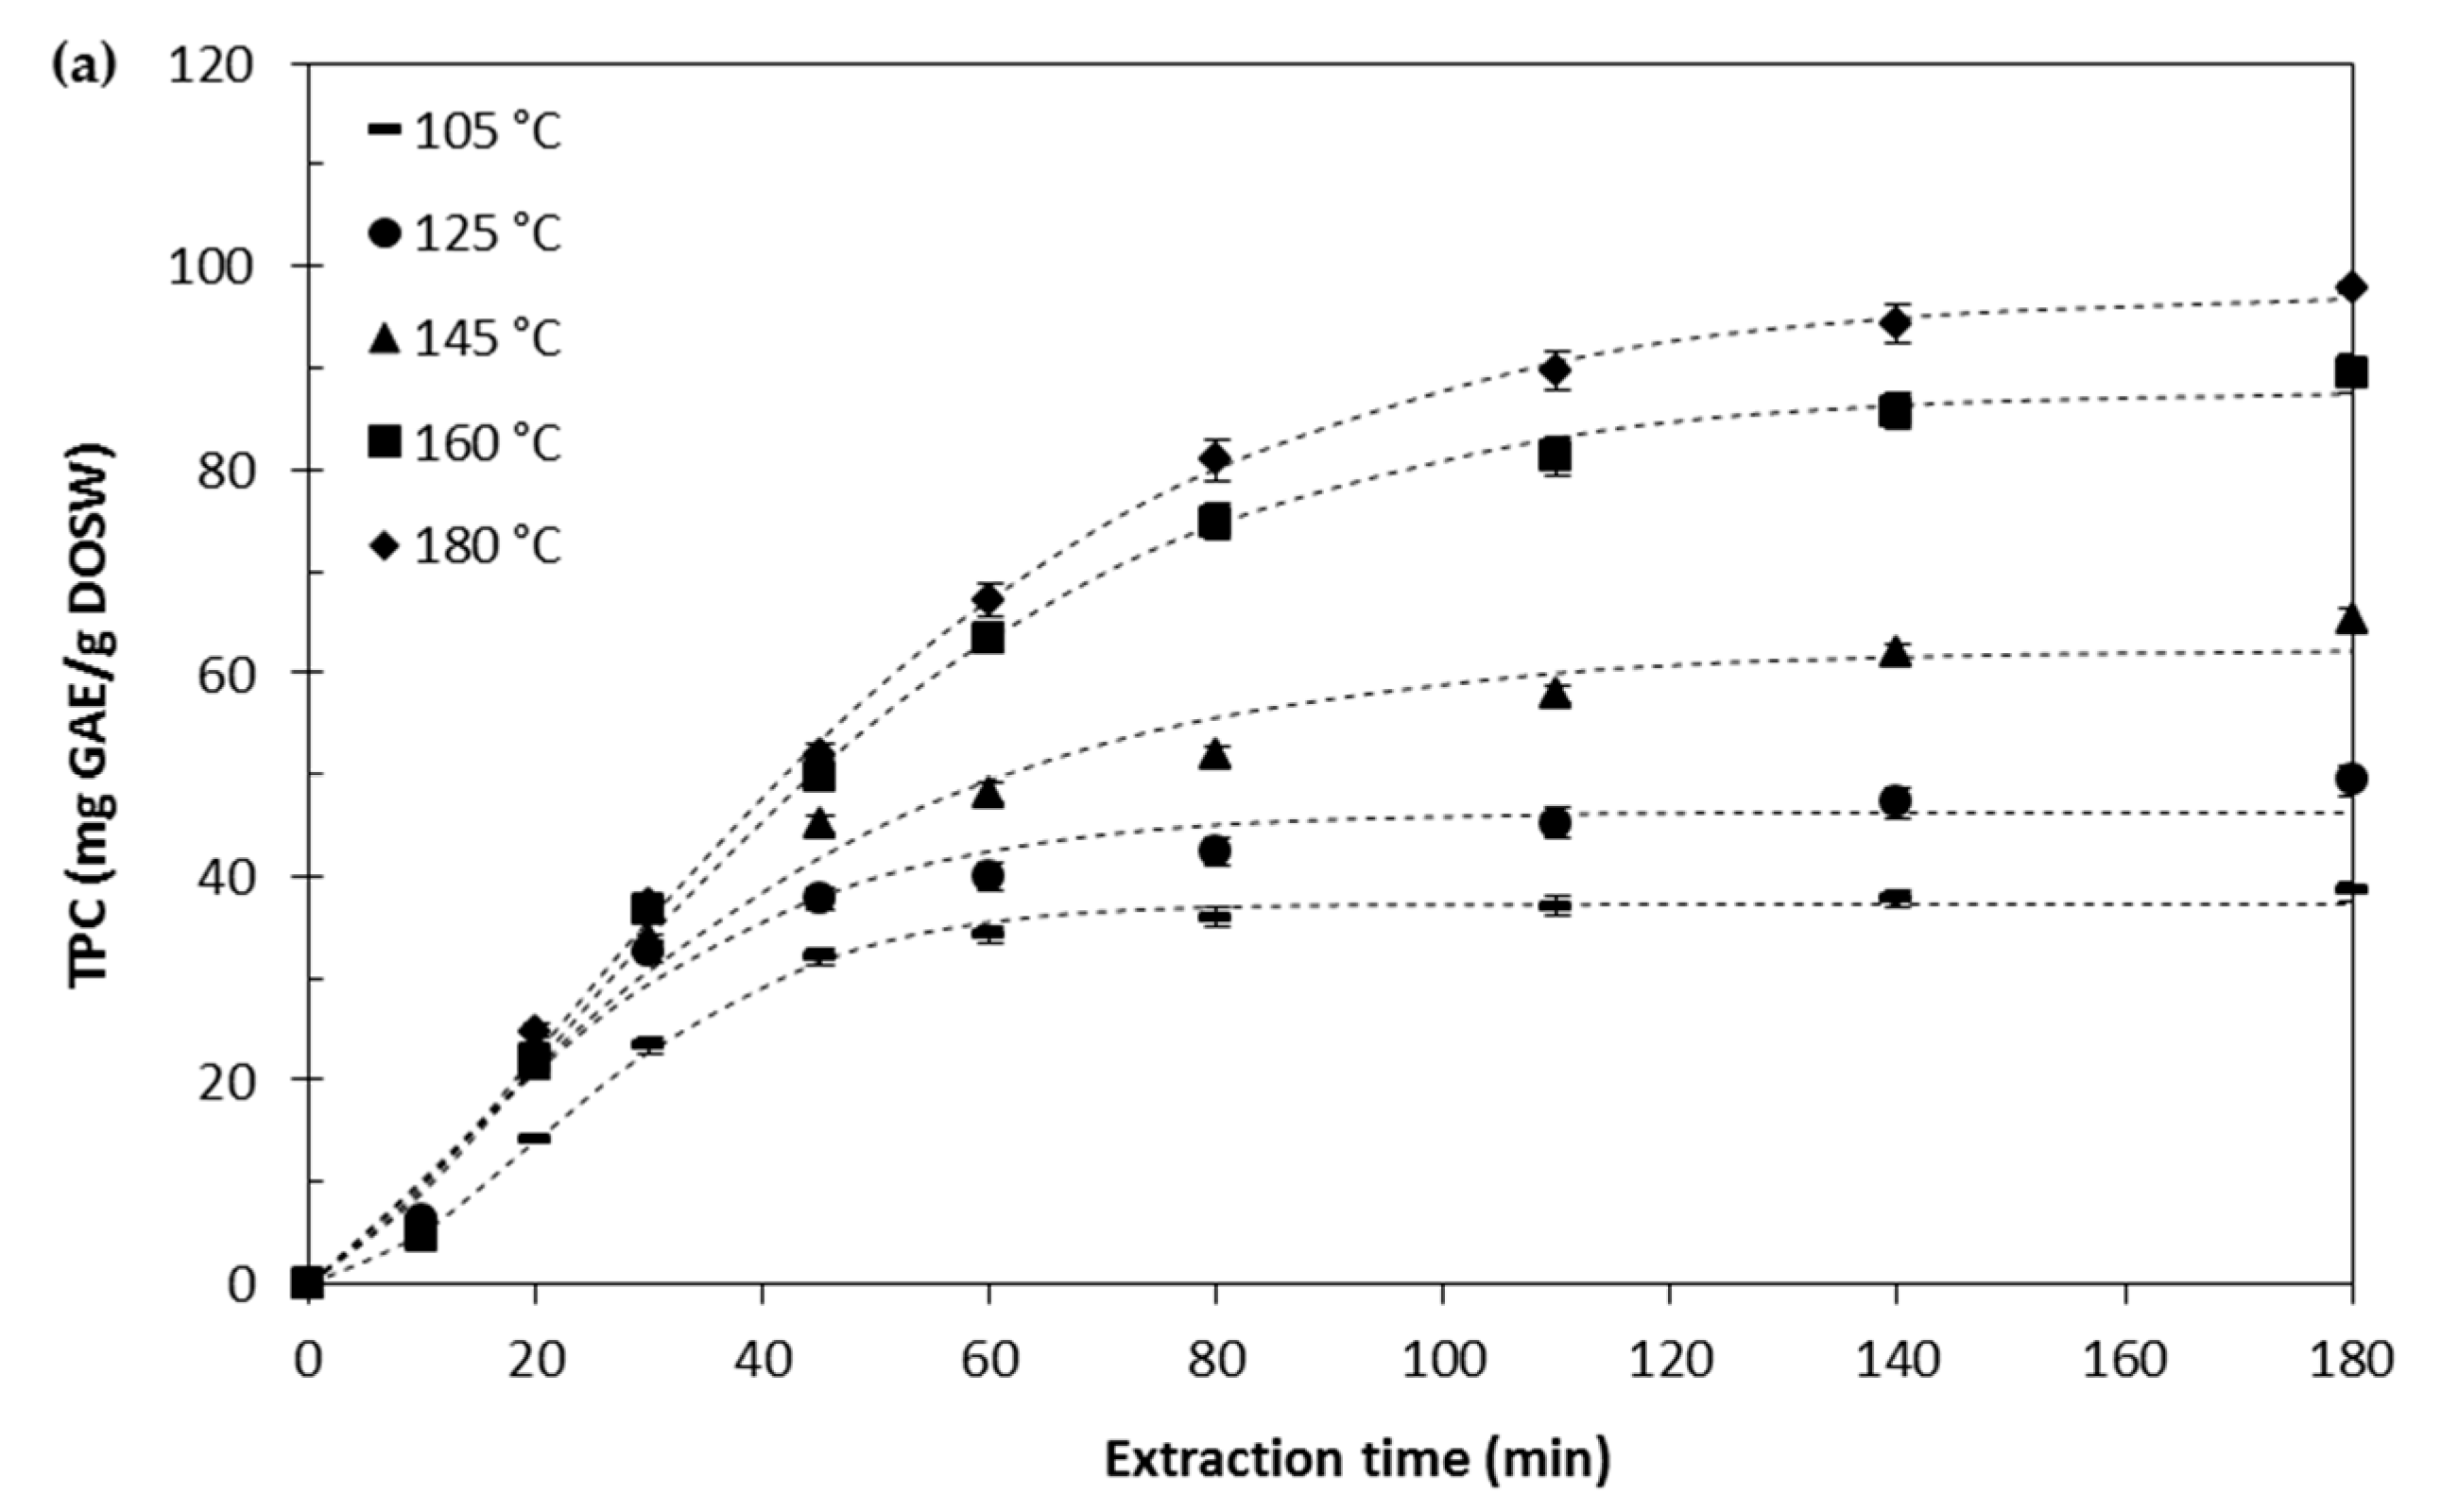
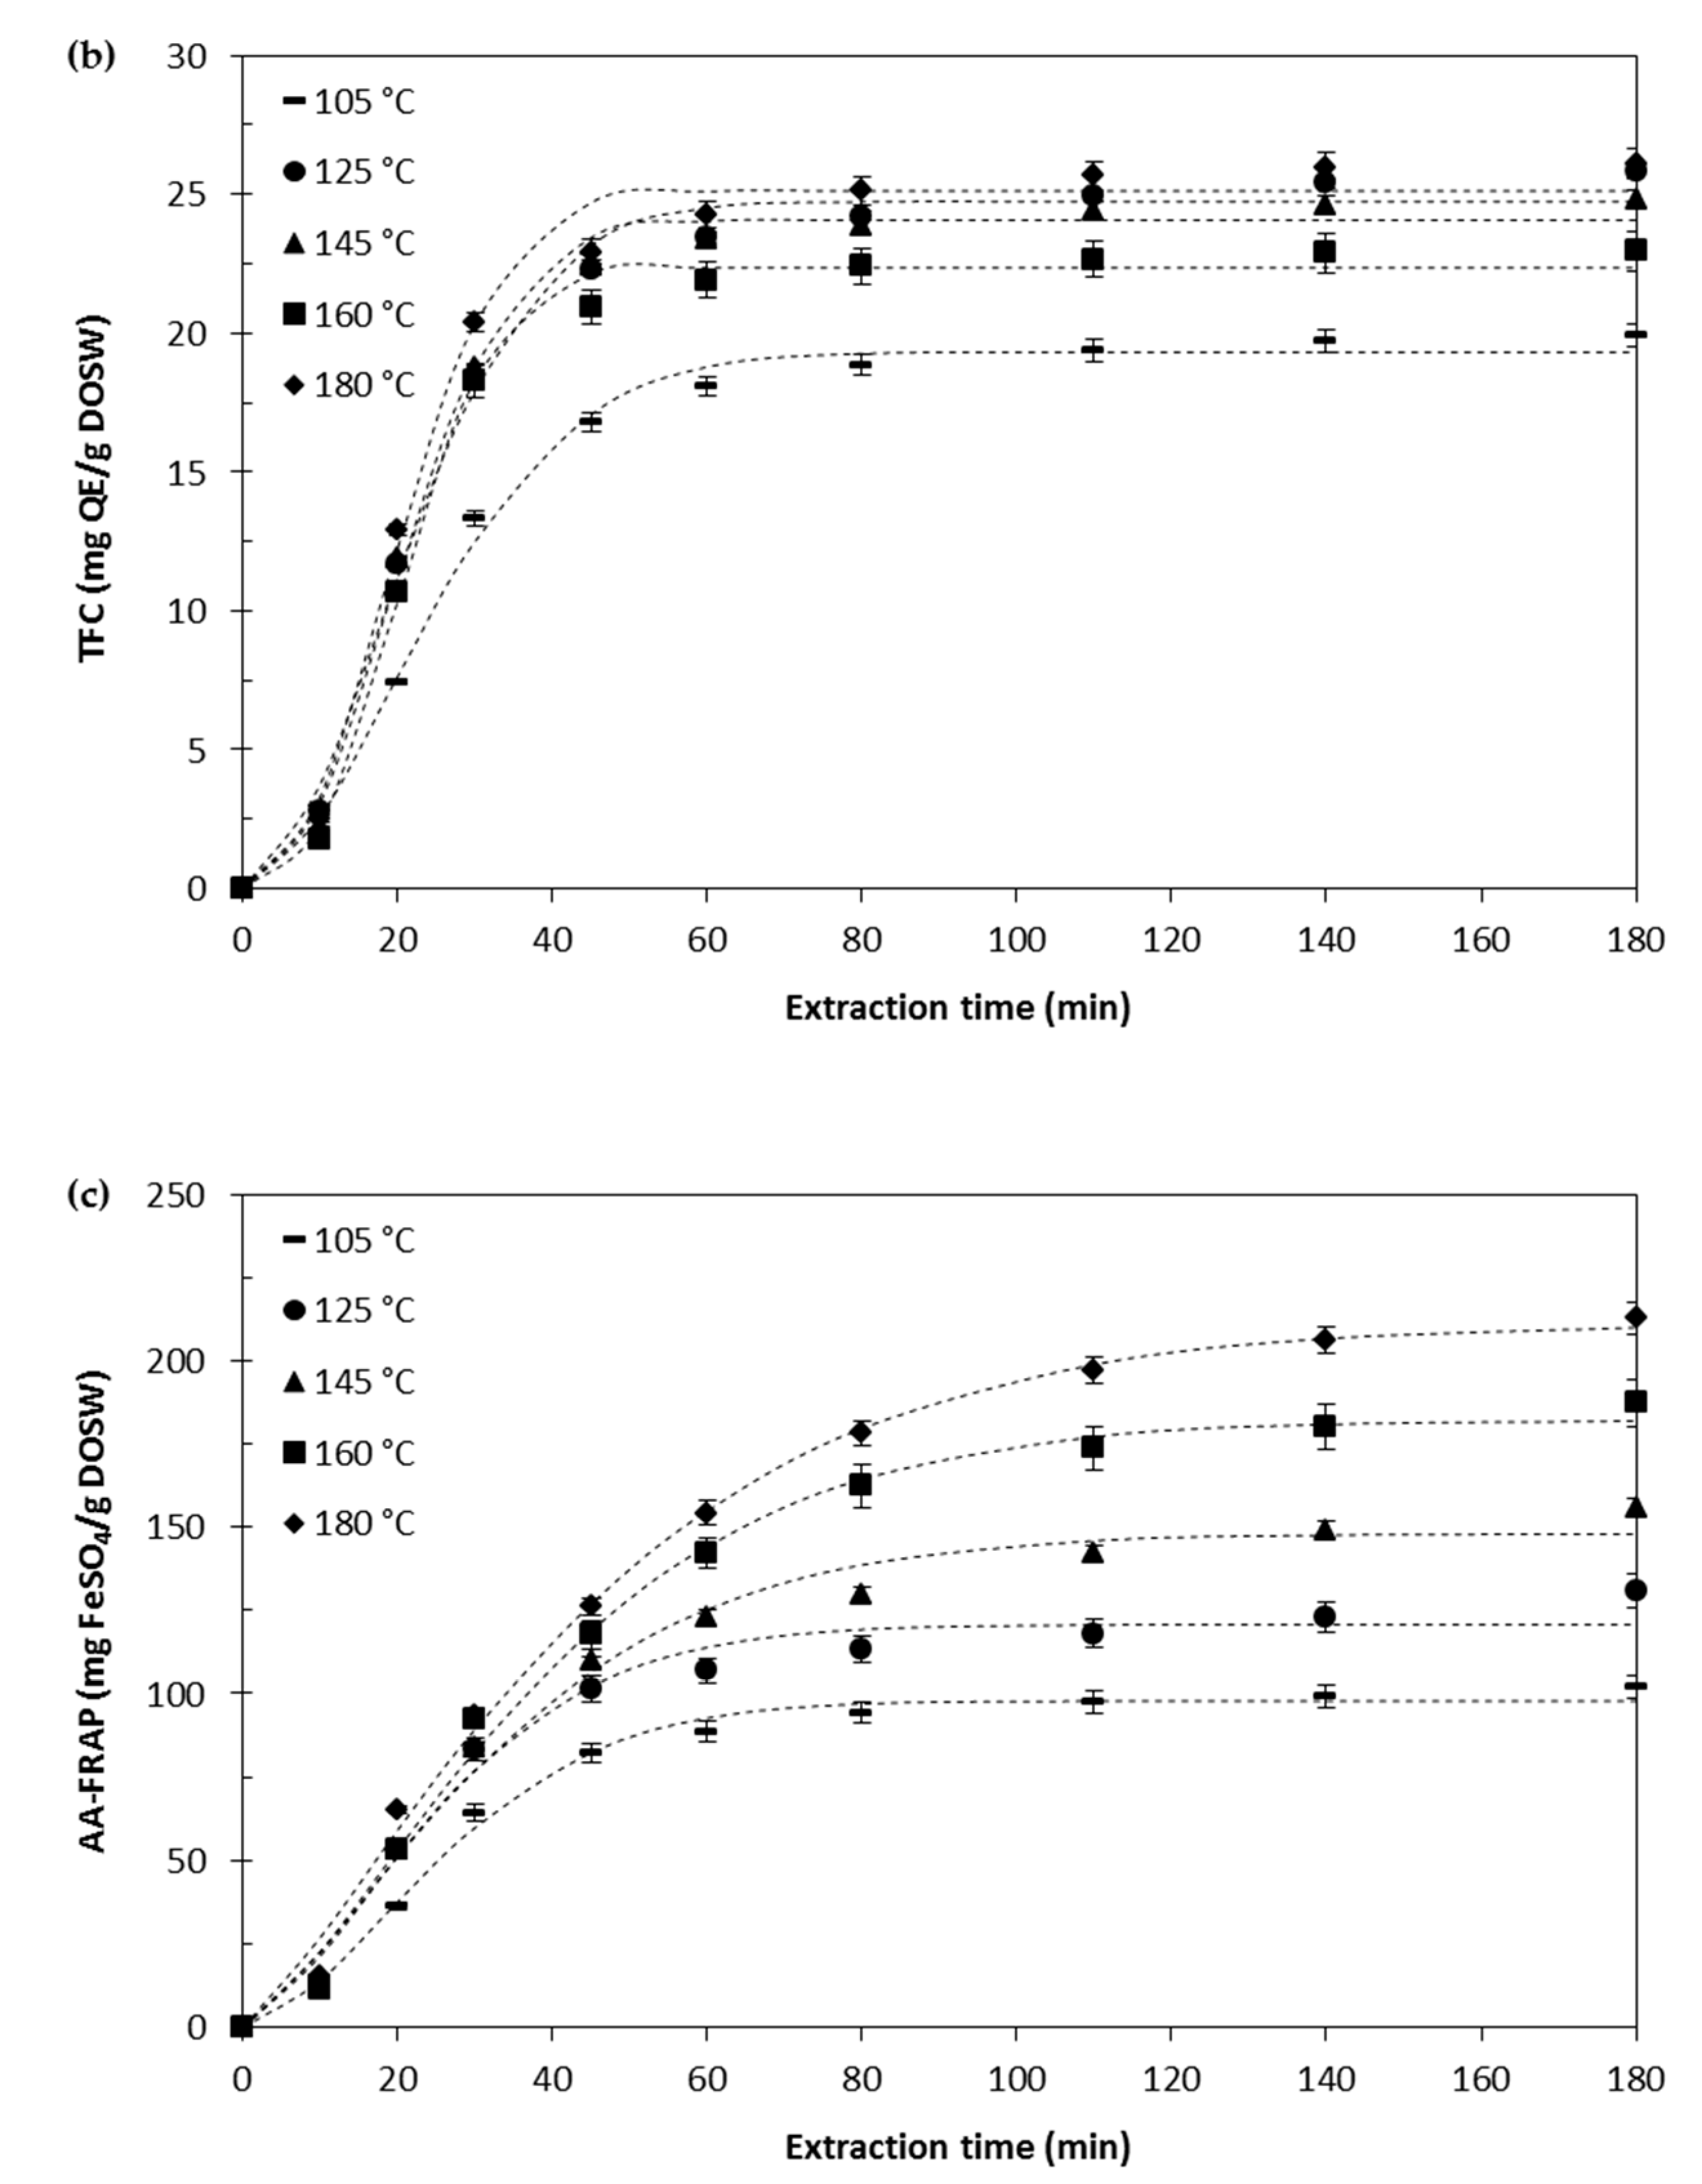
Effect of the Extraction Temperature
Kinetic Modelling
3.2. Polyphenols Identification
3.2.1. Conventional Extraction: Ethanol/Water 70% (v/v) Experiment
3.2.2. Subcritical Water Experiments
The Effect of the Medium on the Phenolic Compounds Solubilization
Effect of the Temperature on the Bioactive Compounds Extracted
4. Conclusions
Supplementary Materials
Author Contributions
Funding
Acknowledgments
Conflicts of Interest
References
- Communication from the Commission to the European Parliament, the Council, the European Economic and Social Committee and the Committee of the Regions Closing the Loop—An EU Action Plan for the Circular Economy. COM(2015) 614 Final. 2015. Available online: https://eur-lex.europa.eu/legal-content/EN/TXT/?uri=CELEX:52015DC0614 (accessed on 15 September 2020).
- Choi, I.S.; Cho, E.J.; Moon, J.H.; Bae, H.J. Onion skin waste as a valorization resource for the by-products quercetin and biosugar. Food Chem. 2015, 188, 537–542. [Google Scholar] [CrossRef] [PubMed]
- FAO. Food and Agriculture Organzation of the United Nations 2018. Spain Onion Annual Production. Available online: http://www.fao.org/faostat/es/#data (accessed on 9 May 2020).
- Munir, M.T.; Kheirkhah, H.; Baroutian, S.; Quek, S.Y.; Young, B.R. Subcritical water extraction of bioactive compounds from waste onion skin. J. Clean. Prod. 2018, 183, 487–494. [Google Scholar] [CrossRef]
- Roldan, E.; Sánchez-Moreno, C.; de Ancos, B.; Cano, M.P. Characterisation of onion (Allium cepa L.) by-products as food ingredients with antioxidant and antibrowning properties. Food Chem. 2008, 108, 907–916. [Google Scholar] [CrossRef]
- Beesk, N.; Perner, H.; Schwarz, D.; George, E.; Kroh, L.W.; Rohn, S. Quercetin in different parts of the onion bulb (Allium cepa L.) influenced by genotype. Food Chem. 2010, 122, 566–571. [Google Scholar] [CrossRef]
- Rodríguez Galdón, B.; Rodríguez Rodríguez, E.M.; Díaz Romero, C. Flavonoids in onion cultivars (Allium cepa L.). J. Food Sci. 2008, 73, C599–C605. [Google Scholar] [CrossRef]
- Hollman, P.C.H.; Arts, I.C.W. Flavonols, flavones and flavanols—Nature, occurrence and dietary burden. J. Sci. Food Agric. 2000, 80, 1081–1093. [Google Scholar] [CrossRef]
- Ghosh, S.; Dungdung, S.R.; Chowdhury, S.T.; Mandal, A.K.; Sarkar, S.; Ghosh, D.; Das, N. Encapsulation of the flavonoid quercetin with an arsenic chelator into nanocapsules enables the simultaneous delivery of hydrophobic and hydrophilic drugs with a synergistic effect against chronic arsenic accumulation and oxidative stress. Free Radic. Biol. Med. 2011, 51, 1893–1902. [Google Scholar] [CrossRef]
- Caridi, D.; Trenerry, V.C.; Rochfort, S.; Duong, S.; Laugher, D.; Jones, R. Profiling and quantifying quercetin glucosides in onion (Allium cepa L.) varieties using capillary zone electrophoresis and high performance liquid chromatography. Food Chem. 2007, 105, 691–699. [Google Scholar] [CrossRef]
- Rhodes, M.J.C.; Price, K.R. Analytical problems in the study of flavonoid compounds in onions. Food Chem. 1996, 57, 113–117. [Google Scholar] [CrossRef]
- Ghatak, D.; Iyyaswami, R. Selective encapsulation of quercetin from dry onion peel crude extract in reassembled casein particles. Food Bioprod. Process. 2019, 115, 100–109. [Google Scholar] [CrossRef]
- Acosta-Estrada, B.A.; Gutiérrez-Uribe, J.A.; Serna-Saldívar, S.O. Bound phenolics in foods, a review. Food Chem. 2014, 152, 46–55. [Google Scholar] [CrossRef] [PubMed]
- Chu, Y.F.; Sun, J.; Wu, X.; Liu, R.H. Antioxidant and antiproliferative activities of common vegetables. J. Agric. Food Chem. 2002, 50, 6910–6916. [Google Scholar] [CrossRef] [PubMed]
- Wach, A.; Pyrzynska, K.; Biesaga, M. Quercetin content in some food and herbal samples. Food Chem. 2007, 100, 699–704. [Google Scholar] [CrossRef]
- Jang, M.; Asnin, L.; Nile, S.H.; Keum, Y.S.; Kim, H.Y.; Park, S.W. Ultrasound-assisted extraction of quercetin from onion solid wastes. Int. J. Food Sci. Technol. 2013, 48, 246–252. [Google Scholar] [CrossRef]
- Kumar, B.; Smita, K.; Kumar, B.; Cumbal, L.; Rosero, G. Microwave-assisted extraction and solid-phase separation of quercetin from solid onion (Allium cepa L.). Sep. Sci. Technol. 2014, 49, 2502–2509. [Google Scholar] [CrossRef]
- Benito-Román, O.; Alonso, E.; Cocero, M.J. Pressurized hot water extraction of β-glucans from waxy barley. J. Supercrit. Fluids 2012, 73, 120–125. [Google Scholar] [CrossRef]
- Lee, K.A.; Kim, K.T.; Kim, H.J.; Chung, M.S.; Chang, P.S.; Park, H.; Pai, H.D. Antioxidant activities of onion (Allium cepa L.) peel extracts produced by ethanol, hot water, and subcritical water extraction. Food Sci. Biotechnol. 2014, 23, 615–621. [Google Scholar] [CrossRef]
- Ko, M.J.; Cheigh, C.I.; Cho, S.W.; Chung, M.S. Subcritical water extraction of flavonol quercetin from onion skin. J. Food Eng. 2011, 102, 327–333. [Google Scholar] [CrossRef]
- Kim, S.W.; Ko, M.J.; Chung, M.S. Extraction of the flavonol quercetin from onion waste by combined treatment with intense pulsed light and subcritical water extraction. J. Clean. Prod. 2019, 231, 1192–1199. [Google Scholar] [CrossRef]
- Sluiter, A.; Hames, B.; Hyman, D.; Payne, C.; Ruiz, R.; Scarlata, C.; Sluiter, J.; Templeton, D.; Nrel, J.W. Determination of total solids in biomass and total dissolved solids in liquid process samples. Natl. Renew. Energy Lab. 2008, 3–5. [Google Scholar]
- Alonso-Riaño, P.; Diez, M.T.S.; Blanco, B.; Beltrán, S.; Trigueros, E.; Benito-Román, O. Water ultrasound-assisted extraction of polyphenol compounds from brewer’s spent grain: Kinetic study, extract characterization, and concentration. Antioxidants 2020, 9, 265. [Google Scholar] [CrossRef] [PubMed] [Green Version]
- Chang, C.-C.; Yang, M.-H.; Wen, H.-M.; Chern, J.-C. Estimation of total flavonoid content in propolis by two complementary colometric methods. J. Food Drug Anal. 2002, 10. [Google Scholar] [CrossRef]
- Benzie, I.F.F.; Strain, J.J. The ferric reducing ability of plasma (FRAP) as a measure of ‘“antioxidant power”’: The FRAP assay. Anal. Biochem. 1996, 239, 70–76. [Google Scholar] [CrossRef] [PubMed] [Green Version]
- Benito-Román, Ó.; Alonso, E.; Gairola, K.; Cocero, M.J. Fixed-bed extraction of β-glucan from cereals by means of pressurized hot water. J. Supercrit. Fluids 2013, 82, 122–128. [Google Scholar] [CrossRef]
- Abolghassemi Fakhree, M.A.; Delgado, D.R.; Martínez, F.; Jouyban, A. The importance of dielectric constant for drug solubility prediction in binary solvent mixtures: Electrolytes and zwitterions in water+ethanol. AAPS Pharm. Sci. Tech. 2010, 11, 1726–1729. [Google Scholar] [CrossRef] [Green Version]
- Plaza, M.; Turner, C. Pressurized hot water extraction of bioactives. TrAC Trends Anal. Chem. 2015, 71, 39–54. [Google Scholar] [CrossRef] [Green Version]
- He, L.; Zhang, X.; Xu, H.; Xu, C.; Yuan, F.; Knez, Ž.; Novak, Z.; Gao, Y. Subcritical water extraction of phenolic compounds from pomegranate (Punica granatum L.) seed residues and investigation into their antioxidant activities with HPLC-ABTS + assay. Food Bioprod. Process. 2012, 90, 215–223. [Google Scholar] [CrossRef]
- Srinivas, K.; King, J.W.; Howard, L.R.; Monrad, J.K. Solubility and solution thermodynamic properties of quercetin and quercetin dihydrate in subcritical water. J. Food Eng. 2010, 100, 208–218. [Google Scholar] [CrossRef]
- FooDB.ca. Available online: https://foodb.ca/ (accessed on 9 May 2020).
- Takahama, U.; Hirota, S. Deglucosidation of quercetin glucosides to the aglycone and formation of antifungal agents by peroxidase-dependent oxidation of quercetin on browning of onion scales. Plant Cell Physiol. 2000, 41, 1021–1029. [Google Scholar] [CrossRef] [Green Version]
- Lu, X.; Ross, C.F.; Powers, J.R.; Rasco, B.A. Determination of quercetins in onion (Allium cepa) Using infrared spectroscopy. J. Agric. Food Chem. 2011, 59, 6376–6382. [Google Scholar] [CrossRef]
- Lee, J.; Mitchell, A.E. Quercetin and isorhamnetin glycosides in onion (Allium cepa L.): Varietal comparison, physical distribution, coproduct evaluation, and long-term storage stability. J. Agric. Food Chem. 2011, 59, 857–863. [Google Scholar] [CrossRef] [PubMed]
- Price, K.R.; Rhodes, M.J.C. Analysis of the major flavonol glycosides present in four varieties of onion (Allium cepa) and changes in composition resulting from autolysis. J. Sci. Food Agric. 1997, 74, 331–339. [Google Scholar] [CrossRef]
- Ko, M.J.; Cheigh, C.I.; Chung, M.S. Relationship analysis between flavonoids structure and subcritical water extraction (SWE). Food Chem. 2014, 143, 147–155. [Google Scholar] [CrossRef] [PubMed]
- Wianowska, D.; Dawidowicz, A.L. Effect of water content in extraction mixture on the pressurized liquid extraction efficiency-stability of quercetin 4-glucoside during extraction from onions. J. AOAC Int. 2016, 99, 744–749. [Google Scholar] [CrossRef] [PubMed]
- Slimestad, R.; Fossen, T.; Molund Vagen, I. Onions: A source of unique dietary flavonoids. J. Agric. Food Chem. 2007, 55, 10067–10080. [Google Scholar] [CrossRef] [PubMed]
- Wang, W.; Sun, C.; Mao, L.; Ma, P.; Liu, F.; Yang, J.; Gao, Y. The biological activities, chemical stability, metabolism and delivery systems of quercetin: A review. Trends Food Sci. Technol. 2016, 56, 21–38. [Google Scholar] [CrossRef]
- Piechowiak, T.; Grzelak-Błaszczyk, K.; Bonikowski, R.; Balawejder, M. Optimization of extraction process of antioxidant compounds from yellow onion skin and their use in functional bread production. LWT Food Sci. Technol. 2020, 117, 108614. [Google Scholar] [CrossRef]
- Sagar, N.A.; Pareek, S.; Gonzalez-Aguilar, G.A. Quantification of flavonoids, total phenols and antioxidant properties of onion skin: A comparative study of fifteen Indian cultivars. J. Food Sci. Technol. 2020. [Google Scholar] [CrossRef]
- Miean, K.H.; Mohamed, S. Flavonoid (myricetin, quercetin, kaempferol, luteolin, and apigenin) content of edible tropical plants. J. Agric. Food Chem. 2001, 49, 3106–3112. [Google Scholar] [CrossRef]
- Søltoft, M.; Christensen, J.H.; Nielsen, J.; Knuthsen, P. Pressurised liquid extraction of flavonoids in onions. Method development and validation. Talanta 2009, 80, 269–278. [Google Scholar] [CrossRef]
- Albishi, T.; John, J.A.; Al-khalifa, A.S.; Shahidi, F. Antioxidative phenolic constituents of skins of onion varieties and their activities. J. Funct. Foods 2013, 5, 1191–1203. [Google Scholar] [CrossRef]
- Tram, N.L.; Hazama, C.; Shimoyamada, M.; Ando, H.; Kato, K.; Yamauchi, R. Antioxidative Compounds from the Outer Scales of Onion. J. Agric. Food Chem. 2005, 53, 8183–8189. [Google Scholar] [CrossRef]


| TPC (mg GAE/g DOSW) | TFC (mg QE/g DOSW) | AA-FRAP (mg FeSO4/g DOSW) |
|---|---|---|
| 46.7 ± 1.4 | 20.4 ± 0.2 | 67.9 ± 1.4 |
| Weibull Model | Power Law Model | |||||||
| A | k | n | RMSD | B | n | RMSD | ||
| TPC (mg GAE/g DOSW) | 105 °C | 37.3 | 0.0030 | 1.70 | 0.8 | 5.68 | 0.39 | 5.0 |
| 125 °C | 46.3 | 0.0122 | 1.30 | 2.2 | 7.85 | 0.37 | 5.0 | |
| 145 °C | 62.3 | 0.0112 | 1.21 | 2.9 | 6.36 | 0.46 | 6.0 | |
| 160 °C | 87.8 | 0.0046 | 1.38 | 1.7 | 5.80 | 0.55 | 8.0 | |
| 180 °C | 97.3 | 0.0045 | 1.36 | 1.6 | 5.81 | 0.57 | 8.3 | |
| TFC (mg QE/g DOSW) | 105 °C | 19.3 | 0.0024 | 1.79 | 0.5 | 3.14 | 0.38 | 2.8 |
| 125 °C | 24.7 | 0.0022 | 1.87 | 0.7 | 4.76 | 0.35 | 3.5 | |
| 145 °C | 24.1 | 0.0009 | 2.18 | 0.6 | 4.95 | 0.34 | 3.8 | |
| 160 °C | 22.4 | 0.0004 | 2.49 | 0.5 | 4.65 | 0.34 | 3.7 | |
| 180 °C | 25.1 | 0.0008 | 2.23 | 0.8 | 5.32 | 0.33 | 3.9 | |
| AA-FRAP (mg FeSO4/g DOSW) | 105 °C | 97.8 | 0.0036 | 1.64 | 2.9 | 14.69 | 0.40 | 13.0 |
| 125 °C | 120.7 | 0.0062 | 1.50 | 5.5 | 19.28 | 0.39 | 14.3 | |
| 145 °C | 148.0 | 0.0074 | 1.35 | 6.0 | 16.66 | 0.45 | 15.7 | |
| 160 °C | 182.1 | 0.0056 | 1.38 | 5.0 | 16.27 | 0.49 | 18.5 | |
| 180 °C | 211.0 | 0.0074 | 1.27 | 4.6 | 16.53 | 0.51 | 18.2 | |
| Soluble Fraction (mg/g DOSW) | Total (mg/g DOSW) | |||||||||
|---|---|---|---|---|---|---|---|---|---|---|
| 105 °C | 125 °C | 145 °C | 160 °C | 180 °C | 105 °C | 125 °C | 145 °C | 160 °C | 180 °C | |
| QC | 2.3 ± 0.1 | 2.4 ± 0.4 | 2.4 ± 0.1 | 2.2 ± 0.1 | 1.9 ± 0.3 | 12.5 ± 0.2 | 13.3 ± 0.1 | 15.4 ± 0.4 | 16.0 ± 0.2 | 16.4 ± 0.6 |
| QC4’ | 5.0 ± 0.2 | 5.7 ± 0.3 | 5.7 ± 0.2 | 4.6 ± 0.1 | 4.5 ± 0.1 | 6.7 ± 0.1 | 8.0 ± 0.2 | 8.4 ± 0.1 | 7.8 ± 0.1 | 7.0 ± 0.1 |
| QC3 | 0.13 ± 0.02 | 0.15 ± 0.03 | 0.16 ± 0.01 | 0.11 ± 0.03 | 0.14 ± 0.04 | ND | 0.23 ± 0.01 | 0.29 ± 0.03 | 0.245 ± 0.012 | 0.27 ± 0.01 |
| QC3,4’ | 0.55 ± 0.04 | 0.50 ± 0.01 | 0.83 ± 0.09 | 0.38 ± 0.01 | 0.47 ± 0.05 | 0.54 ± 0.04 | 0.44 ± 0.02 | 0.84 ± 0.04 | 0.453 ± 0.015 | 0.45 ± 0.02 |
| Kaempferol | 0.11 ± 0.01 | 0.062 ± 0.012 | 0.09 ± 0.01 | 0.06 ± 0.01 | 0.07 ± 0.01 | 0.29 ± 0.03 | 0.34 ± 0.01 | 0.46 ± 0.01 | 0.382 ± 0.015 | 0.31 ± 0.02 |
| Isorhamnetin | 0.08 ± 0.02 | 0.08 ± 0.03 | 0.07 ± 0.01 | 0.062 ± 0.011 | 0.07 ± 0.02 | 0.27 ± 0.02 | 0.38 ± 0.01 | 0.48 ± 0.02 | 0.42 ± 0.02 | 0.37 ± 0.03 |
| Myricetin | 0.31 ± 0.05 | 0.39 ± 0.09 | 0.29 ± 0.02 | 0.25 ± 0.05 | 0.26 ± 0.04 | 0.52 ± 0.08 | 0.56 ± 0.09 | 0.49 ± 0.04 | 0.47 ± 0.02 | 0.601 ± 0.016 |
| Protocatechuic Ac. | 2.0 ± 0.1 | 2.2 ± 0.1 | 2.5 ± 0.0 | 2.4 ± 0.1 | 2.4 ± 0.1 | 1.7 ± 0.2 | 2.0 ± 0.1 | 2.3 ± 0.3 | 2.0 ± 0.15 | 2.29 ± 0.11 |
| p-Hydroxybenzoic Ac. | 0.16 ± 0.01 | 0.12 ± 0.05 | 0.16 ± 0.01 | 0.07 ± 0.01 | 0.07 ± 0.02 | ND | ND | 0.14 ± 0.00 | ND | ND |
| Cumaric Ac. | 0.16 ± 0.05 | 0.09 ± 0.01 | 0.13 ± 0.01 | 0.06 ± 0.01 | 0.03 ± 0.01 | ND | ND | 0.05 ± 0.01 | ND | ND |
| Vanillinic Ac. | 0.04 ± 0.01 | 0.04 ± 0.01 | 0.05 ± 0.01 | 0.03 ± 0.01 | 0.03 ± 0.01 | ND | ND | ND | ND | ND |
| Total QCs * | 8.0 ± 0.4 A,B,C | 8.7 ± 0.7 C,D | 9.1 ± 0.4 D | 7.3 ± 0.2 A,B | 7.0 ± 0.5 A | 19.7 ± 0.3 A | 22.0 ± 0.3 B | 24.9 ± 0.6 C | 24.5 ± 0.3 C | 24.1 ± 0.7 C |
| Total QCE ** | 5.9 ± 0.3 A,B,C | 6.4 ± 0.6 C,D | 6.6 ± 0.3 C | 5.5 ± 0.2 A,B | 5.1 ± 0.4 A | 17.1 ± 0.3 A | 18.9 ± 0.2 B | 21.5 ± 0.5 C | 21.5 ± 0.3 C | 21.3 ± 0.7 C |
| Ratio QC4′/QC | 2.2 ± 0.2 A | 2.4 ± 0.5 A | 2.4 ± 0.1 A | 2.1 ± 0.1 A | 2.4 ± 0.4 A | 0.54 ± 0.01 C | 0.60 ± 0.02 D | 0.55 ± 0.02 C | 0.49 ± 0.01 B | 0.43 ± 0.02 A |
Publisher’s Note: MDPI stays neutral with regard to jurisdictional claims in published maps and institutional affiliations. |
© 2020 by the authors. Licensee MDPI, Basel, Switzerland. This article is an open access article distributed under the terms and conditions of the Creative Commons Attribution (CC BY) license (http://creativecommons.org/licenses/by/4.0/).
Share and Cite
Benito-Román, Ó.; Blanco, B.; Sanz, M.T.; Beltrán, S. Subcritical Water Extraction of Phenolic Compounds from Onion Skin Wastes (Allium cepa cv. Horcal): Effect of Temperature and Solvent Properties. Antioxidants 2020, 9, 1233. https://doi.org/10.3390/antiox9121233
Benito-Román Ó, Blanco B, Sanz MT, Beltrán S. Subcritical Water Extraction of Phenolic Compounds from Onion Skin Wastes (Allium cepa cv. Horcal): Effect of Temperature and Solvent Properties. Antioxidants. 2020; 9(12):1233. https://doi.org/10.3390/antiox9121233
Chicago/Turabian StyleBenito-Román, Óscar, Beatriz Blanco, María Teresa Sanz, and Sagrario Beltrán. 2020. "Subcritical Water Extraction of Phenolic Compounds from Onion Skin Wastes (Allium cepa cv. Horcal): Effect of Temperature and Solvent Properties" Antioxidants 9, no. 12: 1233. https://doi.org/10.3390/antiox9121233
APA StyleBenito-Román, Ó., Blanco, B., Sanz, M. T., & Beltrán, S. (2020). Subcritical Water Extraction of Phenolic Compounds from Onion Skin Wastes (Allium cepa cv. Horcal): Effect of Temperature and Solvent Properties. Antioxidants, 9(12), 1233. https://doi.org/10.3390/antiox9121233