3.1. Deposit Layer Formation Caused by a Parallel Spacer
Deposit layer formation is known to reduce the filtration performance of membranes tremendously. Therefore, we investigated the influence of the spacer geometry on the spatial distribution of protein deposition on the membrane surface during skim milk filtration. The deposit layer mainly consisted of casein (compare
Supplementary Material Figure S2) as already shown by Jimenez-Lopez et al. [
22] during ceramic MF of skim milk (0.1 µm).
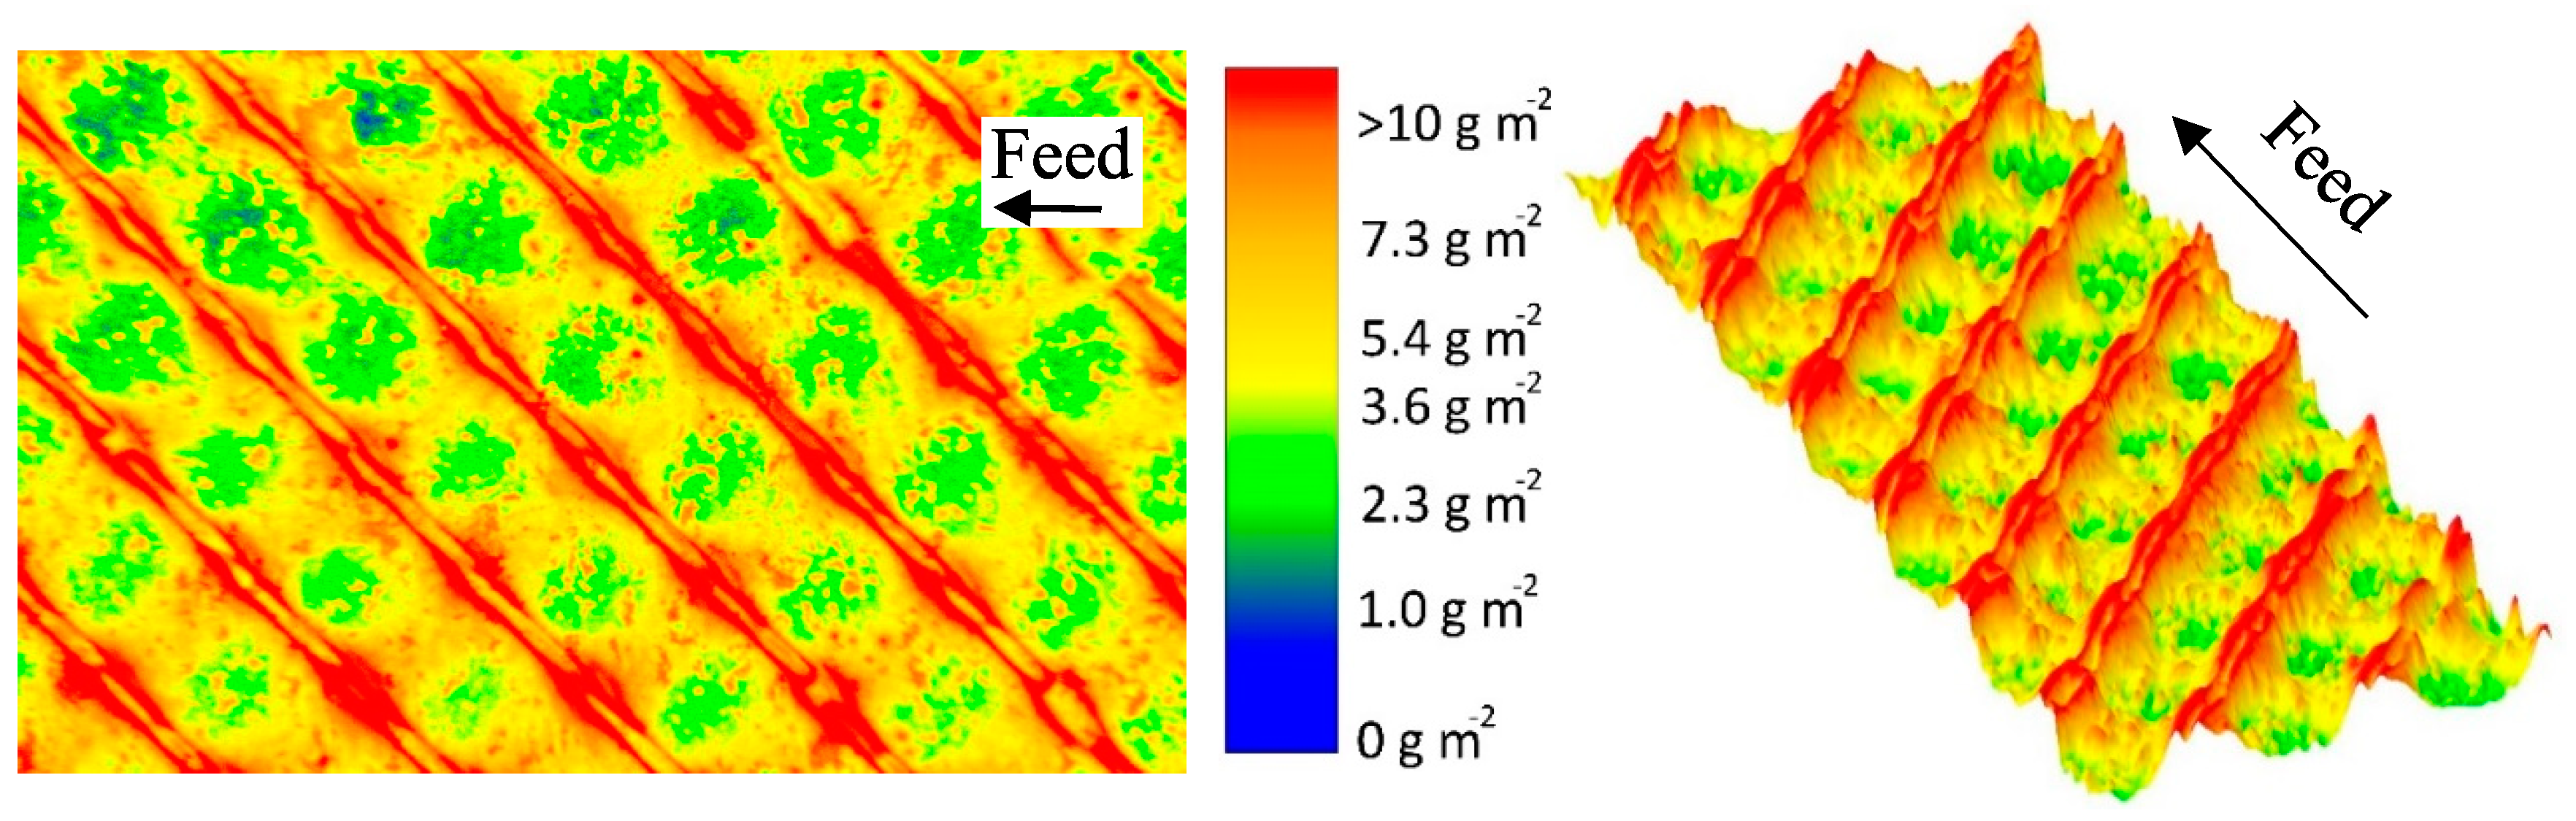
Figure 5 shows a false color and a topographic image of the distribution of protein deposited on the membrane surface after the MF of skim milk with CF 3 using a 46 mil parallel spacer. The local concentrations (determined via the gray values and calibration curve) of the stained deposits were converted to a false color. Red areas mark a protein content of >10 g m
−1, beyond which no further differentiation of the amount of protein is possible. The cumulative distribution can be found in the
Supplementary Material (Figure S5). It can be seen in
Figure 5 that the deposit layer´s pattern fits the geometry of the spacer.
In the areas in which the spacer is in direct contact with the membrane, the deposit layer is predominantly low. As no protein was detected to be remaining on the spacer after removal from the membrane, this indicates that no filtration took place below the spacer ribs. Otherwise, protein deposition would be expected to be intense, since particle-removing forces are low due to a lack of crossflow below the spacer ribs. Nevertheless, certain areas in the membrane-spacer contact zone are fouled with up to 10 g m
−2. These areas are randomly distributed along the membrane-spacer contact zone. This allows two conclusions: Firstly, no full contact between the membrane and spacer exists. Thus, parts of the membrane in the contact zone close to the spacer contribute to the filtration. Due to the low crossflow velocities in the contact zone, flux and protein permeation are expected to be rather low compared to the rest of the membrane. Additionally, excessive mixing between the branch currents streaming in the gap between the spacer ribs is not to be expected. Secondly, a removal of the spacer from the membrane prior to staining does not detach parts of the deposit layer. Otherwise, sharp edges would be expected. Hence, the deposition patterns shown in
Figure 5 correspond to the state during filtration. Therefore, in most areas in which the spacer rests on the membrane, no filtration takes place.
The effect of the spacer can also be observed close to the contact zone between spacer rib and membrane. More than 10 g m−2 of protein are deposited, since a boundary layer forms. The crossflow velocity is reduced due to frictional energy losses caused by the spacer. Thus, the wall shear stress decreases toward the spacer, causing a more intense particle deposition.
Except for the areas close to the spacer, the deposit layer is homogeneously distributed all over the membrane with about 2 to 4 g m
−2. Due to the lack of baffles, the flow is undisturbed. Wall shear stress values are expected to be constant along the flow lines parallel to the ribs, causing a homogeneous deposition. This can be concluded from
Figure 6a, which shows the deposit layer distribution as a function of the relative length according to the spatial grid defined by
Figure 4a. Hence, it can be inferred from the deposit layer pattern that no small-scale variations in flux and protein permeation prevail with the parallel spacer except for the areas in the direct vicinity of the spacer membrane contact zone. The slight deviations in deposited protein are presumed to be due to inhomogeneities in the selective layer´s properties. Thus, the amount of deposited protein varies to a certain extent even though the conditions can be assumed to be the constant.
Contrary to the observations along the relative length axis, inhomogeneities in the deposit layer formation perpendicular to the feed flow can be observed (
Figure 6b). Close to the ribs, the deposition increases steeply. Outside of the boundary areas, the deposition stays constantly at a lower value. The size of the boundary layer, where the accumulation of protein deposit takes place, could be estimated by measuring the distance between the maximum concentration of deposited protein (defining the position directly at the spacer rib) and the point, at which the amount of deposited protein reached the level of the freely overflown areas (far from the spacer ribs). The size of the boundary layer was roughly 0.089 ± 0.040 Rw, which corresponds to 0.044 ± 0.019 mm. Due to the crossflow velocity and wall shear stress being not fully developed close to the ribs, friction effects reduce the erosive forces and enhance deposition.
It was found that the deposit layer pattern of the parallel spacer is homogeneous along the flow path except for areas close to the spacer contact zone. This is due to the lack of flow restrictions and the lack of eddies. In turn, the crossflow velocity and wall shear stress can be assumed to be practically constant in the areas of low fouling. Furthermore, we assume that friction causes lower crossflow velocities close to the spacer. This increases the deposition of proteins since wall shear stress values are lower compared to the areas of undisturbed flow. Therefore, we can confirm that the local flow regime directly affects deposition.
3.2. Deposit Layer Formation Caused by a Diamond-Shaped Spacer
Comparable to the approach for the parallel spacer, we analyzed the deposit layer distribution caused by the diamond spacer in the test cell. The results on the parallel spacer show the influence of the flow regime on the deposition of proteins. This can also be expected from the diamond spacer as it causes eddies in the feed flow on a small scale. In this study, we investigated a non-woven spacer with two layers of spacer strands orthogonal to one another. Only one layer of spacer strands is in contact with one membrane surface and spatial crossflow velocities and wall shear stresses differ strongly in the spacer net. The protein deposition also changes along the flow path, which can be seen in
Figure 7. The protein accumulation is most pronounced behind the spacer strand with membrane contact. This is due to the low crossflow velocities directly behind the spacer strand. This was also observed in computational fluid dynamics (CFD) simulations [
23]. Based on the findings of Grosse-Gorgemann et al. [
24] and Fiebig [
25] for heat transfer, Li et al. [
26] stated that slowly rotating transversal vortices form behind spacer strands at Reynolds numbers (based on the channel height) below 100. The conclusion is that due to the vortices, the mass exchange with the bulk phase is reduced. Thus, a concentration and an increased deposition close to the spacer strands takes place. Since we found Reynolds numbers below 100 in our studies, the formation of vortices behind the spacer strands might take place. Apart from that, a low wall shear stress and thus low removal forces occur behind the spacer strand due to the low crossflow velocity.
Since the wall shear stress is also low in front of the spacer strand with membrane contact, much protein is deposited in this area as well. In the membrane–spacer contact zone, much lower amounts of proteins are deposited, as already shown with the parallel spacer, due to the lack of filtration.
Apart from those areas adjacent to or covered by the spacers, the deposit layer distribution on the membrane in the area between the spacer strands is also inhomogeneous. In the areas close to the spacer without membrane contact, deposit layer formation was found to be lower than average (5.6 g m
−2 determined by HPLC). Due to a narrowing of the flow channel, the crossflow velocity (mean value of 0.21 m s
−1) increases. In turn, the wall shear stress is increased, reducing deposit layer formation. Koutsou et al. [
16] calculated the spatially resolved wall shear stress on the membrane covered with a diamond-shaped spacer (hydrodynamic angle 90° (angle between two spacer strands facing the feed flow direction)). They also reported higher wall shear stress values in the areas of flow constriction. Additionally, the authors reported an increased mass transfer coefficient. Concentration polarization is less pronounced in these areas and deposit layer formation is less likely to happen [
27].
The results show that deposit layer formation is directly affected by the spacer geometry due to the effect on the feed flow. Most likely, spatially distributed alterations of the wall shear stress are the determining factor. Behind spacer strands with membrane contact, protein deposition is homogenous and pronounced. With further distance from the spacer strand in the flow direction, an increasing wall shear stress causes the degradation of deposited proteins. In front of these strands, protein deposition is pronounced in the areas without flow constriction. Furthermore, it was observed that the spacer without membrane contact causes an increase of the local crossflow velocity, resulting in a higher wall shear stress and less deposition. The extent of inhomogeneities on the membrane can be seen in
Figure 8. It plots the deposit layer distribution as a function the axial position on lines parallel to the spacer strands without (a) and with (b) membrane contact. For the sake of clarity, only three lines are shown: 0.1, 0.3, and 0.5 Rl and Rw, respectively, behind the spacer membrane contact.
It can be seen that a two-dimensional pattern is generated by the spacer. For a position with a relative width (Rw) of 0.5 (
Figure 8a), the amount of deposited protein varies between 4 g m
-2 and more than 10 g m
−2. Since the spacer strands without membrane contact narrow the flow channel, the crossflow velocity and wall shear stress are enhanced locally as reported above. This results in a more intense removal of deposited protein and a deposition pattern closer to the spacer strand without membrane contact (lower Rl). Thus, the amount of deposited protein decreases to a lowest value of 2 g m
−2 and the width of the area with a deposition above 10 g m
−2 decreases. Apart from that, the deposit layer decreases with distance from the spacer strands with membrane contact (
Figure 8b). As reported by Kavianipour et al. [
23], the crossflow velocity varies due to the spacer strand´s influence on the flow field. Since the feed stream is influenced by the spacer strands, an area of flow separation can occur. This causes a reduction of the local wall shear stress close to the spacer strands with membrane contact and thus more intense fouling. An influence of the spacer without membrane contact is observable independent of Rw. Just the extent of its influence is dependent on Rw.
The results show that the diamond-shaped spacer causes a characteristic deposit layer pattern on the membrane surface directly reflecting the spacer configuration. Thereby, areas with high crossflow velocity and wall shear stress, respectively, are less susceptible to fouling, but at the same time, areas of very poor deposit control exist.
3.3. Filtration Performance of the Diamond and the Parallel Spacer
As reported above, the spacer design significantly affects the deposit layer pattern. As the deposit layer is known to dominate the filtration during skim milk fractionation, we investigated the influence of the spacer design on the filtration performance. For this purpose, we analyzed flux and protein permeation of the parallel and diamond-shaped spacer during skim milk fractionation to obtain a casein and a whey protein fraction in a flat channel test cell.
Figure 9 shows the pressure drop of both spacer designs as a function of the crossflow velocity during water filtration.
As expected, the pressure drop increases with increasing crossflow velocity due to enhanced friction. Apart from that, the parallel spacer caused a significantly lower pressure drop. At 80 L h
−1 (mean crossflow velocity of 0.5 m s
−1), the pressure drop was 1.45 and 0.65 bar m
−1 for the diamond and the parallel spacer, respectively. This can also be attributed to frictional losses. As already described by Da Costa et al. [
10] and Kavianipour et al. [
23], the feed stream changes direction as it flows above and below the spacer strands of the diamond-shaped spacer net. This causes energy dissipation, which is not present with the parallel spacer due to the linear feed flow comparable to the flow in tubular membranes or pipes.
It was shown by Samuelsson et al. [
28] that higher crossflow velocities enhance the flux during skim milk MF in the tubular geometry of ceramic membranes. In order to evaluate the filtration performance of two spacers with different geometries, the spacers can be compared either at equal feed volume flows or at equal axial pressure drops. Since the maximum pressure drop in SWMs is a limiting value due to possible module destruction by telescoping, the axial pressure drop is the more relevant value for SWMs and was selected for the comparison. Telescoping describes an axial displacement of the membrane sheets in the direction of the feed flow induced by friction losses along the module, which can cause module destruction.
The expectation was that the more homogeneous and lower deposition resulting from the parallel spacer leads to a better filtration performance in terms of flux and protein permeation compared to the diamond spacer.
Figure 10 shows the flux as a function of the transmembrane pressure during the filtration of concentrated skim milk (CF 3).
With increasing ΔpTM, the flux increased until the limiting flux was reached at about 5 L m−2 h−1. Interestingly, and against expectation, the flux did not differ between the parallel and the diamond spacer when operated at the same pressure drop of 1.0 bar m−1 even though the feed flow differed distinctly between the two spacer designs. In contrast to the pressure drop in water, the diamond spacer allowed a higher crossflow velocity at CF 3 compared to the parallel spacer (mean crossflow velocity of 0.14 and 0.21 m s−1 for the parallel and the diamond spacer, respectively).
Similar to the flux, protein permeation in the test cell was also not dependent on the spacer design (
Figure 11).
As expected, the protein permeation decreased with increasing transmembrane pressure due to enhanced deposit layer compression [
29]. The permeation of β-lg at 0.5 bar Δp
TM was 32% and 30% for the diamond and the parallel spacer, respectively, and decreased to 8% and 8% at 2.0 bar. Again, the spacer design had no decisive influence on the filtration performance when they were operated at the same pressure drop in the flat sheet test cell. Even though the deposit layer formation was distinctly different between the two spacer geometries, no significant effect on the filtration performance was observed in our study. Presumably, the effect of the spacer geometry on the axial pressure drop counterbalances the differences in the mass flow coefficient of both spacer geometries. Since no effect of the spacer design was observed within the test cell, another set of experiments was conducted within SWMs with their curved feed flow channels and more complex architecture.
3.4. Filtration Performance of the Diamond and the Parallel Spacer in a Spiral-Wound Membrane at Varying Concentration Factors
The observations on the deposit layer pattern and amount did not go along with the obtained results from the test cell. Apart from that, the curvature of the SWM could not be depicted by the test cell. Therefore, the test cell experiments were also conducted in SWMs at concentration factors of 1 to 3. For the application of spacers, frictional losses in the membrane module have to be traded off against the positive effect of turbulence promotion on the mass transfer. In this regard, a change in viscosity is expected to shift the geometrical optimum of the spacer geometry from a more turbulence-generating shape (at the cost of a greater axial pressure drop) to a less turbulence-generating shape (at the benefit of a lower axial pressure drop).
The axial pressure drop at varying CF values is shown in
Figure 12a for the parallel and the diamond spacer.
The expectation was that the lower amount of flow constrictions would result in a significantly lower pressure drop with the parallel spacer compared to the diamond spacer. This can be observed for low concentration factors. However, the difference between both spacer geometries becomes lower with increasing feed concentration. This means the main positive aspect of the parallel spacer having a lower axial pressure drop and allowing higher crossflow velocities vanishes at high CF values. The difference in behavior between the test cell and the SWM with regard to the axial pressure drop is probably due to the differences in the feed inlet (compare [
9]).
In contrast to the results of the test cell, the diamond spacer showed a higher flux in the SWM, not only at low CF but also at higher CF (
Figure 12b). This is rather unexpected at first sight, as the crossflow velocity of the parallel spacer was similar to the diamond spacer and not lower like in the test cell.
Therefore, the geometry of the flow channels in the SWM and radial distribution of the crossflow velocity have to affect the filtration performance.
Figure 13 shows the feed inlet side of the SWM with the parallel spacer.
In the outer part of the module, the membranes and the spacer form a flow path for the feed. In the inner part of the module, however, the spacer is pressed into the membranes. Due to indentation of the spacer into the membrane, the active membrane area decreases. This has already been described by Karabelas et al. [
30]. Additionally, hardly any flow channel remains open due to the indentation and the high curvature of the spacer close to the permeate collection tube. In consequence, the open cross-section of the inner channels is lower, resulting in a low crossflow velocity and poor deposit layer control. These effects cannot be observed with the diamond spacer.
Due to the poor deposit layer control in the inner channels of the SWM, the flux is reduced. The higher crossflow velocity in the outer parts of the module cannot compensate for that and the overall performance of the module is lower compared to the module with the diamond spacer. This is affirmed by the results on the protein permeation. It is shown in
Figure 14 as a function of the Δp
TM at CF 1–3.
The discrepancy in protein permeation between the parallel and the diamond spacer becomes more intense with increasing CF, i.e., higher feed viscosity. At CF 1, the permeation of β-lg was almost similar with both spacers with 56% and 60% for the diamond and the parallel spacer (at a Δp
TM of 0.5 bar), respectively. At CF 3, however, the permeation of the parallel spacer was distinctly lower with 39% compared to 48% for the diamond spacer. Although the mean crossflow velocity at CF 3 was similar in both SWMs (compare
Figure 12a), the crossflow velocity was significantly more inhomogeneous in the SWM with the parallel spacer due to the low channel height in the inner parts of the envelope. In consequence, deposition was more intense in the inner parts of the module, reducing protein permeation. Since the higher crossflow velocity at the outside could not compensate for this effect, the overall performance of the module is reduced. Therefore, a homogeneous crossflow velocity distribution in the radial direction seems to be crucial for the filtration performance of SWMs. Due to the differences in the crossflow velocity distribution, a potential additional effect of the feed viscosity on the local performance of the feed spacer could not be observed in the SWMs.


