Reverse Electrodialysis: Co- and Counterflow Optimization of Multistage Configurations for Maximum Energy Efficiency

Abstract
:
1. Introduction
- Ideal NaCl solutions;
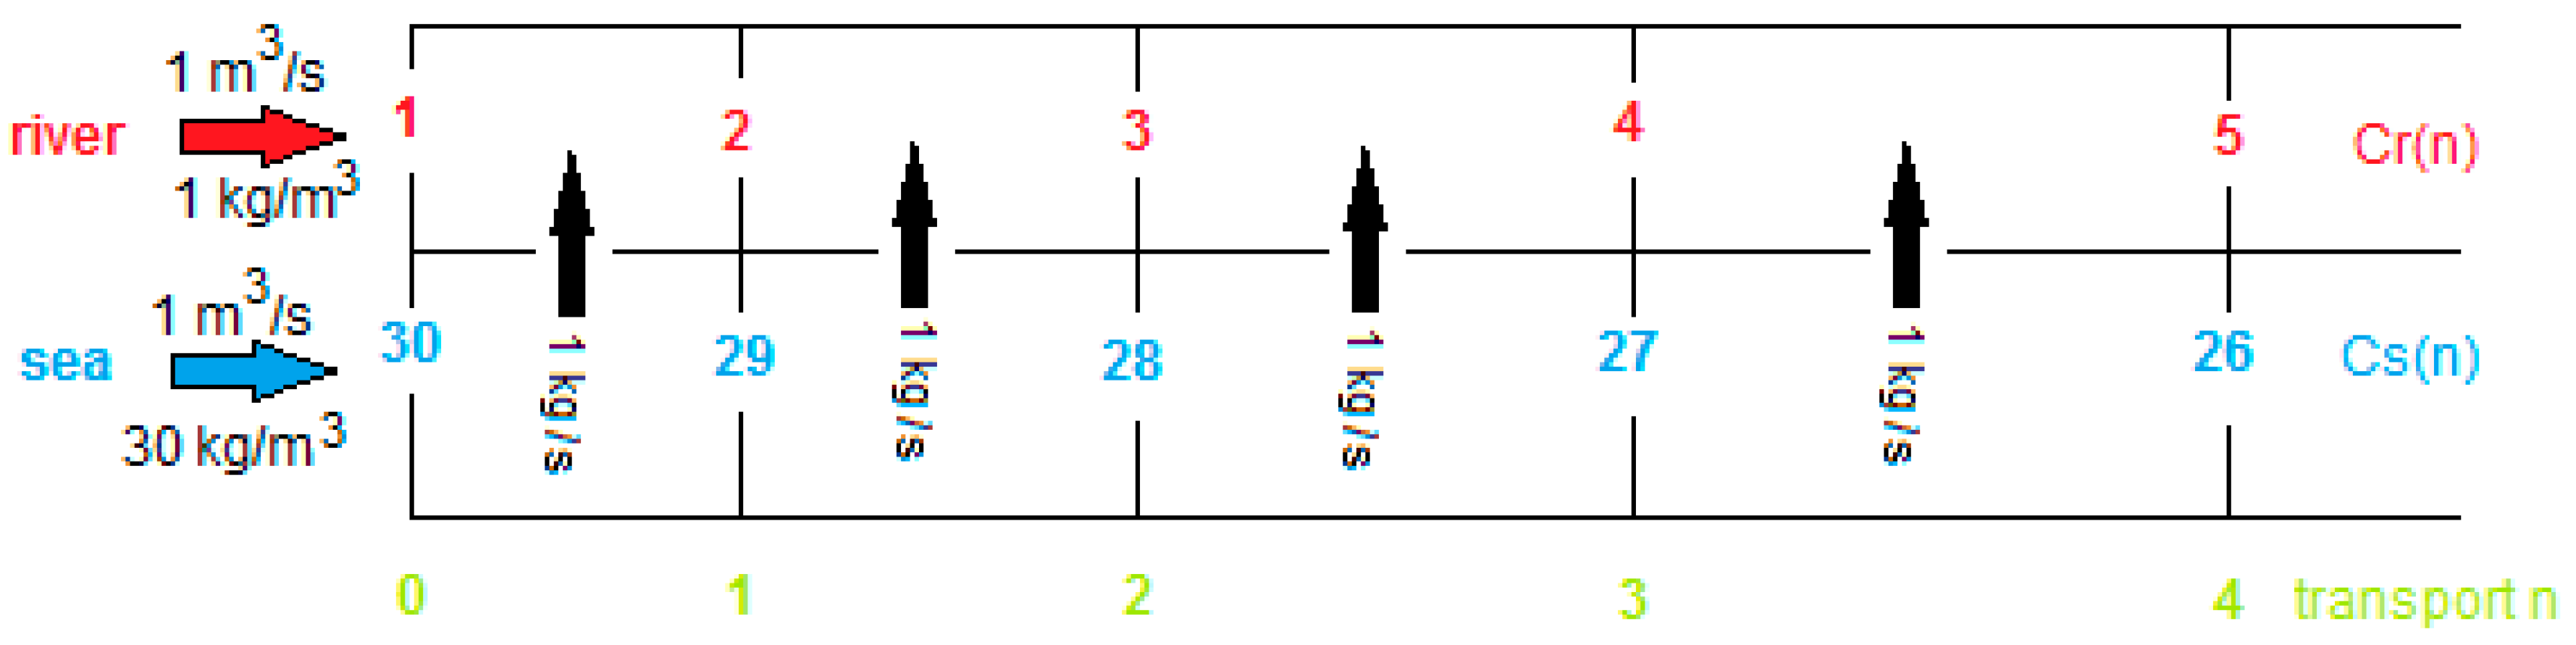
- Concentrations of 1 and 30 kg/m3;
- A temperature of 25 °C;
- Stacks with only one cell pair;
- Feed-water-flow rates of 1 m3/s. (If divided by 106, flow rates are in the range of normal lab stacks).
2. Efficiency of the RED process
2.1. Energy Efficiency and Thermodynamic Efficiency
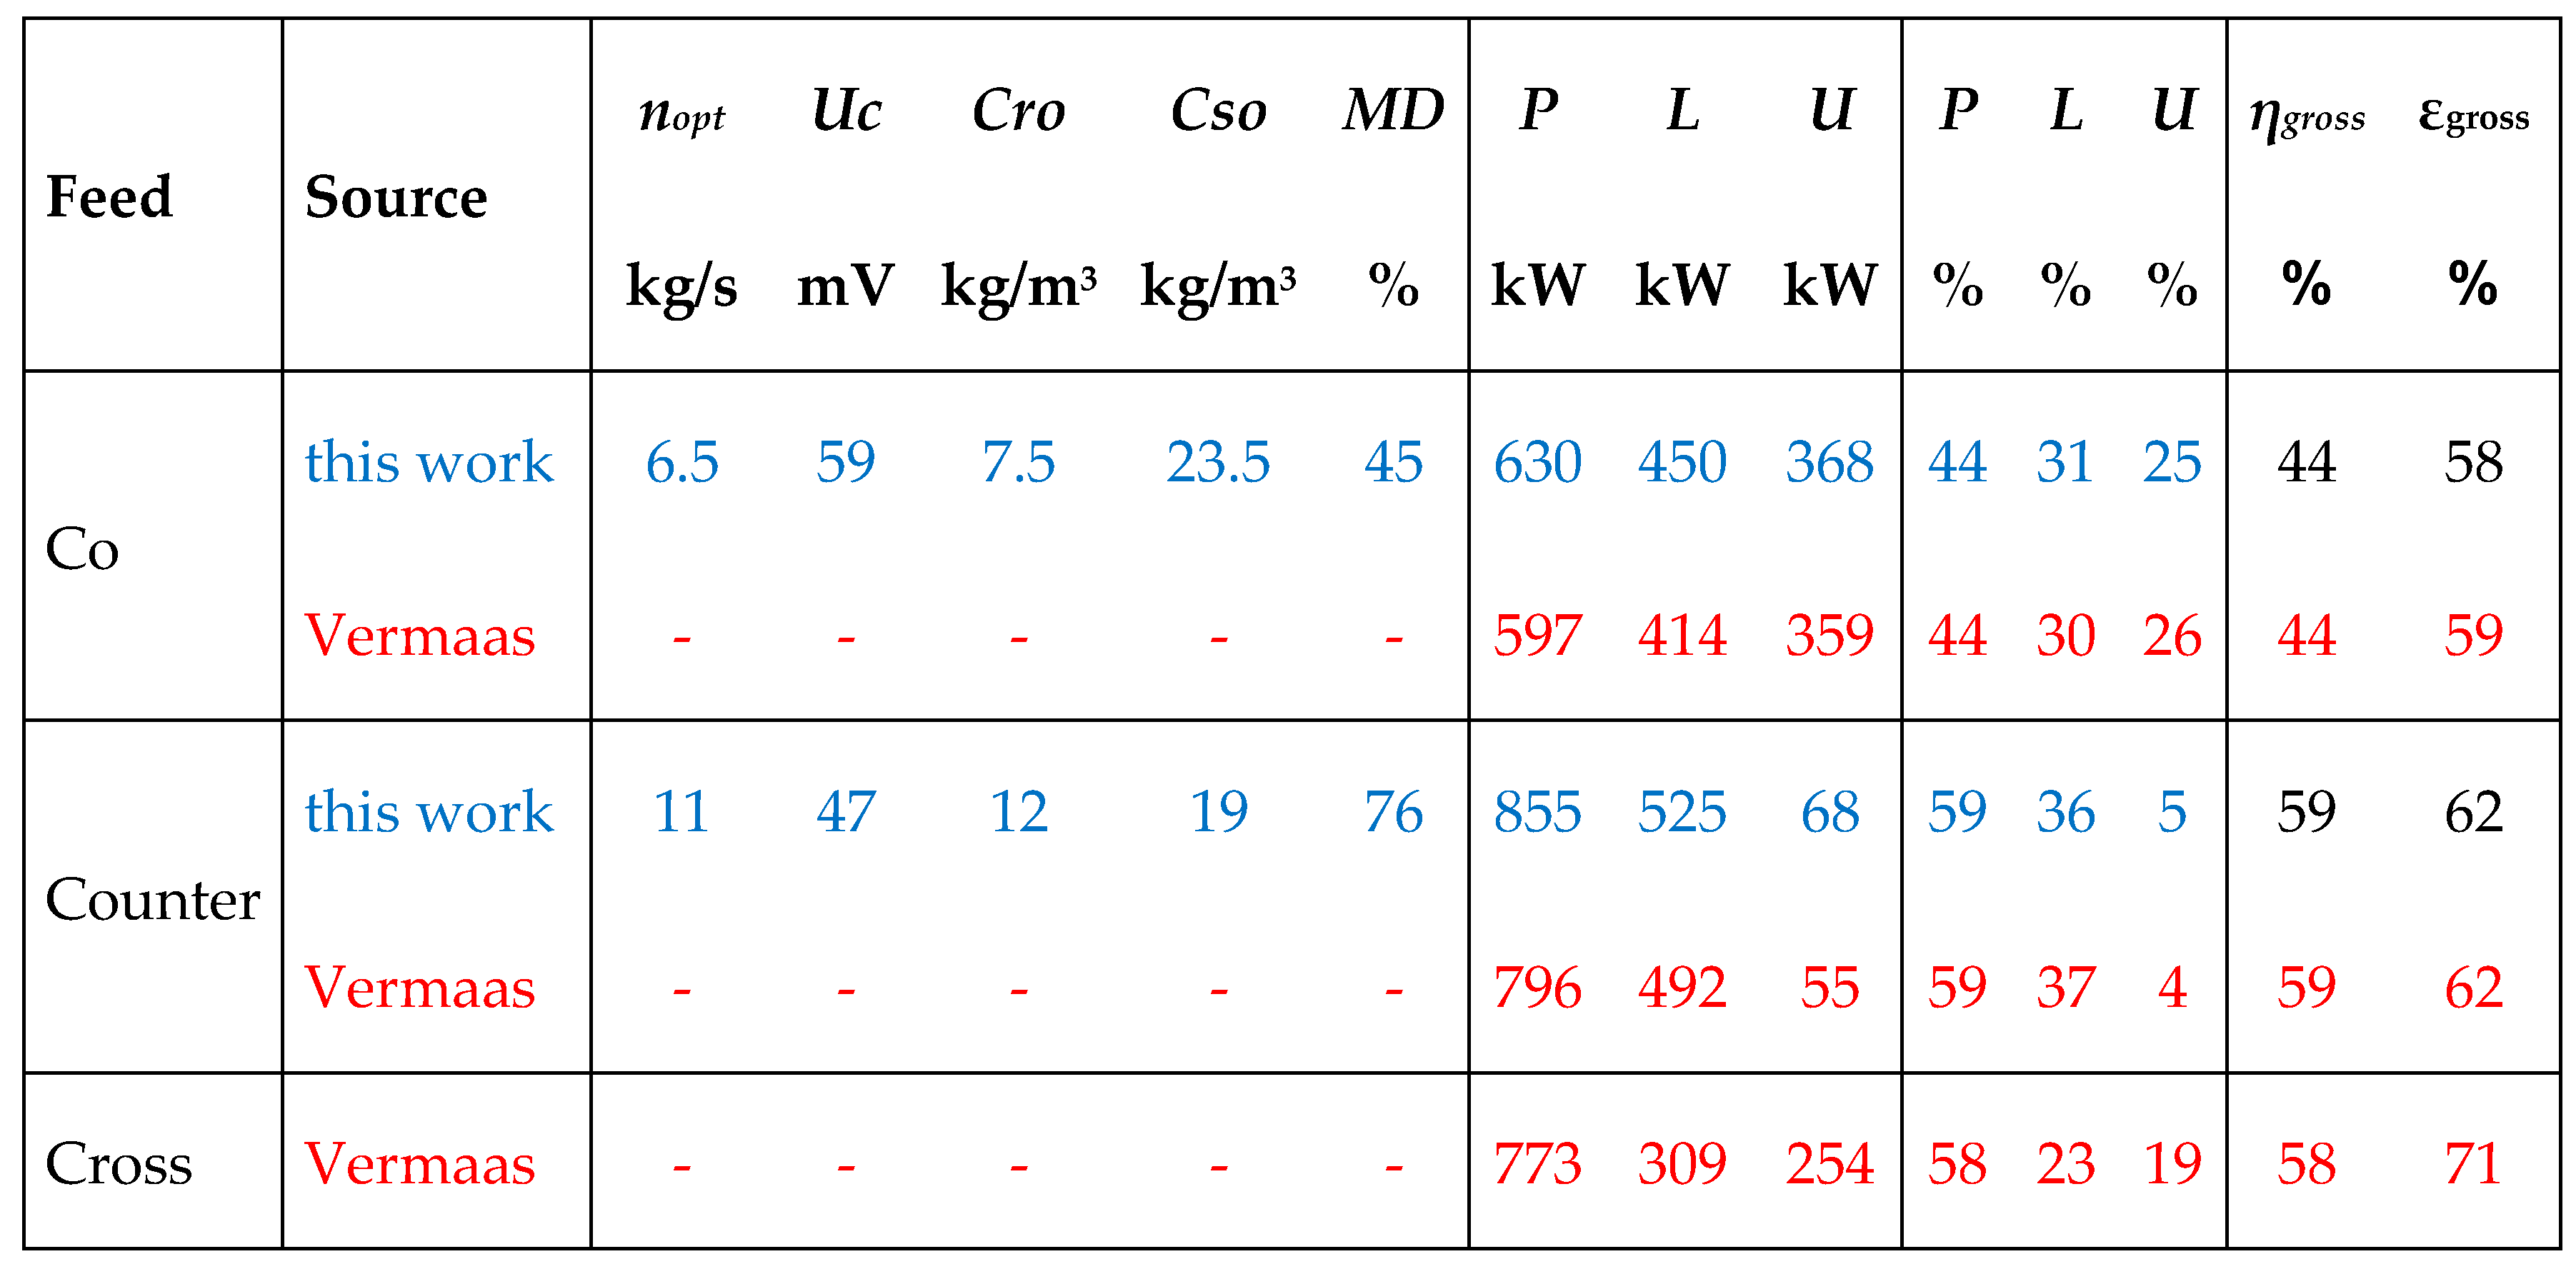
2.2. Co-flow Operation
2.3. Counterflow Operation
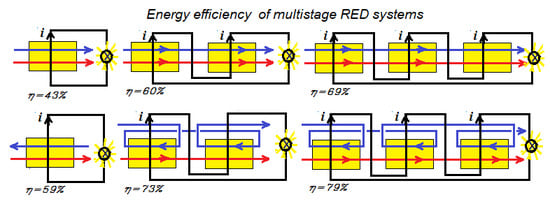
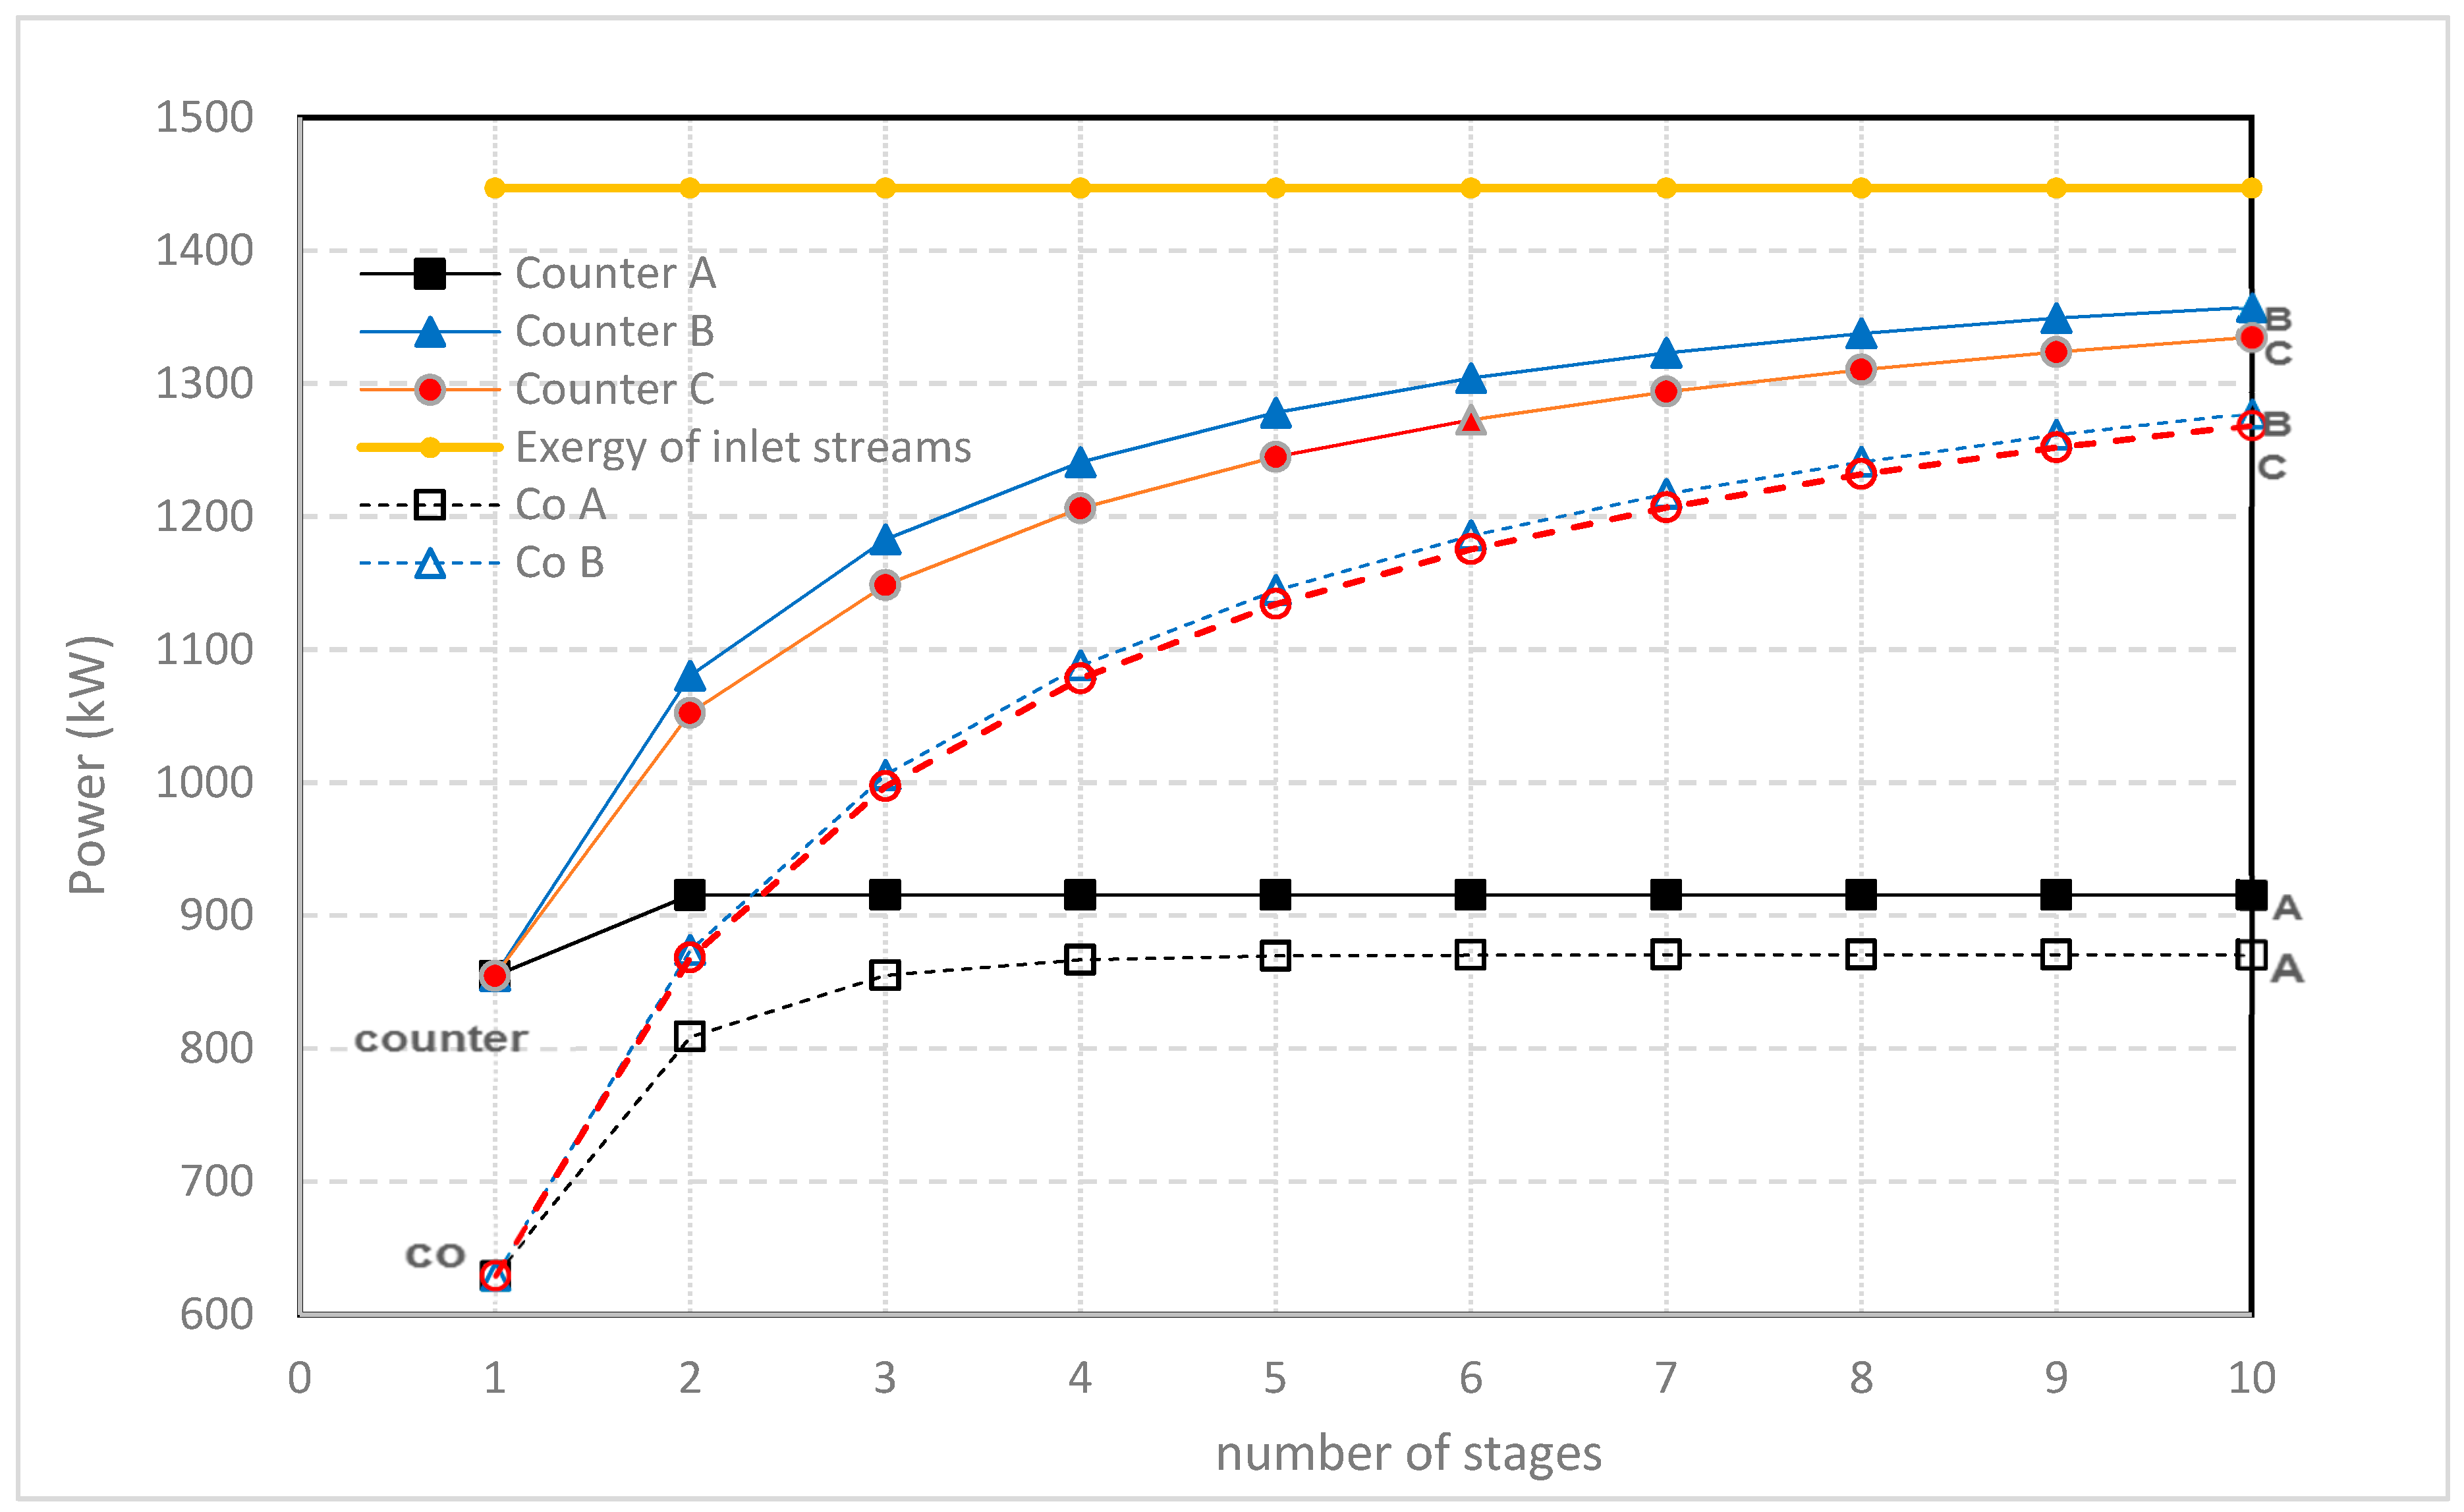
3. Multistaging
- Method A. The power of the first stack is maximized by adjusting the transport parameter n1. Then, this process is repeated with the second stack with n2 and so on.
- Method B. The total delivered power is maximized by simultaneous adjustment of the individual transport parameters n1, n2, n3...
- Method C. All transport parameters are made equal to each other: n = n1 = n2 = n3... and then the total power is maximized by adjusting this n.
4. Conclusions
Funding
Acknowledgments
Conflicts of Interest
Nomenclature
| Roman | |
| C | concentration (mol/L) |
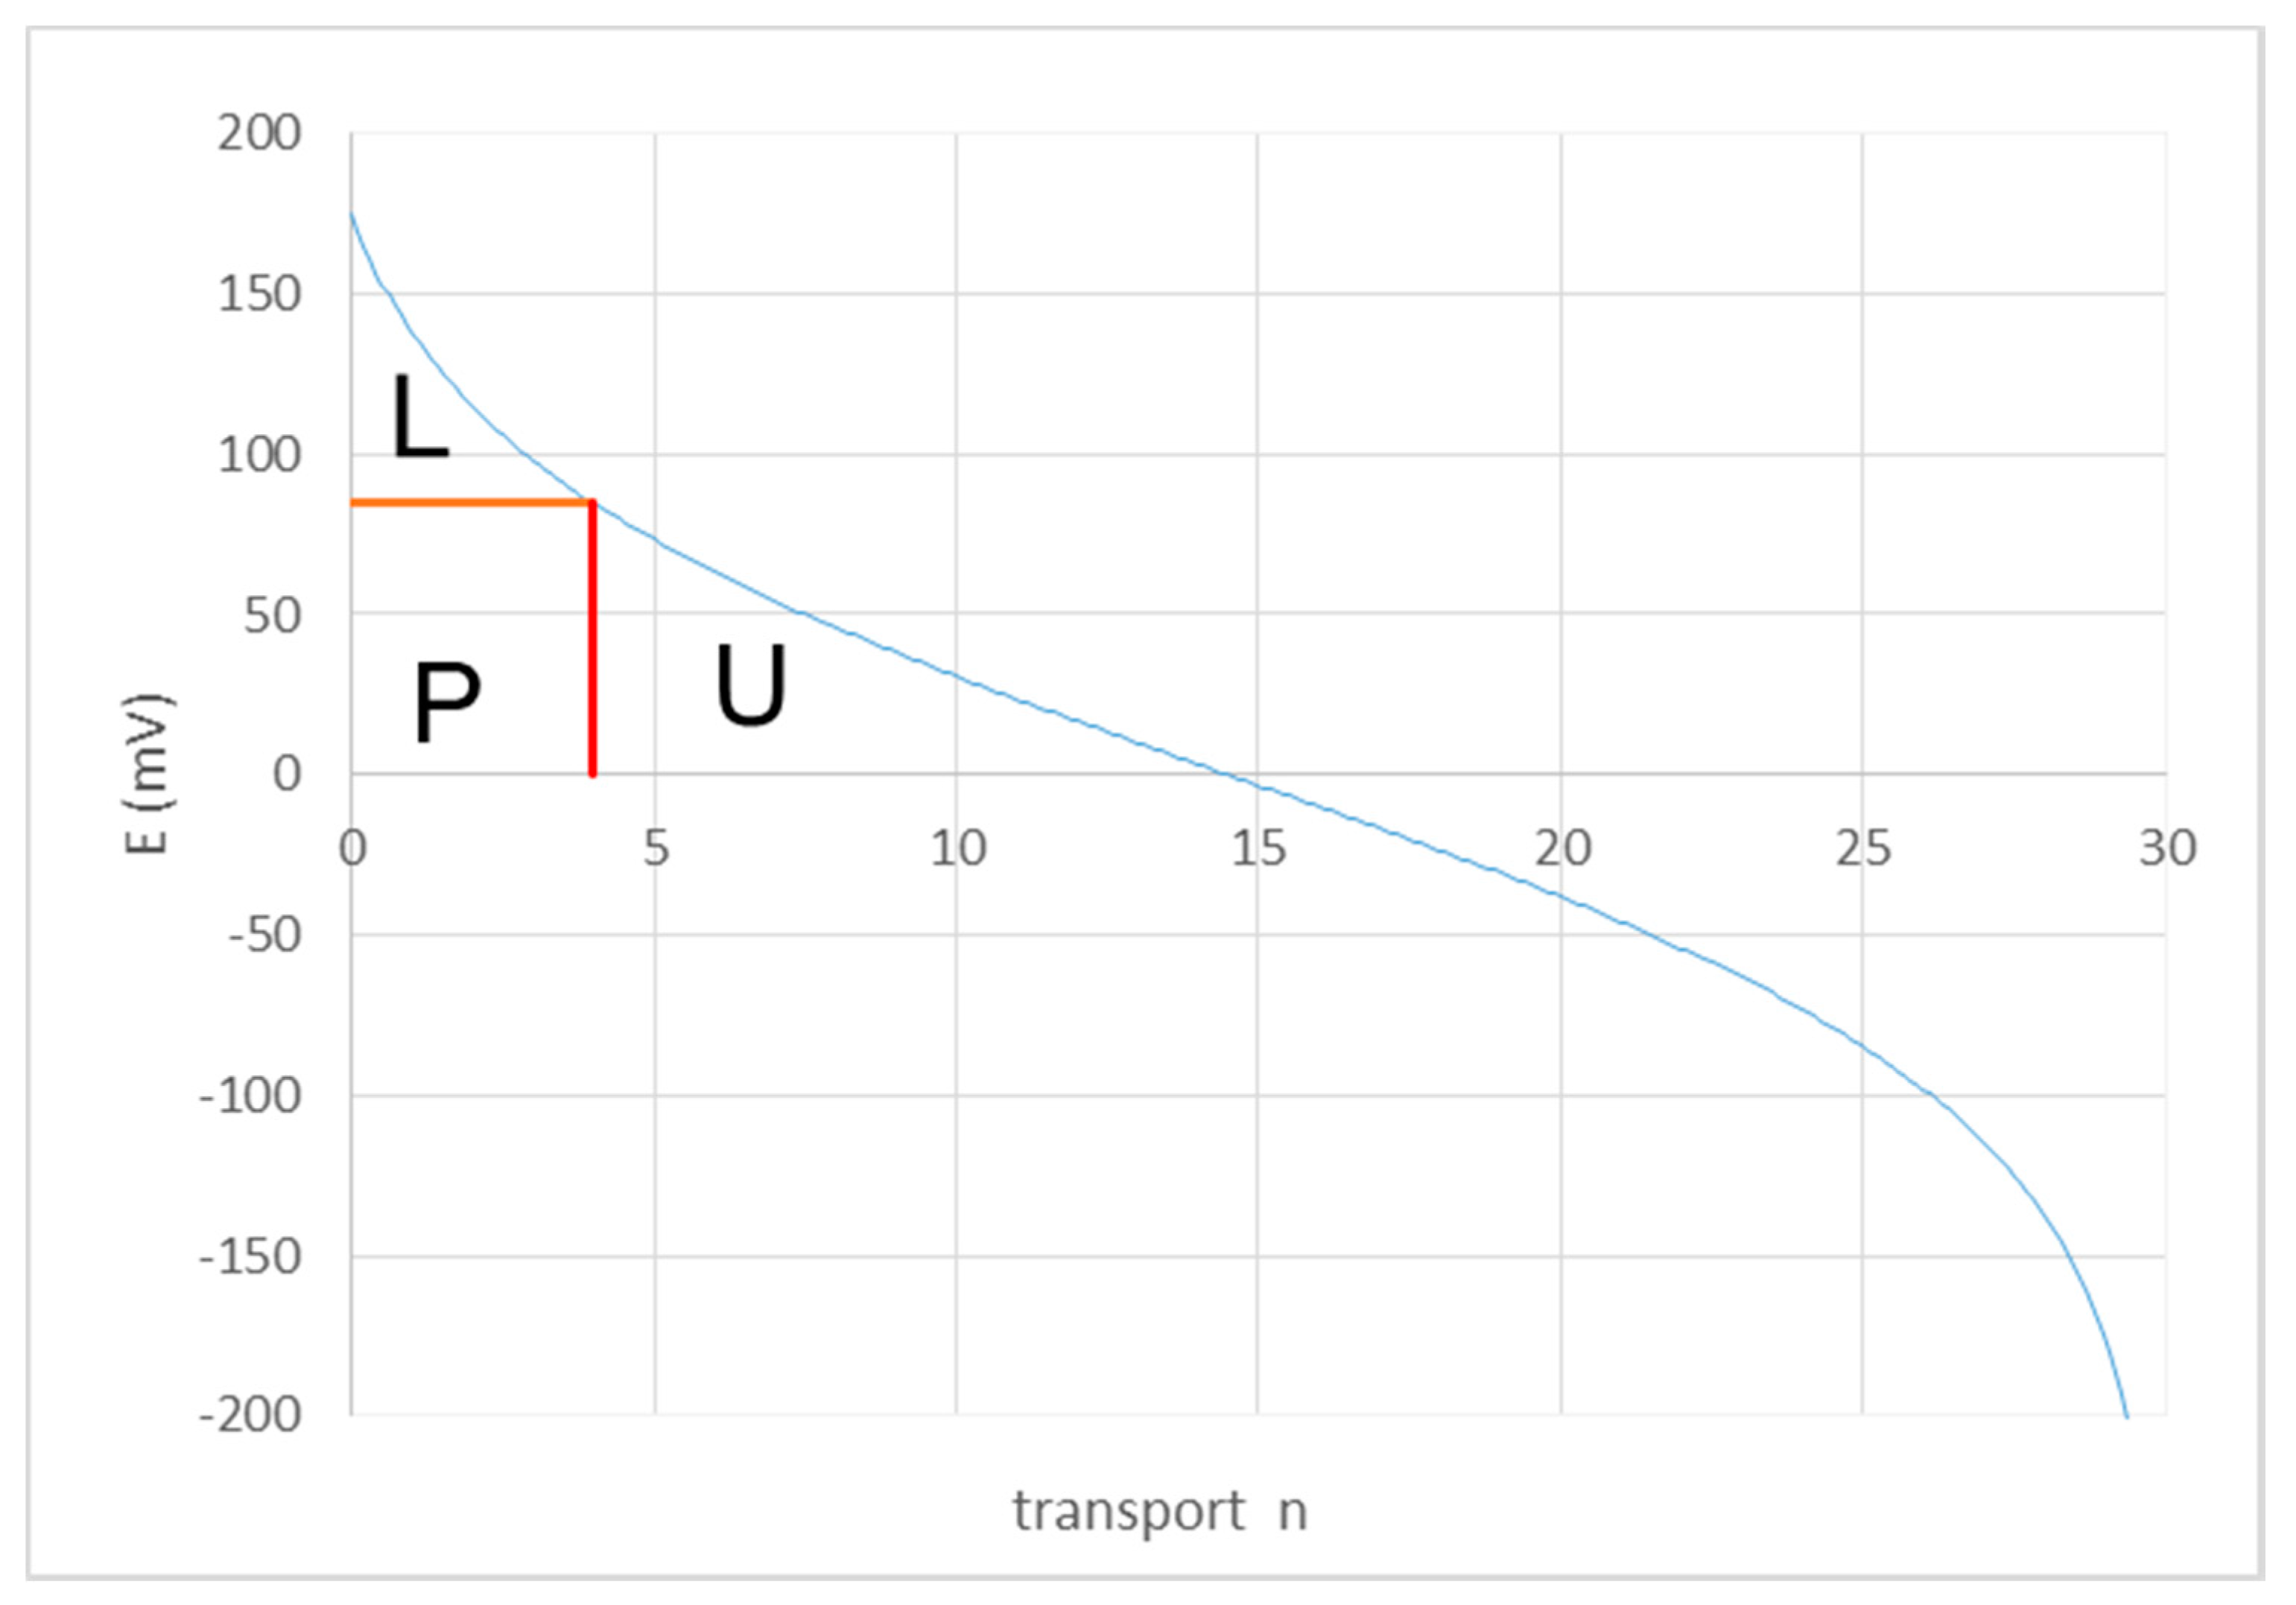
| E | electromotive force (V) |
| F | Faraday constant (96 485 C∙mol−1) |
| i | electrical current (A) |
| Loss | internal loss in the stack (W) |
| M | molecular weight of NaCl (0.05844 kg/mol) |
| MD | mixing degree |
| n | transport parameter (kg/s) |
| R | gas constant (8.32432 J∙mol−1 K−1) |
| Re | external resistance of a RED stack (load) (Ω) |
| Ri | internal resistance of a RED stack (load) (Ω) |
| P | power (W) |
| T | temperature (K) |
| Uc | clamp voltage (V) |
| V | volume (m3) |
| X | exergy flow (W) |
| Greek | |
| ε | thermodynamic efficiency |
| η | energy efficiency |
| Φ | flow rate (m3/s) |
| Subscripts | |
| hydro | hydrodynamic |
| i | inlet |
| o | outlet |
| opt | optimal |
| r | river |
| s | sea |
| Acronyms | |
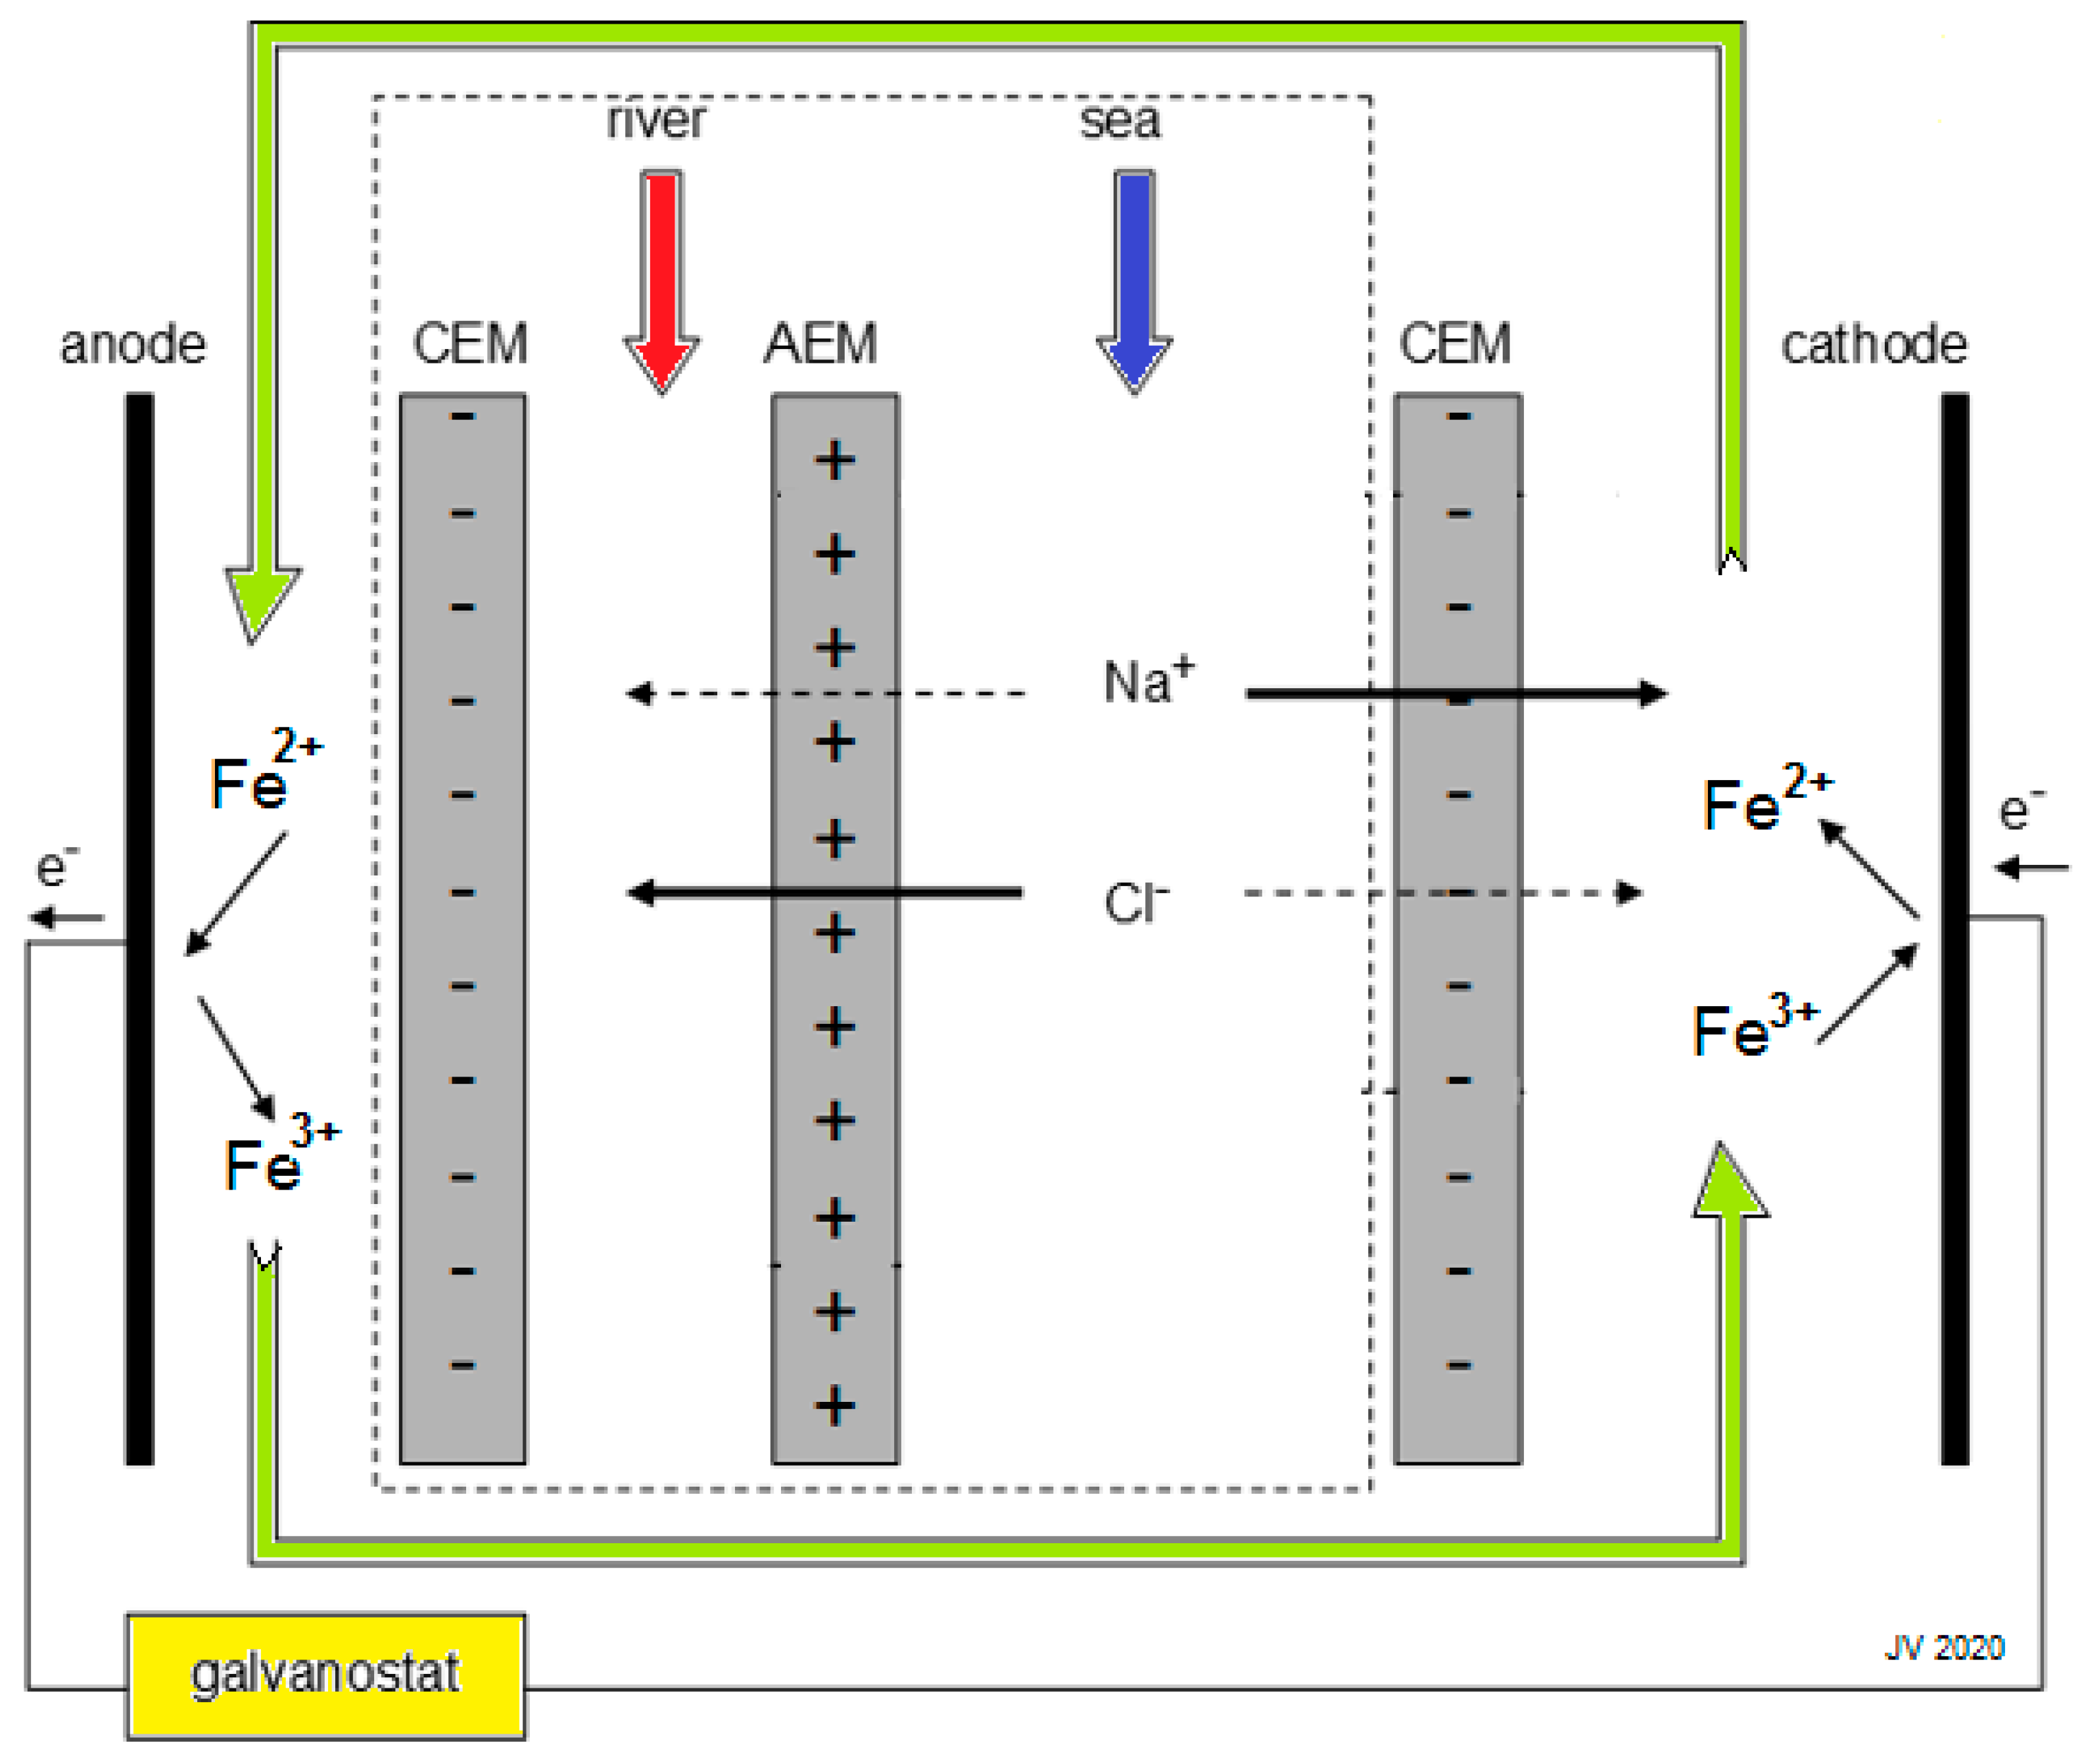
| EM | anion exchange membrane |
| CEM | cation exchange membrane |
| ED | electrodialysis |
| EMF | electromotive force |
| RED | reverse electrodialysis |
References
- Veerman, J. Reverse Electrodialysis—Design and Optimization by Modeling and Experimentation; Rijksuniversiteit Groningen: Groningen, The Netherlands, 2010. [Google Scholar]
- Veerman, J.; Saakes, M.; Metz, S.J.; Harmsen, G.J. Reverse electrodialysis: Performance of a stack with 50 cells on the mixing of sea and river water. J. Memb. Sci. 2009, 327, 136–144. [Google Scholar] [CrossRef] [Green Version]
- Wick, G.L.; Schmitt, W.R. Prospects for renewable energy from sea. Mar. Technol. Soc. J. 1977, 11, 16–21. [Google Scholar]
- World Energy Outlook. 2019. Available online: https://www.iea.org/reports/world-energy-outlook-2019/electricity#abstract (accessed on 16 June 2020).
- Tufa, R.A.; Pawlowski, S.; Veerman, J.; Bouzek, K.; Fontananova, E.; di Profio, G.; Velizarov, S.; Goulão Crespo, J.; Nijmeijer, K.; Curcio, E. Progress and prospects in reverse electrodialysis for salinity gradient energy conversion and storage. Appl. Energy 2018, 225, 290–331. [Google Scholar] [CrossRef]
- Veerman, J.; Vermaas, D.A. Reverse electrodialysis. In Sustainable Energy from Salinity Gradients; Cipollina, A., Micale, G., Eds.; Woodhead Publishing: Sawston, UK, 2016; pp. 77–133. [Google Scholar]
- Post, J.W.; Veerman, J.; Hamelers, H.V.M.; Euverink, G.J.W.; Metz, S.J.; Nymeijer, K.; Buisman, C.J.N. Salinity-gradient power: Evaluation of pressure-retarded osmosis and reverse electrodialysis. J. Memb. Sci. 2007, 288, 218–230. [Google Scholar] [CrossRef] [Green Version]
- Veerman, J.; Saakes, M.; Metz, S.J.; Harmsen, G.J. Reverse electrodialysis: A validated process model for design and optimization. Chem. Eng. J. 2011, 166, 256–268. [Google Scholar] [CrossRef]
- Veerman, J.; Saakes, M.; Metz, S.J.; Harmsen, G.J. Electrical power from sea and river water by reverse electrodialysis: A first step from the laboratory to a real power plant. Environ. Sci. Technol. 2010, 44, 9207–9212. [Google Scholar] [CrossRef] [PubMed]
- Vermaas, D.A.; Saakes, M.; Nijmeijer, K. Doubled power density from salinity gradients at reduced intermembrane distance. Environ. Sci. Technol. 2011, 45, 7089–7095. [Google Scholar] [CrossRef]
- Post, J.W.; Hamelers, H.V.M.; Buisman, C.J.N. Energy recovery from controlled mixing salt and fresh water with a reverse electrodialysis system. Environ. Sci. Technol. 2008, 42, 5785–5790. [Google Scholar] [CrossRef]
- Vermaas, D.A.; Veerman, J.; Yip, N.Y.; Elimelech, M.; Saakes, M.; Nijmeijer, K. High efficiency in energy generation from salinity gradients with reverse electrodialysis. ACS Sustain. Chem. Eng. 2013, 1, 1295–1302. [Google Scholar] [CrossRef]
- Tedesco, M.; Mazzola, P.; Tamburini, A.; Micale, G.; Bogle, I.D.L.; Papapetrou, M.; Cipollina, A. Analysis and simulation of scale-up potentials in reverse electrodialysis. Desalin. Water Treat. 2015, 55, 3391–3403. [Google Scholar] [CrossRef] [Green Version]
- Hu, J.; Xu, S.; Wu, X.; Wu, D.; Jin, D.; Wang, P.; Leng, Q. Multi-stage reverse electrodialysis: Strategies to harvest salinity gradient energy. Energy Convers. Manag. 2019, 183, 803–815. [Google Scholar] [CrossRef]
- Hu, J.; Xu, S.; Wu, X.; Wang, S.; Zhang, X.; Yang, S.; Xi, R.; Wu, D.; Xu, L. Experimental investigation on the performance of series control multi-stage reverse electrodialysis. Energy Convers. Manag. 2020, 204, 112284. [Google Scholar] [CrossRef]
- Simões, C.; Pintossi, D.; Saakes, M.; Borneman, Z.; Brilman, W.; Nijmeijer, K. Electrode segmentation in reverse electrodialysis: Improved power and energy efficiency. Desalination 2020, 492, 114604. [Google Scholar] [CrossRef]
- Kim, B.; Kwak, R.; Kwon, H.J.; Pham, V.S.; Kim, M.; Al-Anzi, B.; Lim, G.; Han, J. Purification of High Salinity Brine by Multi-Stage Ion Concentration Polarization Desalination. Sci. Rep. 2016, 6, 31850. [Google Scholar] [CrossRef] [Green Version]
- Yan, H.; Wang, Y.; Wu, L.; Shehzad, M.A.; Jiang, C.; Fu, R.; Liu, Z.; Xu, T. Multistage-batch electrodialysis to concentrate high-salinity solutions: Process optimisation, water transport, and energy consumption. J. Memb. Sci. 2019, 570–571, 245–257. [Google Scholar] [CrossRef]
- Doornbusch, G.J.; Bel, M.; Tedesco, M.; Post, J.W.; Borneman, Z.; Nijmeijer, K. Effect of membrane area and membrane properties in multistage electrodialysis on seawater desalination performance. J. Memb. Sci. 2020, 611, 118303. [Google Scholar] [CrossRef]
- Doornbusch, G.J.; Tedesco, M.; Post, J.W.; Borneman, Z.; Nijmeijer, K. Experimental investigation of multistage electrodialysis for seawater desalination. Desalination 2019, 464, 105–114. [Google Scholar] [CrossRef]
- Chehayeb, K.M.; Nayar, K.G.; Lienhard, J.H. On the merits of using multi-stage and counterflow electrodialysis for reduced energy consumption. Desalination 2018, 439, 1–16. [Google Scholar] [CrossRef] [Green Version]
- Tondeur, D.; Kvaalen, E. Equipartition of entropy production. An optimality criterion for transfer and separation processes. Ind. Eng. Chem. Res. 1987, 26, 50–56. [Google Scholar] [CrossRef]
- Doornbusch, G.; Swart, H.; Tedesco, M.; Post, J.; Borneman, Z.; Nijmeijer, K. Current utilization in electrodialysis: Electrode segmentation as alternative for multistaging. Desalination 2020, 480, 114243. [Google Scholar] [CrossRef]
- Forgacs, C.; O’Brien, R.N. Utilization of membrane processes in the development of non-conventional renewable energy sources. Chem. Can. 1979, 31, 19–21. [Google Scholar]
- Vanoppen, M.; Criel, E.; Andersen, S.; Prévoteau, A.; Verliefde, A.R.D. Assisted Reverse Electrodialysis: A Novel Technique to Decrease Reverse Osmosis Energy Demand. Available online: https://biblio.ugent.be/publication/7098263/file/7098283.pdf (accessed on 29 July 2020).


© 2020 by the author. Licensee MDPI, Basel, Switzerland. This article is an open access article distributed under the terms and conditions of the Creative Commons Attribution (CC BY) license (http://creativecommons.org/licenses/by/4.0/).
Share and Cite
Veerman, J. Reverse Electrodialysis: Co- and Counterflow Optimization of Multistage Configurations for Maximum Energy Efficiency. Membranes 2020, 10, 206. https://doi.org/10.3390/membranes10090206
Veerman J. Reverse Electrodialysis: Co- and Counterflow Optimization of Multistage Configurations for Maximum Energy Efficiency. Membranes. 2020; 10(9):206. https://doi.org/10.3390/membranes10090206
Chicago/Turabian StyleVeerman, Joost. 2020. "Reverse Electrodialysis: Co- and Counterflow Optimization of Multistage Configurations for Maximum Energy Efficiency" Membranes 10, no. 9: 206. https://doi.org/10.3390/membranes10090206