Integration of Response Surface Methodology (RSM) and Principal Component Analysis (PCA) as an Optimization Tool for Polymer Inclusion Membrane Based-Optodes Designed for Hg(II), Cd(II), and Pb(II)
Abstract
:1. Introduction
2. Materials and Methods
2.1. Reagents
2.2. Instruments
2.3. Doehlert Experimental Design
2.3.1. Membrane Preparation
2.3.2. Measurements
2.4. Optimization
2.4.1. Response Surface Methodology (RSM)
2.4.2. Principal Component Analysis (PCA)
2.4.3. Derringer’s Desirability Function
2.4.4. Heat Maps
2.4.5. Hierarchical Cluster Analysis (HCA)
2.5. Data Presentation
3. Results and Discussions
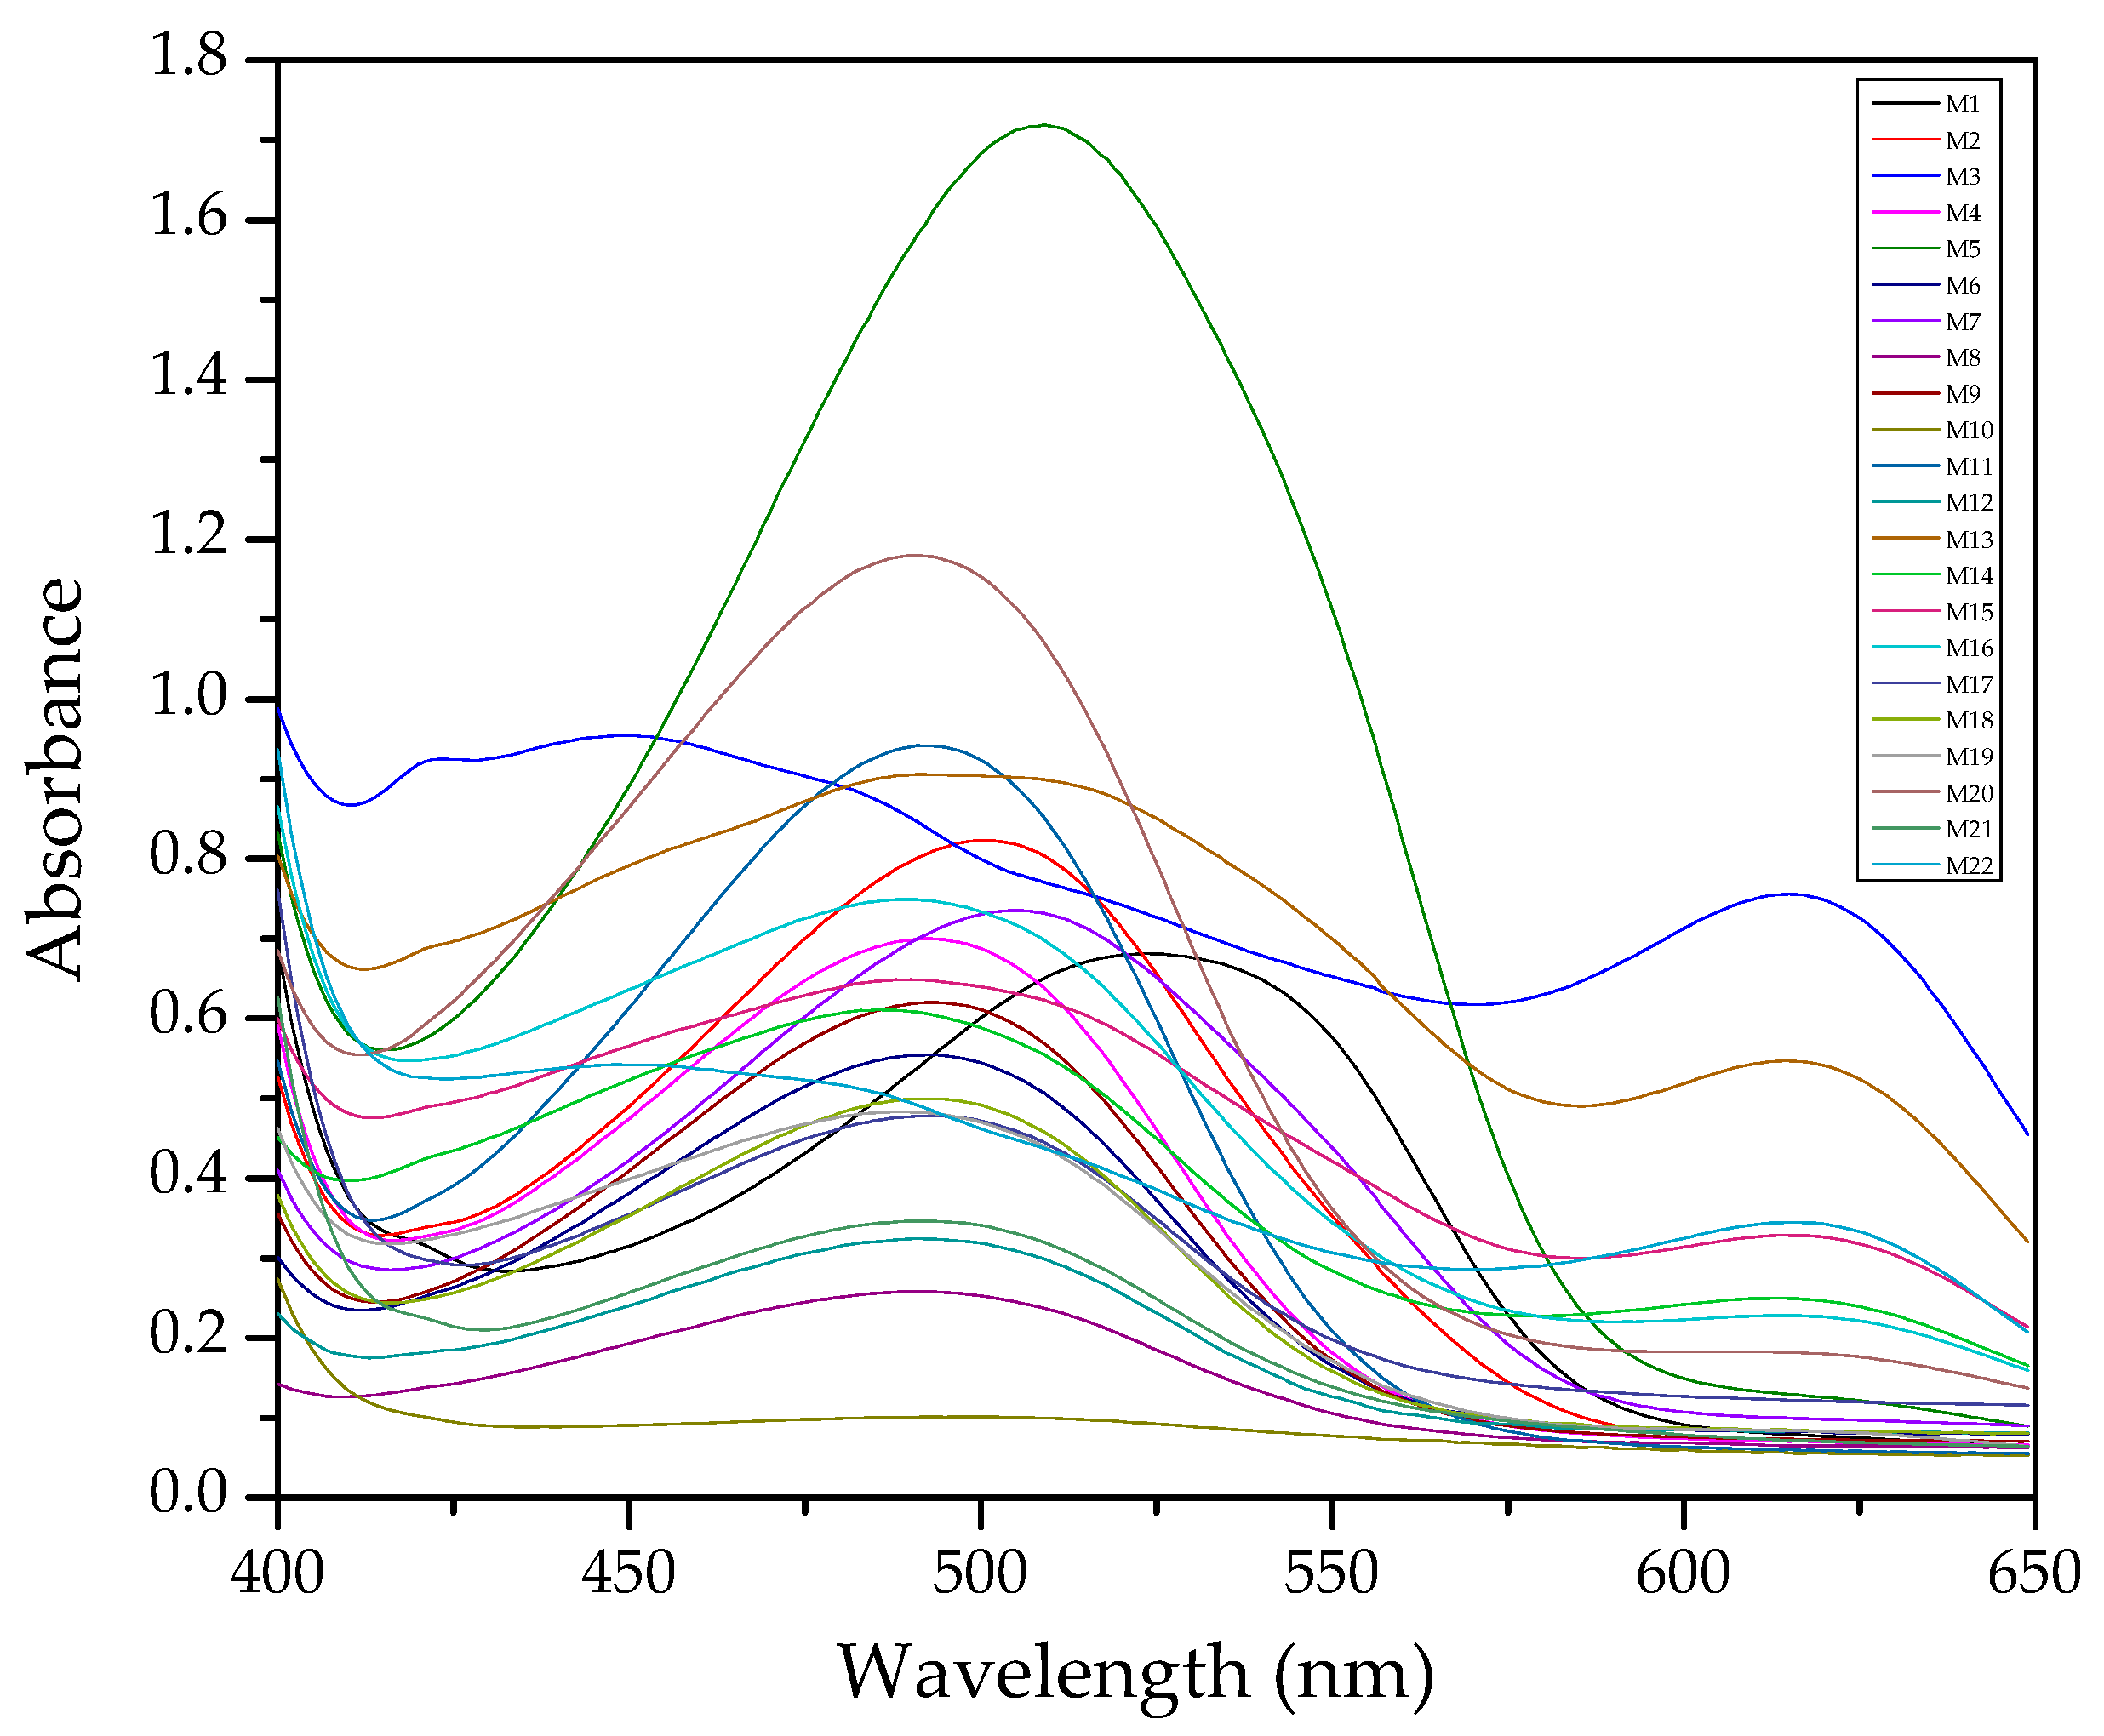
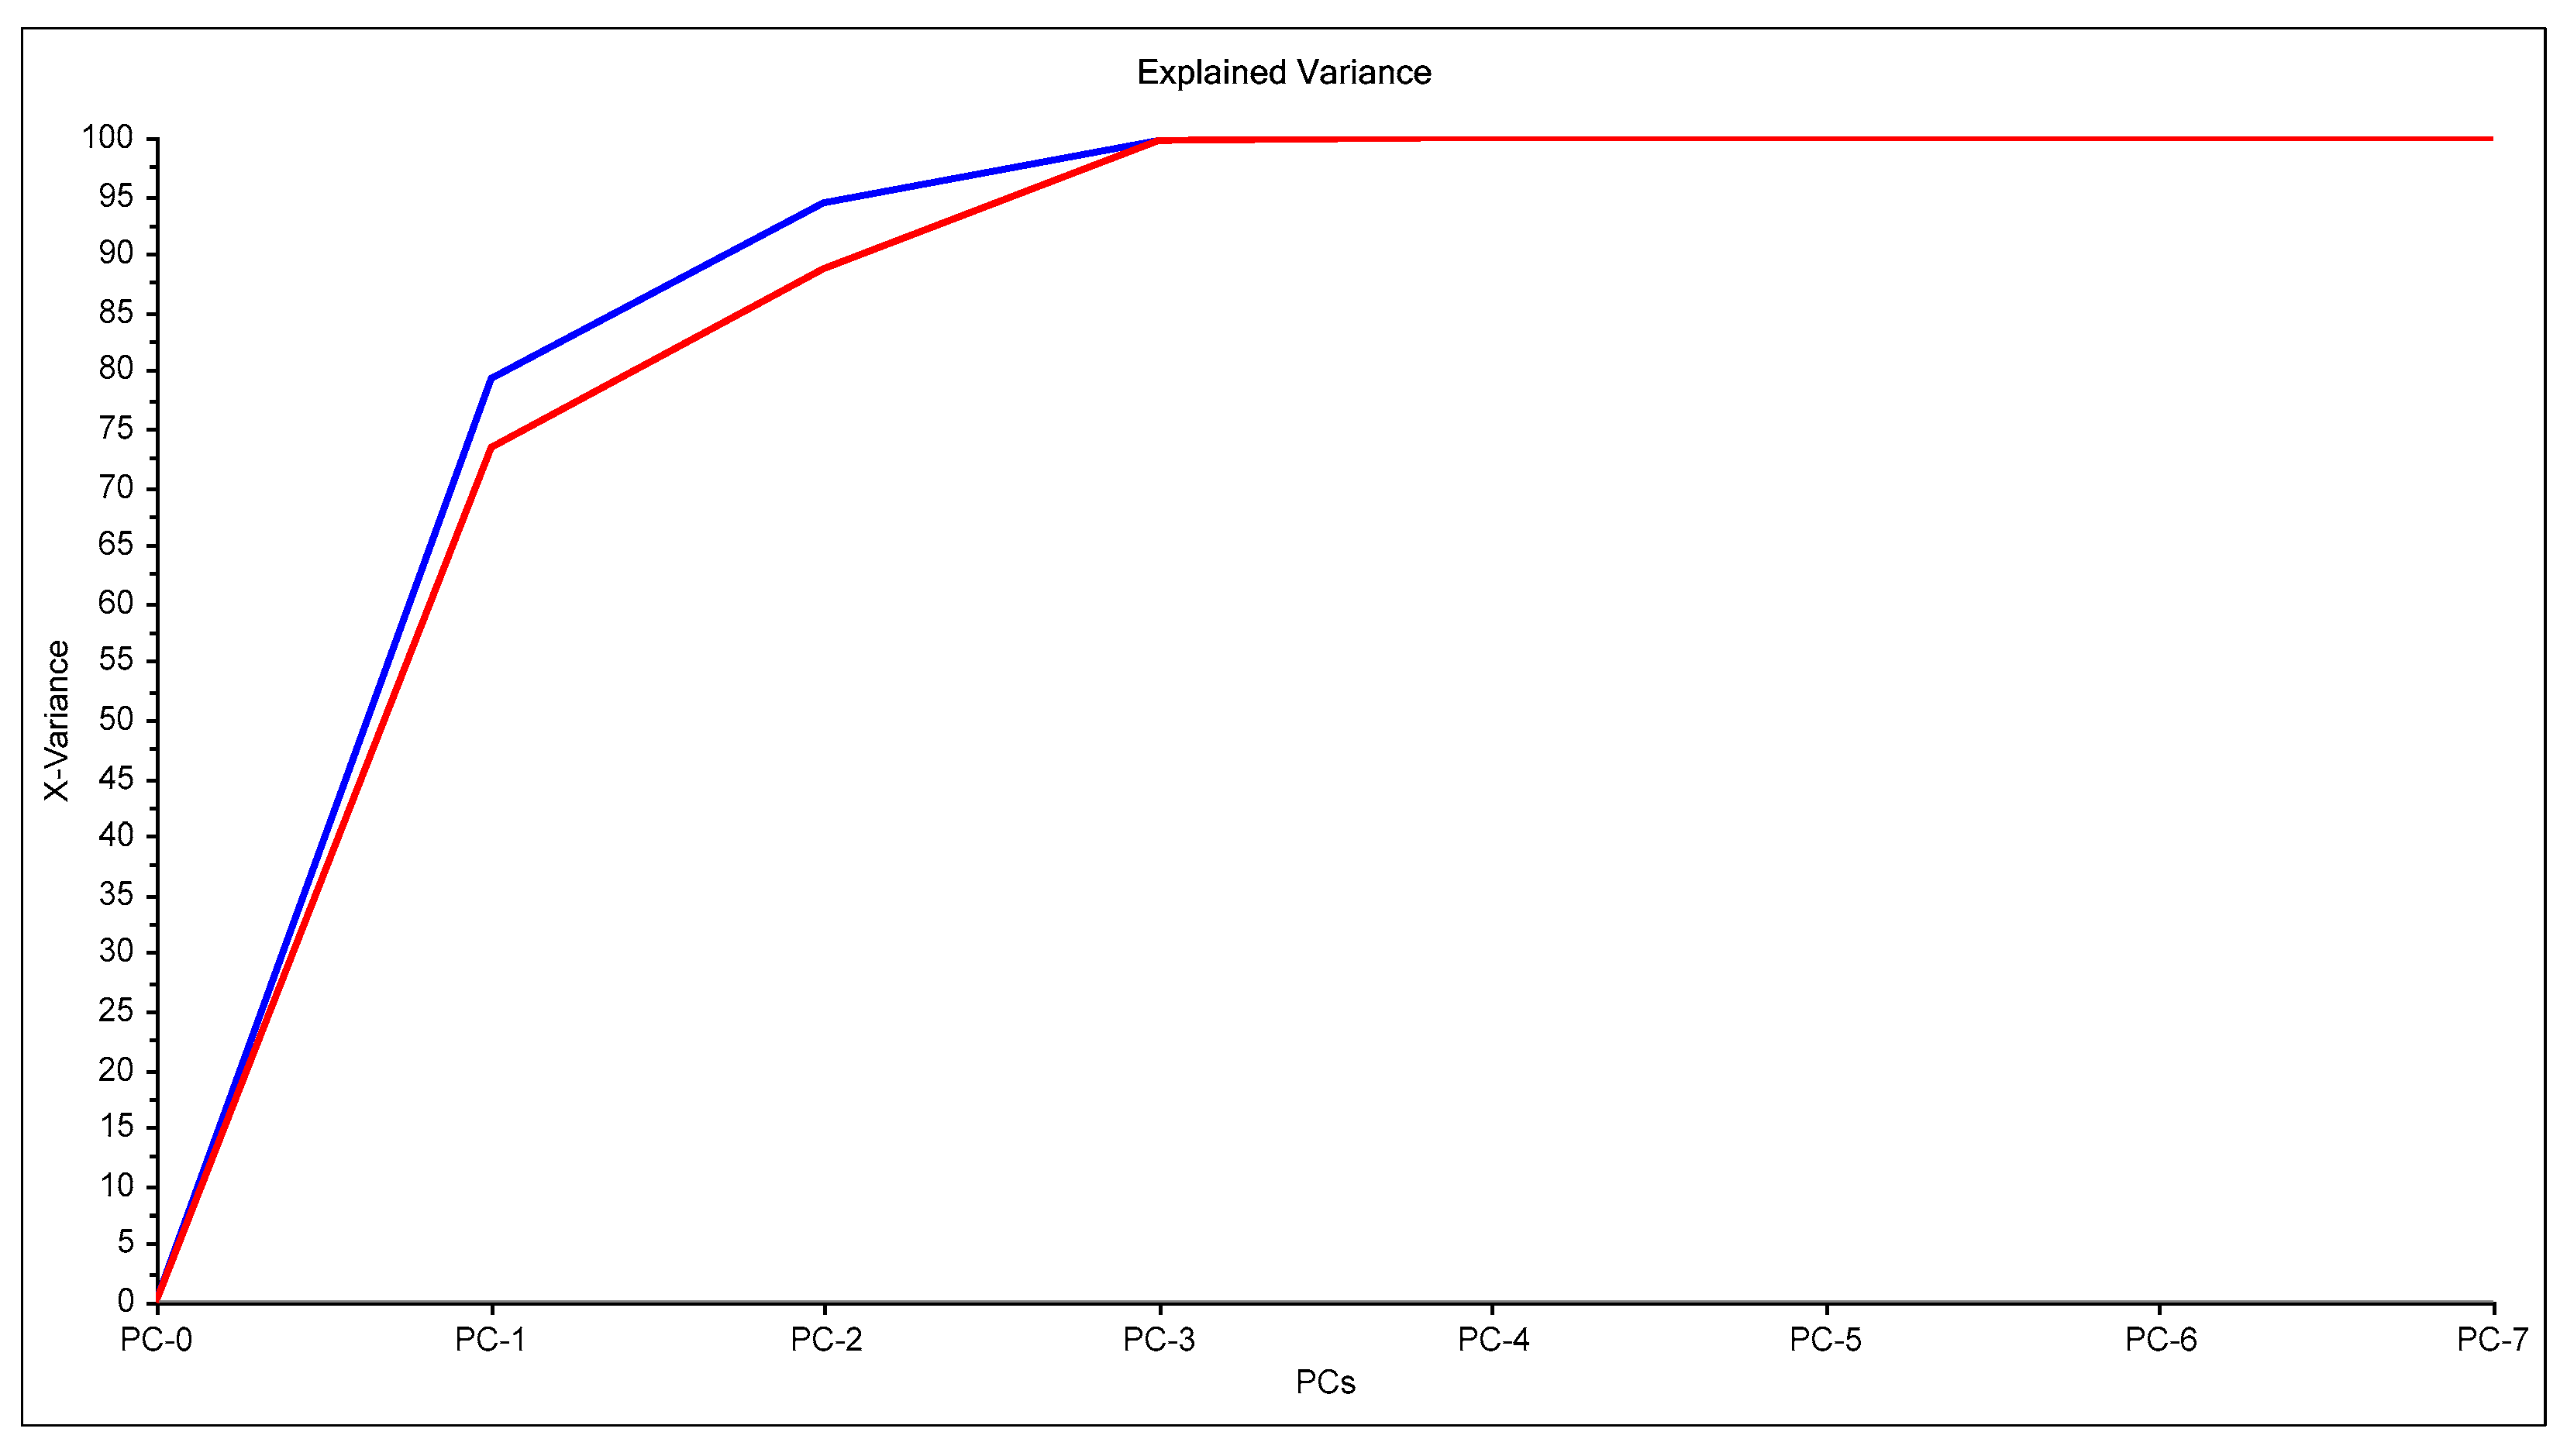
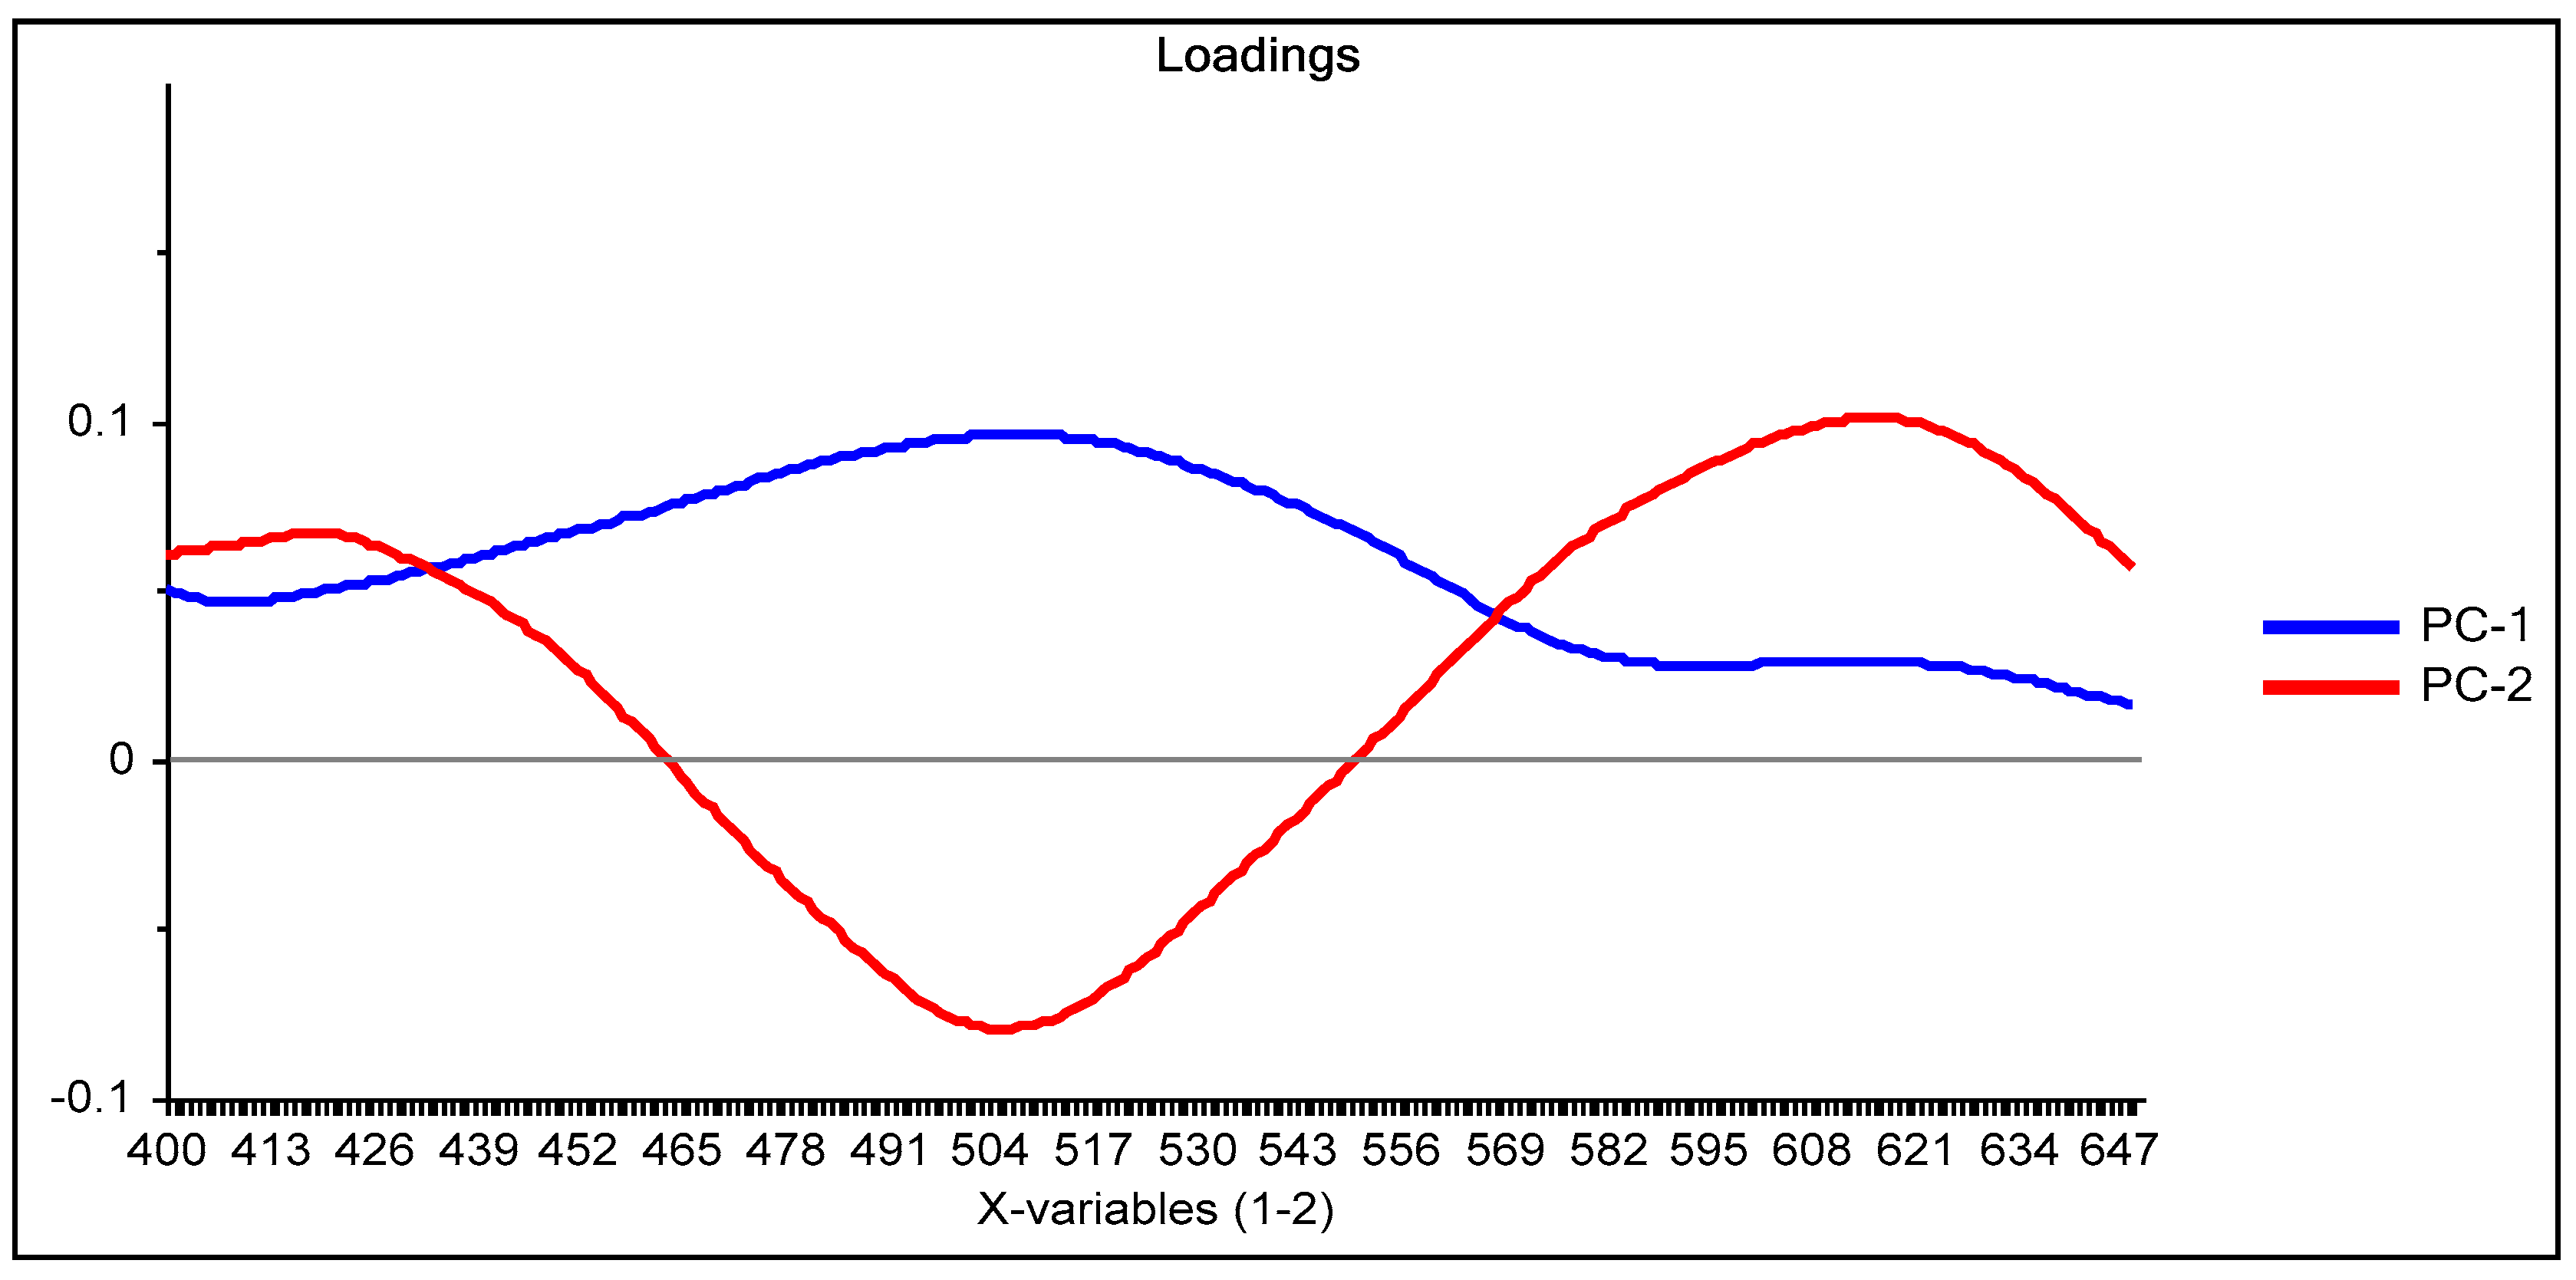
3.1. PCA of the Spectra after Complexation (M1)
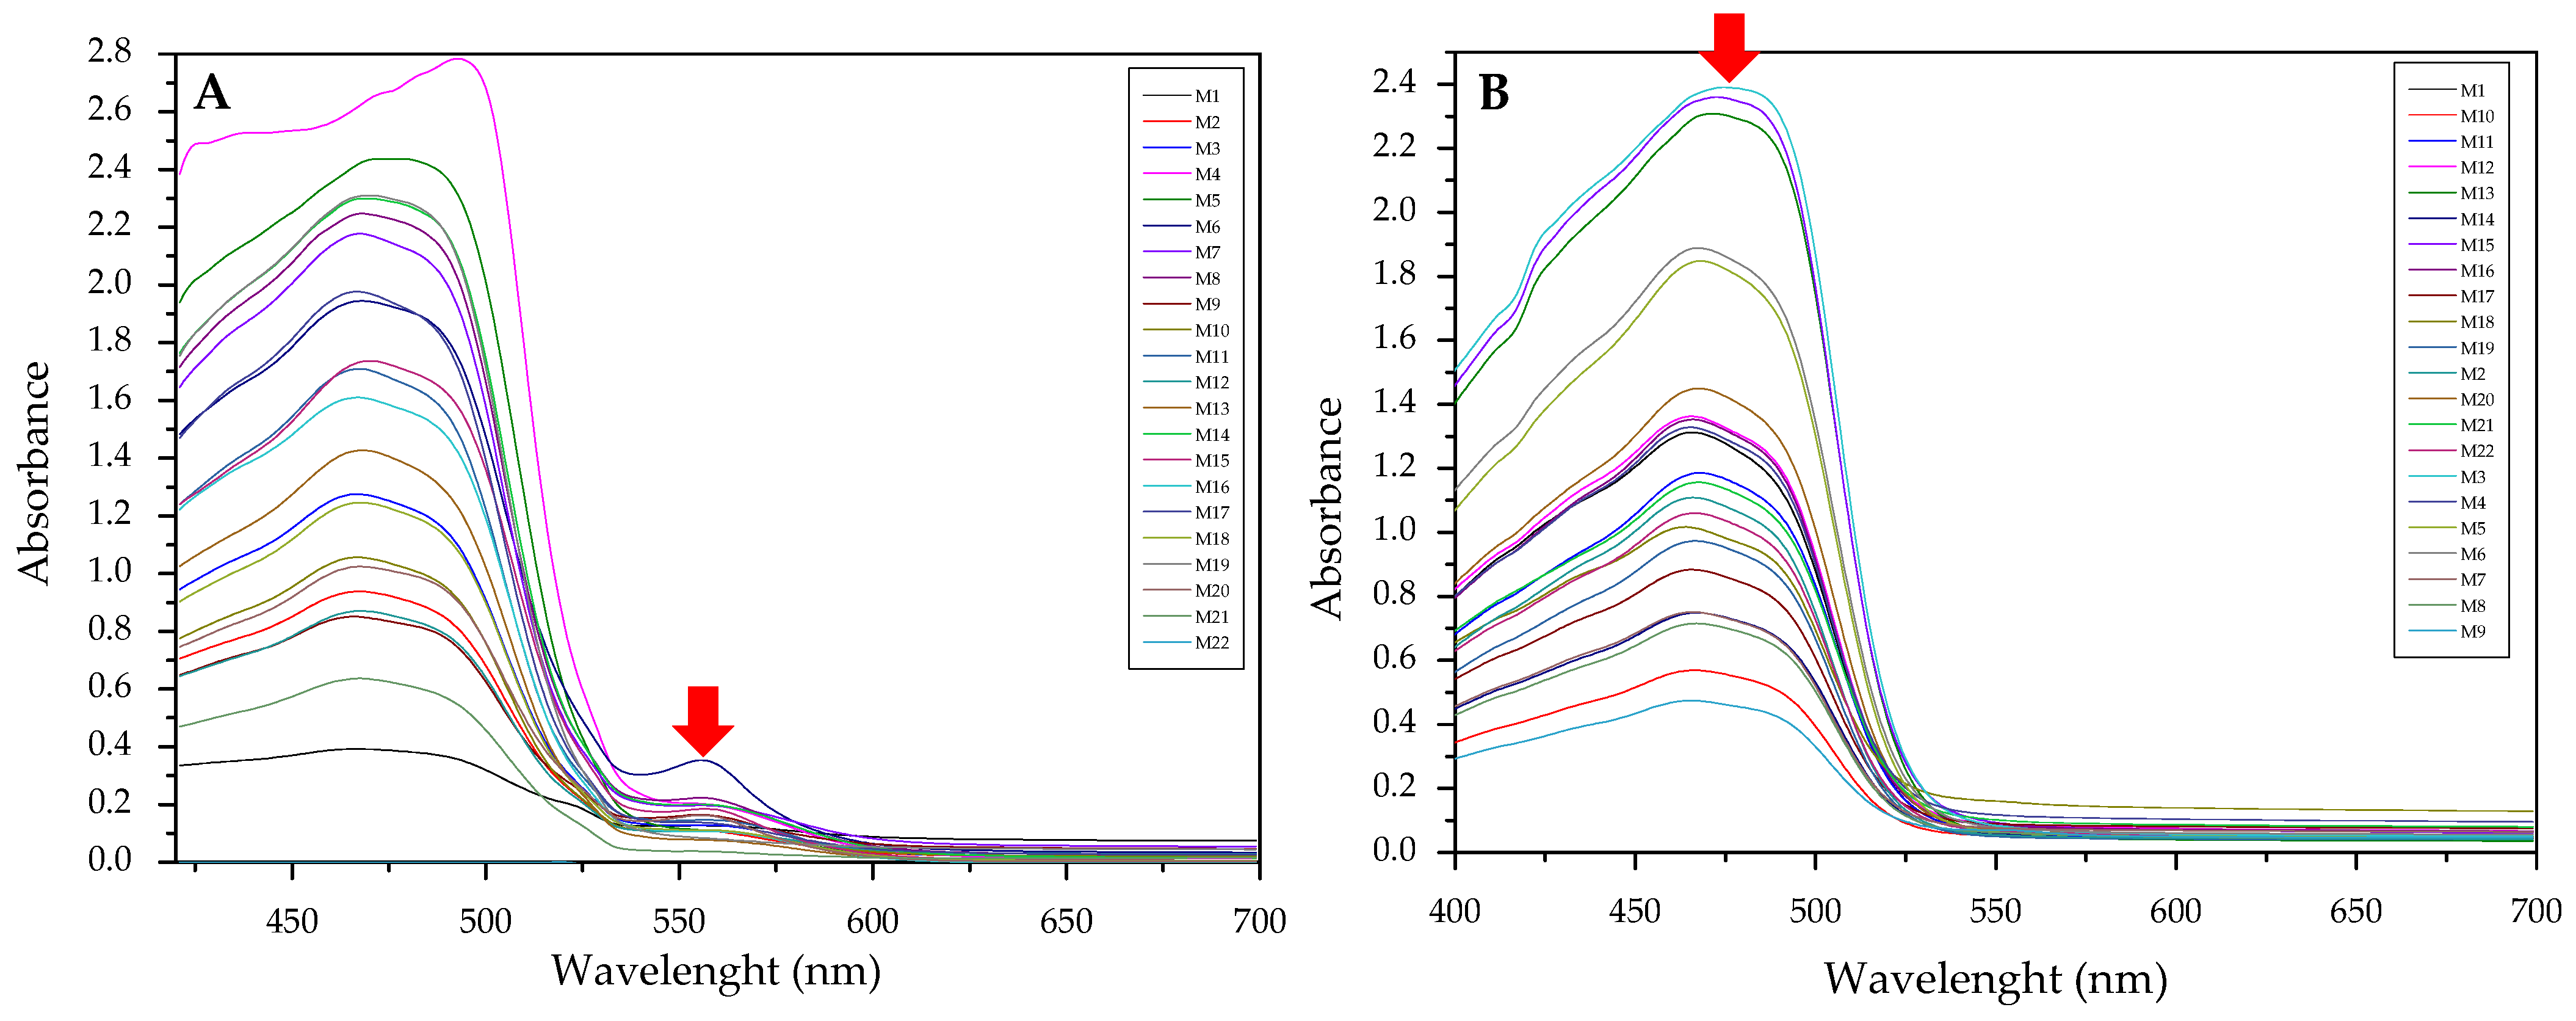
3.2. Use of the Absorbances of the Free Chromophore and the Formed Complex (M2)
3.3. Subtraction of the Normalized Spectra before and after Complexation before PCA Analysis (M3)
3.4. Comparison of the M1, M2, and M3 Processing Methods
4. Conclusions
Supplementary Materials
Author Contributions
Funding
Institutional Review Board Statement
Informed Consent Statement
Acknowledgments
Conflicts of Interest
References
- Santos, M.C.; Nascimento, P.A.M.; Guedes, W.N.; Pereira-Filho, E.R.; Filletti, É.R.; Pereira, F.M.V. Chemometrics in analytical chemistry—An overview of applications from 2014 to 2018. Eclet. Quim. 2019, 44, 11–25. [Google Scholar] [CrossRef] [Green Version]
- Duarte, A.C.; Capelo, S. Application of chemometrics in separation science. J. Liq. Chromatogr. Relat. Technol. 2006, 29, 1143–1176. [Google Scholar] [CrossRef]
- Olsson, I.-M. Experimental Designs at the Crossroads of Drug Discovery. Ph.D. Thesis, Umeå University, Umeå, Sweden, 2006. [Google Scholar]
- Vanhatalo, E.; Vännman, K. Using factorial design and multivariate analysis when experimenting in a continuous process. Qual. Reliab. Eng. Int. 2008, 24, 983–995. [Google Scholar] [CrossRef]
- Huang, J.; Kaul, G.; Cai, C.; Chatlapalli, R.; Hernandez-Abad, P.; Ghosh, K.; Nagi, A. Quality by design case study: An integrated multivariate approach to drug product and process development. Int. J. Pharm. 2009, 382, 23–32. [Google Scholar] [CrossRef] [PubMed]
- Weatherell, C.J.; Lai, E.P.C. Factorial experimental design and principal component analysis of the interaction of animal glues with polymeric and silica-based stationary phases in size exclusion chromatography. J. Chromatogr. A 1994, 669, 31–44. [Google Scholar] [CrossRef]
- Antti, H.; Ebbels, T.M.D.; Keun, H.C.; Bollard, M.E.; Beckonert, O.; Lindon, J.C.; Nicholson, J.K.; Holmes, E. Statistical experimental design and partial least squares regression analysis of biofluid metabonomic NMR and clinical chemistry data for screening of adverse drug effects. Chemom. Intell. Lab. Syst. 2004, 73, 139–149. [Google Scholar] [CrossRef]
- Babanova, S.; Artyushkova, K.; Ulyanova, Y.; Singhal, S.; Atanassov, P. Design of experiments and principal component analysis as approaches for enhancing performance of gas-diffusional air-breathing bilirubin oxidase cathode. J. Power Sources 2014, 245, 389–397. [Google Scholar] [CrossRef]
- Bhateria, R.; Dhaka, R. Optimization and statistical modelling of cadmium biosorption process in aqueous medium by Aspergillus niger using response surface methodology and principal component analysis. Ecol. Eng. 2019, 135, 127–138. [Google Scholar] [CrossRef]
- Thapa, P.; Choi, D.H.; Kim, M.S.; Jeong, S.H. Effects of granulation process variables on the physical properties of dosage forms by combination of experimental design and principal component analysis. Asian J. Pharm. Sci. 2019, 14, 287–304. [Google Scholar] [CrossRef] [PubMed]
- Clavaud, M.; Lema-Martinez, C.; Roggo, Y.; Bigalke, M.; Guillemain, A.; Hubert, P.; Ziemons, E.; Allmendinger, A. Near-Infrared Spectroscopy to Determine Residual Moisture in Freeze-Dried Products: Model Generation by Statistical Design of Experiments. J. Pharm. Sci. 2020, 109, 719–729. [Google Scholar] [CrossRef] [Green Version]
- Murray, P.M.; Bellany, F.; Benhamou, L.; Bučar, D.K.; Tabor, A.B.; Sheppard, T.D. The application of design of experiments (DoE) reaction optimisation and solvent selection in the development of new synthetic chemistry. Org. Biomol. Chem. 2016, 14, 2373–2384. [Google Scholar] [CrossRef] [PubMed] [Green Version]
- Kazemi, S.Y.; Hamidi, A.S.; Zolgharnein, J.; Lakouraj, M.M. Experimental design as an optimization approach for fabrication a new selective sensor for thallium(I) based on calix [6] arene. J. Anal. Chem. 2014, 69, 646–655. [Google Scholar] [CrossRef]
- Ngarisan, N.I.; Ngah, C.W.Z.C.W.; Ahmad, M.; Kuswandi, B. Optimization of polymer inclusion membranes (PIMs) preparation for immobilization of Chrome Azurol S for optical sensing of aluminum(III). Sens. Actuators B Chem. 2014, 203, 465–470. [Google Scholar] [CrossRef]
- Ferreira, S.L.C.; Dos Santos, W.N.L.; Quintella, C.M.; Neto, B.B.; Bosque-Sendra, J.M. Doehlert matrix: A chemometric tool for analytical chemistry—Review. Talanta 2004, 63, 1061–1067. [Google Scholar] [CrossRef] [PubMed]
- Derringer, G.; Suich, R. Simultaneous Optimization of Several Response Variables. J. Qual. Technol. 1980, 12, 214–219. [Google Scholar] [CrossRef]
- Suah, F.B.M. Preparation and characterization of a novel Co(II) optode based on polymer inclusion membrane. Anal. Chem. Res. 2017, 12, 40–46. [Google Scholar] [CrossRef]
- Shirzad, M.; Karimi, M. Statistical analysis and optimal design of polymer inclusion membrane for water treatment by Co(II) removal. Desalin. Water Treat. 2020, 182, 194–207. [Google Scholar] [CrossRef]
- Suah, F.B.M.; Ahmad, M.; Heng, L.Y. Highly sensitive fluorescence optode for aluminium(III) based on non-plasticized polymer inclusion membrane. Sens. Actuators B Chem. 2014, 201, 490–495. [Google Scholar] [CrossRef]
- Suah, F.B.M.; Ahmad, M. Preparation and characterization of polymer inclusion membrane based optode for determination of Al3+ ion. Anal. Chim. Acta 2017, 951, 133–139. [Google Scholar] [CrossRef]
- Wang, D.; Liu, J.; Chen, J.; Liu, Q.; Zeng, H. New insights into the interfacial behavior and swelling of polymer inclusion membrane (PIM) during Zn(II) extraction process. Chem. Eng. Sci. 2020, 220, 115620. [Google Scholar] [CrossRef]
- Jayawardane, B.M.; Coo, L.D.L.C.; Cattrall, R.W.; Kolev, S.D. The use of a polymer inclusion membrane in a paper-based sensor for the selective determination of Cu(II). Anal. Chim. Acta 2013, 803, 106–112. [Google Scholar] [CrossRef]
- Almeida, M.I.G.S.; Cattrall, R.W.; Kolev, S.D. Polymer inclusion membranes (PIMs) in chemical analysis—A review. Anal. Chim. Acta 2017, 987, 1–14. [Google Scholar] [CrossRef]
- Rodríguez de San Miguel, E.; Hernández-Andaluz, A.M.; Bañuelos, J.G.; Saniger, J.M.; Aguilar, J.C.; de Gyves, J. LIX®-loaded polymer inclusion membrane for copper(II) transport. 1. Composition-performance relationships through membrane characterization and solubility diagrams. Mater. Sci. Eng. A 2006, 434, 30–38. [Google Scholar] [CrossRef]
- Myers, R.H.; Montgomery, D.C.; Anderson-Cook, C.M. Response Surface Methodology: Process and Product Optimization Using Designed Experiments; Wiley: New York, NY, USA, 2016; p. 856. ISBN 978-1-118-91601-8. [Google Scholar]
- Henrique, A.; Karimi, M.; Silva, J.A.C.; Rodrigues, A.E. Analyses of Adsorption Behavior of CO2, CH4, and N2 on Different Types of BETA Zeolites. Chem. Eng. Technol. 2019, 42, 327–342. [Google Scholar] [CrossRef] [Green Version]
- Karimi, M.; Silva, J.A.C.; Gonçalves, C.N.D.P.; Diaz De Tuesta, J.L.; Rodrigues, A.E.; Gomes, H.T. CO2 Capture in Chemically and Thermally Modified Activated Carbons Using Breakthrough Measurements: Experimental and Modeling Study. Ind. Eng. Chem. Res. 2018, 57, 11154–11166. [Google Scholar] [CrossRef] [Green Version]
- Rojas-Challa, Y.; Rodríguez de San Miguel, E.; de Gyves, J. Response Surface Methodology Approach Applied to the Study of Arsenic (V) Migration by Facilitated Transport in Polymer Inclusion Membranes. Water Air Soil Pollut. 2020, 231, 1–12. [Google Scholar] [CrossRef]
- Jollife, I.T.; Cadima, J. Principal component analysis: A review and recent developments. Philos. Trans. R. Soc. A Math. Phys. Eng. Sci. 2016, 374, 20150202. [Google Scholar] [CrossRef]
- Einax, J.W.; Zwanziger, H.W.; Geiß, S. Chemometrics in Environmental Analysis; American Chemical Society: NJ, USA, 1998; ISBN 3-527-28772-8. Available online: https://pubs.acs.org/doi/abs/10.1021/ja975630o (accessed on 14 April 2021).
- Akçay, H.; Anagün, A.S. Multi response optimization application on a manufacturing factory. Math. Comput. Appl. 2013, 18, 531–538. [Google Scholar] [CrossRef]
- Mang, D.Y.; Abdou, A.B.; Njintang, N.Y.; Djiogue, E.J.M.; Loura, B.B.; Mbofung, M.C. Application of desirability-function and RSM to optimize antioxidant properties of mucuna milk. J. Food Meas. Charact. 2015, 9, 495–507. [Google Scholar] [CrossRef]
- STATGRAPHICS Diseño de Experimentos—Optimización de Múltiples Respuestas. Manual del Usuario; StatPoint, Inc.: Madrid, Spain, 2006; pp. 1–16.
- Available online: https://www.investopedia.com/terms/h/heatmap.asp (accessed on 24 February 2021).
- Hanrahan, G. Environmental Chemometrics. Principles and Modern Applications; CRC Press: Boca Raton, FL, USA, 2019; ISBN 9780367386344. [Google Scholar]
- McDonagh, C.; Burke, C.S.; MacCraith, B.D. Optical chemical sensors. Chem. Rev. 2008, 108, 400–422. [Google Scholar] [CrossRef] [PubMed]

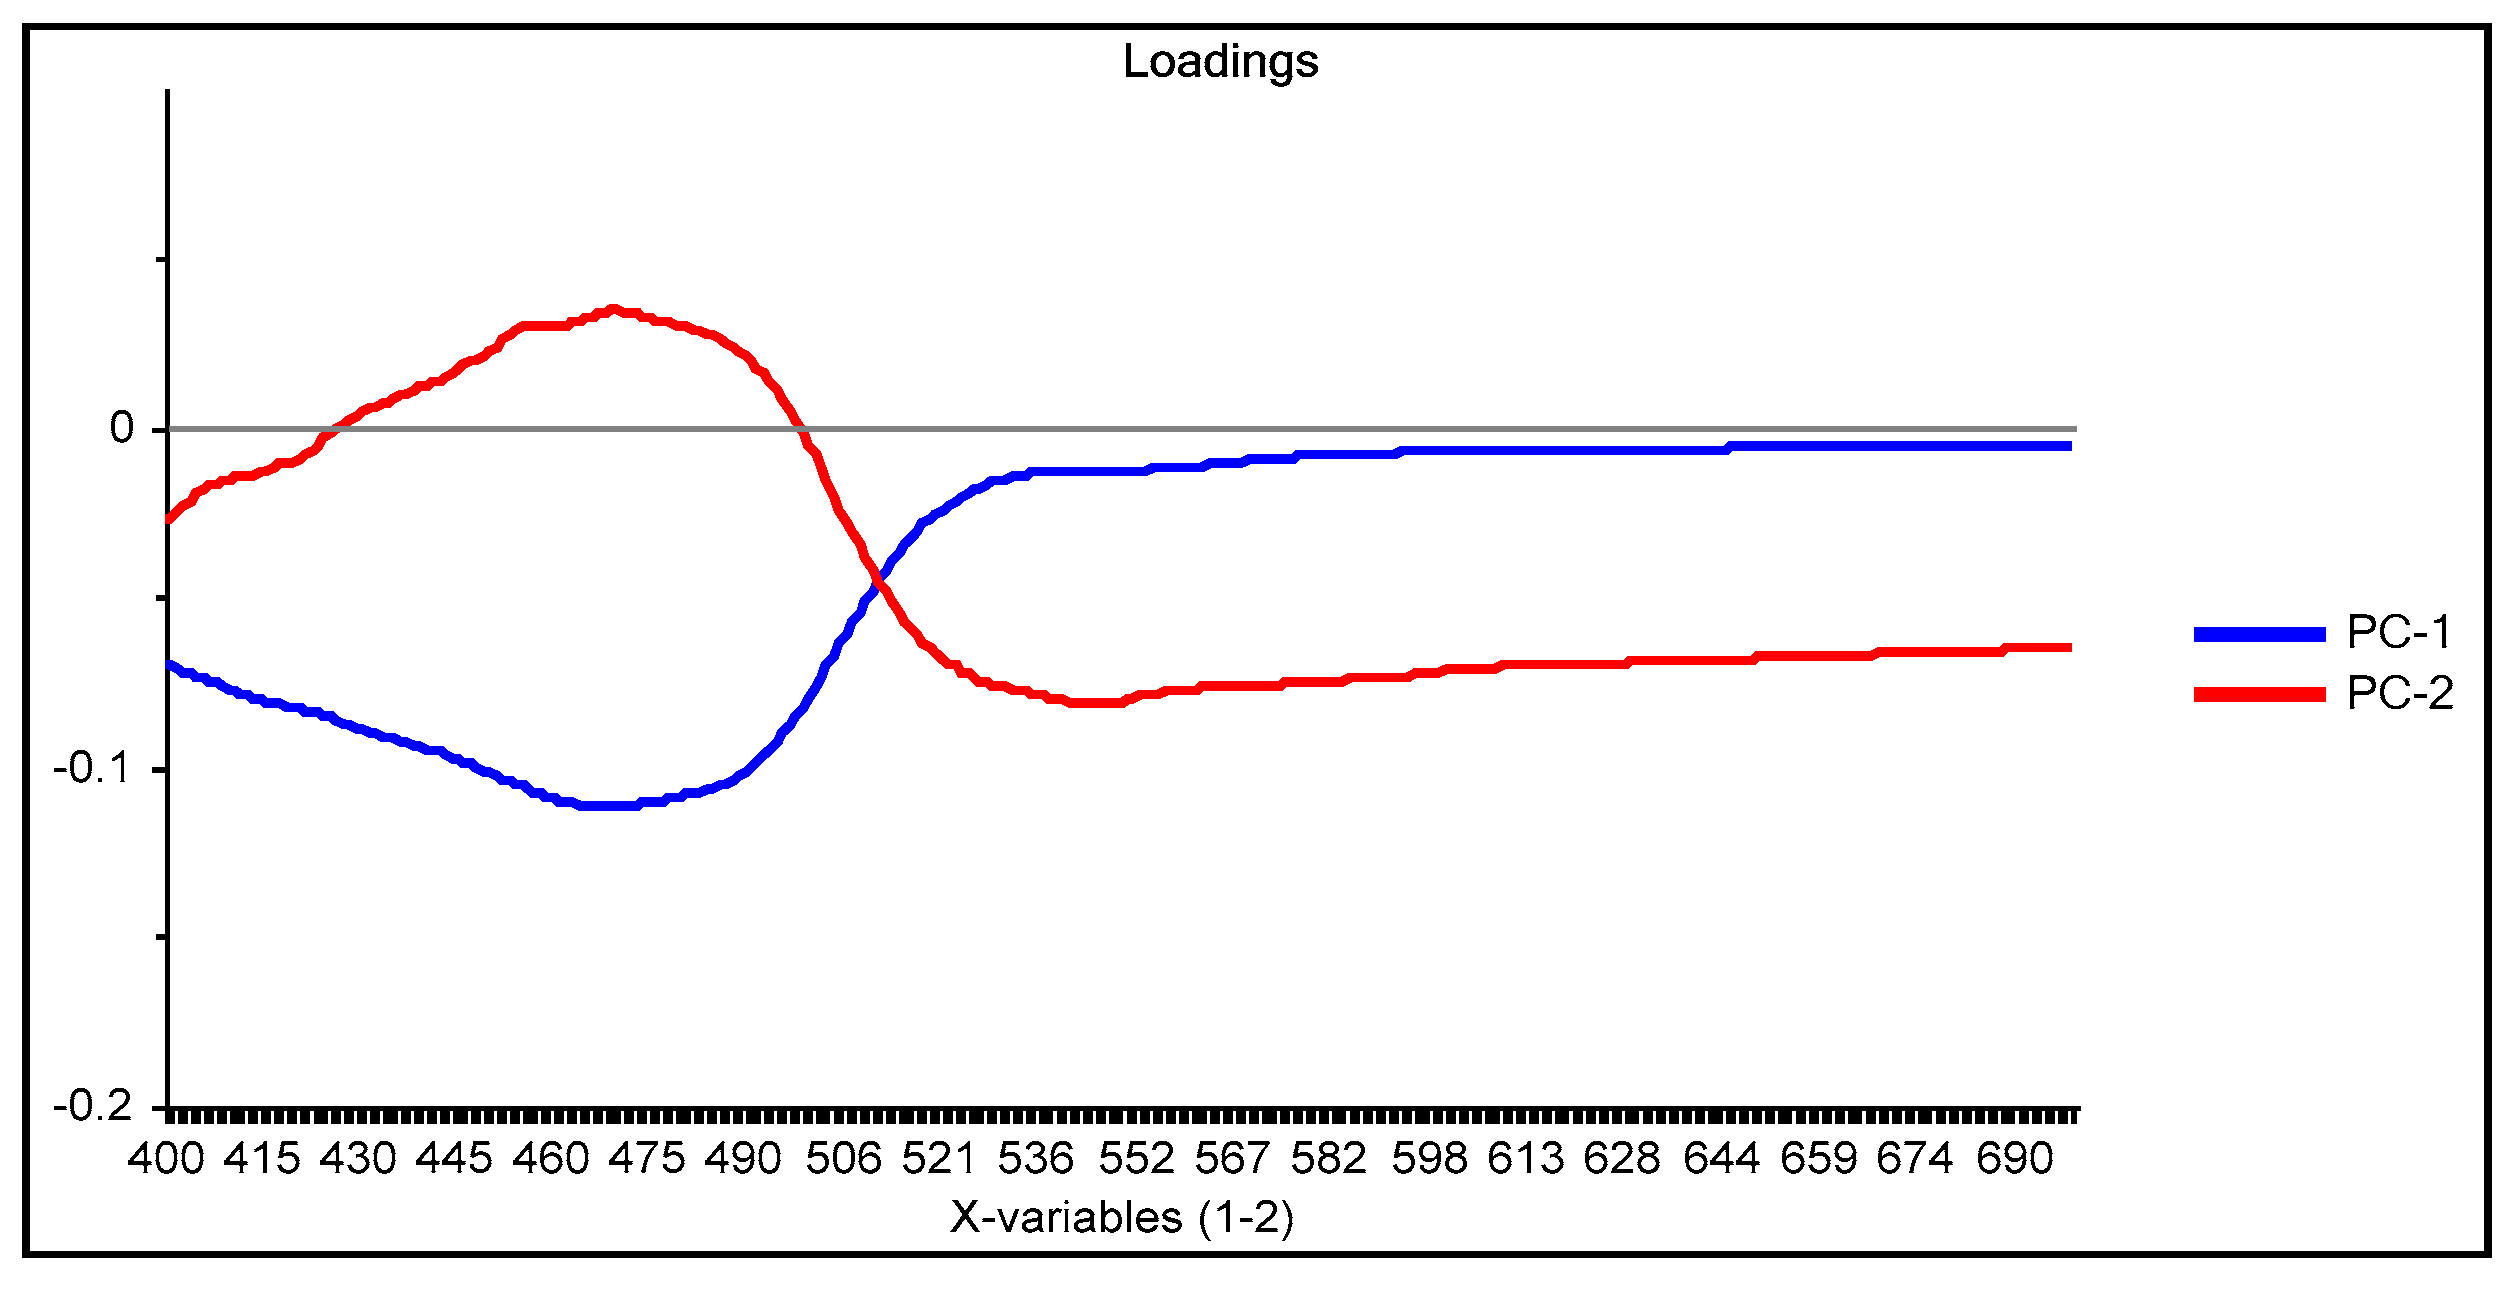
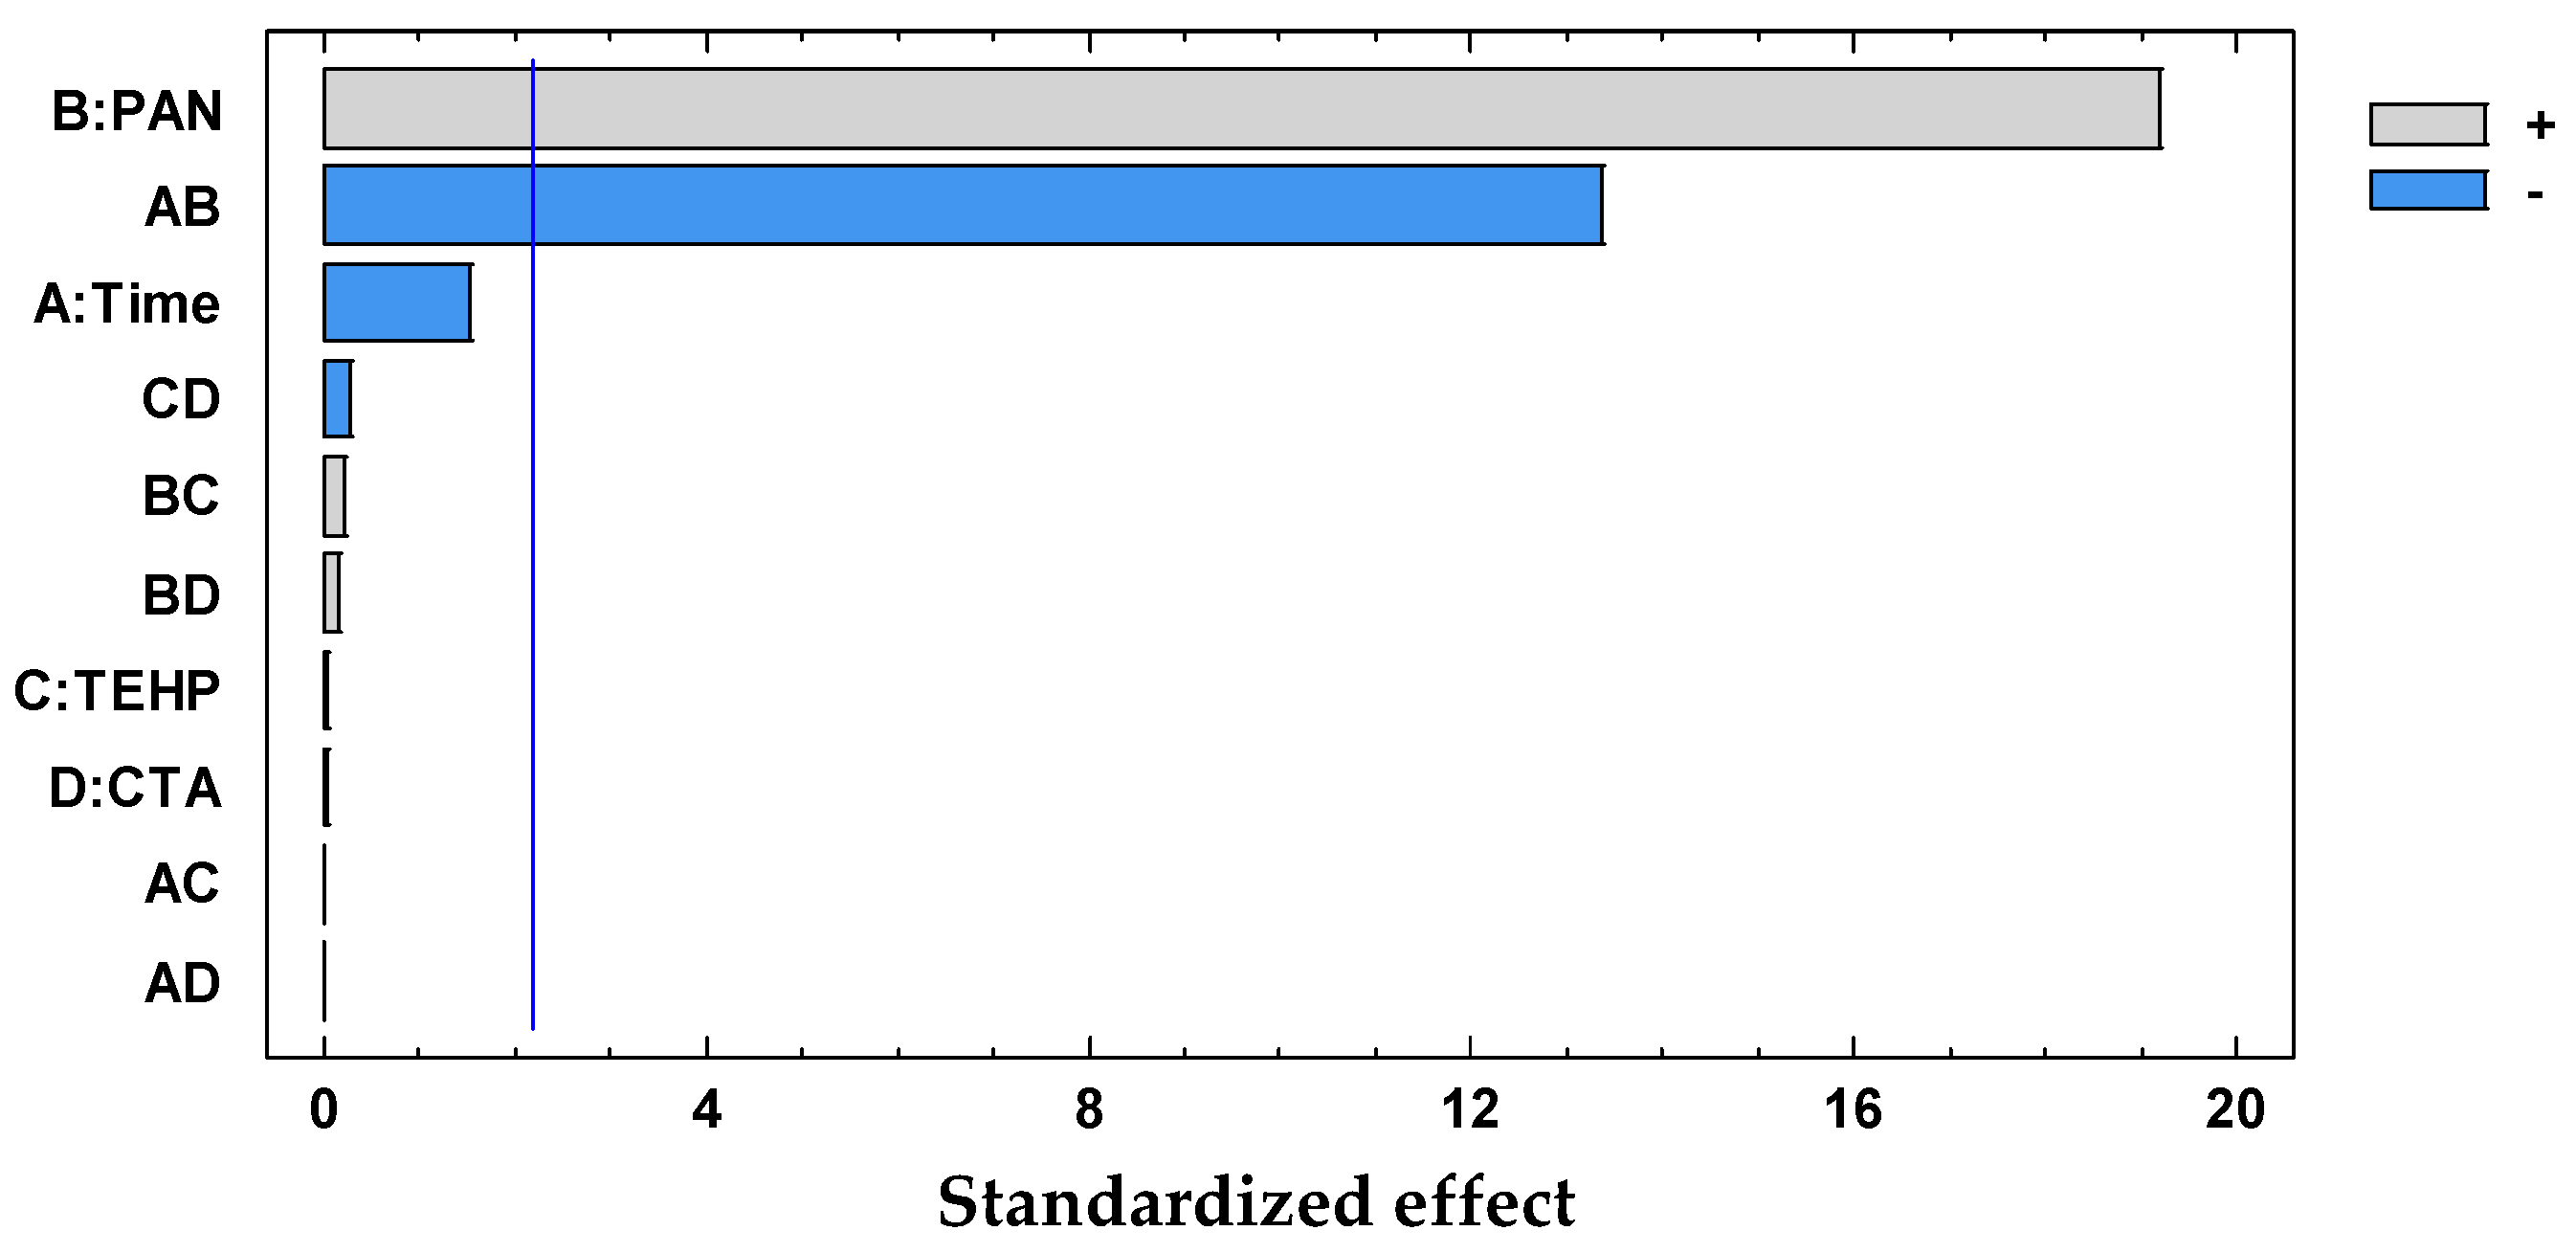

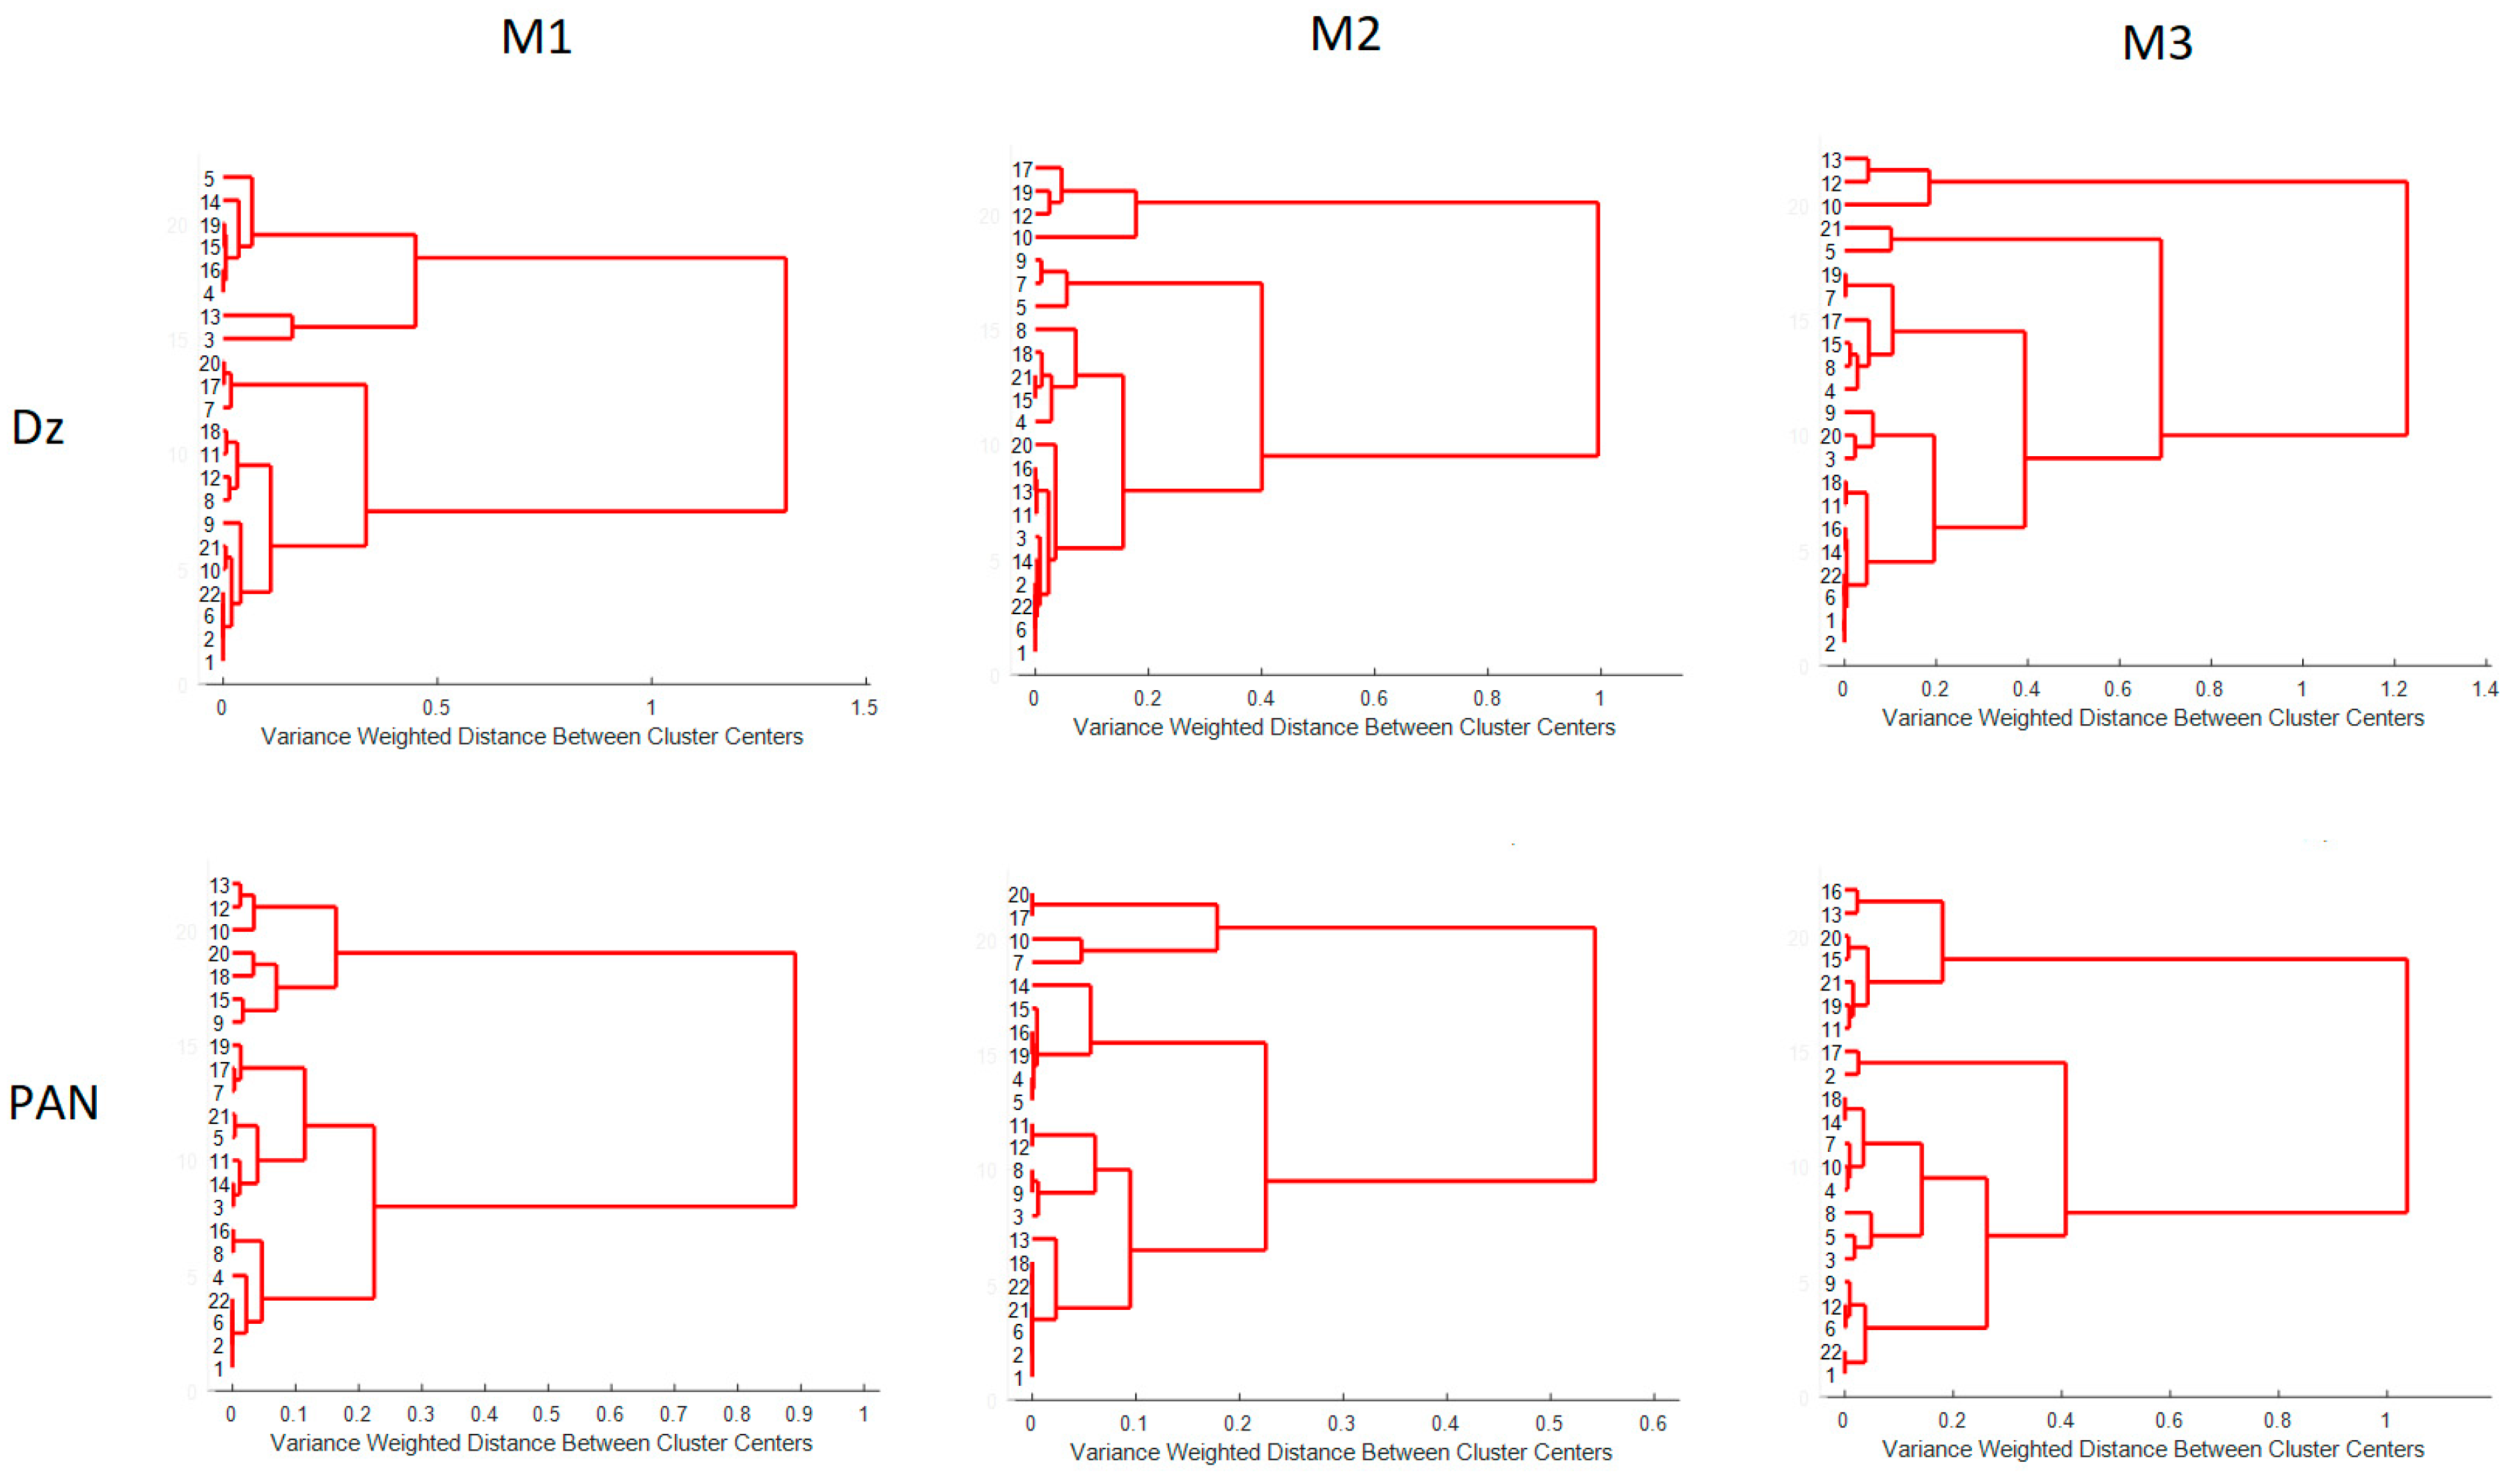
| Experimental Runs | Factor A | Factor B | Factor C | Factor D |
|---|---|---|---|---|
| Time | Chromophore | Plasticizer | CTA | |
| 1 | 0 (50 min) | 0 (0.53 mg) | 0 (62.5 mg) | 0 (62.5 mg) |
| 2 | 1 (80 min) | 0 (0.53 mg) | 0 (62.5 mg) | 0 (62.5 mg) |
| 3 | 0.5 (65 min) | 0.866 (1 mg) | 0 (62.5 mg) | 0 (62.5 mg) |
| 4 | 0.5 (65 min) | 0.289 (0.68 mg) | 0.817 (100 mg) | 0 (62.5 mg) |
| 5 | 0.5 (65 min) | 0.289 (0.68 mg) | 0.204 (71.86 mg) | 0.791 (100 mg) |
| 6 | −1 (20 min) | 0 (0.53 mg) | 0 (62.5 mg) | 0 (62.5 mg) |
| 7 | −0.5 (35 min) | −0.866 (0.060 mg) | 0 (62.5 mg) | 0 (62.5 mg) |
| 8 | −0.5 (35 min) | −0.289 (0.37 mg) | −0.817 (25.0 mg) | 0 (62.5 mg) |
| 9 | −0.5 (35 min) | −0.289 (0.37 mg) | −0.204 (53.13 mg) | −0.791 (25 mg) |
| 10 | 0.5 (65 min) | −0.866 (0.06 mg) | 0 (62.5 mg) | 0 (62.5 mg) |
| 11 | 0.5 (65 min) | −0.289 (0.37 mg) | −0.817 (25 mg) | 0 (62.5 mg) |
| 12 | 0.5 (65 min) | −0.289 (0.37 mg) | −0.204 (53.13 mg) | −0.791 (25 mg) |
| 13 | −0.5 (35 min) | 0.866 (1.0 mg) | 0 (62.5 mg) | 0 (62.5 mg) |
| 14 | 0 (50 min) | 0.577 (0.84 mg) | −0.817 (25 mg) | 0 (62.5 mg) |
| 15 | 0 (50 min) | 0.577 (0.84 mg) | −0.204 (53.13 mg) | −0.791 (25 mg) |
| 16 | −0.5 (35 min) | 0.289 (0.68 mg) | 0.817 (100 mg) | 0 (62.5 mg) |
| 17 | 0 (50 min) | −0.577 (0.21 mg) | 0.817 (100 mg) | 0 (62.5 mg) |
| 18 | 0 (50 min) | 0 (0.53 mg) | 0.613 (90.63 mg) | −0.791 (25 mg) |
| 19 | −0.5 (35 min) | 0.289 (0.68 mg) | 0.204 (71.86 mg) | 0.791 (100 mg) |
| 20 | 0 (50 min) | −0.577 (0.21 mg) | 0.204 (71.86 mg) | 0.791 (100 mg) |
| 21 | 0 (50 min) | 0 (0.53 mg) | −0.613 (34.36 mg) | 0.791 (100 mg) |
| Source | Sum of Squares | Df | Mean Square | F-Ratio | p-Value |
|---|---|---|---|---|---|
| A:Time | 0.0000836037 | 1 | 0.0000836037 | 0.33 | 0.5759 |
| B:Dz | 0.0460006 | 1 | 0.0460006 | 182.85 | 0.0000 |
| C:2NPOE | 0.0000018768 | 1 | 0.0000018768 | 0.01 | 0.9327 |
| D:CTA | 0.00000643161 | 1 | 0.00000643161 | 0.03 | 0.8759 |
| AB | 0.0 | 1 | 0.0 | 0.00 | 1.0000 |
| AC | 0.0 | 1 | 0.0 | 0.00 | 1.0000 |
| AD | 0.0309215 | 1 | 0.0309215 | 122.91 | 0.0000 |
| BC | 0.0001458 | 1 | 0.0001458 | 0.58 | 0.4625 |
| BD | 1.26293 × 10⁻⁷ | 1 | 1.26293 × 10⁻⁷ | 0.00 | 0.9825 |
| CD | 0.000213563 | 1 | 0.000213563 | 0.85 | 0.3766 |
| Total Error | 0.00276736 | 11 | 0.000251578 | ||
| Total (corrected) | 0.0840181 | 21 | |||
| R2 | 96.7062% | ||||
| Adj − R2 | 93.7119% | ||||
| Standard error | 0.0158612 | ||||
| Std. Dev | 0.00881342 |
| Metal | Optimal Composition | |||
|---|---|---|---|---|
| Time | PAN | THEP | CTA | |
| Hg2+ | 0.5 (65 min) | −0.289 (0.37 mg) | −0.204 (53.13 mg) | −0.791 (25 mg) |
| Pb2+ | 0 (50 min) | −0.577 (0.21 mg) | 0.204 (71.86 mg) | 0.791 (100 mg) |
| Cd2+ | −0.5 (35 min) | −0.866 (0.600 mg) | 0 (62.5 mg) | 0 (62.5 mg) |
| Source | Sum of Squares | Df | Mean Square | F-Ratio | p-Value |
|---|---|---|---|---|---|
| A:Time | 0.000200484 | 1 | 0.000200484 | 0.30 | 0.5941 |
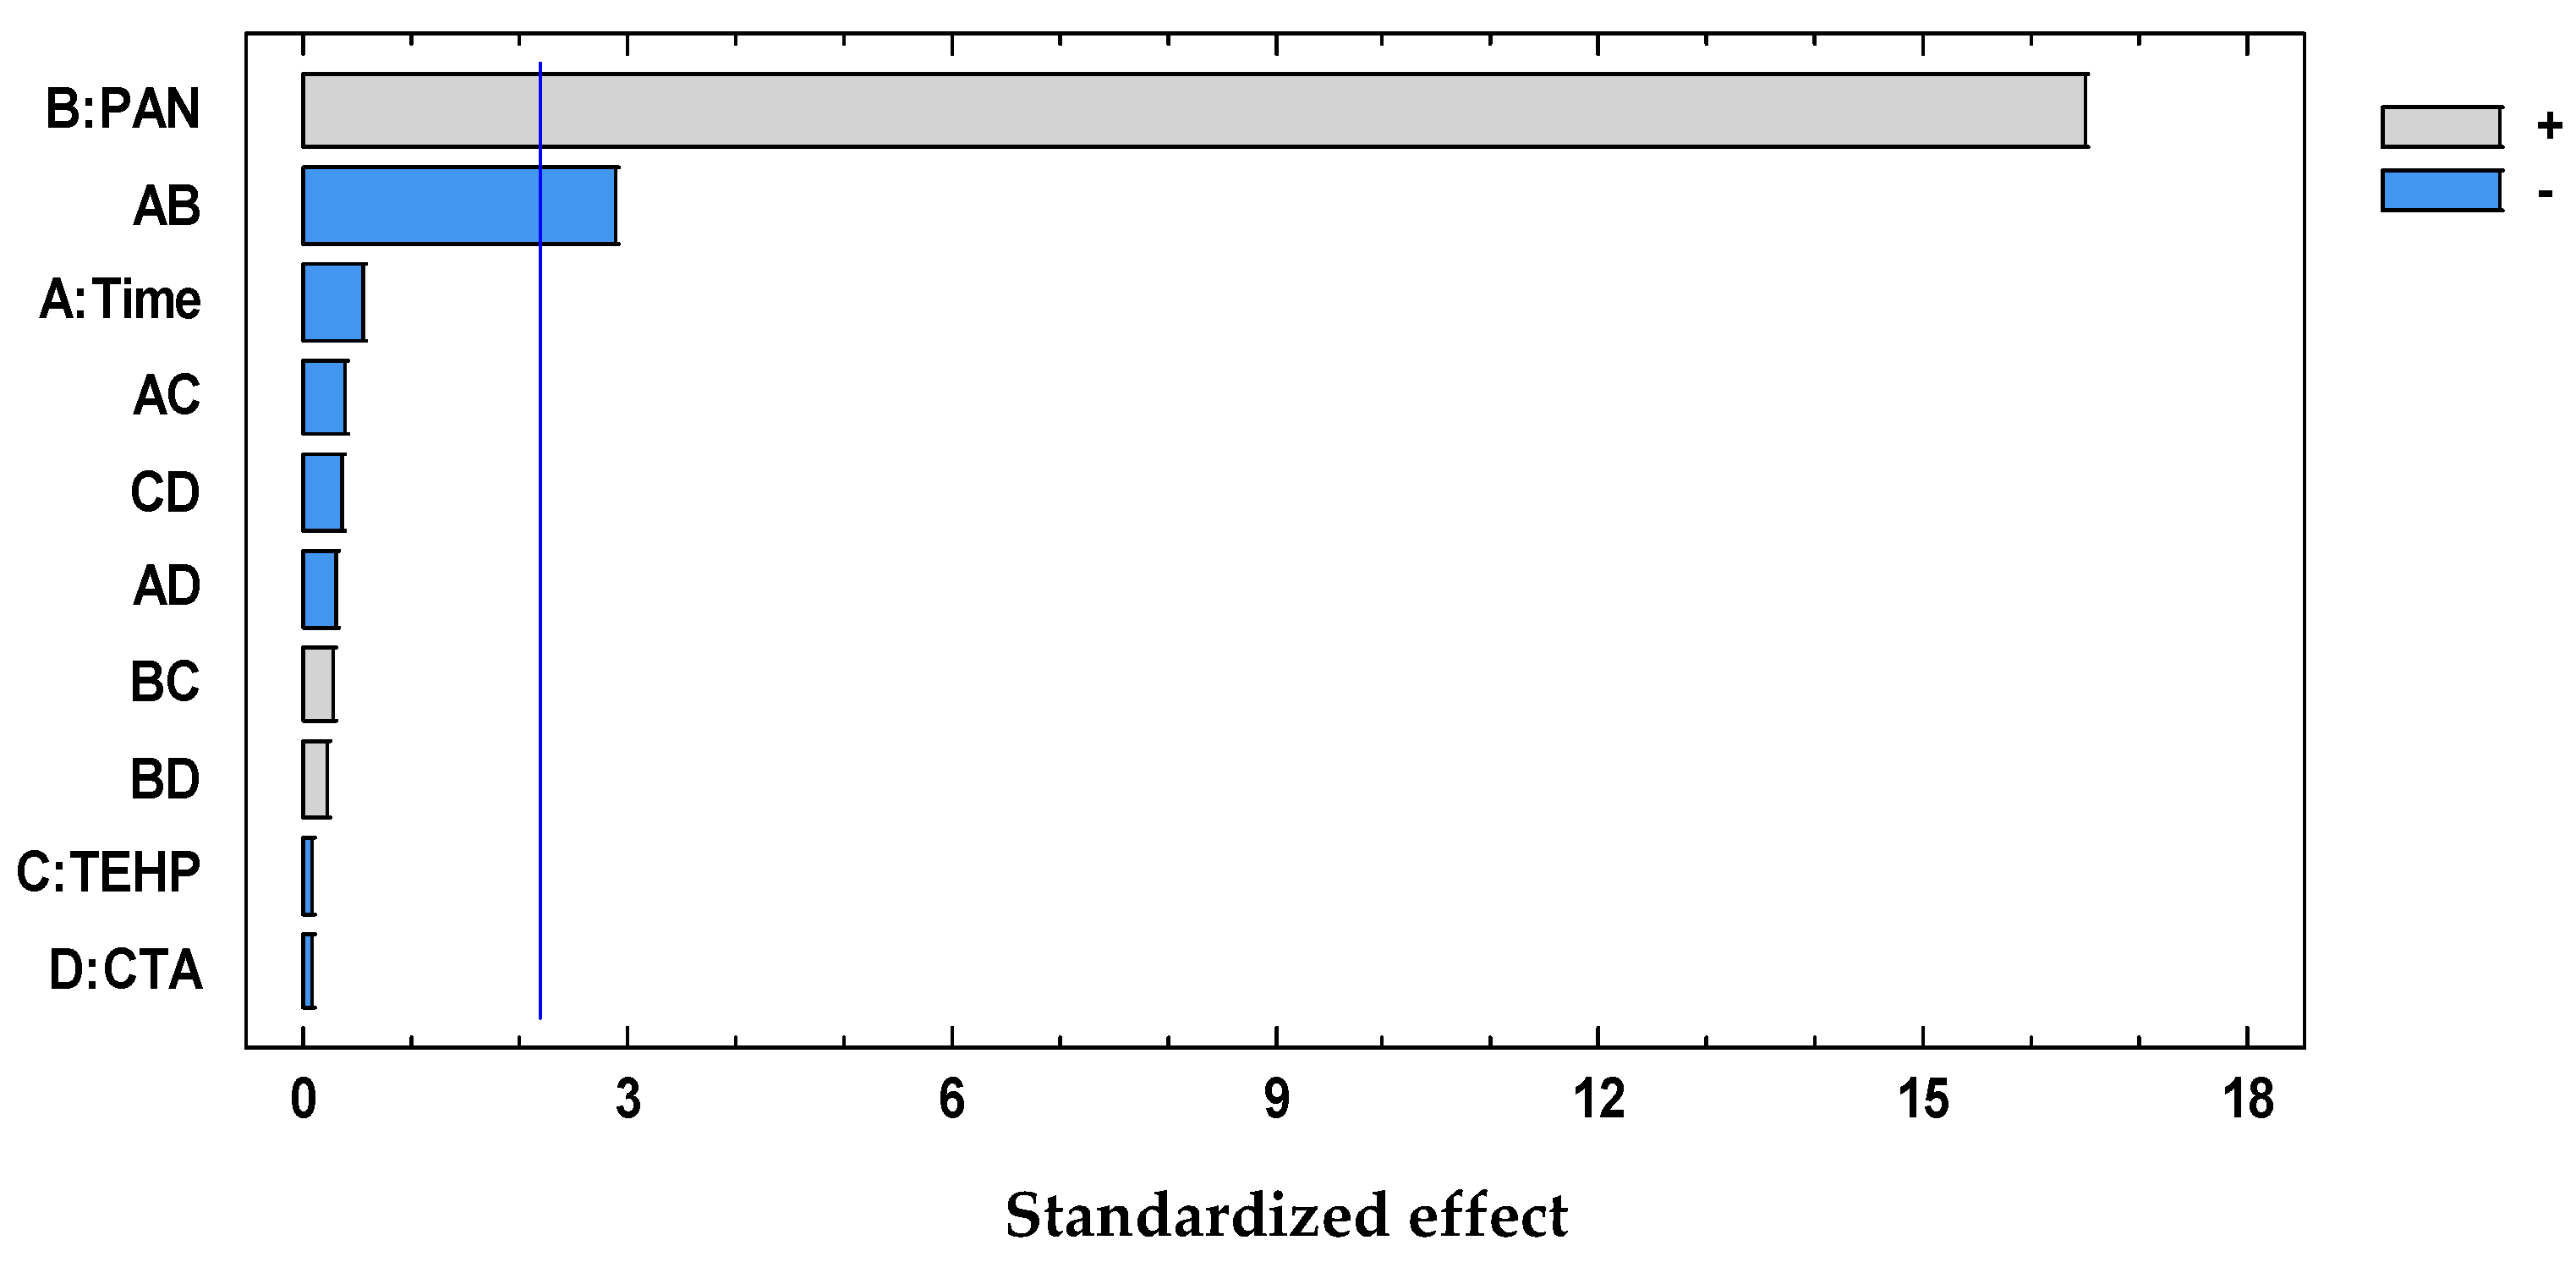
| B:PAN | 0.181549 | 1 | 0.181549 | 272.70 | 0.0000 |
| C:THEP | 0.00000417595 | 1 | 0.00000417595 | 0.01 | 0.9383 |
| D:CTA | 0.00000250761 | 1 | 0.00000250761 | 0.00 | 0.9522 |
| AB | 0.00553834 | 1 | 0.00553834 | 8.32 | 0.0149 |
| AC | 0.000100039 | 1 | 0.000100039 | 0.15 | 0.7057 |
| AD | 0.0000556332 | 1 | 0.0000556332 | 0.08 | 0.7779 |
| BC | 0.0000519484 | 1 | 0.0000519484 | 0.08 | 0.7852 |
| BD | 0.0000275653 | 1 | 0.0000275653 | 0.04 | 0.8425 |
| CD | 0.0000784508 | 1 | 0.0000784508 | 0.12 | 0.7379 |
| Total Error | 0.00732311 | 11 | 0.000665738 | ||
| Total (corrected) | 0.197303 | 21 | |||
| R2 | 96.2884% | ||||
| Adj − R2 | 92.9142% | ||||
| Standard error | 0.0258019 | ||||
| Std. Dev | 0.0135246 |
| Metal | Wavelength (nm) | Optimal Composition * | |
|---|---|---|---|
| Free Chromophore (PAN) | Metal Complex | ||
| Hg2+ | 465 | 556 | 8 |
| Pb2+ | 465 | 556 | 13 |
| Cd2+ | 465 | 550 | 14 |
| Source | Sum of Squares | Df | Mean Square | F-Ratio | p-Value |
|---|---|---|---|---|---|
| A:Time | 0.00035041 | 1 | 0.00035041 | 2.30 | 0.1573 |
| B:PAN | 0.0560517 | 1 | 0.0560517 | 368.35 | 0.0000 |
| C:THEP | 2.38862 × 10⁻⁷ | 1 | 2.38862 × 10⁻⁷ | 0.00 | 0.9691 |
| D:CTA | 1.43434 × 10⁻⁷ | 1 | 1.43434 × 10⁻⁷ | 0.00 | 0.9761 |
| AB | 0.0271562 | 1 | 0.0271562 | 178.46 | 0.0000 |
| AC | 3.5837 × 10⁻⁸ | 1 | 3.5837 × 10⁻⁸ | 0.00 | 0.9880 |
| AD | 1.99296 × 10⁻⁸ | 1 | 1.99296 × 10⁻⁸ | 0.00 | 0.9911 |
| BC | 0.00000700214 | 1 | 0.00000700214 | 0.05 | 0.8341 |
| BD | 0.00000371548 | 1 | 0.00000371548 | 0.02 | 0.8787 |
| CD | 0.0000103725 | 1 | 0.0000103725 | 0.07 | 0.7989 |
| Total Error | 0.00167386 | 11 | 0.000152169 | ||
| Total (corrected) | 0.0913495 | 21 | |||
| R2 | 98.1676% | ||||
| Adj − R2 | 96.5018% | ||||
| Standard error | 0.012357 | ||||
| Std. Dev | 0.00509949 |
| Metal | Optimal Composition | |||||||
|---|---|---|---|---|---|---|---|---|
| Time | Dithizone | NPOE | CTA | Time | PAN | THEP | CTA | |
| Hg2+ | 65 min | 0.68 mg | 71.86 mg | 100 mg | 50 min | 0.53 mg | 34.36 mg | 100 mg |
| Cd2+ | 35 min | 0.60 mg | 62.5 mg | 62.5 mg | 35 min | 1.0 mg | 62.5 mg | 62.5 mg |
| Pb2+ | 65 min | 0.68 mg | 71.86 mg | 100 mg | 35 min | 0.6 mg | 62.5 mg | 62.5 mg |
| System | Optimal Experiment | Appearance of the Membrane | Spectra | |
|---|---|---|---|---|
| Before | After | |||
| PAN + Hg | 21 |  |  |  |
| PAN + Cd | 13 |  |  |  |
| PAN + Pb | 7 |  |  | 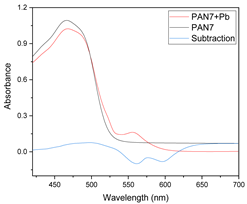 |
| Dz + Hg | 5 |  |  |  |
| Dz + Cd | 7 |  |  | 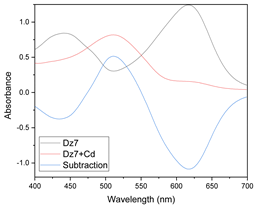 |
| Dz + Pb | 5 |  |  |  |
Publisher’s Note: MDPI stays neutral with regard to jurisdictional claims in published maps and institutional affiliations. |
© 2021 by the authors. Licensee MDPI, Basel, Switzerland. This article is an open access article distributed under the terms and conditions of the Creative Commons Attribution (CC BY) license (https://creativecommons.org/licenses/by/4.0/).
Share and Cite
García-Beleño, J.; Rodríguez de San Miguel, E. Integration of Response Surface Methodology (RSM) and Principal Component Analysis (PCA) as an Optimization Tool for Polymer Inclusion Membrane Based-Optodes Designed for Hg(II), Cd(II), and Pb(II). Membranes 2021, 11, 288. https://doi.org/10.3390/membranes11040288
García-Beleño J, Rodríguez de San Miguel E. Integration of Response Surface Methodology (RSM) and Principal Component Analysis (PCA) as an Optimization Tool for Polymer Inclusion Membrane Based-Optodes Designed for Hg(II), Cd(II), and Pb(II). Membranes. 2021; 11(4):288. https://doi.org/10.3390/membranes11040288
Chicago/Turabian StyleGarcía-Beleño, Jeniffer, and Eduardo Rodríguez de San Miguel. 2021. "Integration of Response Surface Methodology (RSM) and Principal Component Analysis (PCA) as an Optimization Tool for Polymer Inclusion Membrane Based-Optodes Designed for Hg(II), Cd(II), and Pb(II)" Membranes 11, no. 4: 288. https://doi.org/10.3390/membranes11040288
APA StyleGarcía-Beleño, J., & Rodríguez de San Miguel, E. (2021). Integration of Response Surface Methodology (RSM) and Principal Component Analysis (PCA) as an Optimization Tool for Polymer Inclusion Membrane Based-Optodes Designed for Hg(II), Cd(II), and Pb(II). Membranes, 11(4), 288. https://doi.org/10.3390/membranes11040288


