
Optimization of MCM-41 Mesoporous Material Mixed Matrix Polyethersulfone Membrane for Dye Removal


Abstract
:1. Introduction
2. Experimental Work
2.1. Materials
2.2. Preparation of Composite Membranes
2.3. Membranes Characteristics
3. Results and Discussion
4. Optimization and Modeling Process
4.1. Optimization of Operating Parameters
4.2. ANOVA Models
4.3. Evaluating and Analyzing Results
4.3.1. Effect Plot
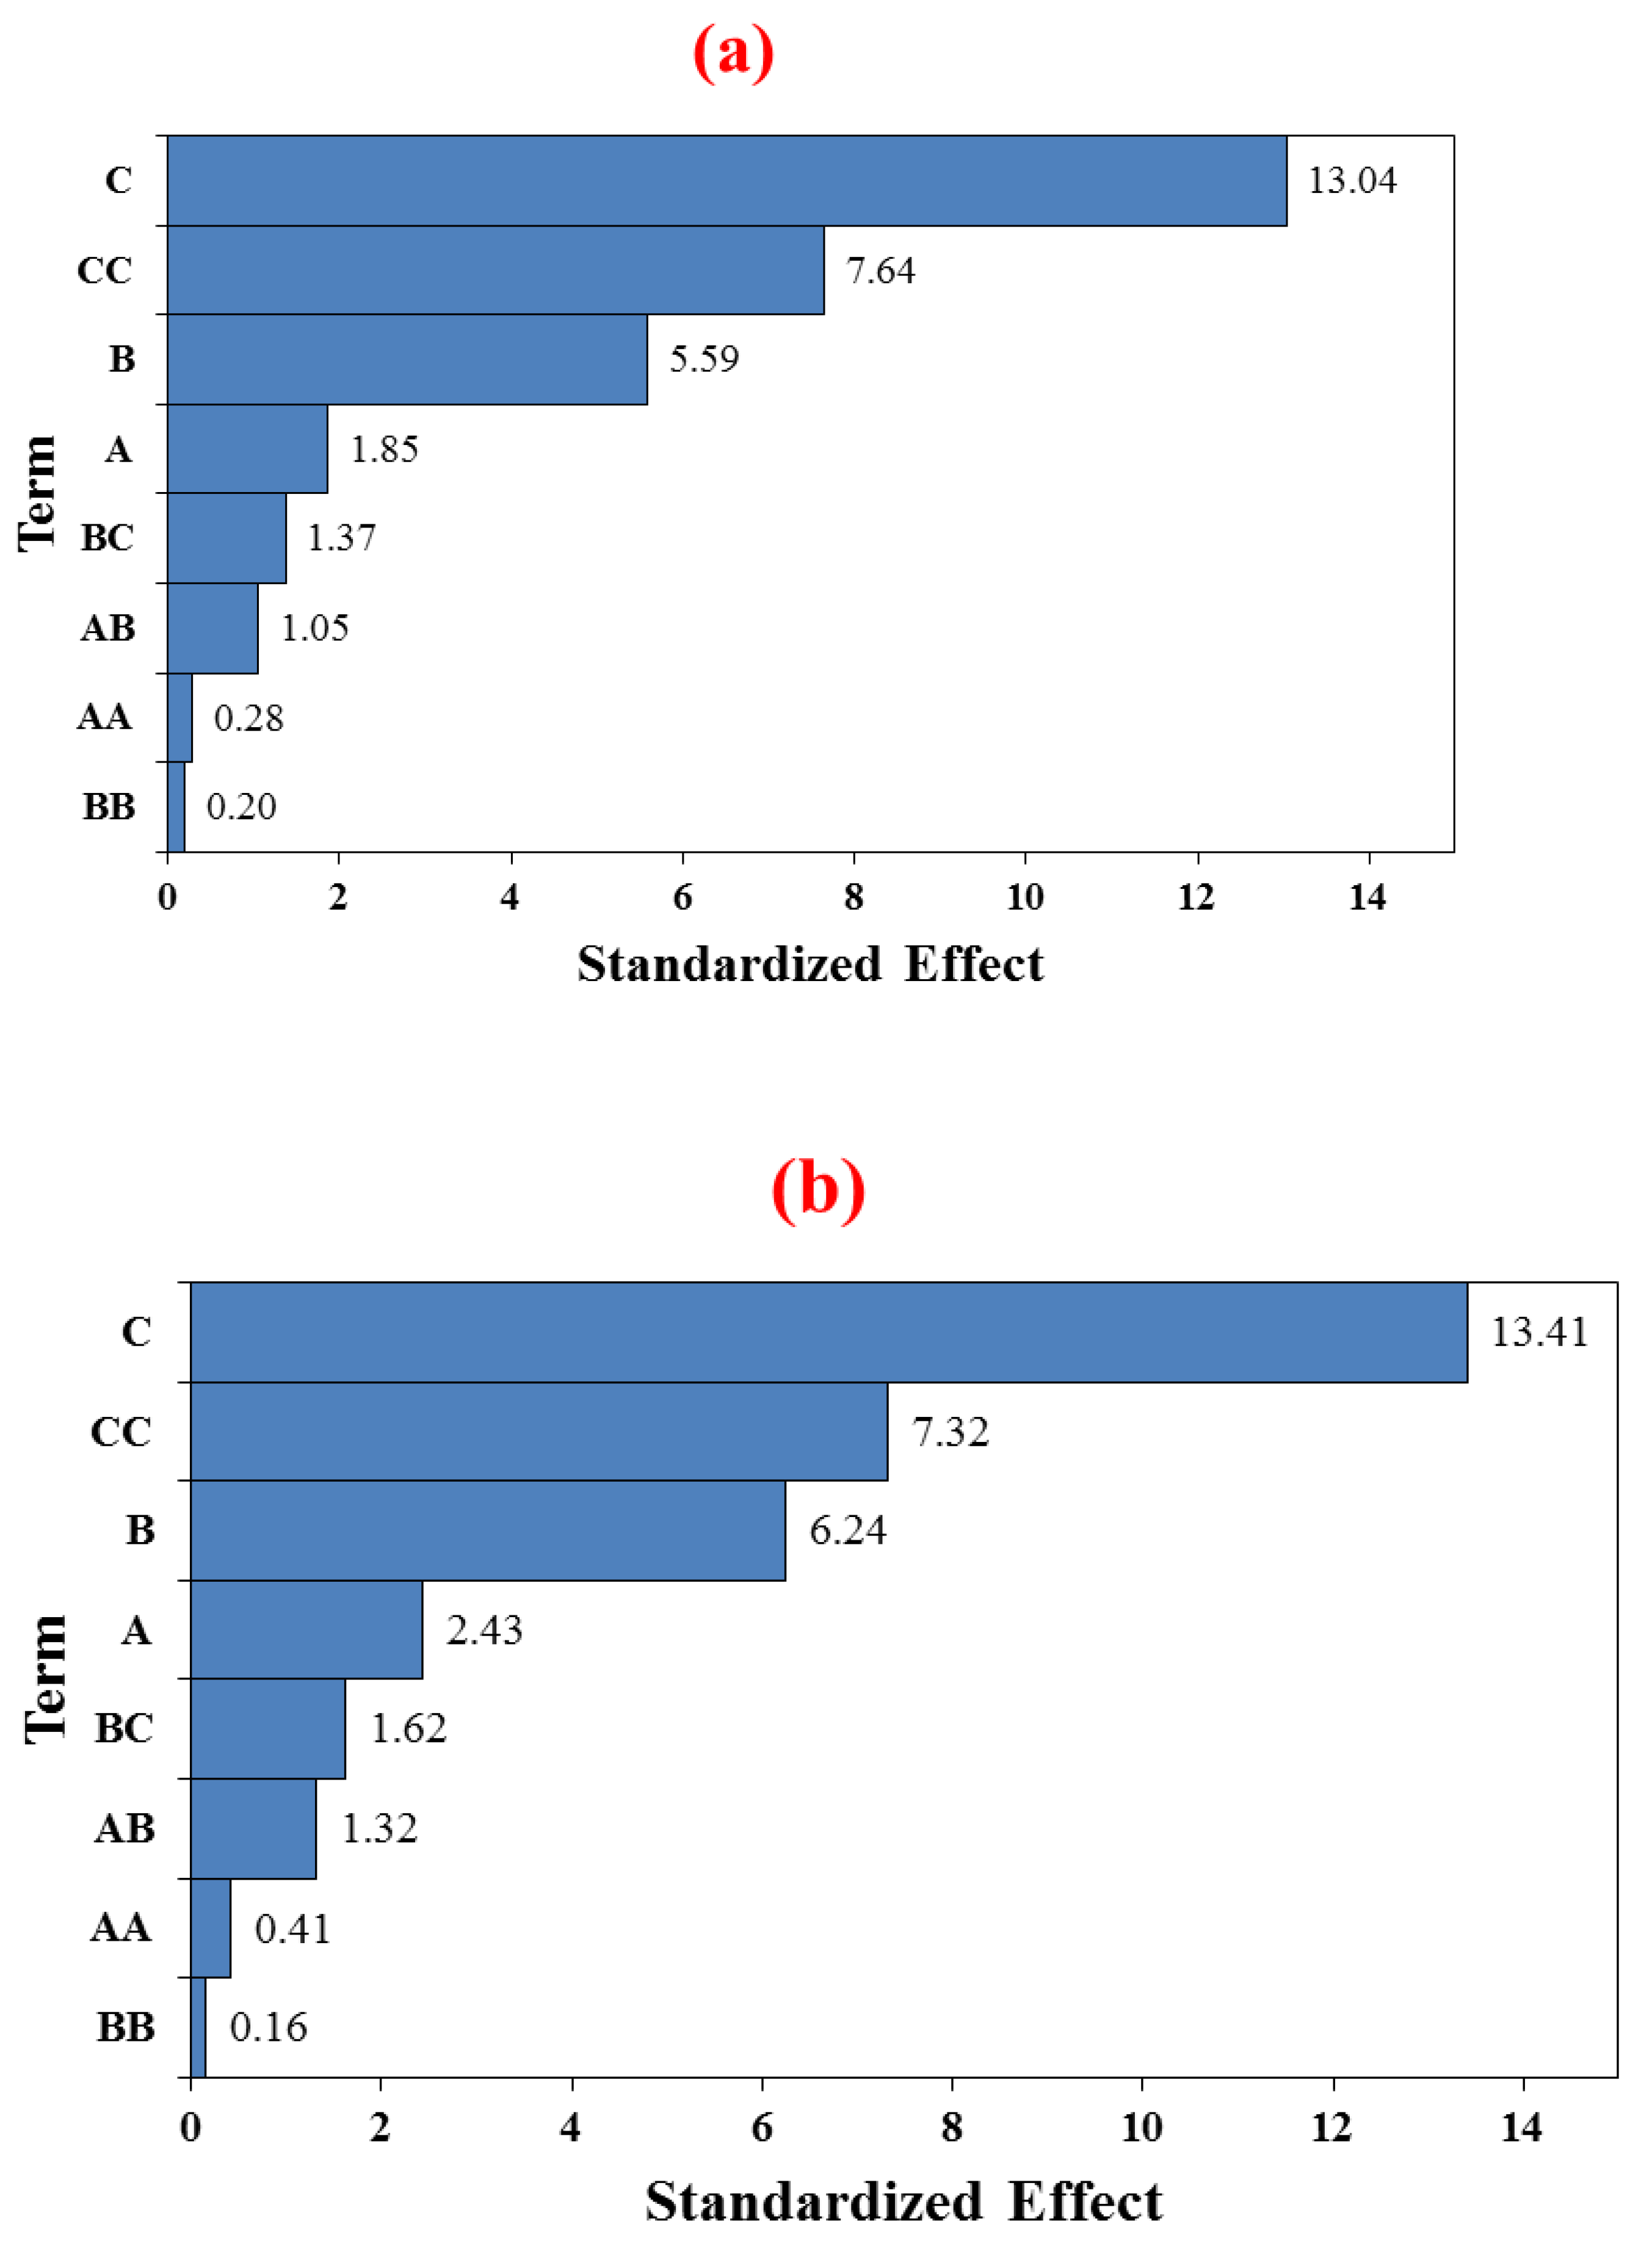
4.3.1.1. Pareto Chart
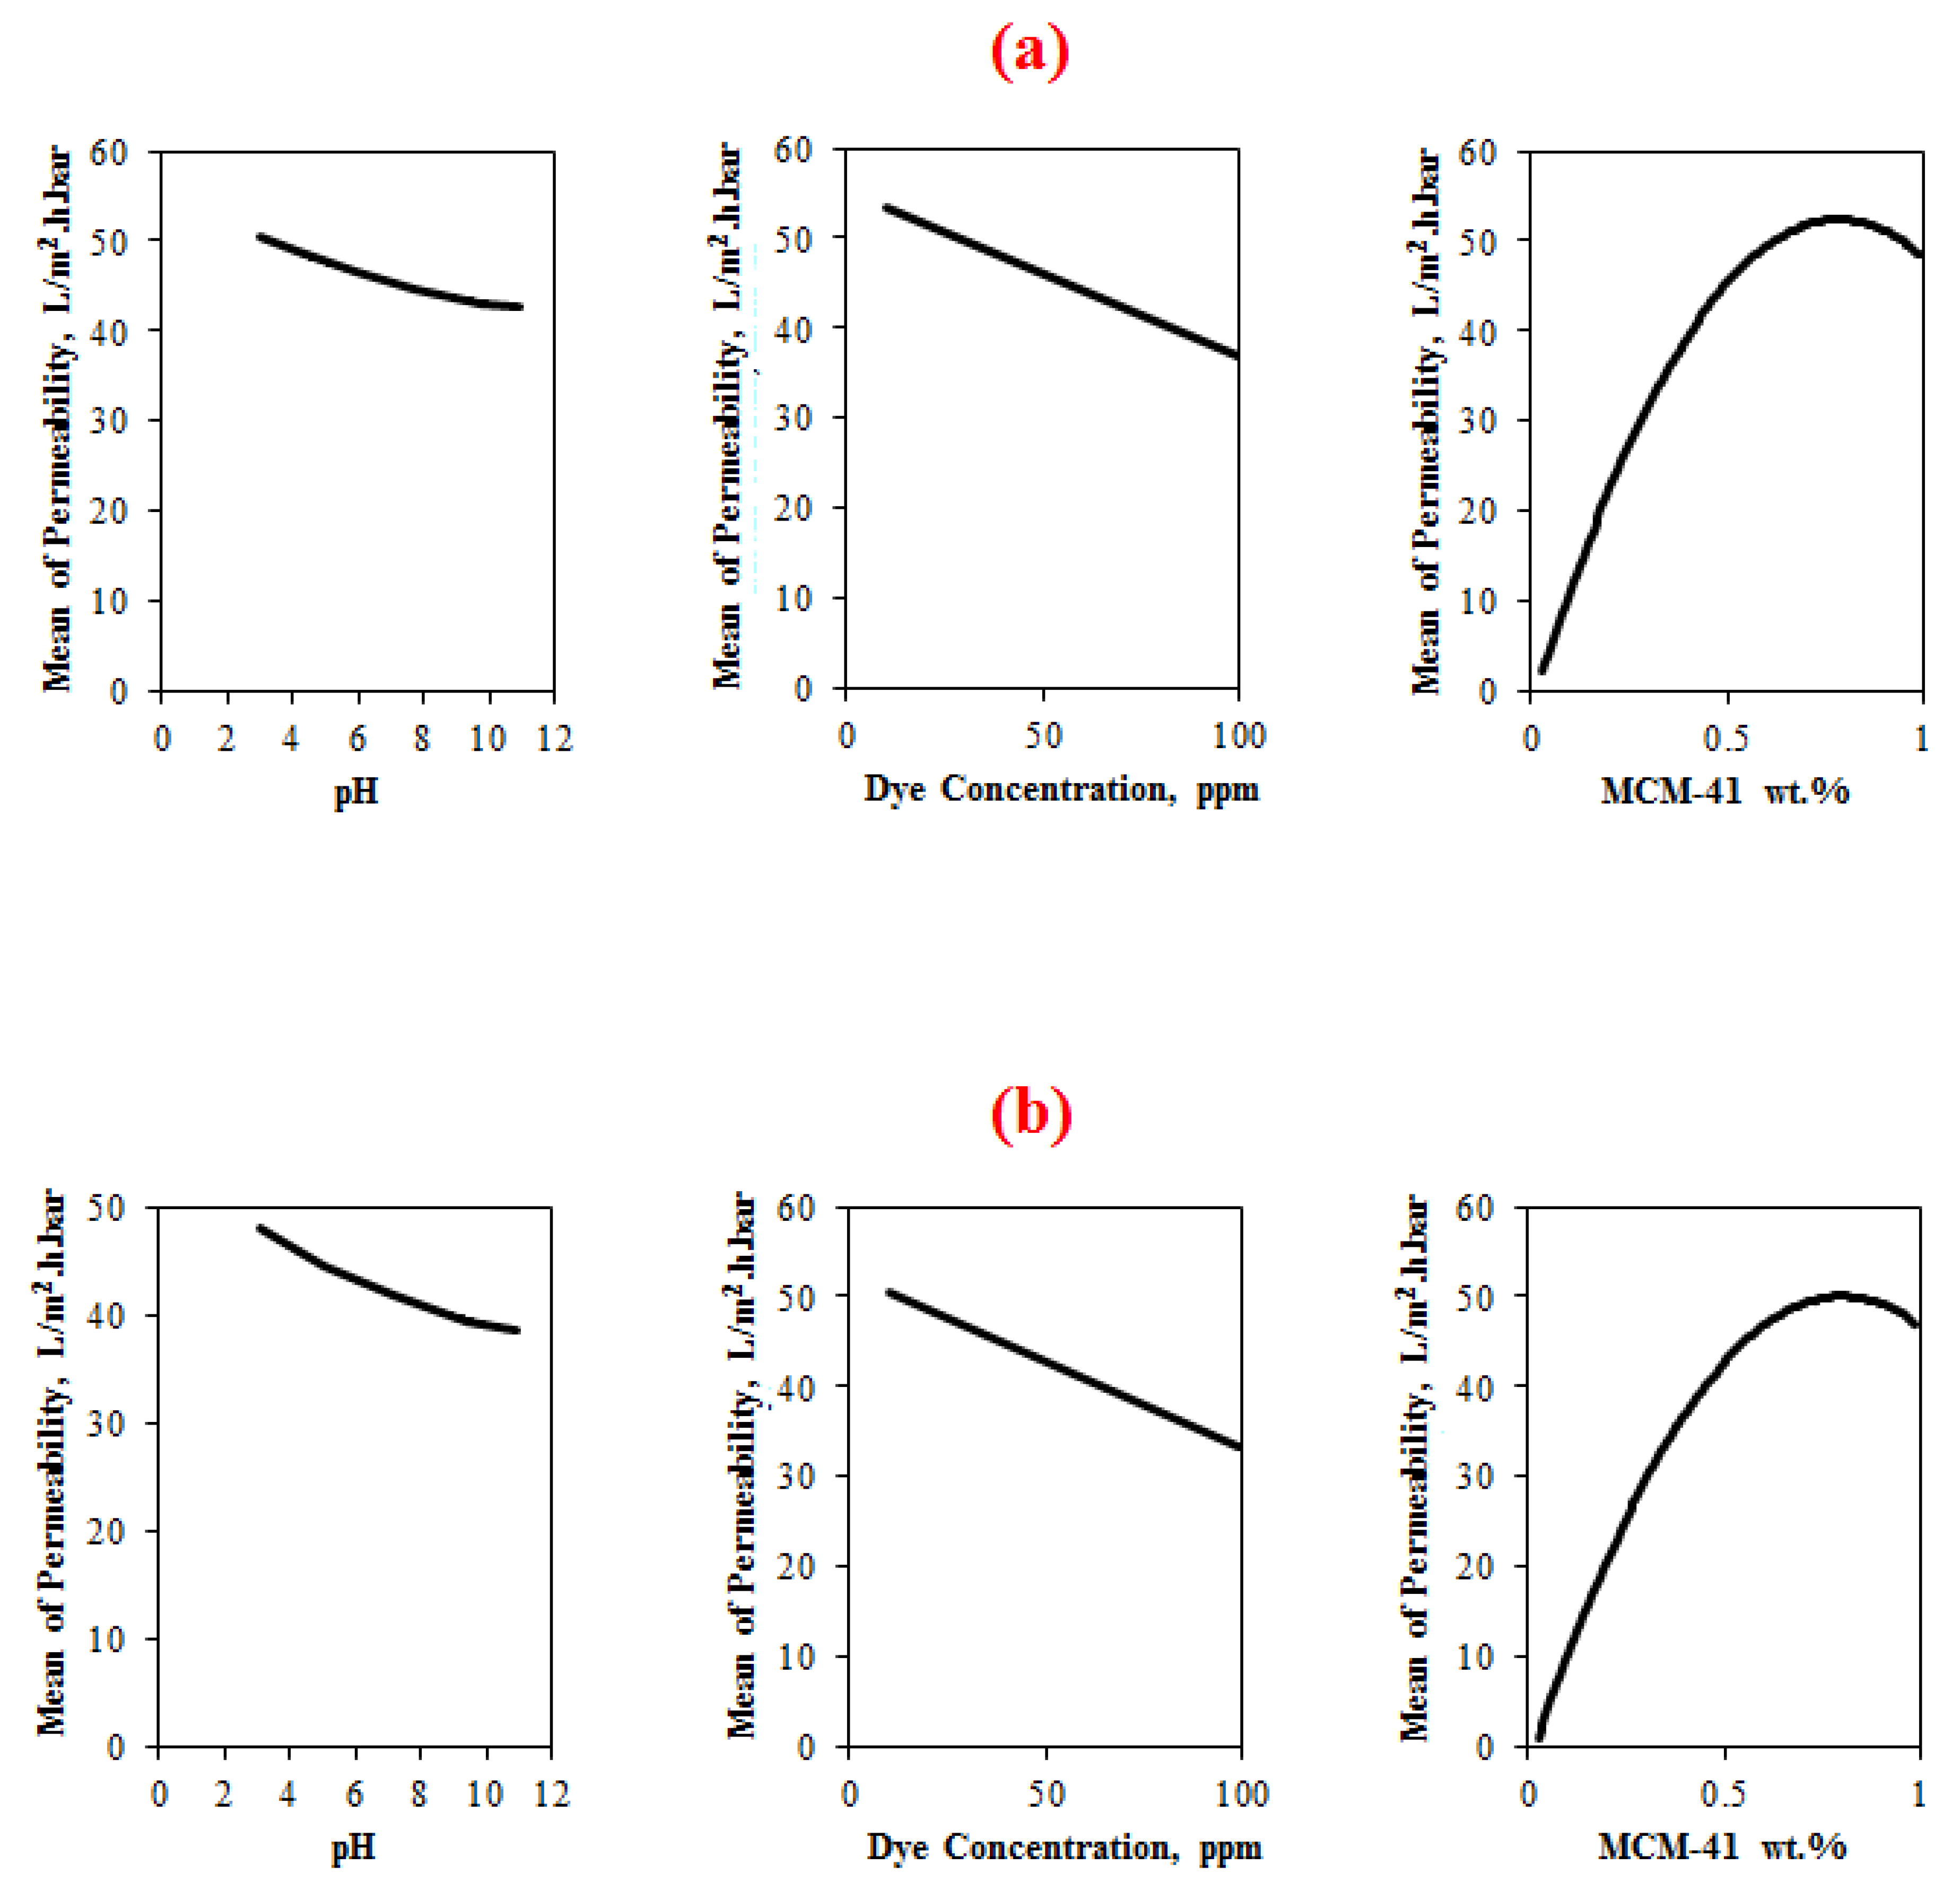
4.3.1.2. Main Effects Plot
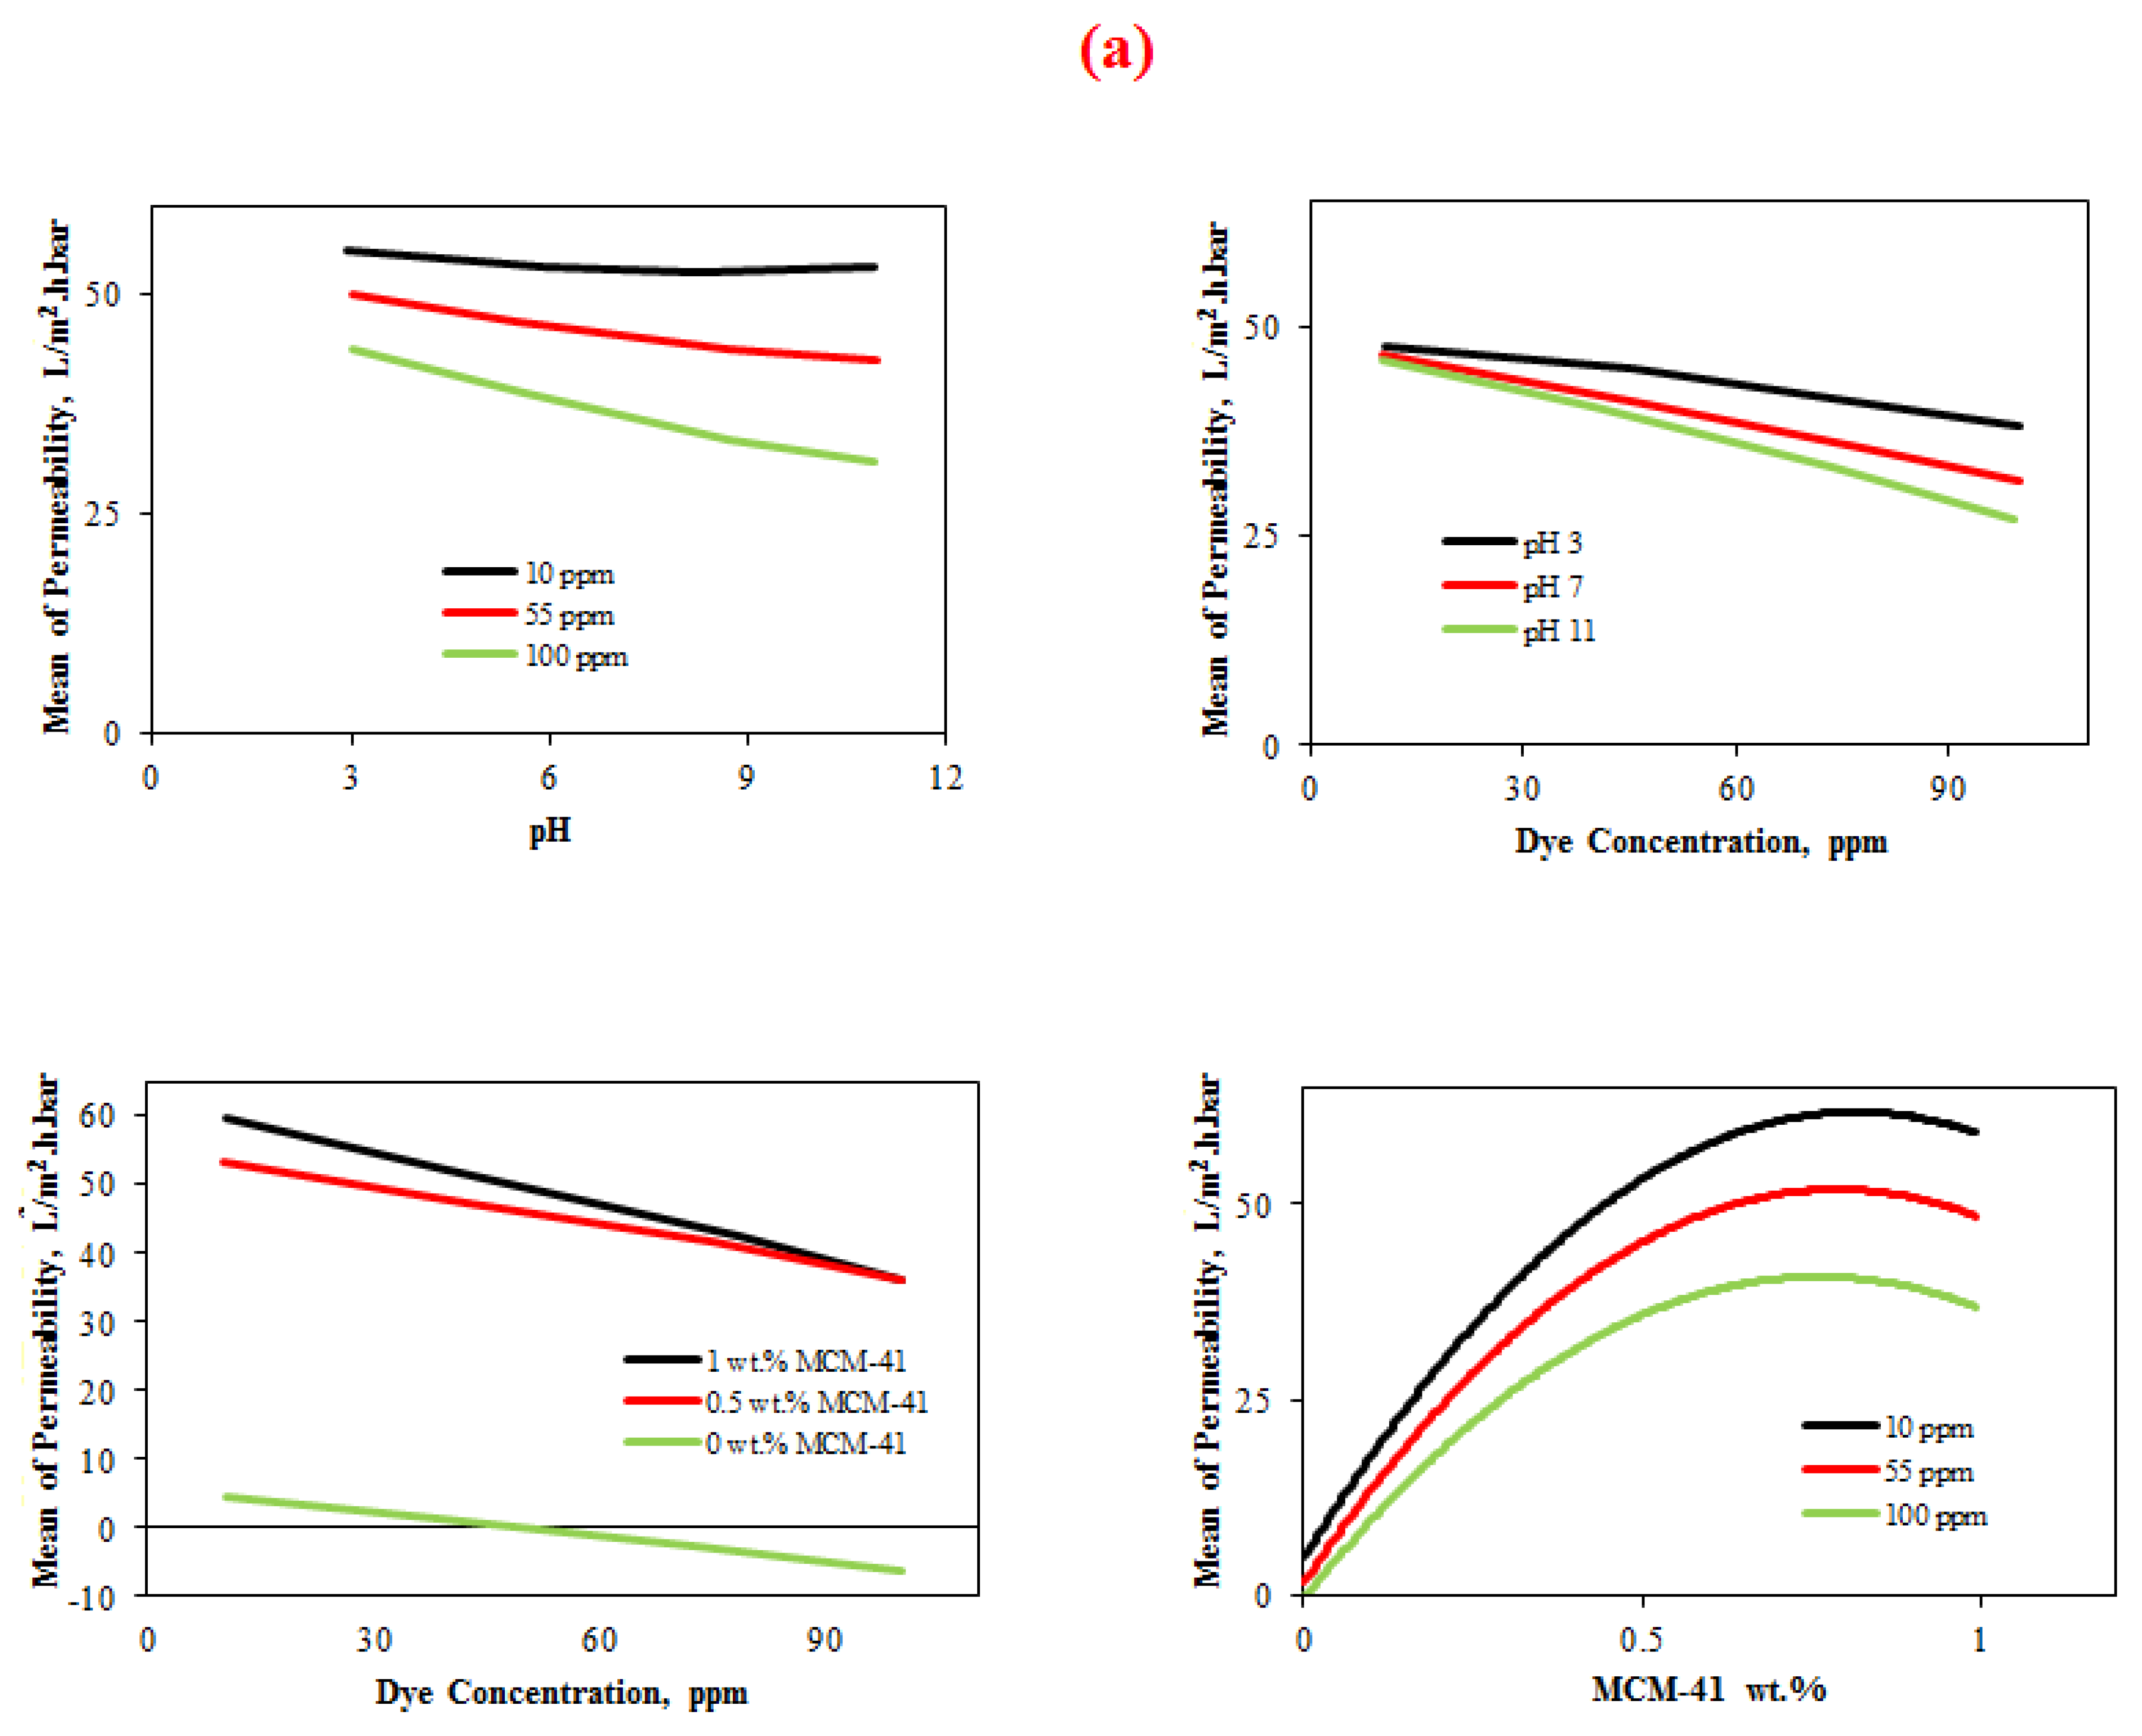
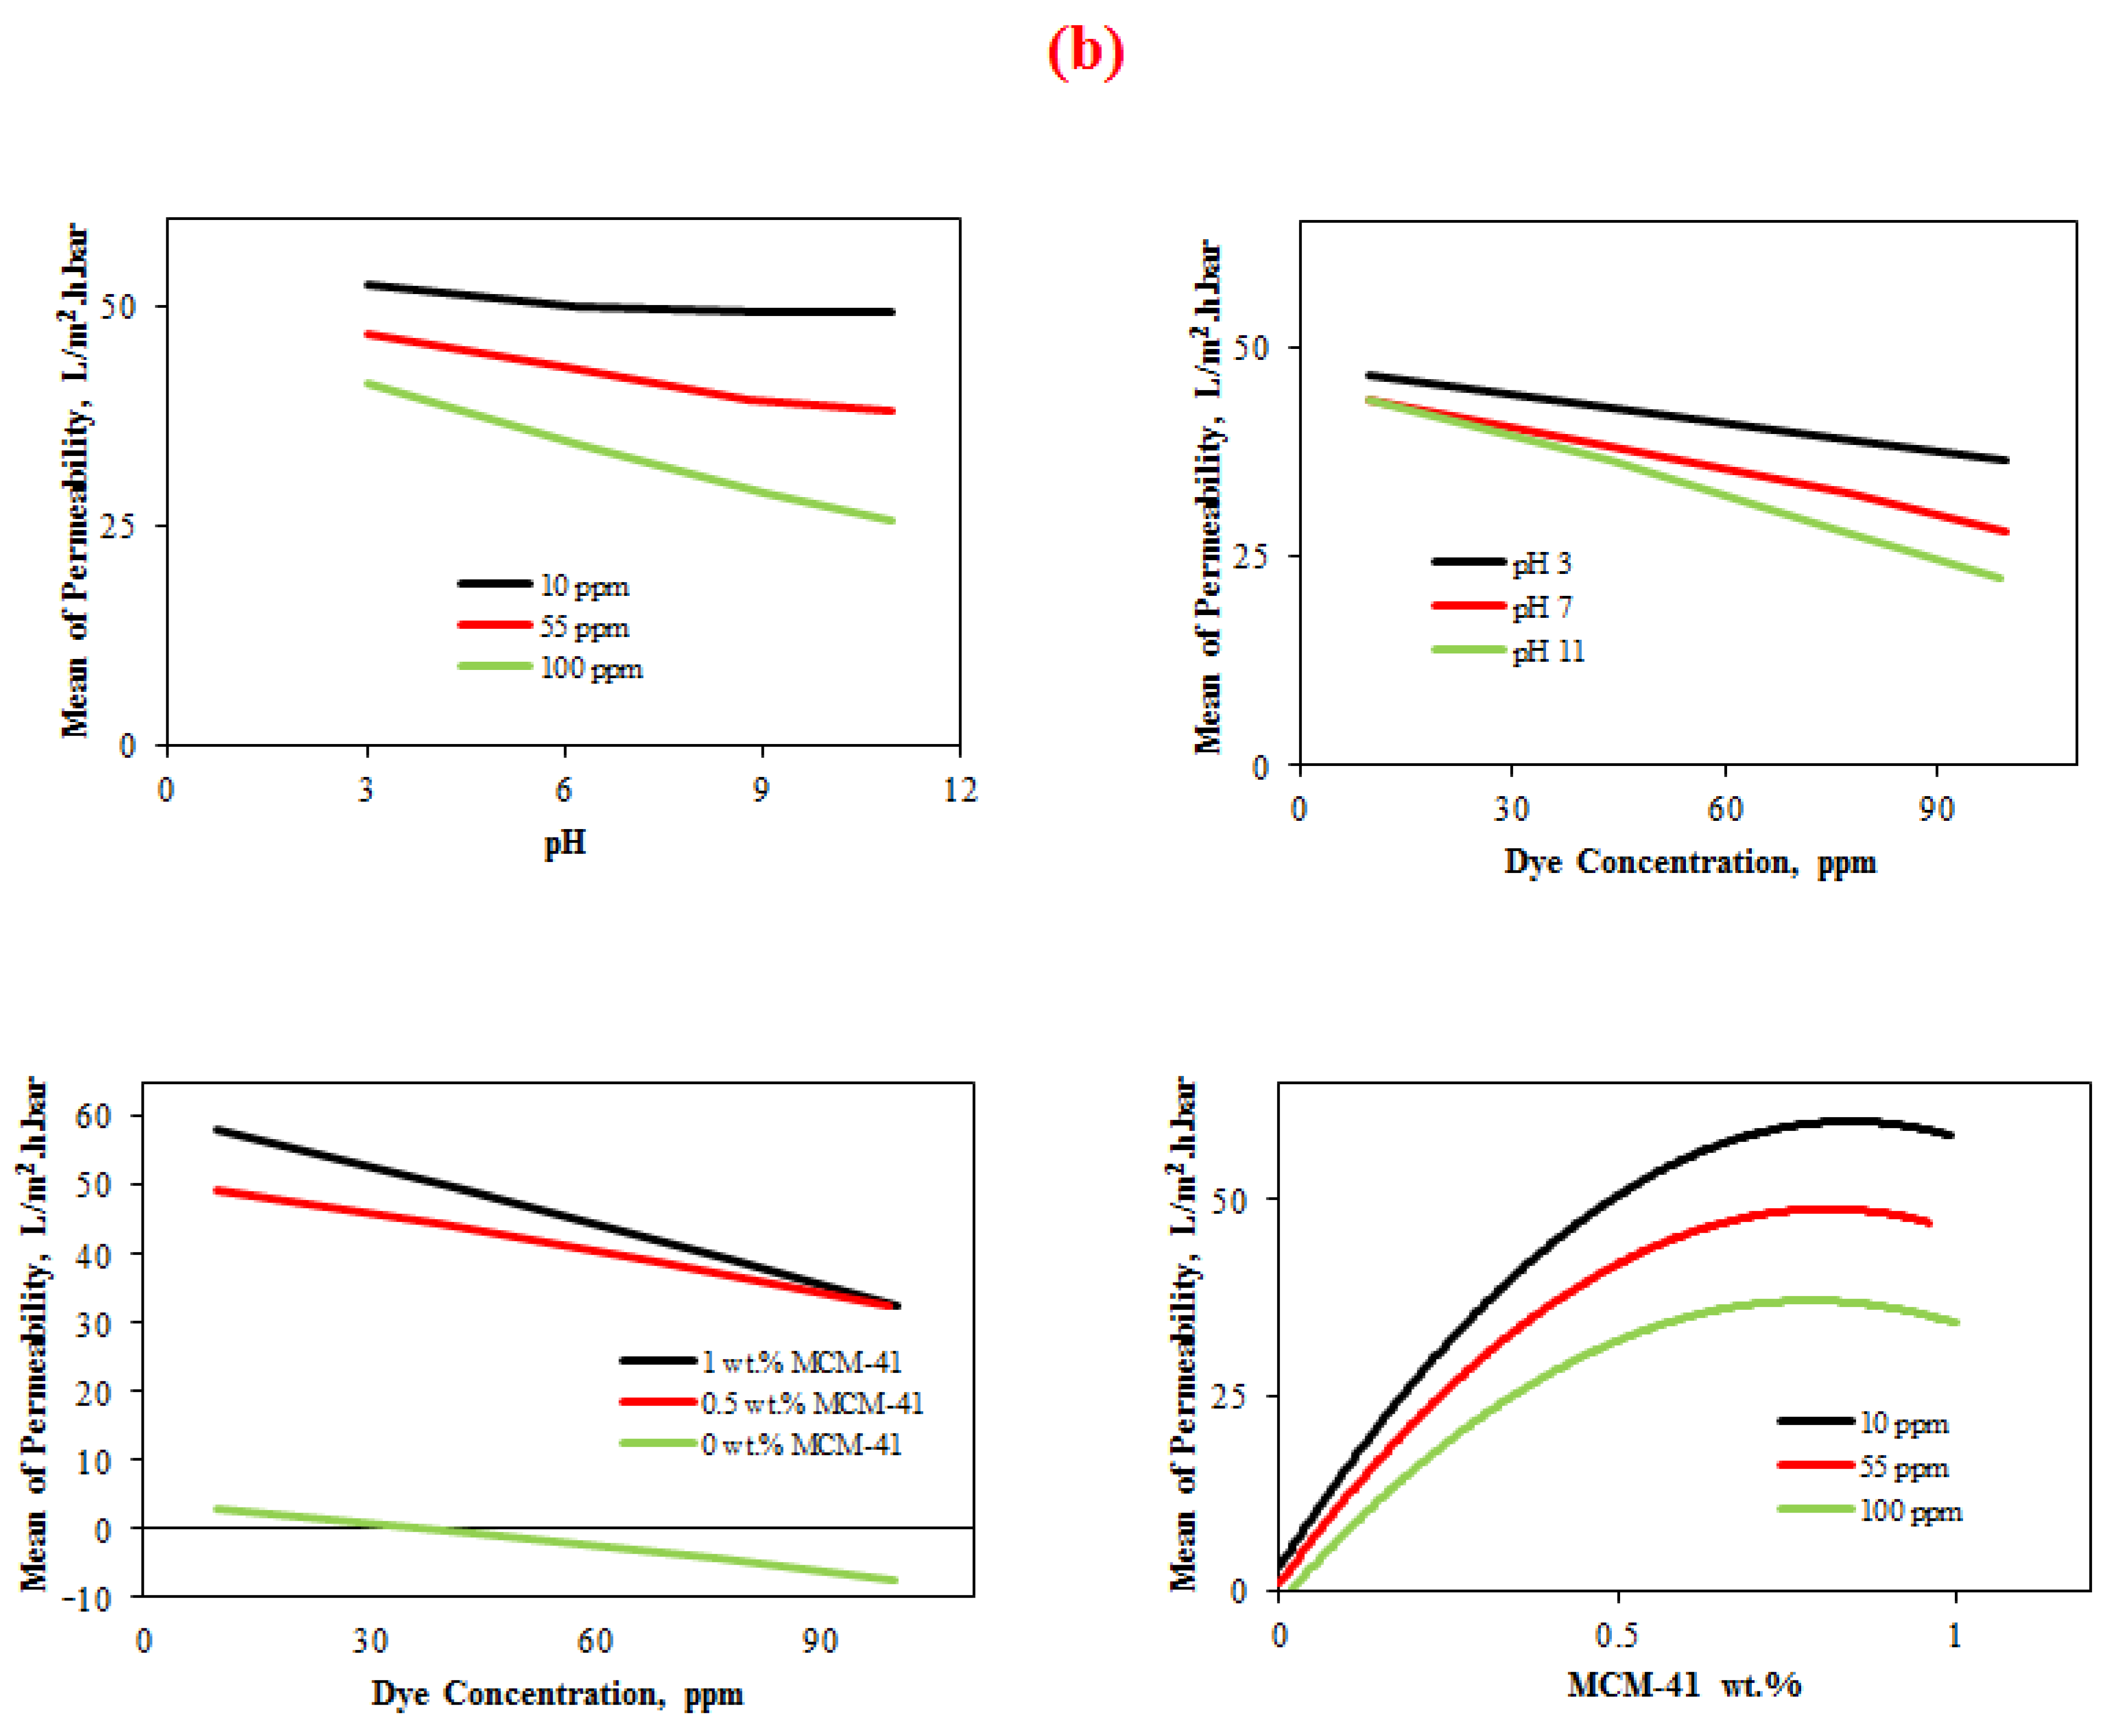
4.3.1.3. Interaction Plot
4.3.2. Residual Plot
4.3.2.1. Normal Probability Plot of Residuals
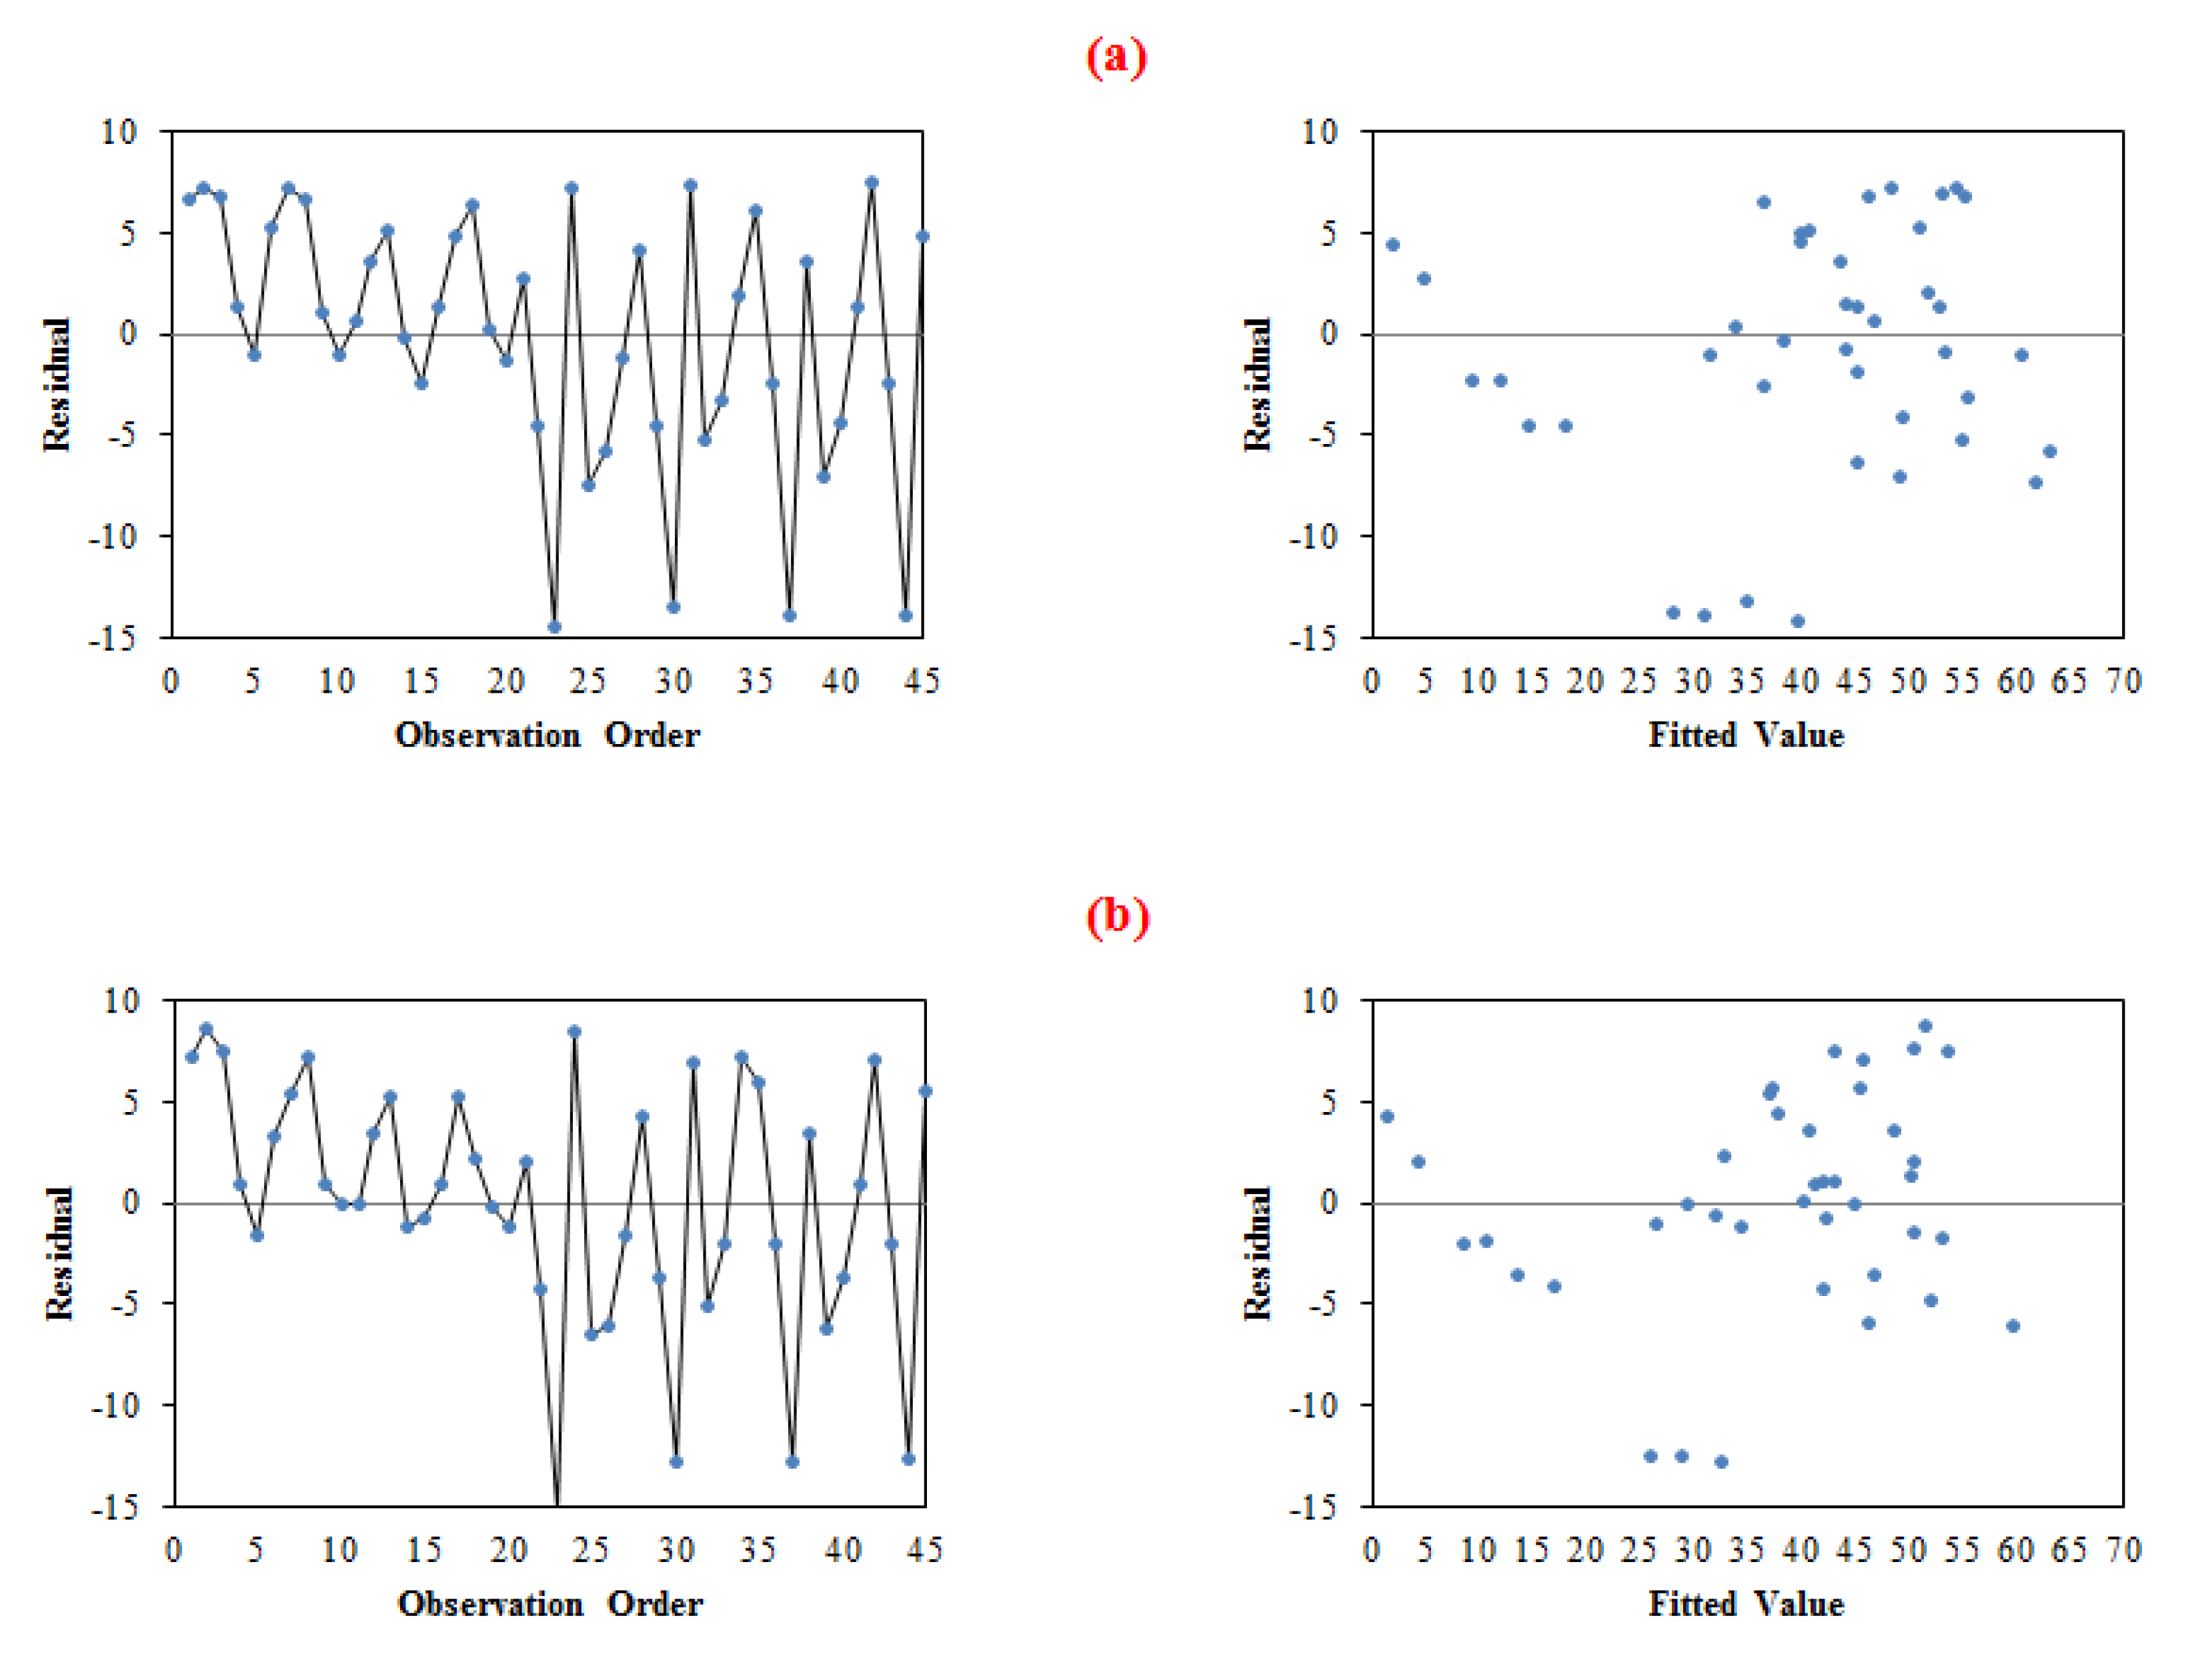
4.3.2.2. Residuals Versus Order and Fits Plot
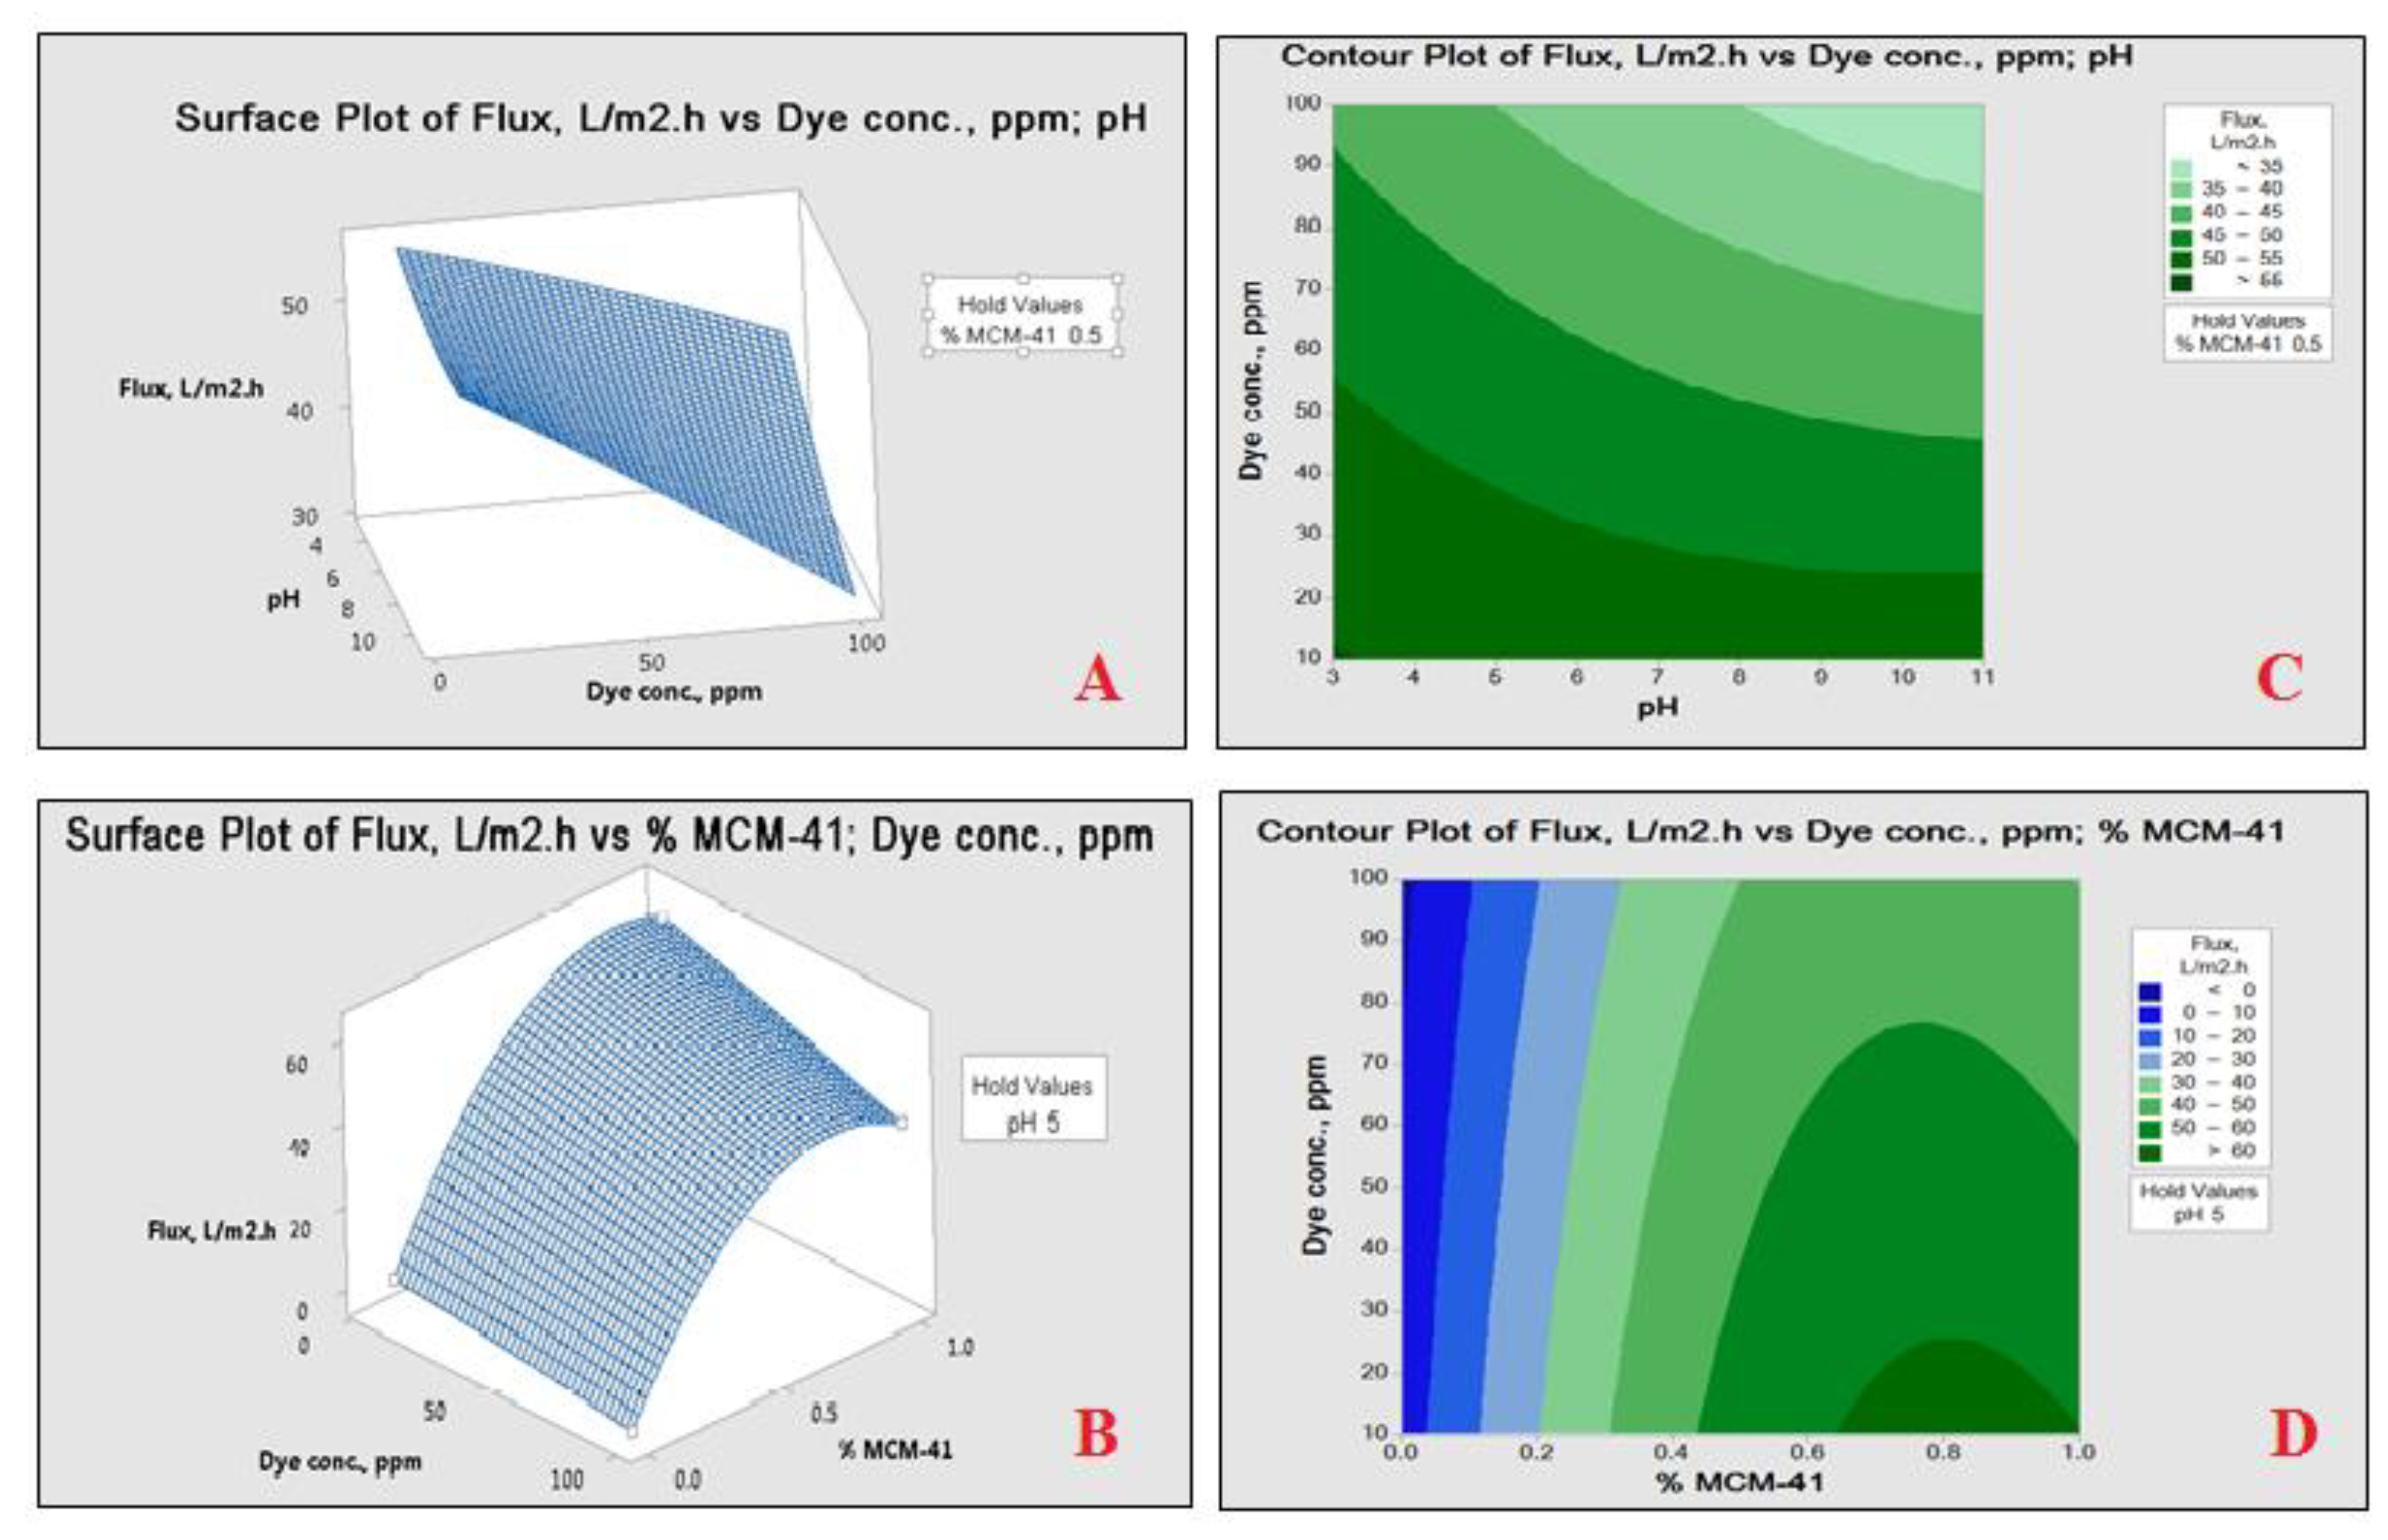
4.3.3. Response Surface Analysis
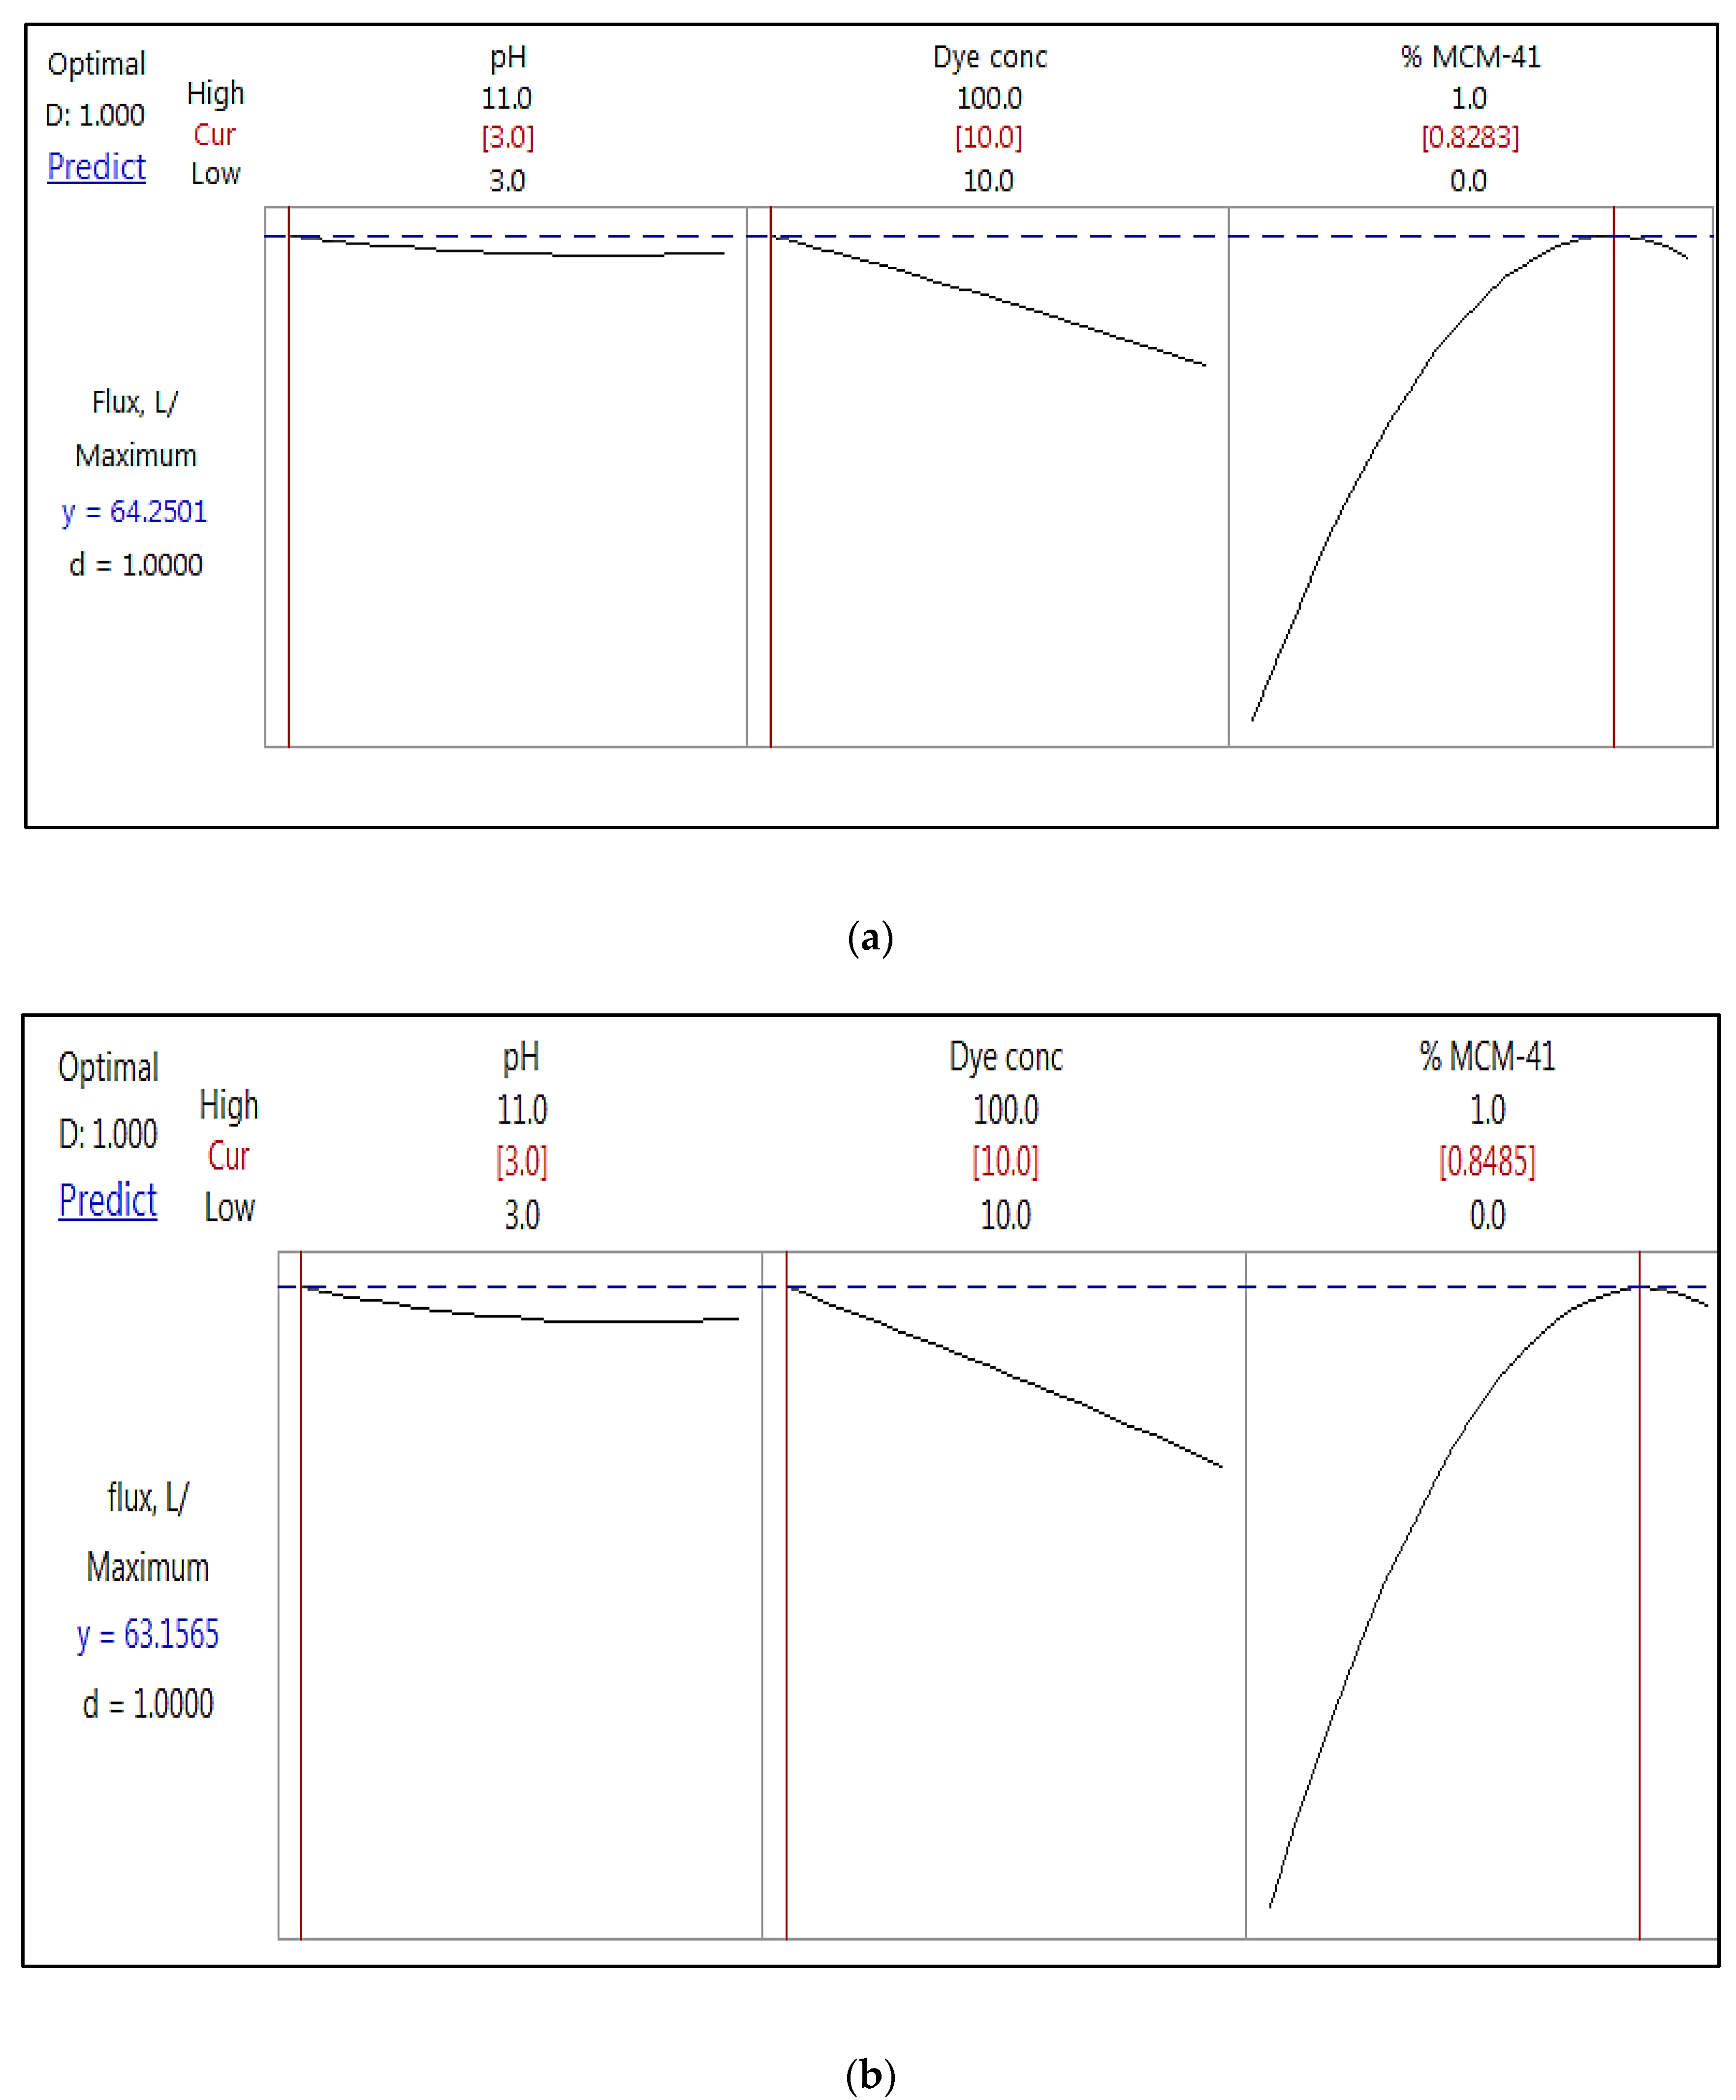
4.4. Optimization of the NF Membrane Permeability
5. Conclusions
Author Contributions
Funding
Institutional Review Board Statement
Informed Consent Statement
Data Availability Statement
Conflicts of Interest
References
- Kümmerer, K. The presence of pharmaceuticals in the environment due to human use—Present knowledge and future challenges. J. Environ. Manag. 2009, 90, 2354–2366. [Google Scholar] [CrossRef] [PubMed]
- Zuccato, E.; Castiglioni, S.; Fanelli, R.; Bagnati, R. Inquinamento da farmaci: Le evidenze (parte I). Ric. Prat. 2007, 23, 67–73. [Google Scholar]
- Sun, Z.; Chen, Y.; Ke, Q.; Yang, Y.; Yuan, J. Photocatalytic degradation of a cationic azo dye by TiO2/bentonite nanocomposite. J. Photochem. Photobiol. A Chem. 2002, 149, 169–174. [Google Scholar] [CrossRef]
- Wang, C.-C.; Juang, L.-C.; Lee, C.-K.; Hsu, T.-C.; Lee, J.-F.; Chao, H.-P. Effects of exchanged surfactant cations on the pore structure and adsorption characteristics of montmorillonite. J. Colloid Interface Sci. 2004, 280, 27–35. [Google Scholar] [CrossRef]
- Lourenço, N.; Novais, J.; Pinheiro, H. Effect of some operational parameters on textile dye biodegradation in a sequential batch reactor. J. Biotechnol. 2001, 89, 163–174. [Google Scholar] [CrossRef]
- Veríssimo, S.; Peinemann, K.-V.; Bordado, J. New composite hollow fiber membrane for nanofiltration. Desalination 2005, 184, 1–11. [Google Scholar] [CrossRef]
- Ng, L.Y.; Mohammad, A.W.; Leo, C.P.; Hilal, N. Polymeric membranes incorporated with metal/metal oxide nanoparticles: A comprehensive review. Desalination 2013, 308, 15–33. [Google Scholar] [CrossRef]
- Monsalvo, V.M.; Mohedano, A.F.; Rodriguez, J.J. Activated carbons from sewage sludge. Application to aqueous-phase adsorption of 4-chlorophenol. Desalination 2011, 277, 377–382. [Google Scholar] [CrossRef]
- Jadav, G.L.; Singh, P.S. Synthesis of novel silica-polyamide nanocomposite membrane with enhanced properties. J. Membr. Sci. 2009, 328, 257–267. [Google Scholar] [CrossRef]
- Sun, M.; Su, Y.; Mu, C.; Jiang, Z. Improved Antifouling Property of PES Ultrafiltration Membranes Using Additive of Silica−PVP Nanocomposite. Ind. Eng. Chem. Res. 2010, 49, 790–796. [Google Scholar] [CrossRef]
- Wu, H.; Tang, B.; Wu, P. Optimizing polyamide thin film composite membrane covalently bonded with modified mesoporous silica nanoparticles. J. Membr. Sci. 2013, 428, 341–348. [Google Scholar] [CrossRef]
- Maher, A.; Sadeghi, M.; Moheb, A. Heavy metal elimination from drinking water using nanofiltration membrane technology and process optimization using response surface methodology. Desalination 2014, 352, 166–173. [Google Scholar] [CrossRef]
- Song, Z.W.; Jiang, L.Y. Optimization of morphology and performance of PVDF hollow fiber for direct contact membrane distillation using experimental design. Chem. Eng. Sci. 2013, 101, 30–143. [Google Scholar] [CrossRef]
- Khayet, M.; Cojocaru, C.; Baroudi, A. Modeling and optimization of sweeping gas membrane distillation. Desalination 2012, 287, 159–166. [Google Scholar] [CrossRef]
- Figueroa, R.A.R.; Cassano, A.; Drioli, E. Ultrafiltration of orange press liquor: Optimization for permeate flux and fouling index by response surface methodology. Sep. Purif. Technol. 2011, 80, 1–10. [Google Scholar] [CrossRef]
- Hyder, M.; Huang, R.; Chen, P. Pervaporation dehydration of alcohol–water mixtures: Optimization for permeate flux and selectivity by central composite rotatable design. J. Membr. Sci. 2009, 326, 343–353. [Google Scholar] [CrossRef]
- Noordina, M.Y.; Venkatesh, V.C.; Sharif, S.; Elting, S.; Abdullah, A. Application of response surfacemethodology in describing theperformance of coated carbidetools when turning AISI 1045 steel. J. Mater. Proc. Technol. 2004, 145, 46–58. [Google Scholar] [CrossRef] [Green Version]
- Tanyildizi, M.S.; Ozer, D.; Elibol, M. Optimizationof a-amylase production by Bacillus sp. Usingresponse surface methodology. Process Biochem. 2005, 40, 2291–2296. [Google Scholar] [CrossRef]
- Bezerra, M.A.; Santelli, R.; Oliveira, E.P.; Villar, L.S.; Escaleira, L.A. Response surface methodology (RSM) as a tool for optimization in analytical chemistry. Talanta 2008, 76, 965–977. [Google Scholar] [CrossRef]
- Alsalhy, Q.F.; Albyati, T.; Zablouk, M. A study ofthe effect of operating conditions on the reverse osmosis membrane performance with and without air spargingtechnique. Chem. Eng. Commun. 2013, 200, 1–19. [Google Scholar] [CrossRef]
- Rashid, K.T.; Rahman, S.B.A.; Alsalhy, Q.F. Optimum operating parameters for hollow fiber membranesin direct contact membrane distillation. Arab. J. Sci. Eng. 2016, 41, 2647–2658. [Google Scholar] [CrossRef]
- Askari, N.; Farhadian, M.; Razmjou, A. Simultaneous effects of pH, concentration, pressure on dye removal by a polyamide nanofilter membrane; optimization through response surface methodology. Environ. Nanotechnol. Monit. Manag. 2018, 10, 223–230. [Google Scholar] [CrossRef]
- Ghaemi, N.; Madaeni, S.S.; Daraei, P.; Rajabi, H.; Shojaeimehr, T.; Rahimpour, F.; Shirvani, B. PES mixed matrix nanofiltration membrane embedded with polymer wrapped MWCNT: Fabrication and performance optimization in dye removal by RSM. J. Hazard. Mater. 2015, 298, 111–121. [Google Scholar] [CrossRef] [PubMed]
- Cretescu, I.; Soreanu, G.; Harja, M. A low-cost sorbent for removal of copper ions from wastewaters based on sawdust/fly ash mixture. Int. J. Environ. Sci. Technol. 2014, 12, 1799–1810. [Google Scholar] [CrossRef] [Green Version]
- Fadhil, S.; Alsalhy, Q.F.; Makki, H.F.; Ruby-Figueroa, R.; Marino, T.; Criscuoli, A.; Macedonio, F.; Giorno, L.; Drioli, E.; Figoli, A. Seawater desalination using PVDF-HFP membrane in DCMD process: Assessment of operating condition by response surface method. Chem. Eng. Commun. 2018, 206, 237–246. [Google Scholar] [CrossRef]
- Krishankant, J.T.; Bector, M.; Kumar, R. Application of Taguchi ethod for Optimizing Turning Process by the effects of Machining Parameters. Int. J. Eng. Adv. Technol. 2012, 2, 263–274. [Google Scholar]
- Nikbakht, R.; Sadrzadeh, M.; Mohammadi, T. Effect of operating parameters onconcentration of citric acid using electrodialysis. J. Food Eng. 2007, 83, 596–604. [Google Scholar] [CrossRef]
- Mohammadi, T.; Safavi, M.A. Application of Taguchi method in optimization of desalination by vacuum membrane distillation. Desalination 2009, 249, 83–89. [Google Scholar] [CrossRef]
- Ezzati, A.; Gorouhi, E.; Mohammadi, T. Separation of water in oil emulsions using microfiltration. Desalination 2005, 185, 371–382. [Google Scholar] [CrossRef]
- Mohammadi, T.; Moheb, A.; Sadrzadeh, M.; Razmi, A. Separation of copper ions byelectrodialysis using Taguchi experimental design. Desalination 2004, 169, 21–31. [Google Scholar] [CrossRef]
- Chen, G.; Lu, Y.; Krantz, W.B.; Wang, R.; Fane, A.G. Optimization of operating conditions for a continuous membrane distillation crystallization process with zero salty water discharge. J. Membr. Sci. 2014, 450, 1–11. [Google Scholar] [CrossRef]
- Safi, N.N.; Ibrahim, S.S.; Zouli, N.; Majdi, H.S.; Alsalhy, Q.F.; Drioli, E.; Figoli, A. A Systematic Framework for Optimizing a Sweeping Gas Membrane Distillation (SGMD). Membranes 2020, 10, 254. [Google Scholar] [CrossRef]
- Donkadokula, N.Y.; Kola, A.K.; Saroj, D. Modelling and optimization studies on decolorization of brilliant green dye using integrated nanofiltration and photocatalysis. Sustain. Environ. Res. 2020, 30, 1–13. [Google Scholar] [CrossRef]
- Kadhim, R.J.; Al-Ani, F.H.; Alsalhy, Q.F. MCM-41 mesoporous modified polyethersulfonenanofiltration membranes and their prospects fordyes removal. Int. J. Environ. Anal. Chem. 2021. [Google Scholar] [CrossRef]
- Esfahani, M.R.; Tyler, J.L.; Stretz, H.A.; Wells, M.J. Effects of a dual nanofiller, nano-TiO2 and MWCNT, for polysulfone-based nanocomposite membranes for water purification. Desalination 2015, 372, 47–56. [Google Scholar] [CrossRef]
- Al-Ani, D.M.; Al-Ani, F.H.; Alsalhy, Q.F.; Ibrahim, S.S. Preparation and characterization of ultrafiltration membranes from PPSU-PES polymer blend for dye removal. Chem. Eng. Commun. 2021, 208, 41–59. [Google Scholar] [CrossRef]
- Sotto, A.; Boromand, A.; Zhang, R.; Luis, P.; Arsuaga, J.M.; Kim, J.; Van der Bruggen, B. Effect of nanoparticle aggregation at low concentrations of TiO2 on the hydrophilicity, morphology, and fouling resistance of PES-TiO2 membranes. J. Colloid Interface Sci. 2011, 363, 540–550. [Google Scholar] [CrossRef]
- Eleiwi, F.; Laleg-Kirati, T.M. Dynamic modeling and optimization in membrane distillation system. IFAC Proc. Vol. 2014, 47, 3327–3332. [Google Scholar] [CrossRef]
- Yahya, A.; Rashid, K.; Ghadhban, M.; Mousa, N.; Majdi, H.; Salih, I.; Alsalhy, Q. Removal of 4-Nitrophenol from Aqueous Solution by Using Polyphenylsulfone-Based Blend Membranes: Characterization and Performance. Membranes 2021, 11, 171. [Google Scholar] [CrossRef]


| Membrane Code | Casting Solution Compositions (wt.%) | Solvents (DMSO) (wt.%) | |
|---|---|---|---|
| PES | MCM-41 | ||
| M0 | 21 | 0 | 79 |
| M1 | 21 | 0.1 | 79.9 |
| M2 | 21 | 0.3 | 79.7 |
| M3 | 21 | 0.5 | 79.5 |
| M4 | 21 | 0.7 | 79.3 |
| M5 | 21 | 0.8 | 79.2 |
| M6 | 21 | 1 | 78 |
| Membrane Code | Thickness * (µm) | Porosity (%) | Average Contact Angle (°) | Pure WATER Permeability (LMH/bar) |
|---|---|---|---|---|
| M0 | 151.12 ± 2.46 | 26.06 ± 1.25 | 69.2 ± 3.80 | 10 |
| M1 | 143.69 ± 1.19 | 66.90 ± 0.63 | 49.1 ± 2.09 | 15 |
| M2 | 128.61 ± 2.35 | 68.20 ± 1.00 | 45.2 ± 2.50 | 38.37 |
| M3 | 119.83 ± 1.06 | 82.80 ± 0.51 | 40.5 ± 0.50 | 77.8 |
| M4 | 95.55 ± 1.22 | 73.20 ± 0.38 | 52.0 ± 1.60 | 65.2 |
| M5 | 91.20 ± 0.79 | 75.76 ± 0.47 | 58.6 ± 0.97 | 66.5 |
| M6 | 87.99 ± 1.11 | 76.60 ± 0.91 | 59.1 ± 1.01 | 70 |
| Parameters | Code | Units | Low level | High Level |
|---|---|---|---|---|
| MCM-41 content | X1 | wt.% | 0 | 1 |
| AB 210 dye concentration | X2 | ppm | 10 | 100 |
| RB dye concentration | X3 | ppm | 10 | 100 |
| pH of dye solution | X4 | - | 3 | 11 |
| permeability | Y | LMH/bar | Target | |
| Source | DF | Adj SS | Adj MS | F-Value | p-Value | |||
| Model | 8 | 13,166.7 | 1645.84 | 36.70 | 0.000 | |||
| Linear | 3 | 9347.7 | 3115.91 | 69.49 | 0.000 | |||
| pH | 1 | 155.3 | 155.32 | 3.46 | 0.070 | |||
| Concentration | 1 | 1417.1 | 1417.11 | 31.60 | 0.000 | |||
| % MCM-41 | 1 | 7680.8 | 7680.85 | 171.29 | 0.000 | |||
| Square | 3 | 2825.2 | 941.74 | 21.00 | 0.000 | |||
| pH × pH | 1 | 4.9 | 4.86 | 0.11 | 0.744 | |||
| Dye conc., ppm × Dye conc.,ppm | 1 | 2.0 | 2.03 | 0.05 | 0.833 | |||
| % MCM-41 × % MCM-41 | 1 | 2638.6 | 2638.55 | 58.84 | 0.000 | |||
| 2-Way Interaction | 2 | 137.6 | 68.78 | 1.53 | 0.228 | |||
| pH × conc. | 1 | 52.3 | 52.34 | 1.17 | 0.287 | |||
| Conc. × % MCM-41 | 1 | 83.5 | 83.51 | 1.86 | 0.180 | |||
| Error | 39 | 1748.8 | 44.84 | |||||
| Lack-of-Fit | 35 | 1748.8 | 49.96 | |||||
| Pure Error | 4 | 0.0 | 0.00 | |||||
| Total | 47 | 14,915.5 | ||||||
| S | R-sq | R-sq(adj) | R-sq(pred) | (a) AB 210 dye | ||||
| 6.69627 | 88.28% | 85.87% | 83.95% | |||||
| Source | DF | Adj SS | Adj MS | F-Value | p-Value | |||
| Model | 8 | 12,533.6 | 1566.70 | 38.17 | 0.000 | |||
| Linear | 3 | 9390.0 | 3130.01 | 76.26 | 0.000 | |||
| pH | 1 | 245.9 | 245.90 | 5.99 | 0.019 | |||
| Concentration | 1 | 1610.5 | 1610.54 | 39.24 | 0.000 | |||
| % MCM-41 | 1 | 7408.6 | 7408.56 | 180.51 | 0.000 | |||
| Square | 3 | 2402.6 | 800.88 | 19.51 | 0.000 | |||
| pH × pH | 1 | 7.6 | 7.57 | 0.18 | 0.670 | |||
| Dye conc., ppm × Dye conc.,ppm | 1 | 1.3 | 1.28 | 0.03 | 0.861 | |||
| % MCM-41 × % MCM-41 | 1 | 2226.4 | 2226.41 | 54.25 | 0.000 | |||
| 2-Way Interaction | 2 | 184.1 | 92.06 | 2.24 | 0.120 | |||
| pH × conc. | 1 | 75.6 | 75.57 | 1.84 | 0.183 | |||
| conc. × % MCM-41 | 1 | 106.2 | 106.24 | 2.59 | 0.116 | |||
| Error | 39 | 1600.7 | 41.04 | |||||
| Lack-of-Fit | 35 | 1599.7 | 45.71 | 186.55 | 0.000 | |||
| Pure Error | 4 | 1.0 | 0.24 | |||||
| Total | 47 | 14,134.2 | ||||||
| S | R-sq | R-sq(adj) | R-sq(pred) | (b) RB dye | ||||
| 6.40645 | 88.68% | 86.35% | 84.43% | |||||
| (a) AB 210 Dye | |||||||||
| Coded Coefficients | |||||||||
| Term | Coef | SE Coef | T-Value | p-Value | VIF | ||||
| Constant | 45.28 | 2.32 | 19.49 | 0.000 | |||||
| pH | −3.70 | 1.99 | −1.86 | 0.070 | 1.14 | ||||
| Concentration | −8.29 | 1.47 | −5.62 | 0.000 | 1.32 | ||||
| % MCM-41 | 24.45 | 1.87 | 13.09 | 0.000 | 1.03 | ||||
| pH × pH | 1.12 | 3.40 | 0.33 | 0.744 | 1.09 | ||||
| Conc. × Conc. | −0.48 | 2.24 | −0.21 | 0.833 | 1.00 | ||||
| % MCM-41 × % MCM-41 | −21.42 | 2.79 | −7.67 | 0.000 | 1.16 | ||||
| pH × Conc. | −2.67 | 2.47 | −1.08 | 0.287 | 1.34 | ||||
| Conc. × % MCM-41 | −3.33 | 2.44 | −1.36 | 0.180 | 1.02 | ||||
| Fits and Diagnostics for Unusual Observations | |||||||||
| Obs | permeability | Fit | Resid | Std Resid | |||||
| 23 | 25.00 | 39.35 | −14.35 | −2.31 | R | ||||
| 30 | 21.40 | 34.82 | −13.42 | −2.10 | R | ||||
| 37 | 17.00 | 30.94 | −13.94 | −2.15 | R | ||||
| 44 | 14.30 | 28.11 | −13.81 | −2.19 | R | ||||
| (b) RB Dye | |||||||||
| Term | Coef | SE Coef | T-Value | p-Value | VIF | ||||
| Constant | 42.06 | 2.22 | 18.92 | 0.000 | |||||
| pH | −4.65 | 1.90 | −2.45 | 0.019 | 1.14 | ||||
| Concentration | −8.84 | 1.41 | −6.26 | 0.000 | 1.32 | ||||
| % MCM-41 | 24.02 | 1.79 | 13.44 | 0.000 | 1.03 | ||||
| pH × pH | 1.40 | 3.25 | 0.43 | 0.670 | 1.09 | ||||
| Conc. × Conc. | −0.38 | 2.14 | −0.18 | 0.861 | 1.00 | ||||
| % MCM-41 × % MCM-41 | −19.68 | 2.67 | −7.37 | 0.000 | 1.16 | ||||
| pH × Conc. | −3.21 | 2.37 | −1.36 | 0.183 | 1.34 | ||||
| Conc. × % MCM-41 | −3.76 | 2.33 | −1.61 | 0.116 | 1.02 | ||||
| Fits and Diagnostics for Unusual Observations | |||||||||
| Obs | permeability | Fit | Resid | Std Resid | |||||
| 23 | 22.00 | 37.33 | −15.33 | −2.58 | R | ||||
| 30 | 19.70 | 32.61 | −12.91 | −2.11 | R | ||||
| 37 | 16.00 | 28.68 | −12.68 | −2.05 | R | ||||
| 44 | 13.10 | 25.87 | −12.77 | −2.12 | R | ||||
| Response Optimization: permeability (L.m−2.hr−1.bar−1) | (a) AB 210 dye | ||||||||||||||||||
| Parameters | |||||||||||||||||||
| Response | Goal | Lower | Target | Upper | Weight | Importance | |||||||||||||
| permeability | Maximum | 4.9 | 62 | 1 | 1 | ||||||||||||||
| Solution | |||||||||||||||||||
| Solution | pH | Concentration | % MCM-41 | permeability Fit | Composite Desirability | ||||||||||||||
| 1 | 3 | 10 | 0.828 | 64.2501 | 1 | ||||||||||||||
| Multiple Response Prediction | |||||||||||||||||||
| Variable | Setting | ||||||||||||||||||
| pH | 3 | ||||||||||||||||||
| Concentration | 10 | ||||||||||||||||||
| % MCM-41 | 0.828 | ||||||||||||||||||
| Response | Fit | SE Fit | 95% CI | 95% PI | |||||||||||||||
| permeability | 64.25 | 4.52 | (55.11; 73.39) | (47.91; 80.59) | |||||||||||||||
| Response Optimization: permeability (L.m−2.hr−1.bar−1) | (b) RB dye | ||||||||||||||||||
| Parameters | |||||||||||||||||||
| Response | Goal | Lower | Target | Upper | Weight | Importance | |||||||||||||
| permeability | Maximum | 4.3 | 60.5 | 1 | 1 | ||||||||||||||
| Solution | |||||||||||||||||||
| Solution | pH | Conc. | % MCM-41 | permeability Fit | Composite Desirability | ||||||||||||||
| 1 | 3 | 10 | 0.848 | 63.16 | 1 | ||||||||||||||
| Multiple Response Prediction | |||||||||||||||||||
| Variable | Setting | ||||||||||||||||||
| pH | 3 | ||||||||||||||||||
| Concentration | 10 | ||||||||||||||||||
| % MCM-41 | 0.848 | ||||||||||||||||||
| Response | Fit | SE Fit | 95% CI | 95% PI | |||||||||||||||
| permeability | 63.16 | 4.41 | (54.23; 72.08) | (47.42; 78.89) | |||||||||||||||
Publisher’s Note: MDPI stays neutral with regard to jurisdictional claims in published maps and institutional affiliations. |
© 2021 by the authors. Licensee MDPI, Basel, Switzerland. This article is an open access article distributed under the terms and conditions of the Creative Commons Attribution (CC BY) license (https://creativecommons.org/licenses/by/4.0/).
Share and Cite
Kadhim, R.J.; Al-Ani, F.H.; Alsalhy, Q.F.; Figoli, A. Optimization of MCM-41 Mesoporous Material Mixed Matrix Polyethersulfone Membrane for Dye Removal. Membranes 2021, 11, 414. https://doi.org/10.3390/membranes11060414
Kadhim RJ, Al-Ani FH, Alsalhy QF, Figoli A. Optimization of MCM-41 Mesoporous Material Mixed Matrix Polyethersulfone Membrane for Dye Removal. Membranes. 2021; 11(6):414. https://doi.org/10.3390/membranes11060414
Chicago/Turabian StyleKadhim, Rana J., Faris H. Al-Ani, Qusay F. Alsalhy, and Alberto Figoli. 2021. "Optimization of MCM-41 Mesoporous Material Mixed Matrix Polyethersulfone Membrane for Dye Removal" Membranes 11, no. 6: 414. https://doi.org/10.3390/membranes11060414
APA StyleKadhim, R. J., Al-Ani, F. H., Alsalhy, Q. F., & Figoli, A. (2021). Optimization of MCM-41 Mesoporous Material Mixed Matrix Polyethersulfone Membrane for Dye Removal. Membranes, 11(6), 414. https://doi.org/10.3390/membranes11060414