Article

Alkaline Liquid Ventilation of the Membrane Lung for Extracorporeal Carbon Dioxide Removal (ECCO2R): In Vitro Study

1
Anesthesia and Critical Care, Department of Pathophysiology and Transplantation, University of Milan, 20122 Milan, Italy
2
Center for Preclinical Research, Fondazione IRCCS Ca’ Granda-Ospedale Maggiore Policlinico, 20122 Milan, Italy
3
Department of Anesthesia and Intensive Care Medicine, Niguarda Ca’ Granda, 20162 Milan, Italy
4
Department of Medicine and Surgery, University of Milan-Bicocca, 20900 Monza, Italy
5
Dipartimento di Anestesia, Rianimazione ed Emergenza Urgenza, Fondazione IRCCS Ca’ Granda-Ospedale Maggiore Policlinico, 20122 Milan, Italy
*
Author to whom correspondence should be addressed.
These authors equally contributed to the study.
Membranes 2021, 11(7), 464; https://doi.org/10.3390/membranes11070464
Submission received: 28 May 2021 / Revised: 18 June 2021 / Accepted: 20 June 2021 / Published: 22 June 2021
(This article belongs to the Special Issue Challenges in the Extracorporeal Membrane Oxygenation Era)

Abstract

:
Extracorporeal carbon dioxide removal (ECCO2R) is a promising strategy to manage acute respiratory failure. We hypothesized that ECCO2R could be enhanced by ventilating the membrane lung with a sodium hydroxide (NaOH) solution with high CO2 absorbing capacity. A computed mathematical model was implemented to assess NaOH–CO2 interactions. Subsequently, we compared NaOH infusion, named “alkaline liquid ventilation”, to conventional oxygen sweeping flows. We built an extracorporeal circuit with two polypropylene membrane lungs, one to remove CO2 and the other to maintain a constant PCO2 (60 ± 2 mmHg). The circuit was primed with swine blood. Blood flow was 500 mL × min−1. After testing the safety and feasibility of increasing concentrations of aqueous NaOH (up to 100 mmol × L−1), the CO2 removal capacity of sweeping oxygen was compared to that of 100 mmol × L−1 NaOH. We performed six experiments to randomly test four sweep flows (100, 250, 500, 1000 mL × min−1) for each fluid plus 10 L × min−1 oxygen. Alkaline liquid ventilation proved to be feasible and safe. No damages or hemolysis were detected. NaOH showed higher CO2 removal capacity compared to oxygen for flows up to 1 L × min−1. However, the highest CO2 extraction power exerted by NaOH was comparable to that of 10 L × min−1 oxygen. Further studies with dedicated devices are required to exploit potential clinical applications of alkaline liquid ventilation.

1. Introduction

Extracorporeal carbon dioxide removal (ECCO2R) clears CO2 from the blood through an extracorporeal membrane lung (ML). This allows independent modulation of minute ventilation and arterial partial pressure of CO2 (PaCO2), which are otherwise physiologically linked [1]. ECCO2R has been proposed to facilitate ultra-protective ventilation [2,3,4] and to promote non-invasive ventilation [5]. This could be particularly beneficial in patients suffering from respiratory failure, including exacerbations of chronic obstructive pulmonary disease (COPD) [6], acute respiratory distress syndrome (ARDS) [7], and patients awaiting lung transplantation [8]. The amount of CO2 removed by the extracorporeal support is a crucial determinant of clinical efficacy [9,10]. However, the clinical benefits of ECCO2R are still under evaluation due to safety concerns, mainly related to hemorrhagic and thrombotic adverse events [9].
Several ECCO2R devices are clinically available. They are mainly characterized by a low extracorporeal blood flow (i.e., <500 mL × min−1) to achieve minimally invasive approaches [11]. Indeed, although 500 mL of blood contain an amount of CO2 comparable to the amount of CO2 produced by the body in one minute ( V ˙ CO2), the relatively low CO2 transfer efficiency of conventional MLs significantly reduces the efficacy of these strategies [12].
The transmembrane gradient of PCO2 is the driving force that moves CO2 from blood to the sweeping gases. However, the use of high sweep gas flows, while maximizing the transmembrane gradient, does not increase CO2 clearance significantly. Indeed, during ECCO2R, most of the extracorporeal CO2 removal capacity is achieved for sweep gas flows below 2 L × min−1 since, at higher flows, the system rapidly loses efficiency [13,14,15,16].
Several ECCO2R techniques are currently undergoing preclinical evaluations. The main aim is to overcome the present limitations to enhance CO2 removal [17,18,19,20,21] effectively. To this purpose, our group has achieved high rates of CO2 removal through acidification of the blood entering the ML [22,23,24,25,26,27]. This strategy reduced dissociated CO2 (HCO3) in favor of dissolved CO2 (PCO2), thus increasing the efficiency of ECCO2R. Nevertheless, these approaches are still experimental, mainly due to safety and technical issues [28,29].
In the present study, we hypothesized that extracorporeal CO2 removal could be enhanced through the ventilation of the ML with a sweep fluid with an extremely high CO2 absorbing capacity (sodium hydroxide -NaOH- solutions), thereby preserving the transmembrane CO2 gradient.
Indeed, when a high amount of CO2 is added to dilute NaOH solutions, carbon dioxide first hydrates to carbonic acid (H2CO3), Equation (1), which will subsequently react with NaOH to form sodium bicarbonate (NaHCO3), Equation (2).
CO2 + H2O ↔ H2CO3
NaOH + H2CO3 ↔ Na+ + HCO3 + H2O
Instead, when CO2 is added to highly concentrated NaOH solutions, sodium bicarbonate is formed directly, Equation (3), which subsequently forms sodium carbonate, Equation (4).
NaOH + CO2 ↔ NaHCO3
NaHCO3 + NaOH ↔ Na2CO3 + H2O
Consequently, highly concentrated NaOH solutions can absorb a conspicuous amount of CO2 while keeping PCO2 almost down to zero although the elevated pH of the solution causes safety concerns.
The aim of the present proof-of-principle study was to evaluate in-vitro the feasibility and the CO2 transfer efficacy of membrane lung ventilation with a NaOH solution. This type of ventilation was named “alkaline liquid ventilation”.
Different concentrations of NaOH were tested and the efficacy and efficiency in CO2 removal of alkaline liquid ventilation were compared to conventional sweep gas flow.

2. Materials and Methods

An in vitro setting (Figure 1) was built to simulate a patient undergoing extracorporeal CO2 removal.
A closed-loop circuit was assembled with 3/8 and 1/4 inch polyvinylchloride class IV medical tubes (Medtronic, Minneapolis, MN, USA), one 4 L reservoir (VHK 71000 venous hardshell cardiotomy reservoir, Getinge, Gothenburg, Sweden), two polypropylene oxygenators membrane gas exchangers (Quadrox-i Small adult HMO 50000, Getinge, Gothenburg, Sweden) and one peristaltic pump (Multiflow Roller Pump Module H10 series, Stöckert Shiley, München, Germany).
The circuit was primed with about 3 L of swine blood collected at a local abattoir during usual slaughtering processes in compliance with CE regulations (1069/2009), authorization number 0141051/19 provided by ATS Milano, Regione Lombardia. MultiBic® solution (Fresenius Medical Care Italia, Palazzo Pignano, Italy) was added to achieve a total volume of about 4 L. Sodium Heparin 25000 I.U. (Pfizer Italia S.r.l, Latina, Italy), anticoagulant-citrate-dextrose ACD 300 mL (Fresenius Kabi Italia, Isola Della Scala, Italy) and cefazolin 1 g (Teva Italia, Milano, Italy) were added to the blood.
The first gas exchanger downstream the reservoir was ventilated with a gas mixture of air and CO2 to maintain a constant PCO2 of 60 ± 2 mmHg at the inlet of the second oxygenator throughout all experiments. The second oxygenator was employed to remove CO2 through either ventilation with oxygen or a continuous infusion of sodium hydroxide (NaOH) solution, “alkaline liquid ventilation”, into the gas side of the membrane lung. Circuit accesses for blood sampling were positioned upstream (PRE) and downstream (POST) of the second oxygenator.
NaOH pellets (Sigma-Aldrich, Merck KGaA, Saint Louis, MO, USA) were diluted in distilled water to achieve the required concentrations. NaOH solutions were stored in disposable parenteral bags (Bertoni Nello S.r.l. Modena, Italy) and infused into the gas inlet port in the gas exchanger using a peristaltic pump (Multiflow Roller Pump Module H10 series, Stöckert Shiley, München, Germany). NaOH exiting the oxygenator was discarded.
The blood temperature was kept stable at 37 °C through heat exchangers connected to the membrane lungs.
The study was divided into four steps: (1) a mathematical modeling of NaOH and CO2 interactions to evaluate the theoretical basis of the study; (2) a safety and feasibility test to evaluate the effects of increasing NaOH concentrations on the membrane lung integrity and CO2 removal; (3) an efficiency test to compare the CO2 removal of similar sweep flows (up to 1 L × min−1) of oxygen vs. NaOH at the concentration selected following the feasibility test; (4) an efficacy test to compare the CO2 removal of the best liquid ventilation flow, selected from the efficiency test, vs. 10 L × min−1 of oxygen.
All the in-vitro tests were performed with 500 mL × min−1 of blood flow.

2.1. Mathematical Modeling

Theoretical effects of CO2 absorption by aqueous NaOH were computed solving a system of equations (MATLAB R2018b; The Math Works, Inc, Natick, MA, USA), including standard mass-action, mass-conservation and electroneutrality laws of the involved species: water, NaOH, CO2 (see the Online Supplement for more details).
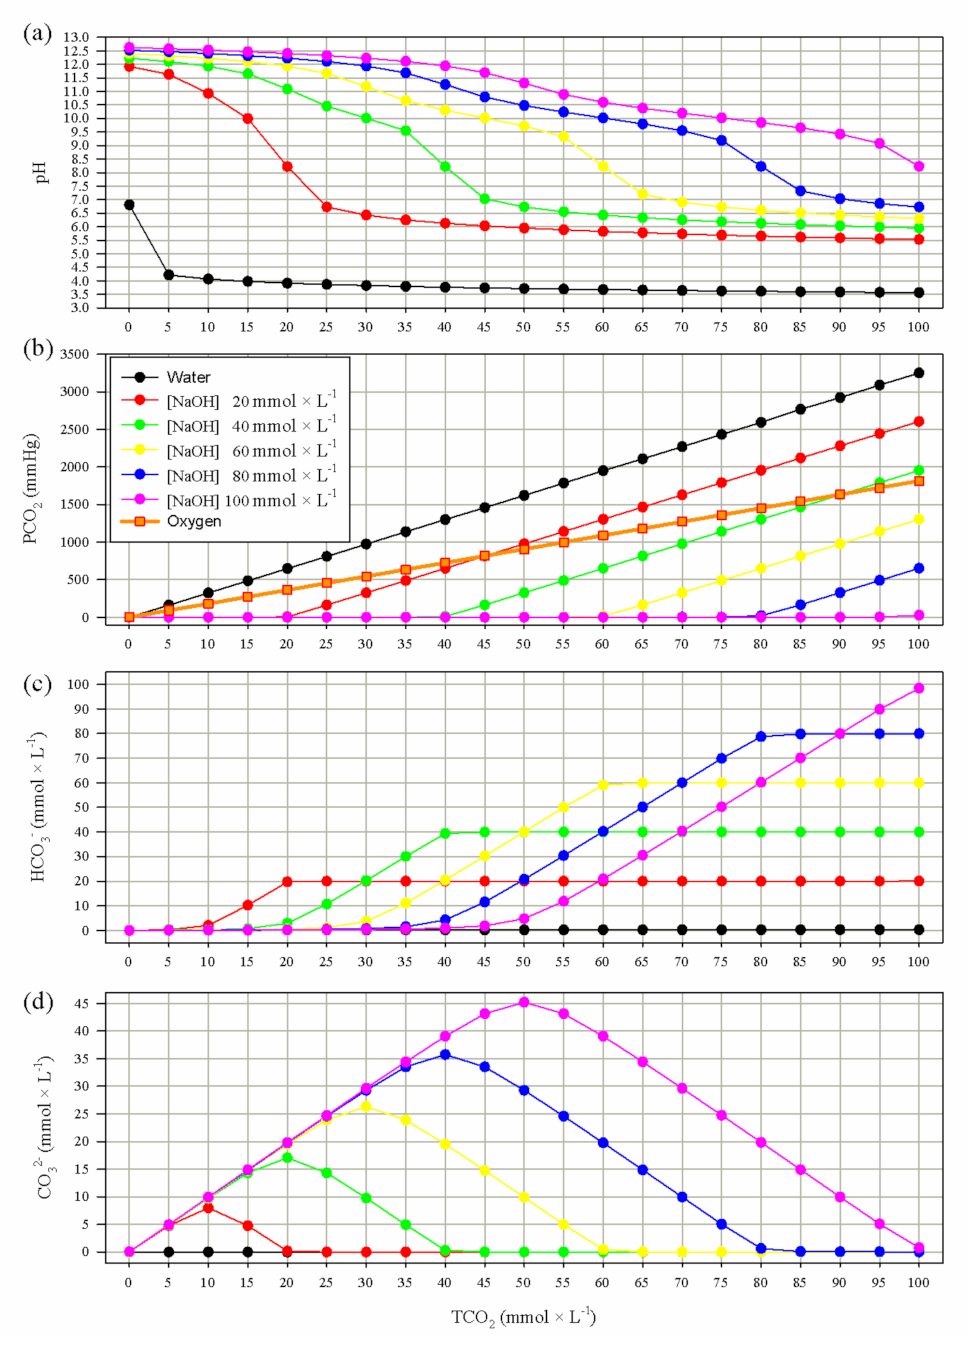
We simulated a closed system with aqueous NaOH at varying concentrations (from 0 to 100 by 20 mmol × L−1) in which we introduced CO2 at different concentrations (from 0 to 100 by 5 mmol × L−1).
Of note, in the present mathematical model of a closed system, total pressure could exceed barometric pressure.

2.2. Definitions and Calculations

Bicarbonate ion concentration ([HCO3]) was calculated from pH and PCO2 modifying the Henderson-Hasselbalch equation
[ HCO 3 ] =   α   ×   PCO 2 × 10 pH pK
where α = 0.0307 mmol × L−1 × mmHg−1 (solubility of CO2 in plasma) [30,31] and pK = 6.129 (negative logarithm of the equilibrium constant) [31,32,33].
Plasma carbon dioxide content PRE and POST membrane lung (expressed in mmol × L−1) was calculated according to the method published by Douglas et al. [34]:
[ TCO 2 ] =   α   ×   PCO 2 × 1 + 10 pH pK
Carbon dioxide transfer across the membrane lung, V ˙ CO2 (in mL × min−1), was calculated from the transmembrane lung TCO2 difference [35]:
V ˙ CO 2 = ( TCO 2 PRE TCO 2 POST ] ×   blood   flow   × 25.45
where TCO2PRE represents CO2 content before the membrane lung while TCO2POST is the CO2 content after the membrane lung, blood flow is measured in L × min−1, and the conversion factor is in mL × mmol−1.

2.3. Safety and Feasibility Test

Possible macroscopic detrimental effects on the membrane lung were evaluated. The effect on CO2 removal of alkaline liquid ventilation at increasing concentrations of NaOH (10, 30, 60, 90, 100 mmol × L−1) and increasing ventilating flows (100, 250, 500, 1000 mL × min−1) was likewise evaluated. Each combination of NaOH concentration and sweep fluid flow was tested once and for 15 min. At the end of each step, PRE and POST blood samples were collected for blood gas analysis (BGA) (Radiometer abl800 flex, Copenhagen, Denmark).
In addition, the integrity of the oxygenator was evaluated through visual inspection of the membrane lung, evaluation of the presence of blood in the NaOH solution exiting the oxygenator, and through analysis of blood sodium, potassium, and methemoglobin as indirect markers of hemolysis. The time-course of methemoglobin was evaluated at 4 time points (15, 30, 45, and 60 min) while testing aqueous NaOH at different sweep flows during the efficiency and efficacy tests.
The CO2 removal efficiency was estimated by computing PCO2 differences across the membrane lung and V ˙ CO2.
At the end of the feasibility test, we selected the highest NaOH concentration endured by the membrane lung to perform the subsequent efficiency and efficacy tests.

2.4. Efficiency and Efficacy Tests

We performed six experiments with blood from 4 pigs. For each experiment, we tested, in random order, two different sweeping fluids, pure oxygen (FiO2 equal to 1) and aqueous NaOH at 100 mmol × L−1 (the concentration selected from the feasibility test). Four sweep flows (100, 250, 500, 1000 mL × min−1) for each fluid were randomly tested. We also randomized and tested 10 L/min of oxygen flow. Each combination of sweep fluid and flow was applied once during the single experiment.
The target PRE PCO2 was 60 ± 2 mmHg.
At the end of each step lasting about 15 min, we collected PRE and POST blood samples for BGA.
CO2 removal efficiency and efficacy were evaluated from PCO2 differences across the membrane lung and V ˙ CO2.
The highest CO2 removal achieved with alkaline liquid ventilation was compared with the CO2 removal achieved with conventional gaseous ventilation performed with 10 L × min−1 of oxygen.

2.5. Statistical Analysis

Data are reported as median and interquartile range (IQR). Two-way repeated measures ANOVA or two-way repeated measures ANOVA on ranks was used, as appropriate, to test safety, feasibility (PRE and POST values), and efficiency.
One-way repeated measures or Friedman repeated measures was used, as appropriate, to test safety and feasibility (POST–PRE differences) and to compare methemoglobin values at different time points.
Paired t-test or Wilcoxon signed rank test was used, as appropriate, to test efficacy. Post-hoc analyses were performed with Bonferroni or Tukey corrections. Statistical significance was defined as p < 0.05. Analysis was performed with SAS software 9.4 (SAS Institute, Inc., Cary, NC, USA) and SigmaPlot v.11.0 (Systat Software Inc, San Jose, CA, USA).

3. Results

3.1. Mathematical Modeling

The PCO2 of gas/oxygen or distilled water, in a closed system, at increasing concentrations of CO2 raises linearly, see Figure 2, although the slope is steeper in water relative to gas/oxygen. Instead, if NaOH is added to water, the solution PCO2 remains close to zero as long as the added CO2 is lower than the amount of added NaOH. When similar amounts of CO2 and NaOH are added, almost all CO2 reacts forming HCO3 and the solution pH is around 8.220–8.230.
Otherwise, if the added CO2 is lower than NaOH, carbonic acid dissociates to HCO3 which, due to the alkaline milieu, further dissociates to CO32−, thus reducing the concentration of HCO3. When CO2 is near half or lower than NaOH, almost all CO2 forms CO32− and the solution pH is above 11. Instead, if the TCO2 is higher than NaOH, all hydroxide reacts with CO2 forming HCO3 and the pH decreases below 8.
Interestingly when the added CO2 is higher than twice the NaOH, the PCO2 in the NaOH solution will be higher than the one in a similar gas volume containing the same amount of CO2.
For example, one liter of gas containing 200 mL (7.86 mmol) of CO2, the theoretical V ˙ CO2 of an adult, would have a PCO2 of 143 mmHg (713 mmHg × 0.2), while 1 L of water would have a higher PCO2 of 255 mmHg. On the contrary, the same amount of CO2 could be stored in 1 L of NaOH 10 mmol × min−1 solution with a PCO2 close to zero.

3.2. Feasibility and Safety Test

No detectable damages to the membrane lung were observed. Moreover, no blood was found in the sweep fluid exiting the oxygenator.
Figure 3 and Table 1 report the BGAs of PRE and POST blood. PCO2PRE was stable throughout the entire test, 59.0 (58.0–60.0) mmHg. Delta PCO2 across the membrane lung was significantly lower at 10 mmol × L−1 (−32.2 (−38.6–−23.1) mmHg). Otherwise, it showed small increases as NaOH concentration increases (−41.4 (−43.1–−36.8), −47.7 (−49.5–−44), −47.8 (−48.6–−47) and −48.2 (−48.4–−46.6) mmHg at 30, 60, 90, and 100 mmol × L−1 respectively). PCO2POST was reduced to about 12 mmHg with NaOH concentration ≥ 60 mmol × L−1 (12.0 (11.0–15.0), 11.4 (10.2–12.4) and 12.4 (11.3–13.1) mmHg at 60, 90, and 100 mmol × L−1 respectively), subsequently pHPOST increased up to 7.913 (7.885–7.943) at NaOH concentration equal to 100 mmol × L−1. The lowest V ˙ CO2 was also recorded at the lowest NaOH concentration 73.9 (54.3–91.8) mL × min−1. PRE blood sodium and potassium concentration were stable (see Supplementary Table S1 for details). POST chloride concentrations were higher than PRE values while sodium concentrations were lower. Moreover, a simultaneous decrease in potassium and calcium POST concentrations was observed. These results are similar to the observations of Langer et al. in couples of measurements of blood entering and leaving the ML in 20 critically ill patients [36]. Methemoglobin values were not different over the time during the experiments (median (IQR) values 1.100 (0.950–2.850) at 15 min, 1.100 (1.050–2.150) at 30 min, 1.100 (1.050–2.400) at 45 min, 1.200 (1.050–2.900) at 60 min; p = 0.606).
As the highest delta PCO2 was observed when 100 mmol × L−1 NaOH was used, this concentration was employed for the efficiency and efficacy tests.

3.3. Efficiency Test

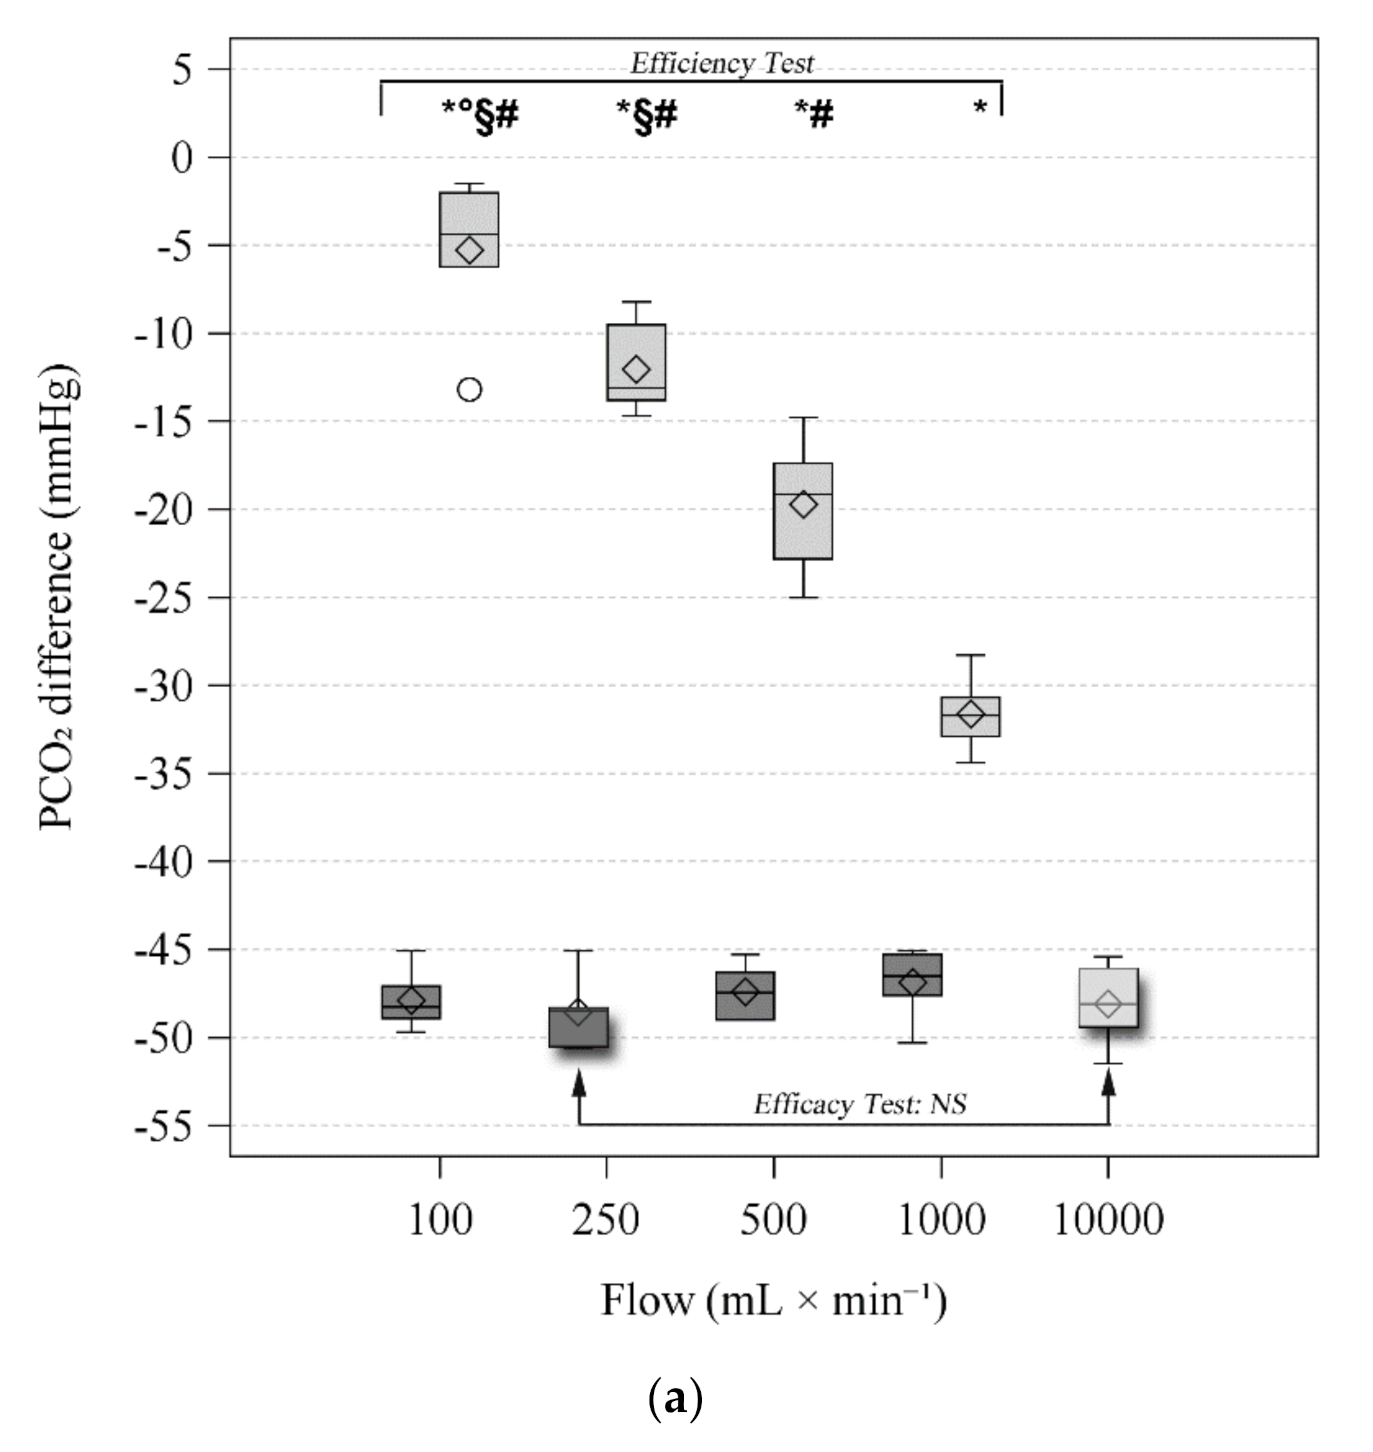
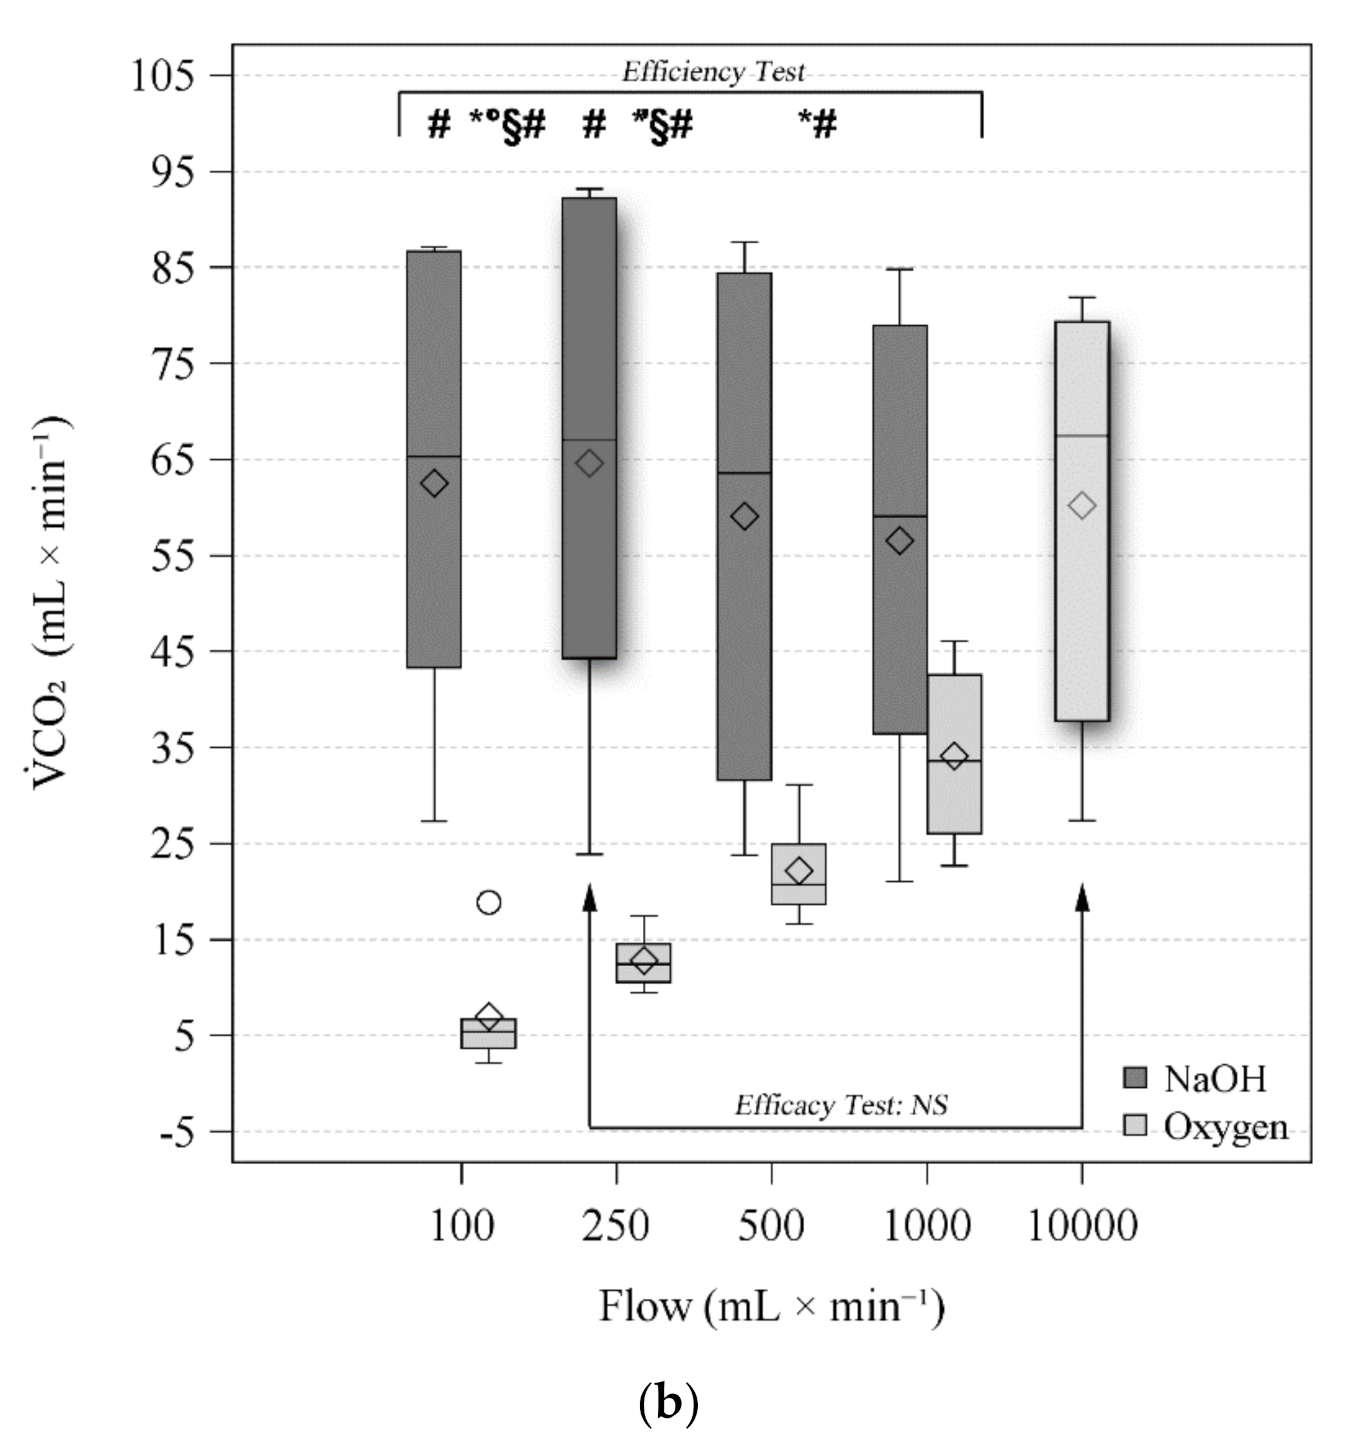
Blood gas analyses of PRE and POST blood with NaOH and oxygen are reported in Table 1. PCO2PRE was stable throughout the entire test, 59.6 (58.9–60.4) mmHg. Increasing oxygen flows showed increasing CO2 removal, both as delta PCO2 across the membrane lung and V ˙ CO2, see Figure 4. Conversely, all NaOH flows showed similar CO2 removal, except for a lower V ˙ CO2 at 1000 mL × min−1 compared to 100 and 250 mL × min−1 (see Figure 3). When comparing V ˙ CO2 achieved with liquid and gaseous ventilation, liquid ventilation achieved significantly higher CO2 removals for 100, 250, and 500 mL × min−1 of flow. On the contrary, while the median value was higher also for 1000 mL × min−1, this difference did not reach statistical significance.
Blood pHPOST increased, according to the PCO2 reduction, reaching values as high as 7.987 with NaOH at 250 mL × min−1.
PO2PRE was stable around 141.0 (137.0–147.0) mmHg both during NaOH and oxygen steps while PO2POST increased up to 470.5 (452.3–507.0) mmHg only during oxygenation use, while it remained unchanged during liquid ventilation.
Blood electrolytes and lactate concentrations were stable throughout the experiment.

3.4. Efficacy Tests

In agreement with the highest V ˙ CO2 and delta PCO2, NaOH 250 mL × min−1 was selected as the most performant NaOH flow and compared with 10 L × min−1 of oxygen in the efficacy test. Table 2 reports blood gas analyses of PRE and POST blood. Both delta PCO2 and V ˙ CO2 were similar, suggesting similar extracorporeal CO2 removal (Figure 4, shadowed boxes).

4. Discussion

This in-vitro study shows that continuous infusion (from 100 to 1000 mL × min−1) of highly concentrated sodium hydroxide solutions into the gas side of conventional polypropylene oxygenators is feasible, despite pH values of the sweeping solution above 12. At low sweep flows, alkaline liquid ventilation showed significantly higher CO2 removal capacity than conventional gaseous ventilation. However, the maximum CO2 removal efficiency achieved through liquid ventilation was not superior to the one achieved with 10 L × min−1 of sweep gas flow.
The working hypothesis underlying this study was to exploit the high CO2 absorbing capacity of NaOH solutions. Indeed, in our experimental context, the concentration of NaOH was always significantly higher than the amount of CO2 extracted from the ML. The PCO2 of the alkaline sweep fluid was persistently very close to 0 mmHg, as the added CO2 was instantly hydrated and dissociated to bicarbonate and carbonate. This allowed to keep the PCO2 close to zero and thus optimize the transmembrane PCO2 gradient, favoring the efficiency of extracorporeal CO2 removal.
Indeed, a solution containing 10 mEq of NaOH could absorb 200 mL of CO2 while maintaining PCO2 close to zero. On the contrary, the same amount of CO2 added to 10 L of gas would result in a PCO2 around 15 mmHg, therefore reducing the blood-gas CO2 gradient.
However, the data showed that increasing NaOH flow did not lead to a linear increase in CO2 removal. Instead, for NaOH flows greater than 250 mL × min there was an unexpected reduction in CO2 removal. This reduced efficiency could depend on the density of the sodium hydroxide solution and the mechanics of the membrane lung. Therefore, a clinical application of alkaline liquid ventilation does not seem exploitable using the current technology. The technical complexity and safety profile require further evaluations, although the present tests have recorded no damage to the membrane lung.
Another important difference between gaseous and liquid ventilation needs to be discussed. Although the oxygenation capacity of low-flow devices using conventional gaseous ventilation is limited by the amount of blood reaching the ML, a certain amount of oxygen is added to the blood. On the contrary, the NaOH infusion does not oxygenate the extracorporeal blood, limiting its potential clinical application to patients with isolated hypercapnic respiratory failure, i.e., able to oxygenate properly through their native lungs.
Although devices with higher CO2 extraction capacity resulted more effective [3,9,10], numerous studies confirm the ability of ECCO2R to achieve physiological targets. Nevertheless, the clinical application of ECCO2R is still limited and no conclusive indications have been identified mainly because of safety concerns [37,38]. Indeed, a consistently high rate of complications has been reported, mostly related to hemolysis, bleeding, and thrombosis. In this context, the present study aim was to achieve a highly efficient ECCO2R technique to ensure a clinical efficacy with limited extracorporeal blood flows, potentially enabling regional anticoagulation [39,40]. The tested technology, which was not developed for alkaline liquid ventilation, did not meet such expectations. However, we cannot exclude that a dedicated device could achieve more satisfying results.
This study presents several limitations. First, we could not perform any gas analysis of the sodium hydroxide solution. The CO2 extraction capacity was estimated both as differences in PCO2 and TCO2 between the blood samples upstream and downstream of the artificial lung [41]. V ˙ CO2 showed higher variability than PCO2, as shown in Figure 4, possibly due to the baseline different blood composition. Indeed, we can speculate that this phenomenon may be explained by the wide range in hemoglobin concentrations (see Table 1), which affects the ML V ˙ CO2 [42]. Secondly, the alkaline liquid ventilation was tested only in vitro and for a limited time consequently we cannot exclude different effects and safety issues in vivo scenarios. Thirdly, we only tested one type of polypropylene membrane lung. Further tests with different devices may be required.

5. Conclusions

This in-vitro study showed that ECCO2R through alkaline liquid ventilation of the ML is feasible and safe. The CO2 removal efficiency of alkaline liquid ventilation was higher than conventional gaseous ML ventilation only for low sweep flows. Indeed, at high sweep gas flow, the CO2 removal efficiency was comparable between the two techniques.
The development of a dedicated device may be necessary to exploit the potential of this technology. Further studies will be required before any possible clinical application.

Supplementary Materials

The following are available online at https://www.mdpi.com/article/10.3390/membranes11070464/s1, The Online Supplement: Alkaline_liquid_ventilation_online_supplement.docx.

Author Contributions

Conceptualization, T.L., A.P. and A.Z.; methodology, L.V., M.B., C.V. and S.M.C.; software, E.C.; formal analysis, L.V., E.C, G.F. and A.Z.; investigation, L.V., M.B., C.V., S.T. and S.G.; data curation, L.V., E.C. and A.Z.; writing—original draft preparation, L.V., E.C., T.L., G.G. and A.Z.; writing—review and editing, all authors; supervision, S.G., A.P. and G.G.; project administration, A.Z.; funding acquisition, A.P. and A.Z. All authors have read and agreed to the published version of the manuscript.

Funding

This study was funded by the project “Optimization of extracorporeal carbon dioxide removal through blood acidification: development of new technologies” cod. GR-2013-02356711.

Institutional Review Board Statement

Not applicable as the study does not involve neither humans nor animals. Blood collection, transport, handling and treatment was done according to regulation (EC) No 1069/2009 of the European Parliament and of the Council of 21 October 2009 laying down health rules as regards animal by-products and derived products not intended for human consumption. Authorization number 0141051/19 provided by ATS Milano, Regione Lombardia.

Informed Consent Statement

Not applicable.

Data Availability Statement

The dataset used and/or analyzed during the current study are available from the corresponding author on reasonable request.

Acknowledgments

We thank Marina Leonardelli (Fondazione IRCCS Ca’ Granda Ospedale Maggiore Policlinico) and Patrizia Minunno (Fondazione IRCCS Ca’ Granda Ospedale Maggiore Policlinico) for administrative support. Andrea Carlin (University of Milan) for technical support. We thank “Macello Bosia” for their valuable help. Membrane lungs used for the experiments were provided by Getinge, Sweden. We thank Anna Pia Catania (Center for Preclinical Research, Fondazione IRCCS Ca’ Granda Ospedale Maggiore Policlinico, via Pace 9, 20122 Milan, Italy; Emeritus, Italy) for proofreading the article.

Conflicts of Interest

Grasselli reported personal fees and nonfinancial support from Getinge and from Biotest, personal fees from Thermofisher, grants and personal fees from Fisher&Paykel, and personal fees from Draeger Medical outside the submitted work. Pesenti reported personal fees from Maquet, from Novalung/Xenios, from Baxter, and from Boehringer Ingelheim outside the submitted work. Zanella and Pesenti are inventors to patents licensed to Fresenius. The authors certify that they have no affiliations with, or involvement in any organization or entity with any financial or non-financial interest in the subject matter discussed in this manuscript.

Abbreviations

ACD, anticoagulant-citrate-dextrose; ARDS acute respiratory distress syndrome; Ca++, calcium; Cl, chloride; CO2, carbon dioxide; CO32−, carbonate; COPD, chronic obstructive pulmonary disease; ECCO2R, extracorporeal carbon dioxide removal; H2CO3, carbonic acid; H2O, water; Hb, hemoglobin; HCO3, bicarbonate; IQR, interquartile range; K+, potassium; Lac, Lactate; ML, membrane lung; Na+, sodium; Na2CO3, sodium carbonate; NaHCO3, sodium bicarbonate; NaOH, sodium hydroxide; PaCO2, arterial partial pressure of CO2; PCO2, partial pressure of carbon dioxide; PO2, partial pressure of oxygen; TCO2, total CO2 content; V ˙ CO2, amount of carbon dioxide removed by the membrane lung in one minute.

References

  1. Kolobow, T.; Gattinoni, L.; Tomlinson, T.A.; Pierce, J.E. Control of breathing using an extracorporeal membrane lung. Anesthesiology 1977, 46, 138–141. [Google Scholar] [CrossRef]
  2. Terragni, P.P.; Del Sorbo, L.; Mascia, L.; Urbino, R.; Martin, E.L.; Birocco, A.; Faggiano, C.; Quintel, M.; Gattinoni, L.; Ranieri, V.M. Tidal volume lower than 6 ml/kg enhances lung protection: Role of extracorporeal carbon dioxide removal. Anesthesiology 2009, 111, 826–835. [Google Scholar] [CrossRef] [PubMed] [Green Version]
  3. Combes, A.; Fanelli, V.; Pham, T.; Ranieri, V.M. European Society of Intensive Care Medicine Trials Group; the “Strategy of Ultra-Protective lung ventilation with Extracorporeal CO2 Removal for New-Onset moderate to severe ARDS” (SUPERNOVA) investigators. Feasibility and safety of extracorporeal CO2 removal to enhance protective ventilation in acute respiratory distress syndrome: The SUPERNOVA study. Intensive Care Med. 2019, 45, 592–600. [Google Scholar] [CrossRef] [Green Version]
  4. Cipriani, E.; Langer, T.; Bottino, N.; Brusatori, S.; Carlesso, E.; Colombo, S.M.; Zanella, A.; Pesenti, A.; Grasselli, G. Key Role of Respiratory Quotient to Reduce the Occurrence of Hypoxemia During Extracorporeal Gas Exchange: A Theoretical Analysis. Crit. Care Med. 2020, 48, e1327–e1331. [Google Scholar] [CrossRef] [PubMed]
  5. Kluge, S.; Braune, S.A.; Engel, M.; Nierhaus, A.; Frings, D.; Ebelt, H.; Uhrig, A.; Metschke, M.; Wegscheider, K.; Suttorp, N.; et al. Avoiding invasive mechanical ventilation by extracorporeal carbon dioxide removal in patients failing noninvasive ventilation. Intensive Care Med. 2012, 38, 1632–1639. [Google Scholar] [CrossRef] [PubMed]
  6. d’Andrea, A.; Banfi, C.; Bendjelid, K.; Giraud, R. The use of extracorporeal carbon dioxide removal in acute chronic obstructive pulmonary disease exacerbation: A narrative review. Can. J. Anaesth. 2020, 67, 462–474. [Google Scholar] [CrossRef]
  7. Grasselli, G.; Castagna, L.; Bottino, N.; Scaravilli, V.; Corcione, N.; Guzzardella, A.; Bonifazi, M.; Rossi, N.; Zanella, A.; Pesenti, A. Practical Clinical Application of an Extracorporeal Carbon Dioxide Removal System in Acute Respiratory Distress Syndrome and Acute on Chronic Respiratory Failure. ASAIO J. 2020, 66, 691–697. [Google Scholar] [CrossRef]
  8. Schellongowski, P.; Riss, K.; Staudinger, T.; Ullrich, R.; Krenn, C.G.; Sitzwohl, C.; Bojic, A.; Wohlfarth, P.; Sperr, W.R.; Rabitsch, W.; et al. Extracorporeal CO2 removal as bridge to lung transplantation in life-threatening hypercapnia. Transpl. Int. 2015, 28, 297–304. [Google Scholar] [CrossRef]
  9. Combes, A.; Tonetti, T.; Fanelli, V.; Pham, T.; Pesenti, A.; Mancebo, J.; Brodie, D.; Ranieri, V.M. Efficacy and safety of lower versus higher CO2 extraction devices to allow ultraprotective ventilation: Secondary analysis of the SUPERNOVA study. Thorax 2019, 74, 1179–1181. [Google Scholar] [CrossRef]
  10. Goligher, E.C.; Combes, A.; Brodie, D.; Ferguson, N.D.; Pesenti, A.M.; Ranieri, V.M.; Slutsky, A.S.; SUPERNOVA Investigators (European Society of Intensive Care Medicine Trials Group); International ECMO Network (ECMONet). Determinants of the effect of extracorporeal carbon dioxide removal in the SUPERNOVA trial: Implications for trial design. Intensive Care Med. 2019, 45, 1219–1230. [Google Scholar] [CrossRef] [PubMed]
  11. Karagiannidis, C.; Strassmann, S.; Brodie, D.; Ritter, P.; Larsson, A.; Borchardt, R.; Windisch, W. Impact of membrane lung surface area and blood flow on extracorporeal CO2 removal during severe respiratory acidosis. Intensive Care Med. Exp. 2017, 5, 34. [Google Scholar] [CrossRef] [PubMed] [Green Version]
  12. Morelli, A.; Del Sorbo, L.; Pesenti, A.; Ranieri, V.M.; Fan, E. Extracorporeal carbon dioxide removal (ECCO2R) in patients with acute respiratory failure. Intensive Care Med. 2017, 43, 519–530. [Google Scholar] [CrossRef] [PubMed]
  13. Karagiannidis, C.; Kampe, K.A.; Sipmann, F.S.; Larsson, A.; Hedenstierna, G.; Windisch, W.; Mueller, T. Veno-venous extracorporeal CO2 removal for the treatment of severe respiratory acidosis: Pathophysiological and technical considerations. Crit. Care 2014, 18, R124. [Google Scholar] [CrossRef] [Green Version]
  14. Duscio, E.; Cipulli, F.; Vasques, F.; Collino, F.; Rapetti, F.; Romitti, F.; Behnemann, T.; Niewenhuys, J.; Tonetti, T.; Pasticci, I.; et al. Extracorporeal CO2 Removal: The Minimally Invasive Approach, Theory, and Practice. Crit. Care Med. 2019, 47, 33–40. [Google Scholar] [CrossRef]
  15. Di Nardo, M.; Annoni, F.; Su, F.; Belliato, M.; Lorusso, R.; Broman, L.M.; Malfertheiner, M.; Creteur, J.; Taccone, F.S. Evaluation of a New Extracorporeal CO2 Removal Device in an Experimental Setting. Membranes 2020, 11, 8. [Google Scholar] [CrossRef] [PubMed]
  16. Epis, F.; Belliato, M. Oxygenator performance and artificial-native lung interaction. J. Thorac. Dis. 2018, 10, S596–S605. [Google Scholar] [CrossRef] [PubMed]
  17. Livigni, S.; Maio, M.; Ferretti, E.; Longobardo, A.; Potenza, R.; Rivalta, L.; Selvaggi, P.; Vergano, M.; Bertolini, G. Efficacy and safety of a low-flow veno-venous carbon dioxide removal device: Results of an experimental study in adult sheep. Crit. Care 2006, 10, R151. [Google Scholar] [CrossRef] [Green Version]
  18. Cove, M.E.; MacLaren, G.; Federspiel, W.J.; Kellum, J.A. Bench to bedside review: Extracorporeal carbon dioxide removal, past present and future. Crit. Care 2012, 16, 232. [Google Scholar] [CrossRef] [Green Version]
  19. Jeffries, R.G.; Mussin, Y.; Bulanin, D.S.; Lund, L.W.; Kocyildirim, E.; Zhumadilov, Z.; Olzhayev, F.S.; Federspiel, W.J.; Wearden, P.D. Pre-clinical evaluation of an adult extracorporeal carbon dioxide removal system with active mixing for pediatric respiratory support. Int. J. Artif. Organs 2014, 37, 888–899. [Google Scholar] [CrossRef] [Green Version]
  20. Arazawa, D.T.; Kimmel, J.D.; Finn, M.C.; Federspiel, W.J. Acidic sweep gas with carbonic anhydrase coated hollow fiber membranes synergistically accelerates CO2 removal from blood. Acta Biomater 2015, 25, 143–149. [Google Scholar] [CrossRef] [Green Version]
  21. May, A.G.; Orizondo, R.A.; Frankowski, B.J.; Ye, S.H.; Kocyildirim, E.; Wagner, W.R.; D’Cunha, J.; Federspiel, W.J. In vivo testing of the low-flow CO2 removal application of a compact, platform respiratory device. Intensive Care Med. Exp. 2020, 8, 45. [Google Scholar] [CrossRef]
  22. Cressoni, M.; Zanella, A.; Epp, M.; Corti, I.; Patroniti, N.; Kolobow, T.; Pesenti, A. Decreasing pulmonary ventilation through bicarbonate ultrafiltration: An experimental study. Crit. Care Med. 2009, 37, 2612–2618. [Google Scholar] [CrossRef] [PubMed]
  23. Zanella, A.; Patroniti, N.; Isgro, S.; Albertini, M.; Costanzi, M.; Pirrone, F.; Scaravilli, V.; Vergnano, B.; Pesenti, A. Blood acidification enhances carbon dioxide removal of membrane lung: An experimental study. Intensive Care Med. 2009, 35, 1484–1487. [Google Scholar] [CrossRef]
  24. Zanella, A.; Mangili, P.; Giani, M.; Redaelli, S.; Scaravilli, V.; Castagna, L.; Sosio, S.; Pirrone, F.; Albertini, M.; Patroniti, N.; et al. Extracorporeal carbon dioxide removal through ventilation of acidified dialysate: An experimental study. J. Heart Lung Transpl. 2014, 33, 536–541. [Google Scholar] [CrossRef] [PubMed]
  25. Zanella, A.; Mangili, P.; Redaelli, S.; Scaravilli, V.; Giani, M.; Ferlicca, D.; Scaccabarozzi, D.; Pirrone, F.; Albertini, M.; Patroniti, N.; et al. Regional blood acidification enhances extracorporeal carbon dioxide removal: A 48-hour animal study. Anesthesiology 2014, 120, 416–424. [Google Scholar] [CrossRef]
  26. Scaravilli, V.; Kreyer, S.; Linden, K.; Belenkiy, S.; Pesenti, A.; Zanella, A.; Cancio, L.C.; Batchinsky, A.I. Enhanced Extracorporeal CO2 Removal by Regional Blood Acidification: Effect of Infusion of Three Metabolizable Acids. ASAIO J. 2015, 61, 533–539. [Google Scholar] [CrossRef] [PubMed]
  27. Zanella, A.; Castagna, L.; Salerno, D.; Scaravilli, V.; Abd El Aziz El Sayed Deab, S.; Magni, F.; Giani, M.; Mazzola, S.; Albertini, M.; Patroniti, N.; et al. Respiratory Electrodialysis. A Novel, Highly Efficient Extracorporeal CO2 Removal Technique. Am. J. Respir. Crit. Care Med. 2015, 192, 719–726. [Google Scholar] [CrossRef] [Green Version]
  28. Abrams, D.; Bacchetta, M.; Brodie, D. When the momentum has gone: What will be the role of extracorporeal lung support in the future? Curr. Opin. Crit. Care 2018, 24, 23–28. [Google Scholar] [CrossRef]
  29. Boyle, A.J.; Sklar, M.C.; McNamee, J.J.; Brodie, D.; Slutsky, A.S.; Brochard, L.; McAuley, D.F.; International, E.N. Extracorporeal carbon dioxide removal for lowering the risk of mechanical ventilation: Research questions and clinical potential for the future. Lancet Respir. Med. 2018, 6, 874–884. [Google Scholar] [CrossRef] [Green Version]
  30. Austin, W.H.; Lacombe, E.; Rand, P.W.; Chatterjee, M. Solubility of carbon dioxide in serum from 15 to 38 C. J. Appl. Physiol. 1963, 18, 301–304. [Google Scholar] [CrossRef]
  31. Constable, P.D. Total weak acid concentration and effective dissociation constant of nonvolatile buffers in human plasma. J. Appl. Physiol. 2001, 91, 1364–1371. [Google Scholar] [CrossRef] [PubMed]
  32. Harned, H.S.; Bonner, F.T. The First Ionization of Carbonic Acid in Aqueous Solutions of Sodium Chloride. J. Am. Chem. Soc. 1945, 67, 1026–1031. [Google Scholar] [CrossRef]
  33. Putnam, R.W.; Roos, A. Which value for the first dissociation constant of carbonic acid should be used in biological work? Am. J. Physiol. 1991, 260, C1113–C1116. [Google Scholar] [CrossRef] [PubMed]
  34. Douglas, A.R.; Jones, N.L.; Reed, J.W. Calculation of whole blood CO2 content. J. Appl. Physiol. 1988, 65, 473–477. [Google Scholar] [CrossRef]
  35. Barrett, N.A.; Hart, N.; Camporota, L. In vivo carbon dioxide clearance of a low-flow extracorporeal carbon dioxide removal circuit in patients with acute exacerbations of chronic obstructive pulmonary disease. Perfusion 2020, 35, 436–441. [Google Scholar] [CrossRef] [PubMed]
  36. Langer, T.; Scotti, E.; Carlesso, E.; Protti, A.; Zani, L.; Chierichetti, M.; Caironi, P.; Gattinoni, L. Electrolyte shifts across the artificial lung in patients on extracorporeal membrane oxygenation: Interdependence between partial pressure of carbon dioxide and strong ion difference. J. Crit. Care 2015, 30, 2–6. [Google Scholar] [CrossRef] [Green Version]
  37. Mauri, T.; Langer, T.; Zanella, A.; Grasselli, G.; Pesenti, A. Extremely high transpulmonary pressure in a spontaneously breathing patient with early severe ARDS on ECMO. Intensive Care Med. 2016, 42, 2101–2103. [Google Scholar] [CrossRef]
  38. Augy, J.L.; Aissaoui, N.; Richard, C.; Maury, E.; Fartoukh, M.; Mekontso-Dessap, A.; Paulet, R.; Anguel, N.; Blayau, C.; Cohen, Y.; et al. A 2-year multicenter, observational, prospective, cohort study on extracorporeal CO2 removal in a large metropolis area. J. Intensive Care 2019, 7, 45. [Google Scholar] [CrossRef] [Green Version]
  39. Sharma, A.S.; Weerwind, P.W.; Bekers, O.; Wouters, E.M.; Maessen, J.G. Carbon dioxide dialysis in a swine model utilizing systemic and regional anticoagulation. Intensive Care Med. Exp. 2016, 4, 2. [Google Scholar] [CrossRef] [Green Version]
  40. Morimont, P.; Habran, S.; Desaive, T.; Blaffart, F.; Lagny, M.; Amand, T.; Dauby, P.; Oury, C.; Lancellotti, P.; Hego, A.; et al. Extracorporeal CO2 removal and regional citrate anticoagulation in an experimental model of hypercapnic acidosis. Artif. Organs 2019, 43, 719–727. [Google Scholar] [CrossRef]
  41. Hospach, I.; Goldstein, J.; Harenski, K.; Laffey, J.G.; Pouchoulin, D.; Raible, M.; Votteler, S.; Storr, M. In vitro characterization of PrismaLung+: A novel ECCO2R device. Intensive Care Med. Exp. 2020, 8, 14. [Google Scholar] [CrossRef] [PubMed]
  42. May, A.G.; Omecinski, K.S.; Frankowski, B.J.; Federspiel, W.J. Effect of Hematocrit on the CO2 Removal Rate of Artificial Lungs. ASAIO J. 2020, 66, 1161–1165. [Google Scholar] [CrossRef] [PubMed]
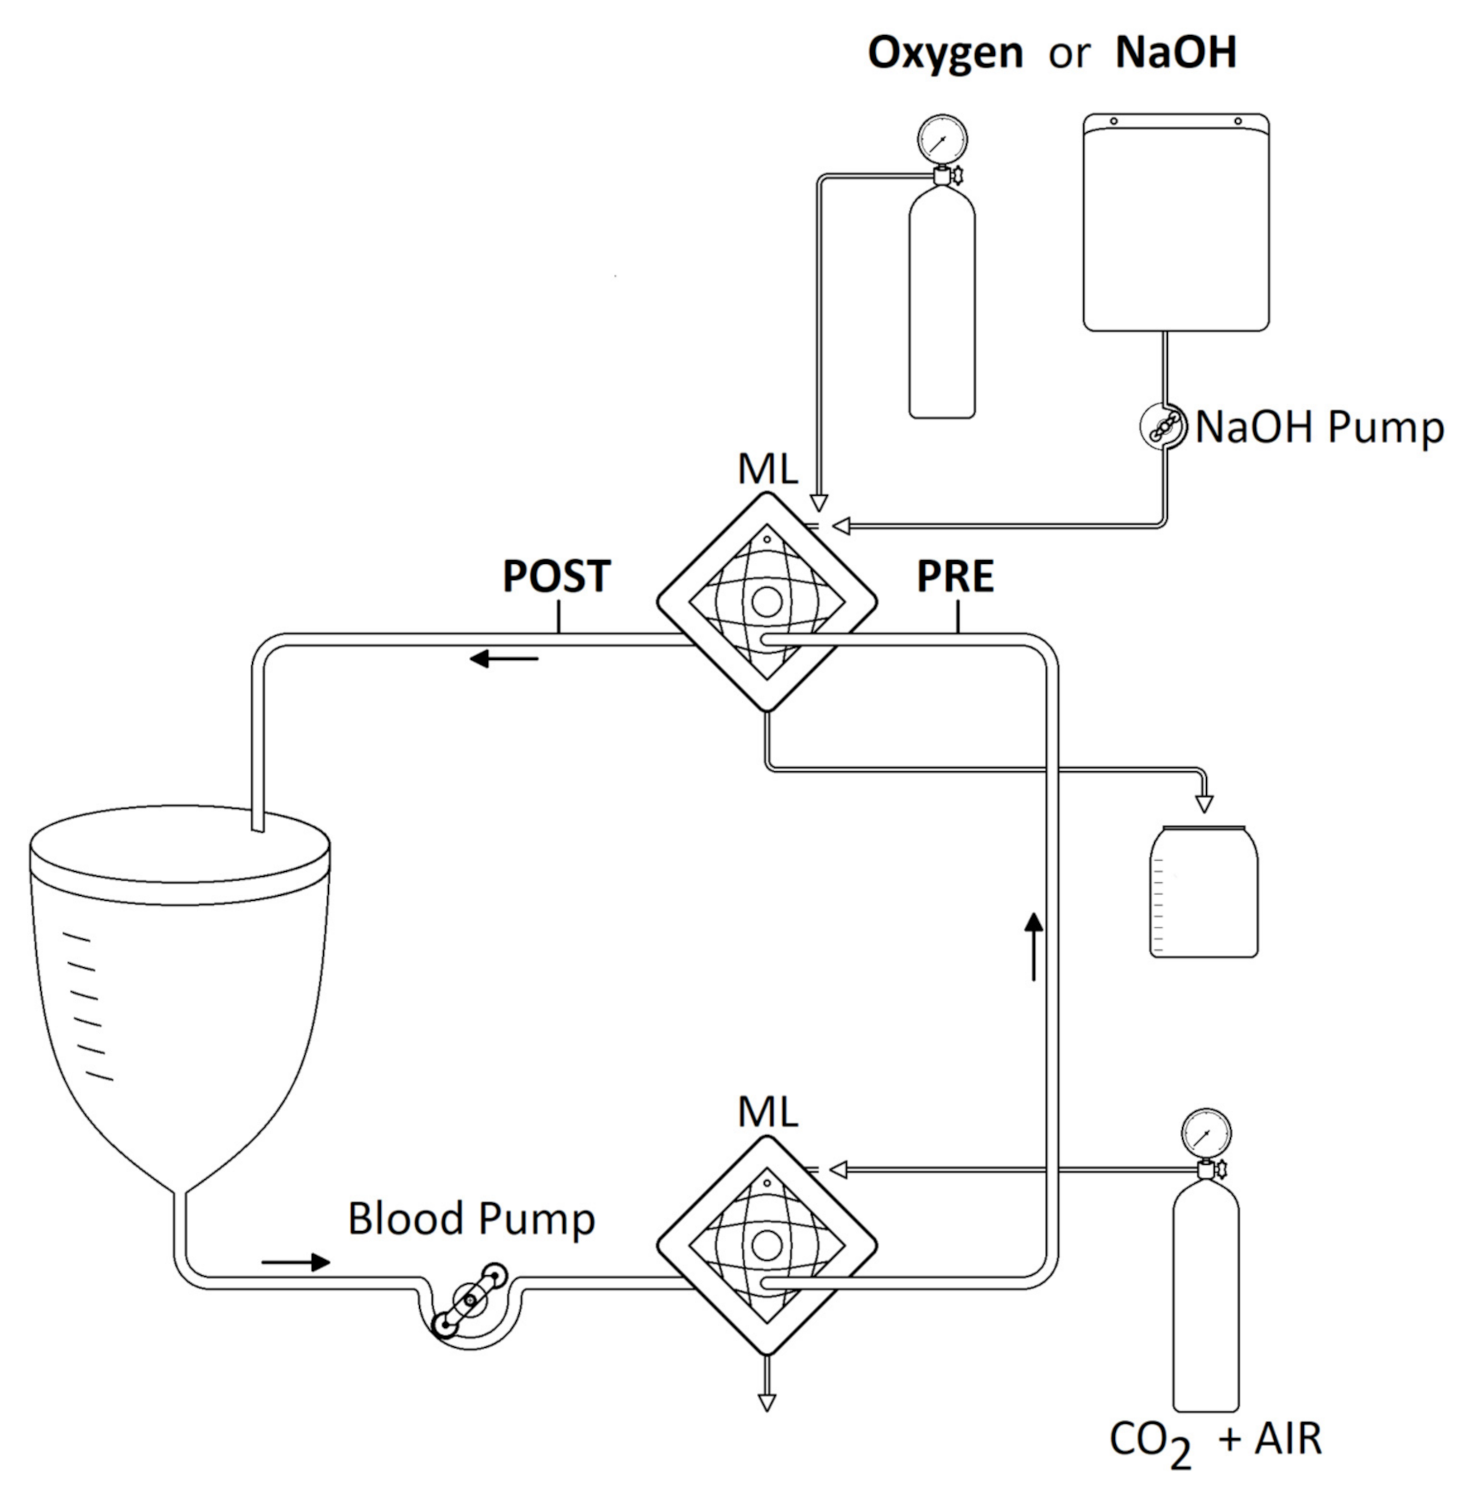
Figure 1. Schematic representation of the extracorporeal circuit. ML: membrane lung; PRE: blood sampling access upstream the ML for ECCO2R; POST: blood sampling access downstream the ML for ECCO2R.
Membranes 11 00464 g001
Figure 2. Simulated effects of increasing TCO2 from 0 to 100 by 5 mmol × L−1 in a closed system with aqueous NaOH at varying concentrations (from 0 (water) to 100 by 20 mmol × L−1). Panel (a) represents pH; panel (b) represents PCO2, the orange line with red squares represents PCO2 values of one closed liter of oxygen/gas containing increasing TCO2; panel (c) represents HCO3; panel (d) represents CO32−. Abbreviations: PCO2, partial pressure of carbon dioxide; HCO3, bicarbonate; CO32−, carbonate; TCO2, total CO2 content.
Membranes 11 00464 g002
Figure 3. Figures display the distribution of data by using a rectangular box plot and whiskers, the bottom and top edges of the box indicate the intra-quartile range (IQR) between the first and third quartiles (the 25th and 75th percentiles). The diamond marker inside the box indicates the mean value. The line inside the box indicates the median value. Whiskers indicate the range of values outside of the intra-quartile range but at a distance lower than the upper and lower fences (±1.5 × IQR). Dark grey represents PRE blood sampling. Light grey represents POST blood sampling. Statistical analysis: Two-way ANOVA RM (TCO2) or two-way ANOVA RM on ranks (pH and PCO2). * p < 0.05 vs. PRE; ° p < 0.05 vs. 30; § p < 0.05 vs. 60; || p < 0.05 vs. 90; # p < 0.05 vs. 100. (a) pH distribution according at different NaOH concentrations; (b) PCO2 (partial pressure of carbon dioxide) distribution at different NaOH concentrations. (c) TCO2 (Carbon dioxide content) distribution at different NaOH concentrations.
Membranes 11 00464 g003aMembranes 11 00464 g003b
Figure 4. Figures display the distribution of data by using a rectangular box plot and whiskers, the bottom and top edges of the box indicate the intra-quartile range (IQR) between the first and third quartiles (the 25th and 75th percentiles). The diamond marker inside the box indicates the mean value. The line inside the box indicates the median value. Whiskers indicate the range of values outside of the intra-quartile range but at a distance lower than the upper and lower fences (±1.5 × IQR) Dots represent outliers (observations that are more extreme than the upper and lower fences). Dark grey represents NaOH at 100 mmol × L−1 concentration. Light grey represents Oxygen. Efficiency test statistical analysis: Two-way ANOVA RM. * p < 0.05 vs. NaOH; ° p < 0.05 vs. 250 mL × min−1; § p < 0.05 vs. 500 mL × min−1; # p < 0.05 vs. 1000 mL × min−1. Efficacy test statistical analysis: Paired t-test between NaOH at 100 mmol × L−1 concentration and 250 mL × min−1 sweep flow and oxygen at 1000 mL × min−1 sweep flow (boxes highlighted by outside shadow and arrows). (a) PCO2 (partial pressure of carbon dioxide) difference (POST values–PRE values) distribution according to different sweep flows of NaOH and Oxygen. (b) V ˙ CO2 (Carbon dioxide transfer across the membrane lung) distribution according to different sweep flows of NaOH and Oxygen.
Membranes 11 00464 g004aMembranes 11 00464 g004b
Table 1. Efficiency tests results.
Variable VentilationFlow (L × min−1)p Vent.p Flowp Int.
1002505001000
pHPRE $NaOH7.346 (7.337–7.374)7.351 (7.333–7.359)7.356 (7.333–7.363)7.336 (7.334–7.366)0.0270.9990.020
O27.325 (7.306–7.333) *7.313 (7.311–7.349) *7.321 (7.301–7.34) *7.325 (7.318–7.346)
POST $NaOH7.972 (7.968–8.057) #7.987 (7.977–8.077) §#7.964 (7.932–8.040)7.938 (7.902–8.008)<0.001<0.001<0.001
O27.352 (7.333–7.379) *°§#7.405 (7.374–7.439) *§#7.481 (7.435–7.514) *#7.616 (7.612–7.654) *
Difference $NaOH0.628 (0.597–0.683) #0.643 (0.624–0.718) §#0.606 (0.597–0.673)0.591 (0.565–0.635)<0.001<0.001<0.001
O20.028 (0.011–0.041) *°§#0.094 (0.063–0.101) *§#0.145 (0.124–0.186) *#0.295 (0.268–0.326) *
PCO2
(mmHg)
PRENaOH59.7 (59.2–60.1)59.5 (59.0–59.7)59.4 (58.4–60.2)60.0 (59.2–60.4)0.9090.8820.332
O259.0 (58.4–59.9)59.0 (58.7–60.5)60.6 (59.0–61.0)59.7 (59.5–59.8)
POSTNaOH11.2 (11.0–13.0)10.5 (10.3–11.1)11.7 (11.3–12.1)13.1 (12.8–13.1)<0.001<0.001<0.001
O254.6 (53.7–56.2) *°§#46.2 (45.4–49.7) *§#40.4 (39.0–41.6) *#28.2 (26.9–29.1) *
DifferenceNaOH−48.3 (−48.9–−47.1)−48.5 (−50.5–−48.3)−47.5 (−49.0–−46.3)−46.5 (−47.6–−45.3)<0.001<0.001<0.001
O2−4.4 (−6.2–−2.0) *°§#−13.1 (−13.8–−9.5) *§#−19.1 (−22.8–−17.4) *#−31.7 (−32.9–−30.7) *
PO2
(mmHg)
PRENaOH138.0 (136.0–139.0) #137.0 (137.0–143.0) #137.5 (136.0–146.0)141.5 (137.0–153.0)0.2310.4600.002
O2144.0 (141.0–162.0)143.0 (140.0–159.0)143.5 (138.0–156.0)143.0 (139.0–154.0)
POST $NaOH125.0 (120.0–130.0)§#130.5 (128.0–140.0) #148.5 (142.0–157.0)161.5 (159.0–169.0)<0.001<0.0010.700
O2595.5 (591.0–602.0) *§#608.5 (603.0–623.0) *#616.0 (611.0.–6260) *#648.0 (632.0–654.0) *
DifferenceNaOH−13.0 (−16.0— −11.0)§#−6.5 (−9.0–−3.0) §#9.0 (6.0–11.0) #18.0 (14.0–21.0)<0.001<0.0010.105
O2451.5 (429.0–461.0) *§#455.5 (445.0–471.0) *§#462.5 (453.0–477.0) *#497.5 (487.0–508.0) *
K+
(mEq × L−1)
PRENaOH4.1 (4.0–4.4)4.1 (4.1–4.5)4.2 (4.1–4.4)4.2 (4.1–4.5)0.1270.5940.299
O24.1 (3.9–4.2)4.0 (4.0–4.2)4.0 (4.0–4.2)4.1 (4.0–4.2)
POSTNaOH4.1 (4.0–4.3)4.1 (4.0–4.4)4.1 (4.0–4.3)4.1 (4.0–4.4)0.2650.7090.363
O24.1 (3.9–4.2)4.0 (4.0–4.2)4.0 (4.0–4.1)4.0 (3.9–4.2)
DifferenceNaOH0.0 (0.0–0.1)0.1 (0.0–0.1)0.1 (0.1–0.1)0.1 (0.1–0.1)0.0090.3370.86
O20.0 (0.0–0.0) *0.0 (0.0–0.0) *0.0 (0.0–0.0) *0.0 (0.0–0.1) *
Na+
(mEq × L−1)
PRENaOH143.0 (142.0–144.0)143.0 (143.0–144.0)143.5 (142.0–145.0)143.5 (143.0–144.0)0.0380.2330.973
O2139.0 (138.0–143.0) *139.0 (139.0–143.0) *139.5 (138.0–144.0) *139.5 (138.0–145.0) *
POSTNaOH141.0 (139.0–142.0)140.0 (140.0–142.0)140.5 (140.0–141.0)141.5 (140.0–142.0)0.4070.5240.096
O2139.0 (138.0–143.0)138.5 (137.0–143.0)139.0 (138.0–143.0)138.5 (137.0–143.0)
DifferenceNaOH−2.0 (−3.0–−2.0)−3.0 (−3.0–−2.0)−3.0 (−4.0–−2.0)−2.0 (−3.0–−2.0)<0.0010.2150.012
O20.0 (0.0–0.0) *#−1.0 (−1.0–0.0) *−1.0 (−1.0–−1.0) *−1.0 (−1.0–−1.0) *
Ca++
(mEq × L−1)
PRENaOH1.3 (1.3–1.4)1.4 (1.3–1.4)1.4 (1.3–1.4)1.4 (1.3–1.4)0.7550.8540.769
O21.4 (1.2–1.4)1.3 (1.2–1.4)1.3 (1.2–1.4)1.3 (1.2–1.4)
POSTNaOH1.2 (1.1–1.3)1.2 (1.1–1.2)1.2 (1.2–1.3)1.2 (1.2–1.3)0.0660.110<0.001
O21.4 (1.2–1.4) *§#1.3 (1.2–1.4) *§#1.3 (1.2–1.3)1.3 (1.2–1.3)
Difference $NaOH−0.1 (−0.1–−0.1)−0.2 (−0.2–−0.1)−0.1 (−0.1–−0.1)−0.1 (−0.1–−0.1)<0.0010.0320.002
O20.0 (0.0–0.0) *§#0.0 (0.0–0.0) *§#0.0 (0.0–0.0) *−0.1 (−0.1–−0.1) *
Cl
(mEq × L−1)
PRENaOH111.5 (111.0–113.0)111.5 (111.0–113.0)111.5 (111.0–113.0)111.5 (110.0–113.0)0.2320.5290.529
O2111.0 (111.0–112.0)111.0 (111.0–112.0)111.0 (110.0–112.0)111.0 (110.0–112.0)
POSTNaOH114.0 (114.0–115.0)114.5 (114.0–115.0)114.0 (114.0–115.0)114.0 (114.0–115.0)0.0020.0420.002
O2111.5 (111.0–113.0) *#111.0 (111.0–113.0) *#112.0 (111.0— 113.0) *#112.5 (112.0–114.0) *
DifferenceNaOH2.5 (2.0–3.0)3.0 (2.0–3.0)2.5 (2.0–3.0)2.5 (2.0–3.0)0.0070.0020.001
O20.5 (0.0–1.0) *#0.0 (0.0–1.0) *§#1.0 (1.0–1.0) *#2.0 (1.0–2.0)
Lac
(mEq × L−1)
PRE $NaOH1.4 (0.5–2.3)1.4 (0.5–2.4)1.3 (0.5–2.3)1.4 (0.5–2.5)0.1800.3610.614
O21.1 (0.4–2.5)1.2 (0.4–2.6)1.1 (0.4–2.6)1.1 (0.4–2.5)
POST $NaOH1.4 (0.5–2.3)1.5 (0.5–2.3)1.4 (0.5–2.4)1.4 (0.5–2.4)0.1970.4590.850
O21.0 (0.4–2.6)1.1 (0.4–2.6)1.2 (0.4–2.6)1.1 (0.4–2.5)
DifferenceNaOH0.0 (0.0–0.0)−0.1 (−0.1–0.1)0.1 (0.0–0.1)0.0 (0.0–0.0)1.0000.2970.922
O20.0 (0.0–0.0)0.0 (−0.1–0.0)0.0 (0.0–0.1)0.0 (0.0–0.0)
Hb
(g × dL−1)
PRENaOH6.45 (5.50–8.20)6.80 (5.30–8.20)6.70 (5.30–8.30)6.70 (5.20–8.10)0.6430.6410.511
O26.55 (5.50–8.30)6.60 (5.30–8.20)6.55 (5.30–8.40)6.55 (5.40–7.90)
POSTNaOH6.60 (5.50–8.30)6.70 (5.40–8.20)6.75(5.40–8.30)6.60 (5.30–8.20)0.5470.0830.893
O26.55 (5.50–8.40)6.60 (5.30–8.20)6.60 (5.30–8.50)6.55 (5.40–7.90)
DifferenceNaOH0.05 (0.00–0.10)0 (−0.10–0.00)0.05 (0.00–0.10)0.05 (0.00–0.10)0.0250.6610.154
O20.00 (−0.10–0.00) *0.00 (0.00–0.00) *0.00 (0.00–0.10) *0.00 (0.00–0.00) *
HCO3
(mmol × L−1)
PRENaOH30.1 (29.5–32.2)30.2 (29.3–31.8)30.3 (29.4–31.7)29.8 (29.0–31.8)0.0500.5080.165
O228.3 (27.6–29.9) *28.2 (27.6–29.8) *28.1 (27.5–30.4) *28.5 (28.2–30.2) *
POSTNaOH25.7 (23.3–29.1)25.9 (23.2–28.1)26.4 (23.2–29)26.3 (23.7–29.7)0.5770.0430.003
O228.0 (27.2–28.6) §#27.5 (26.7–28.6) #27.0 (26.3–28.2)26.6 (26.1–27.2)
DifferenceNaOH−4.4 (−6.3–−2.4) #−4.5 (−6.8–−2.4) #−4.2 (−6.2–−1.3)−3.9 (−5.7–−1.7)0.0180.003<0.001
O2−0.3 (−0.5–−0.2) *§#−0.8 (−0.9–−0.6) *§#−1.3 (−1.7–−1) *#−2.1 (−2.8–−1.4)
plasma TCO2
(mmol × L−1)
PRENaOH31.9 (31.4–34.1)32.0 (31.1–33.6)32.1 (31.3–33.5)31.7 (30.9–33.6)0.0510.4760.194
O230.1 (29.5–31.8)30.1 (29.4–31.5)30.0 (29.4–32.3)30.3 (30.1–32.0)
POSTNaOH26.0 (23.6–29.5)26.3 (23.5–28.4)26.7 (23.6–29.3)26.7 (24.1–30.1)0.2580.009<0.001
O229.7 (28.9–30.1) §#29.1 (28.1–30.0) #28.3 (27.4–29.5) #27.5 (26.9–28.1)
DifferenceNaOH−5.9 (−7.8–−3.9) #−6 (−8.3–−4.0) #−5.7 (−7.6–−2.8)−5.3 (−7.1–−3.3)0.006<0.001<0.001
O2−0.5 (−0.6–−0.3) *°§#−1.1 (−1.3–−0.9) *§#−1.9 (−2.2–−1.7) *#−3.0 (−3.8–−2.3)
V ˙ CO2
(mL × min−1)
NaOH65.3 (43.3–86.7) #67.0 (44.3–92.2) #63.5 (31.6–84.5)59.1 (36.4–79)0.006<0.001<0.001
O25.4 (3.7–6.7) *°§#12.5 (10.5–14.6) *§#20.7 (18.6–24.9) *#33.6 (26.1–42.6)
Abbreviations: PCO2, partial pressure of carbon dioxide; PO2, partial pressure of oxygen; Na+, sodium; K+, potassium; Ca++, calcium; Cl, chloride; Lac, Lactate; Hb, hemoglobin; HCO3-, bicarbonate, TCO2, total CO2 content, V ˙ CO2, amount of carbon dioxide removed by the membrane lung. Data are expressed median (IQR); Differences were computed as POST values–PRE values. p: p values of two-way ANOVA RM or two-way ANOVA RM on ranks ($) for NaOH vs. O2 comparison (p Ventilation), Flow effect (p Flow) and interaction (p int.); Post-hoc analysis with Bonferroni or Tukey corrections: * p < 0.05 vs. NaOH; ° p < 0.05 vs. 250 mL/min; § p < 0.05 vs. 500 mL/min; # p < 0.05 vs. 1000 mL × min−1.
Table 2. Efficacy tests results.
Variable Ventilation
NaOH 250 mL × min−1O2 10,000 mL × min−1p
pHPRE7.351 (7.333–7.359)7.328 (7.322–7.355)0.032
POST7.987 (7.977–8.077)7.966 (7.921–8.013)0.020
Difference0.643 (0.624–0.718)0.627 (0.599–0.685)0.094
PCO2 (mmHg)PRE59.5 (59–59.7)60 (59.3–60.5)0.254
POST10.5 (10.3–11.1)11.5 (10.8–13.9)0.106
Difference−48.5 (−50.5–−48.3)−48.1 (−49.4–−46.1)0.522
PO2 (mmHg)PRE $137 (137–143)139 (137–165)0.625
POST130.5 (128–140)661.5 (649–677)<0.001
Difference−6.5 (−9–−3)518.5 (509–536)<0.001
K+ (mEq × L−1)PRE4.1 (4.1–4.5)4.2 (4–4.4)0.611
POST $4.1 (4–4.4)4.1 (4–4.3)0.438
Difference0.1 (0–0.1)0.1 (0–0.1)1.000
Na+ (mEq × L−1)PRE143 (143–144)142 (141–145)0.516
POST140 (140–142)139.5 (139–143)1.000
Difference−3 (−3–−2)−2 (−2–−2)0.102
Ca++ (mEq × L−1)PRE1.4 (1.3–1.4)1.3 (1.3–1.4)0.927
POST1.2 (1.1–1.2)1.2 (1.1–1.3)0.413
Difference−0.2 (−0.2–−0.1)−0.1 (−0.1–−0.1)0.067
Cl (mEq × L−1)PRE $111.5 (111–113)111.5 (111–112)0.813
POST114.5 (114–115)115 (114–115)1.000
Difference3 (2–3)3 (2–3)0.611
Lac (mEq × L−1)PRE $1.4 (0.5–2.4)1.3 (0.5–2.5)0.375
POST1.5 (0.5–2.3)1.2 (0.4–2.5)0.233
Difference−0.1 (−0.1–0.1)0 (−0.1–0)1.000
Hb (g × dL−1)PRE6.80 (5.30–8.20)6.55 (5.50–8.40)0.499
POST6.70 (5.40–8.20)6.55 (5.40–7.90)0.590
Difference0.00 (−0.10–0.00)0.00 (0.00–0.00)0.363
HCO3 (mmol × L−1)PRE30.2 (29.3–31.8)29.4 (28.7–30.6)0.205
POST25.9 (23.2–28.1)25.1 (23.1–28.1)0.652
Difference−4.5 (−6.8–−2.4)−4.6 (−5.7–−1.8)0.185
plasma TCO2 (mmol × L−1)PRE $32 (31.1–33.6)31.3 (30.6–32.5)0.313
POST26.3 (23.5–28.4)25.5 (23.5–28.4)0.695
Difference−6 (−8.3–−4)−6.1 (−7.1–−3.4)0.191
V ˙ CO2 (mL × min−1) 67 (44.3–92.2)67.4 (37.8–79.4)0.191
Abbreviations: PCO2, partial pressure of carbon dioxide; PO2, partial pressure of oxygen; Na+, sodium; K+, potassium; Ca++, calcium; Cl, chloride; Lac, Lactate; Hb, hemoglobin; HCO3, Bicarbonate, TCO2, total CO2 content, V ˙ CO2, amount of carbon dioxide removed by the membrane lung. Data are expressed median (IQR); Differences were computed as POST values–PRE values. p: p values of Paired t-test or Wilcoxon Signed Rank Test ($) for NaOH (250 mL × min−1) vs. O2 (10,000 mL × min−1) comparison.
Publisher’s Note: MDPI stays neutral with regard to jurisdictional claims in published maps and institutional affiliations.