
Optimization of Spiral-Wound Microfiltration Process Parameters for the Production of Micellar Casein Concentrate

 ,
,  ,
,
Abstract
:1. Introduction
2. Materials and Methods
2.1. Feed
2.2. Membranes
2.3. Proximate Analysis
2.4. SP Removal
2.5. Overall Flux
2.6. Rejection Coefficients for SP and CN
2.7. Operating Variables
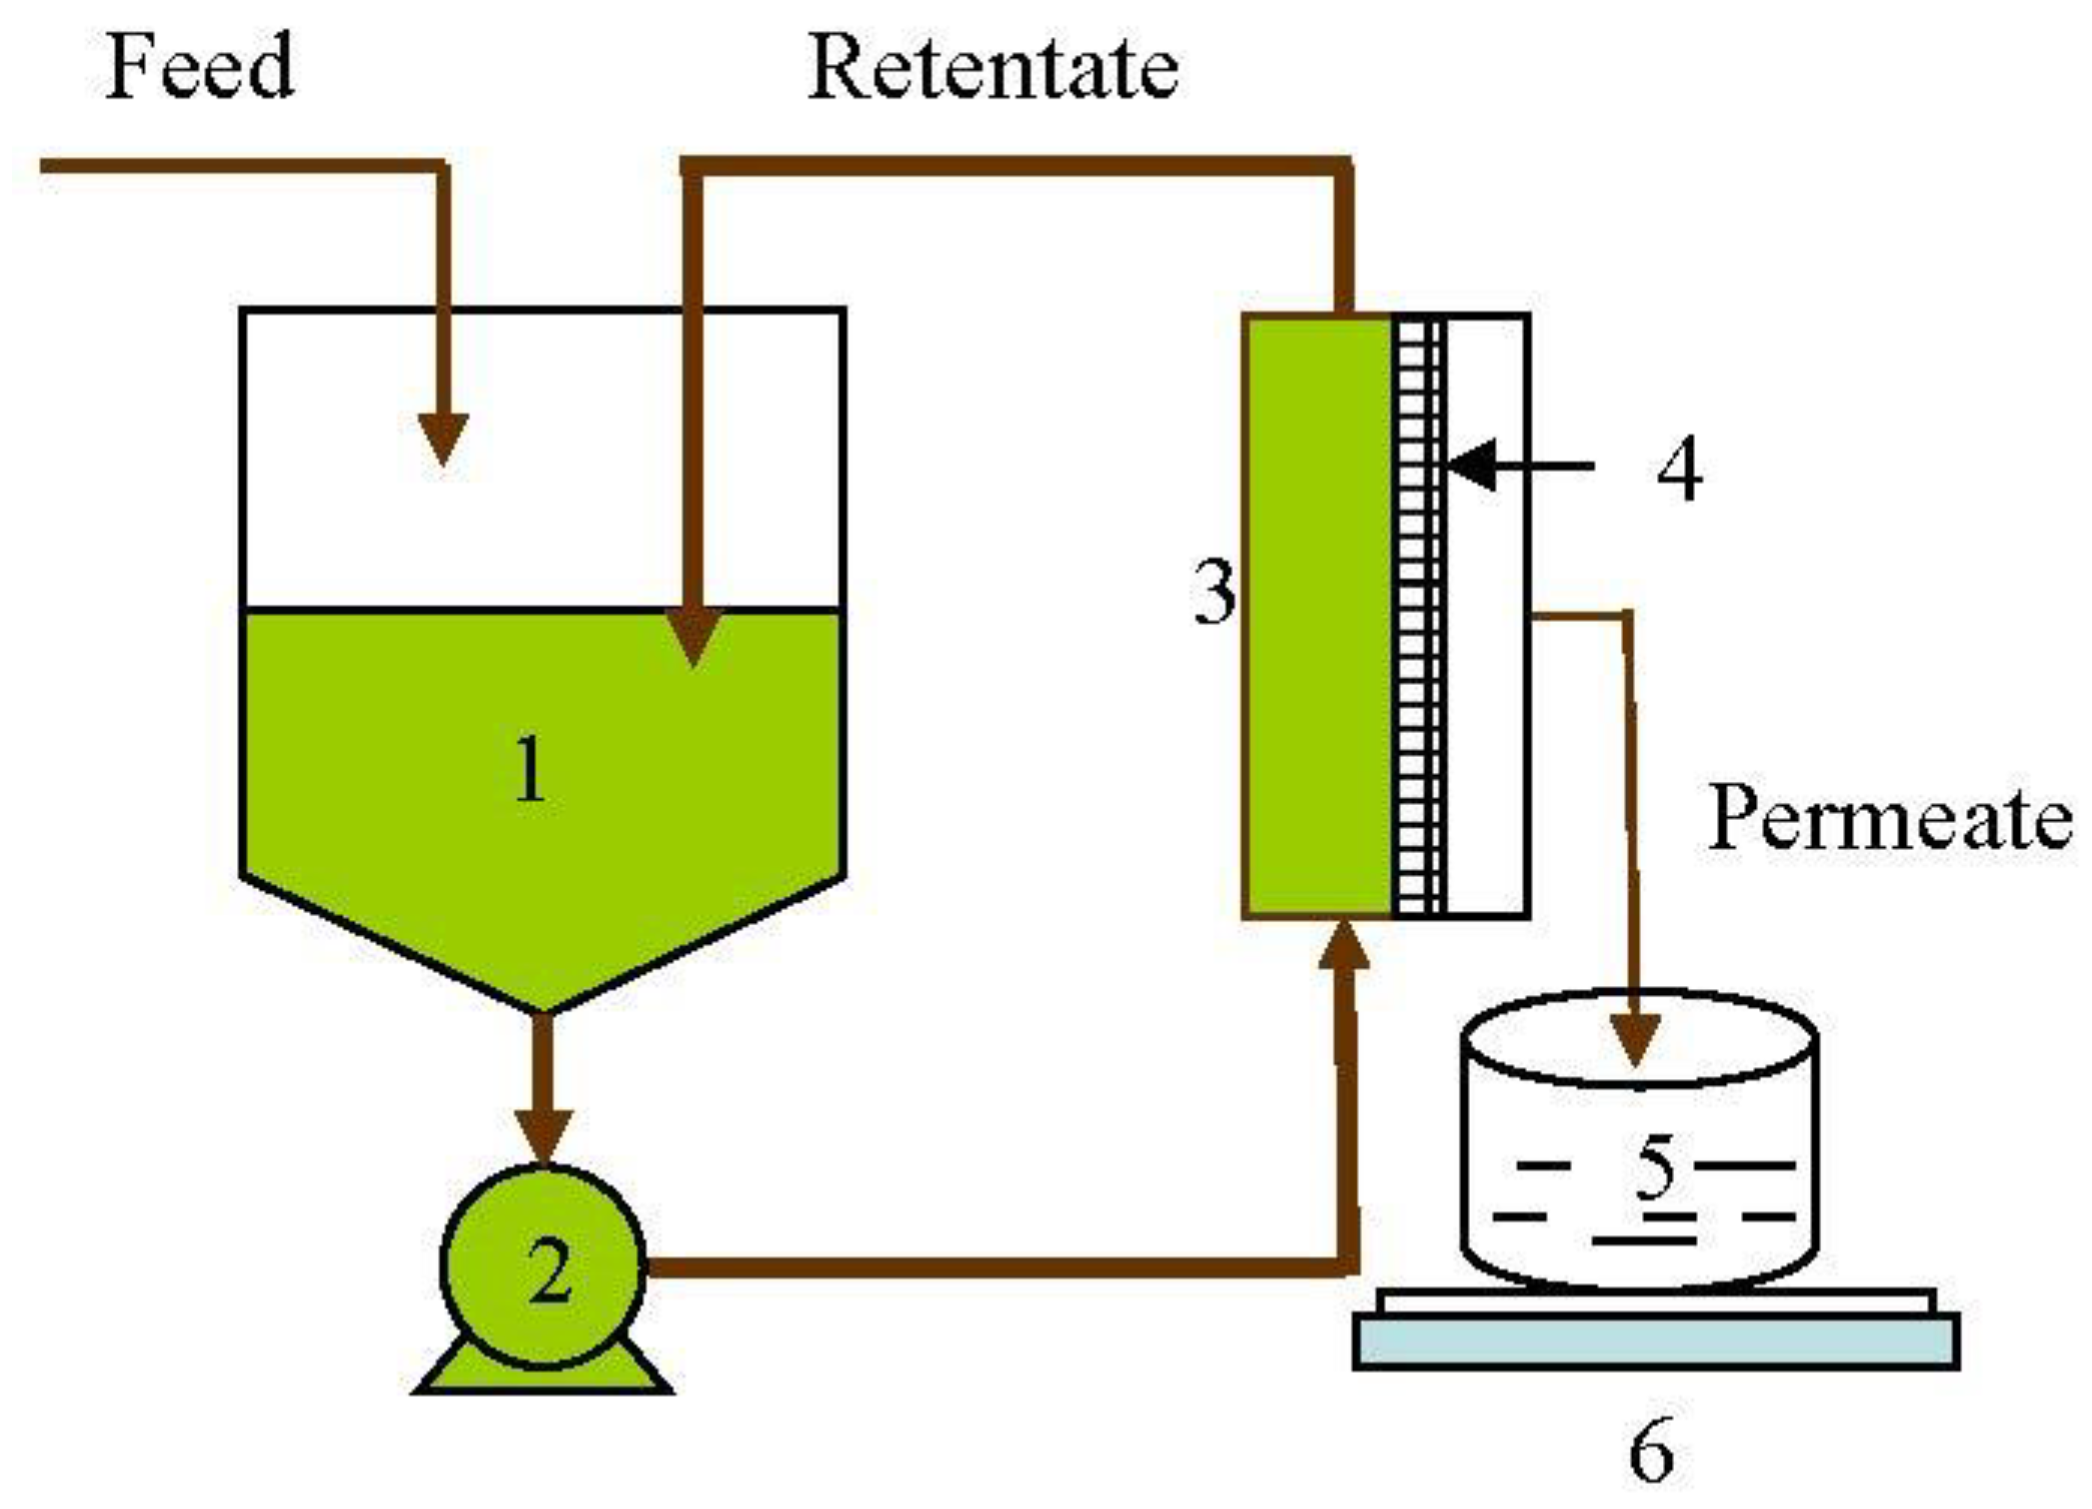
2.8. Experimental Procedure
2.9. Statistical Analysis
3. Results and Discussion
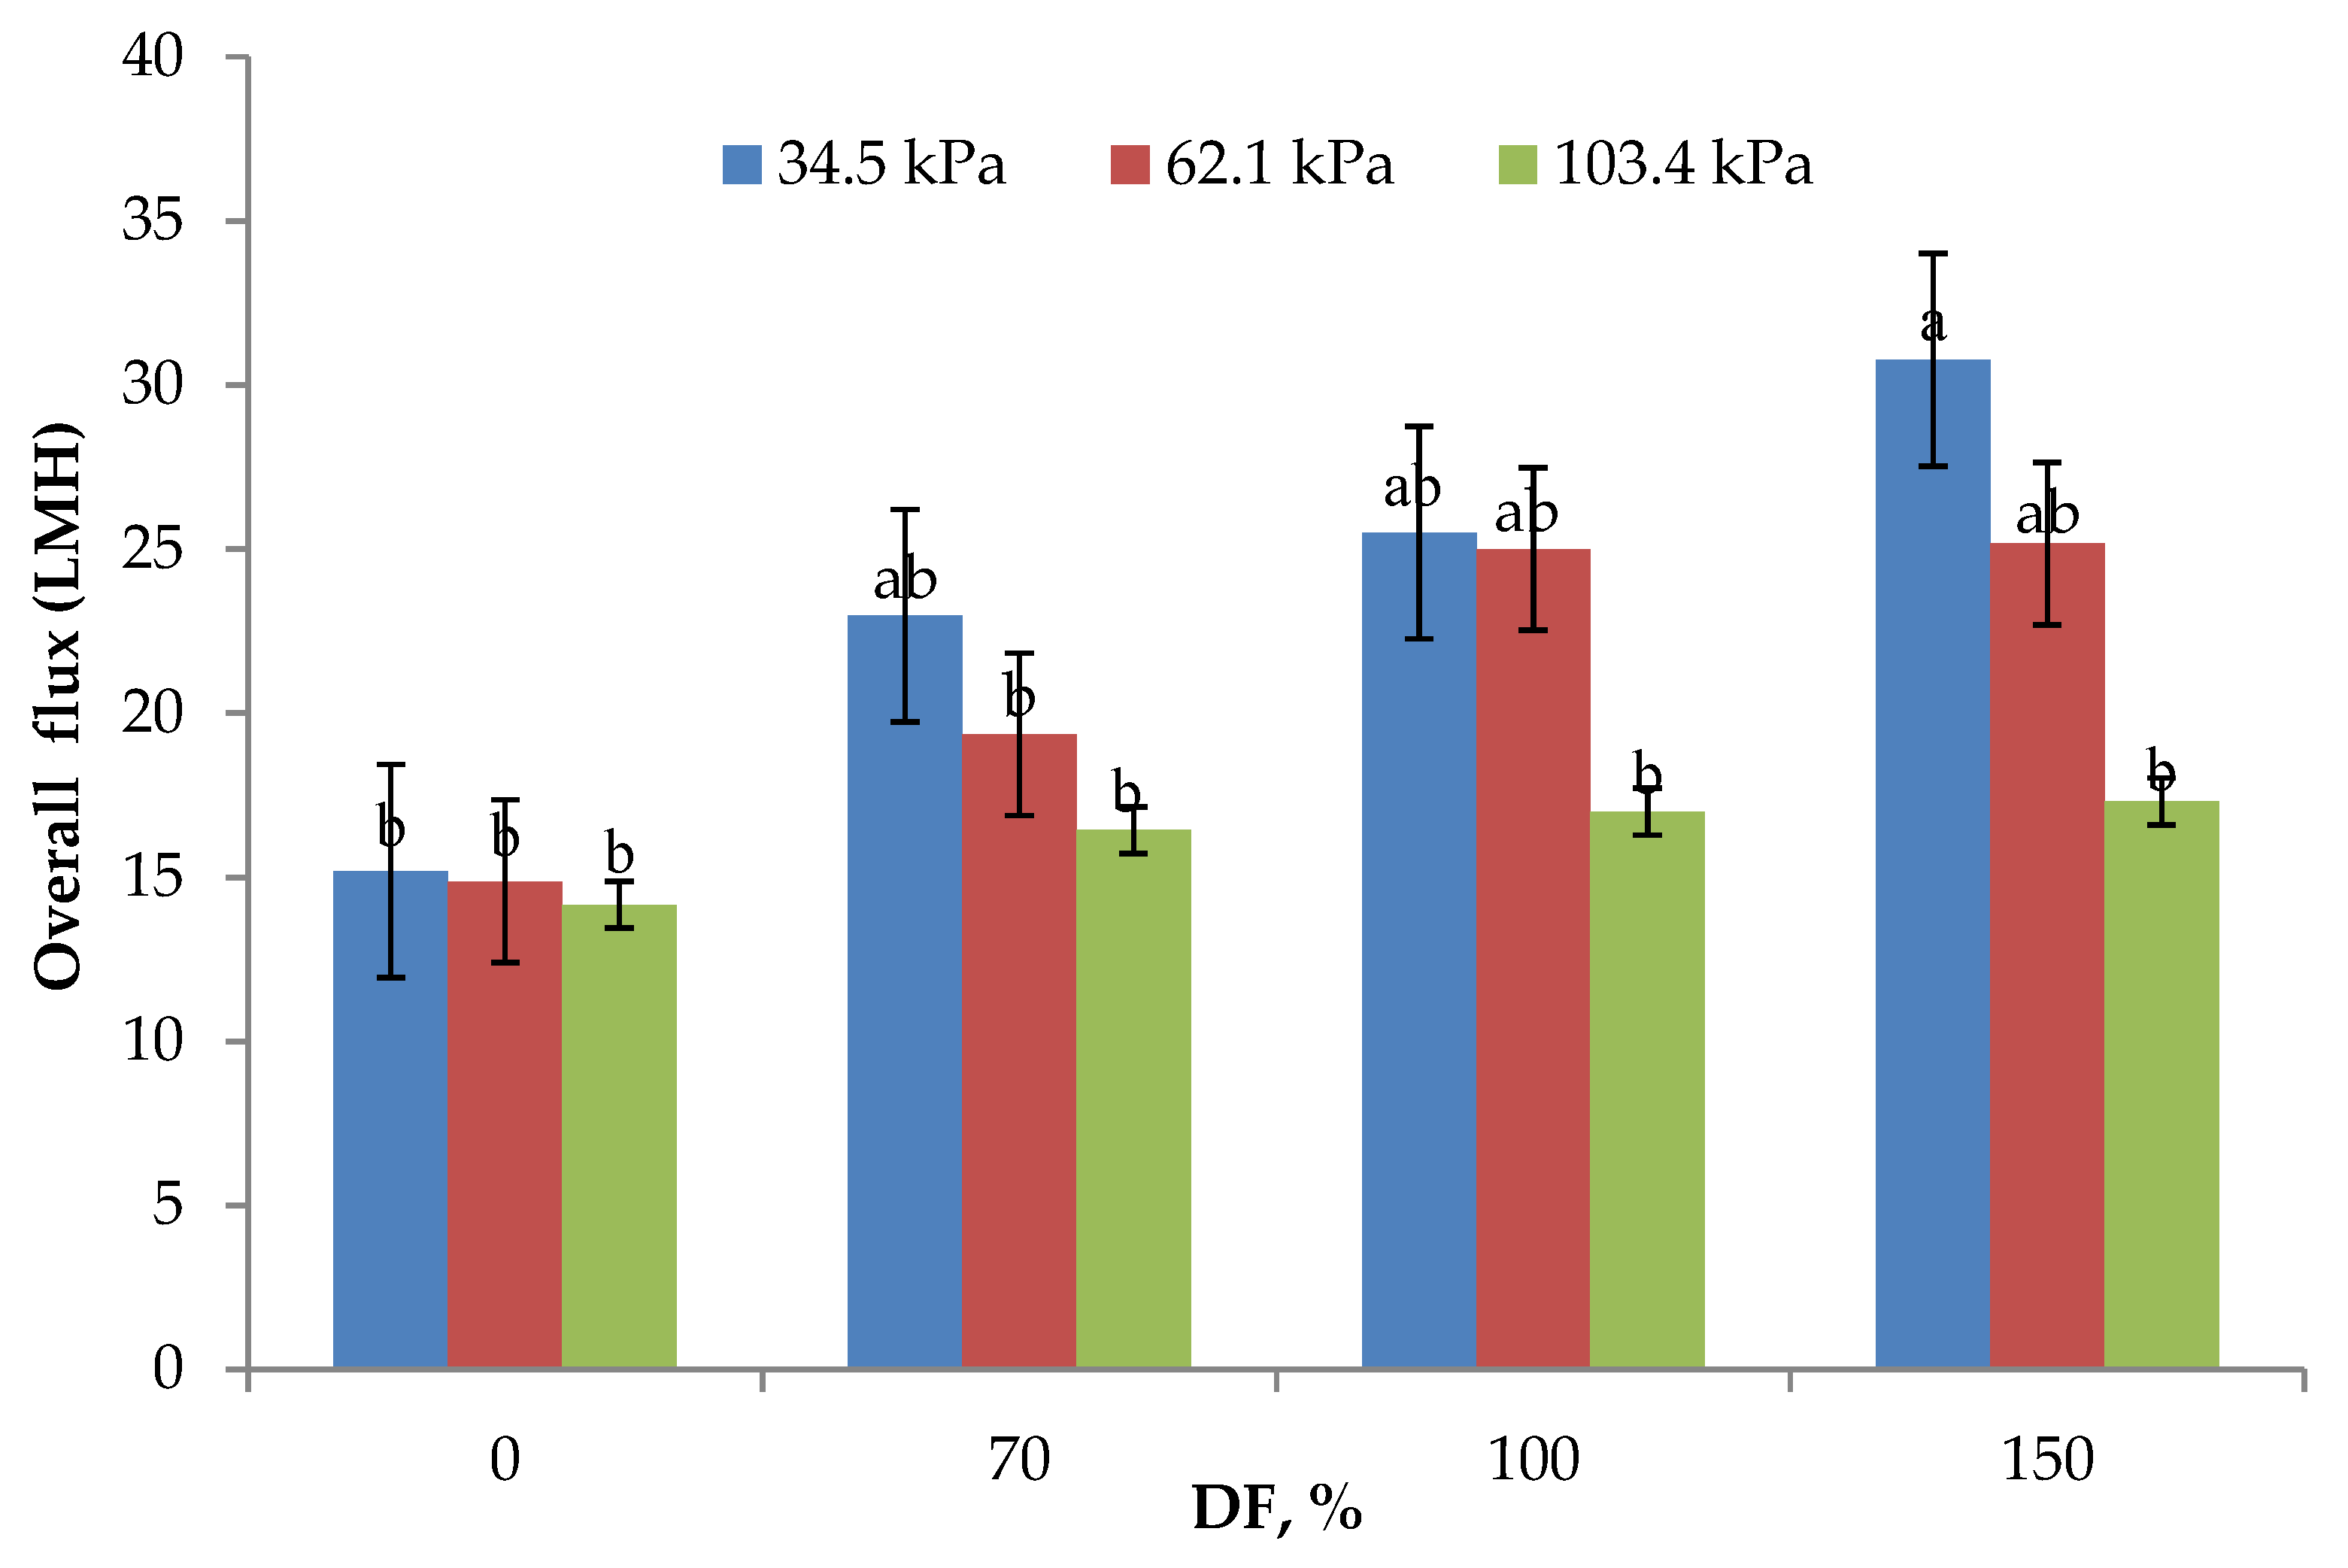
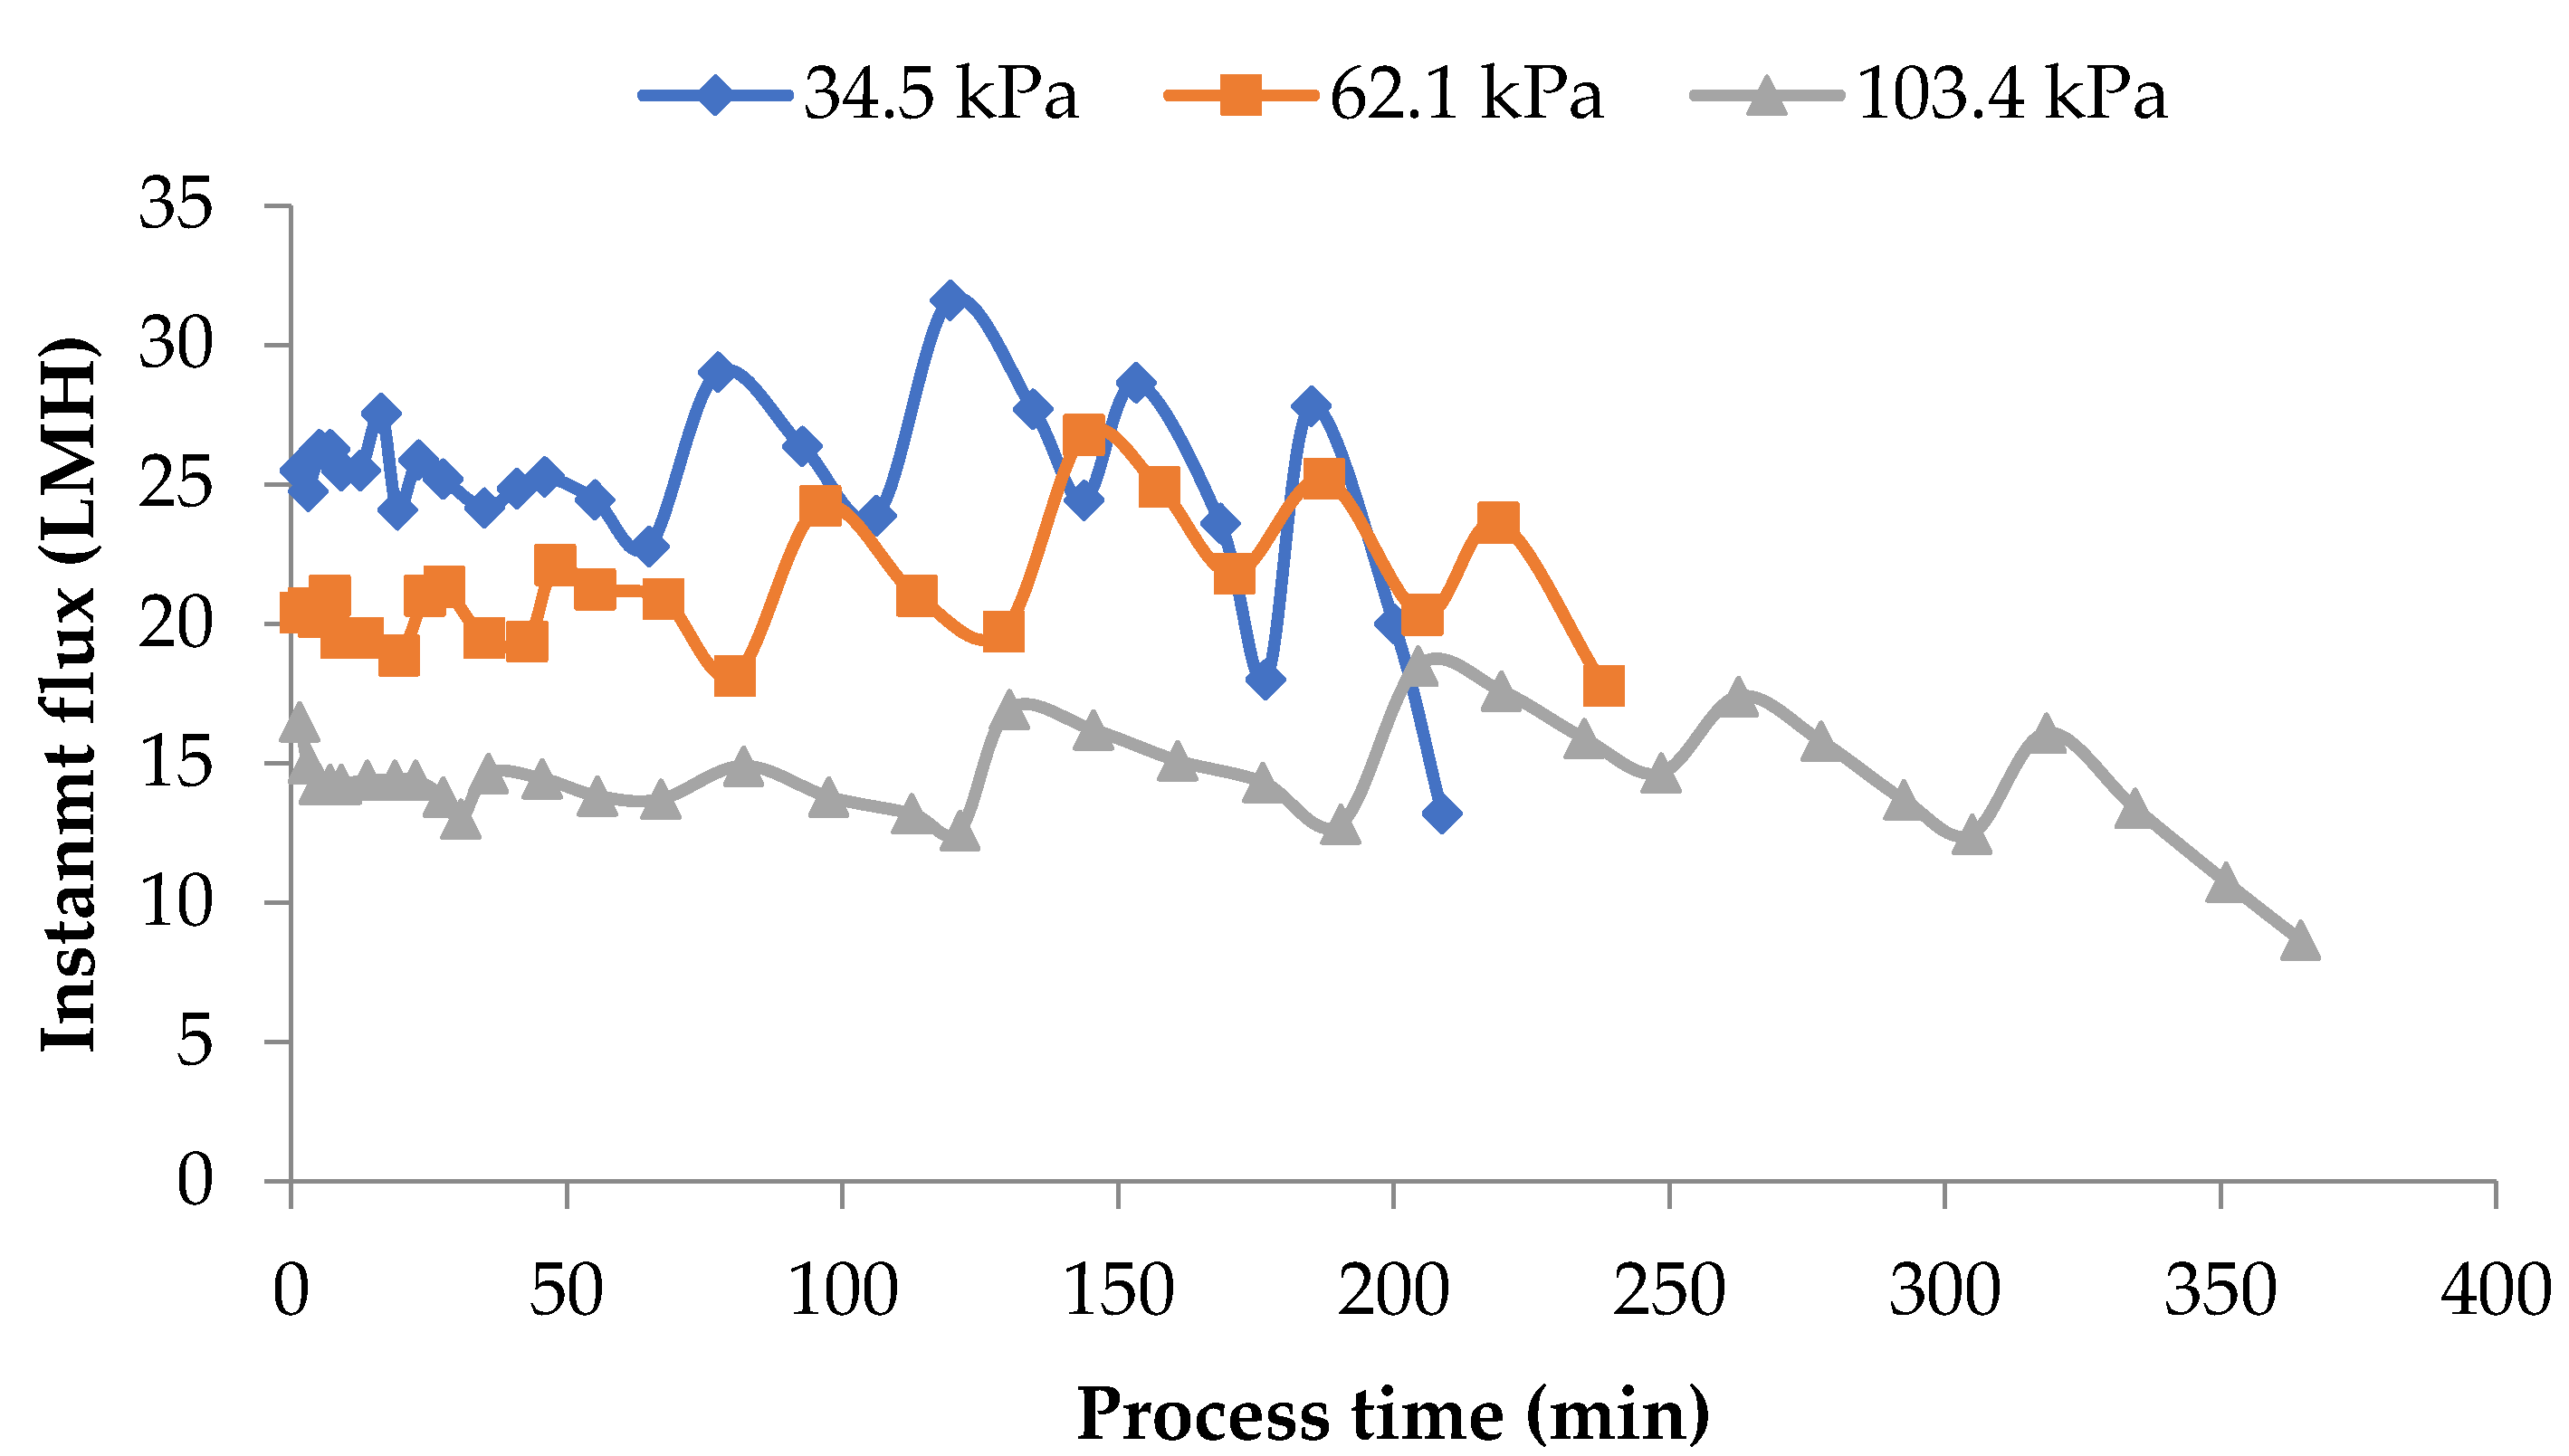
3.1. Flux
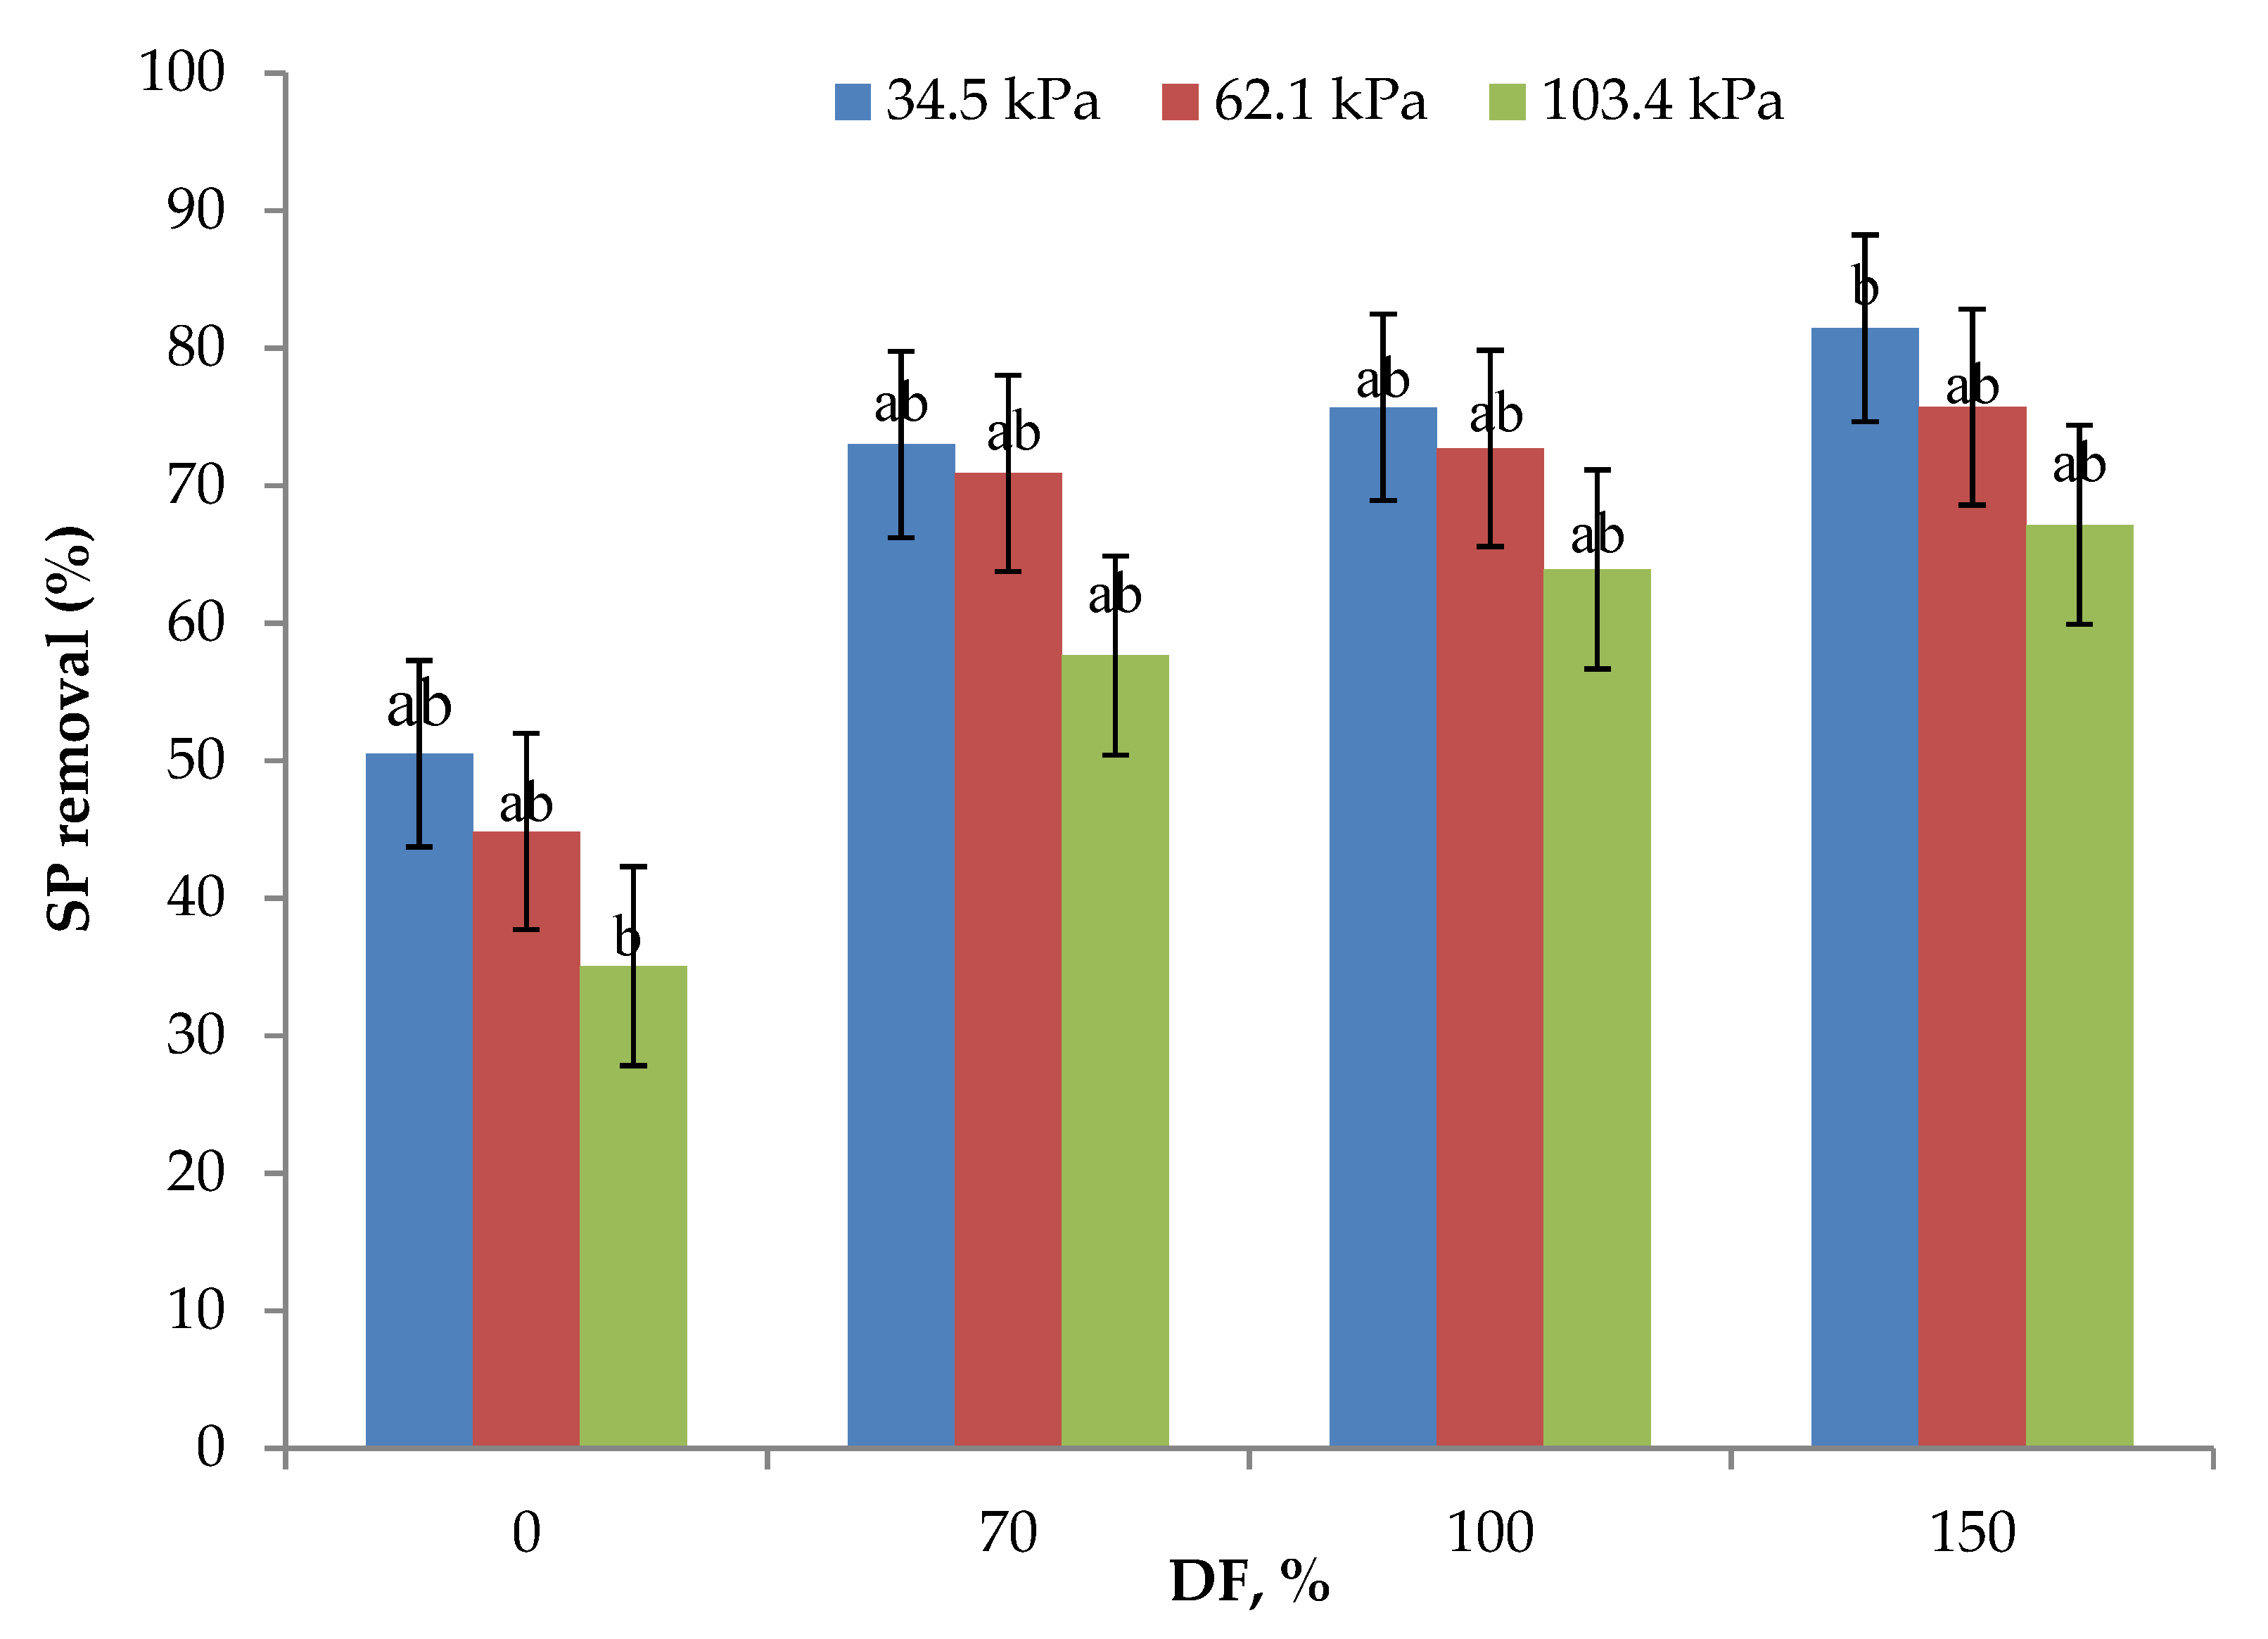
3.2. SP Removal
3.3. Rejection of SP and CN
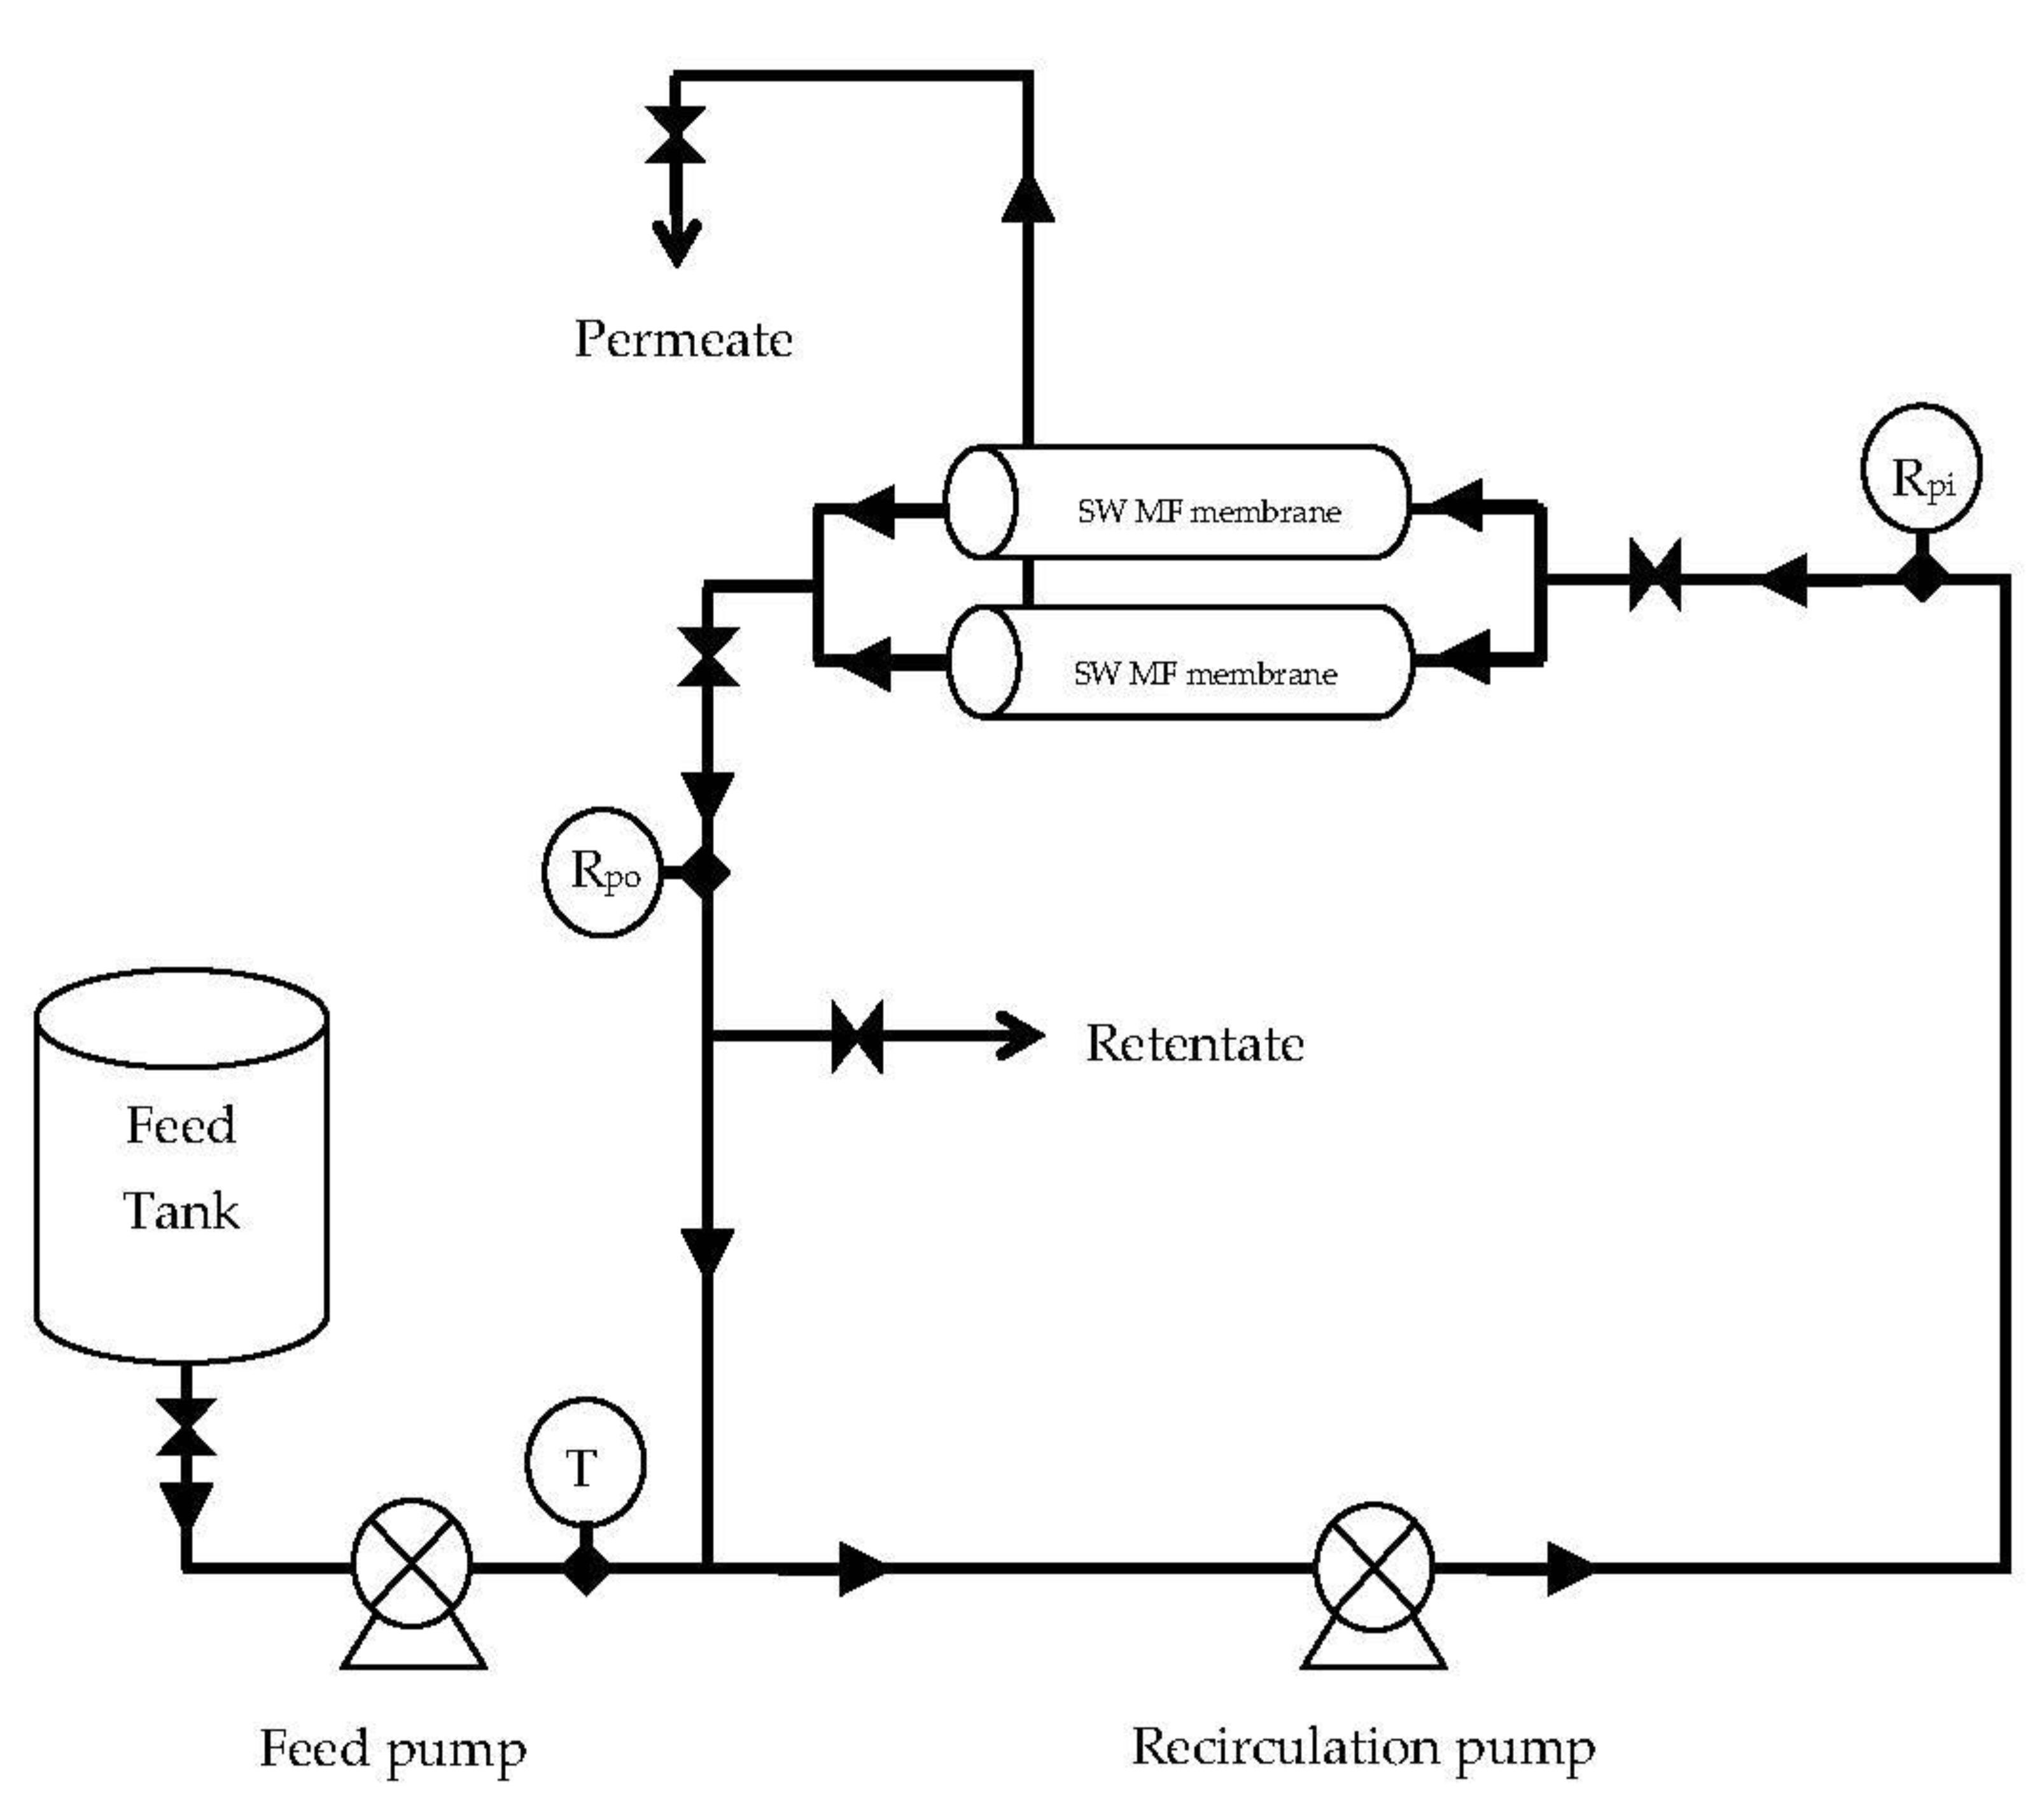
3.4. Pilot-Scale Experiments
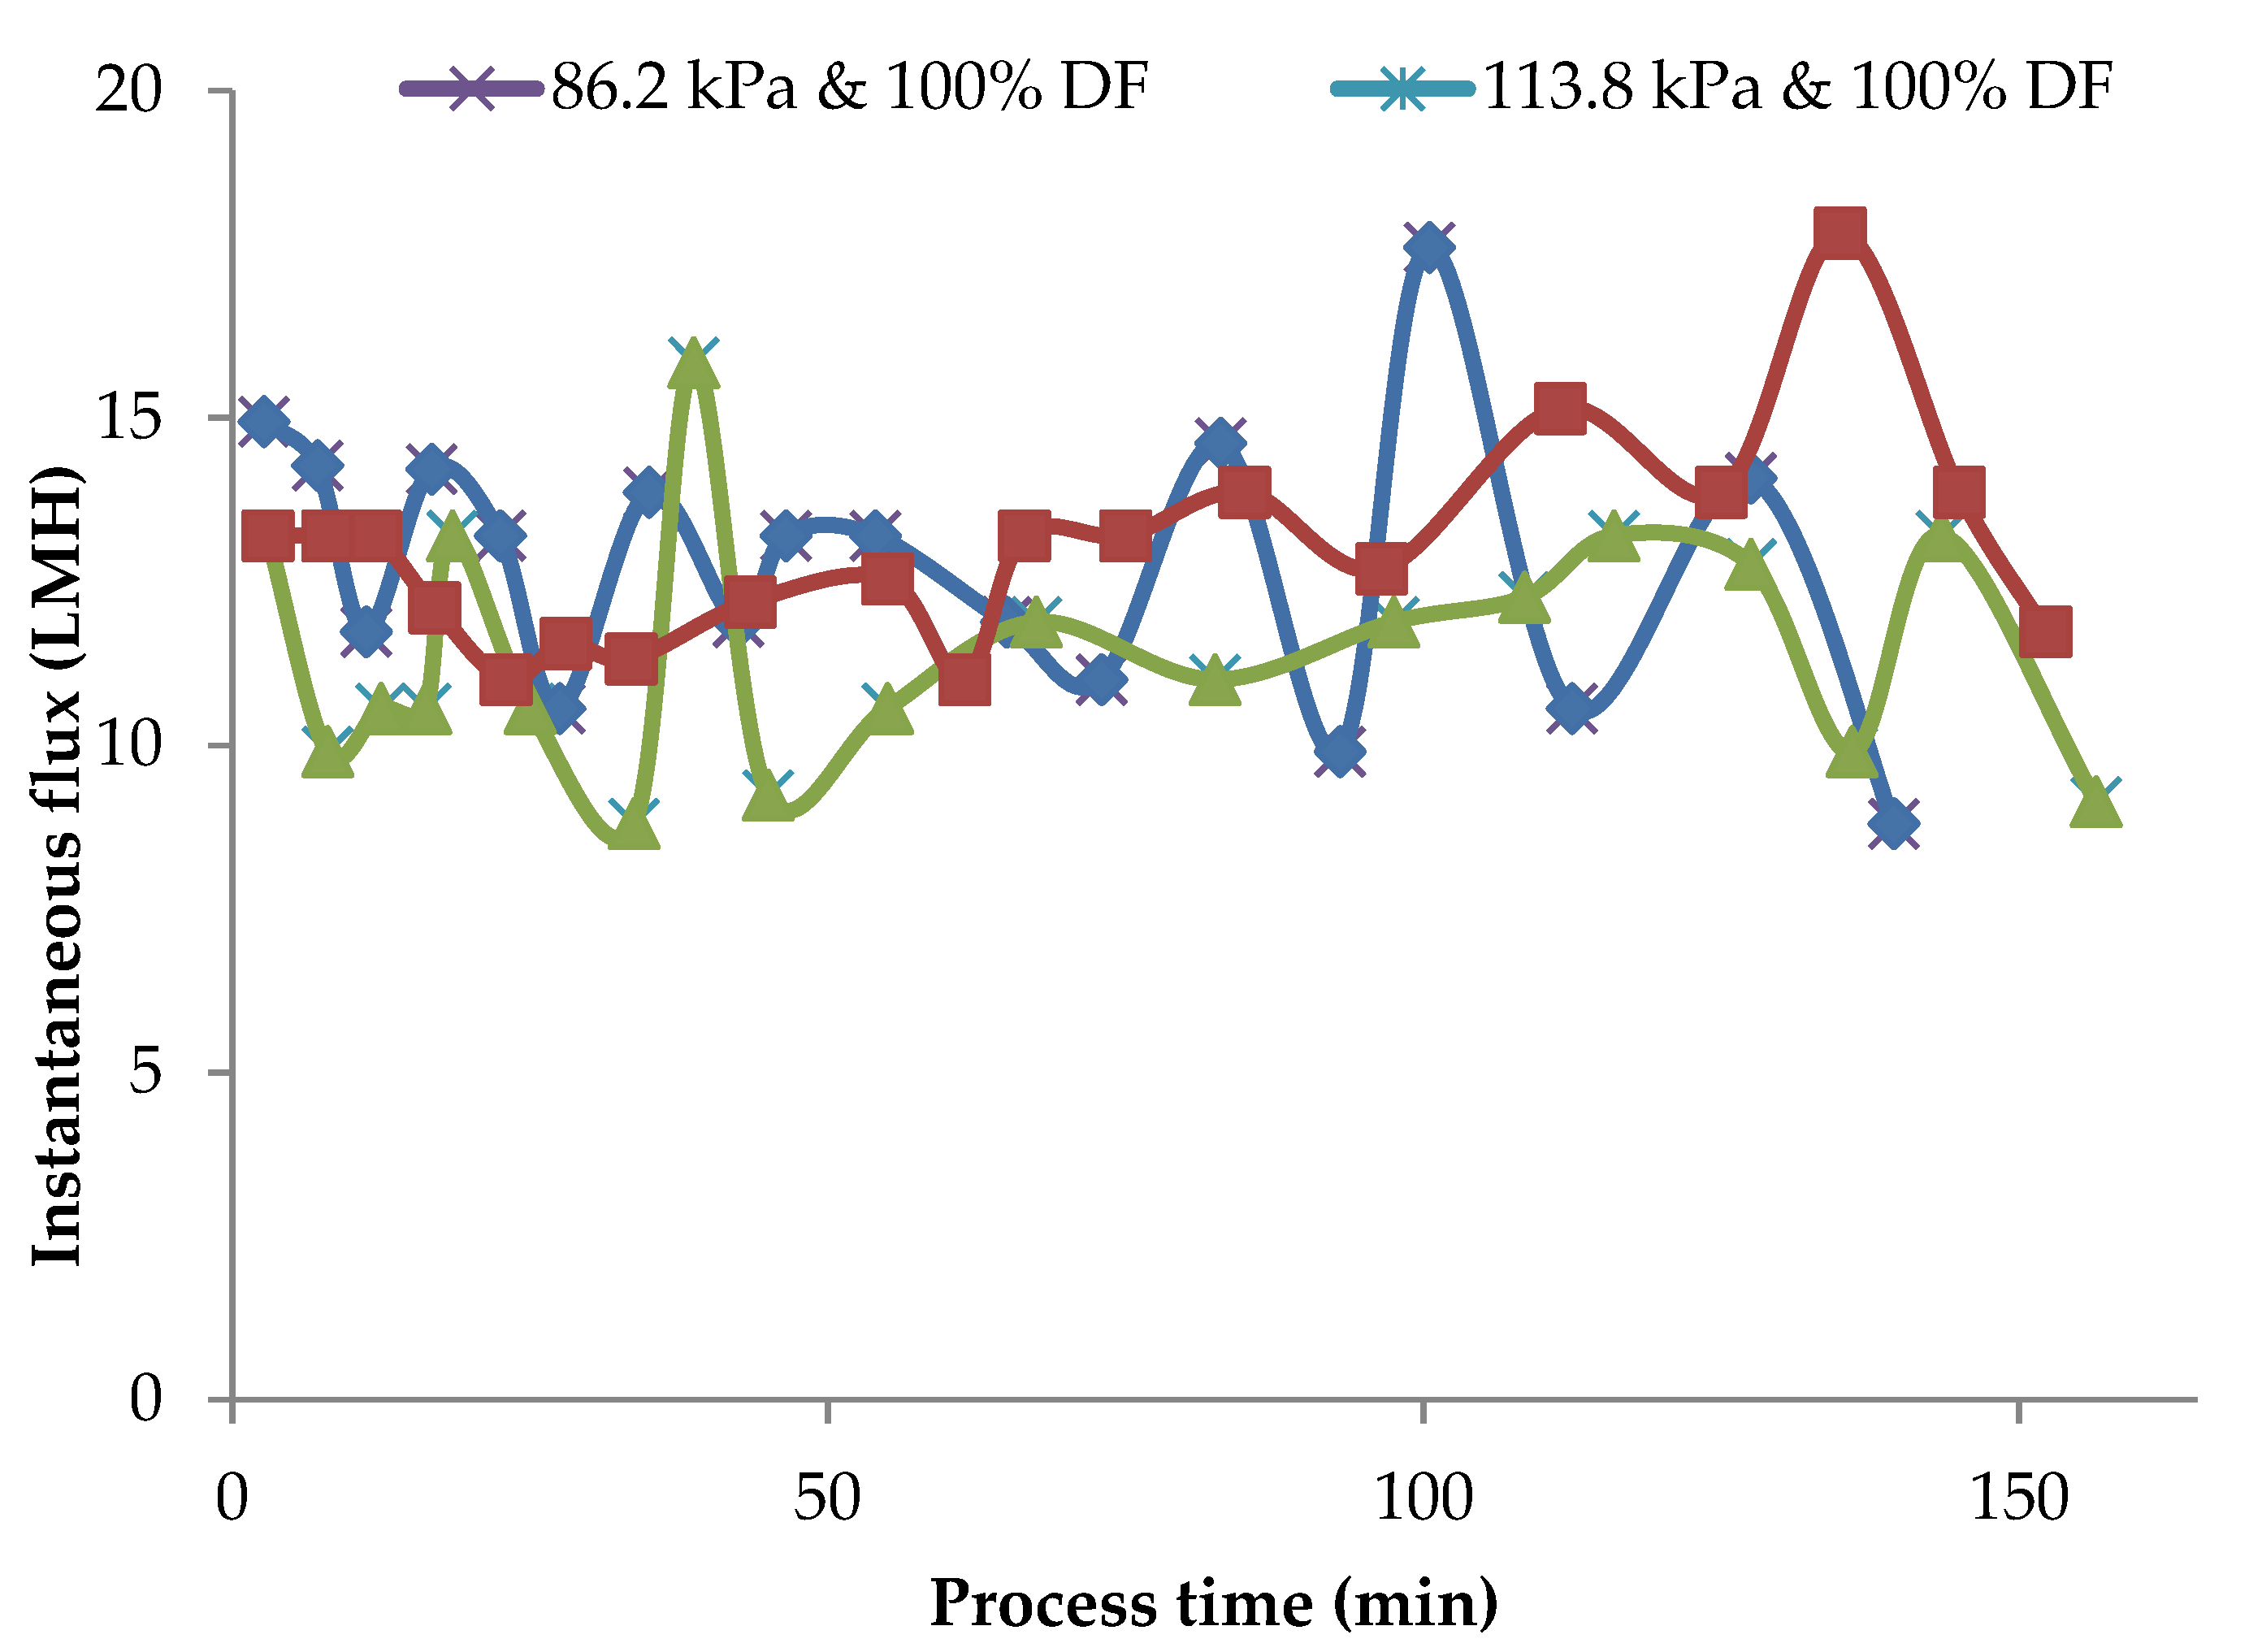
3.5. Pilot Plant Process Flux
3.6. Rejection of SP and CN-Pilot Runs
4. Conclusions
Author Contributions
Funding
Institutional Review Board Statement
Informed Consent Statement
Data Availability Statement
Acknowledgments
Conflicts of Interest
References
- Trung Le, T.; Cabaltica, A.D.; Mien Bui, V. Membrane separations in dairy processing. J. Food Res. Technol. 2014, 2, 1–14. [Google Scholar]
- Fox, P.F.; Kelly, A.L. The caseins. In Proteins in Food Processing; Yada, R.Y., Ed.; Woodhead Publishing: Sawston, UK, 2004; pp. 29–71. ISBN 9781855737235. [Google Scholar]
- Salunke, P.; Marella, C.; Metzger, L.E. Microfiltration and Ultrafiltration Process to Produce Micellar Casein and Milk Protein Concentrates with 80% Crude Protein Content: Partitioning of Various Protein Fractions and Constituents. Dairy 2021, 2, 367–384. [Google Scholar] [CrossRef]
- Amelia, I.; Barbano, D.M. Production of an 18% protein liquid micellar casein concentrate with a long refrigerated shelf life1. J. Dairy Sci. 2013, 96, 3340–3349. [Google Scholar] [CrossRef] [Green Version]
- Beckman, S.L.; Zulewska, J.; Newbold, M.; Barbano, D.M. Production efficiency of micellar casein concentrate using polymeric spiral-wound microfiltration membranes. J. Dairy Sci. 2010, 93, 4506–4517. [Google Scholar] [CrossRef] [PubMed] [Green Version]
- Hurt, E.; Zulewska, J.; Newbold, M.; Barbano, D.M. Micellar casein concentrate production with a 3X, 3-stage, uniform transmembrane pressure ceramic membrane process at 50 °C. J. Dairy Sci. 2010, 93, 5588–5600. [Google Scholar] [CrossRef]
- Hammam, A.R.A.; Martínez-Monteagudo, S.I.; Metzger, L.E. Progress in micellar casein concentrate: Production and applications. Compr. Rev. Food Sci. Food Saf. 2021. [Google Scholar] [CrossRef]
- Hammam, A.R.A.; Metzger, L.E. Production and storage stability of liquid micellar casein concentrate. J. Dairy Sci. 2018, 101, 8. [Google Scholar]
- Rollema, H.S.; Muir, D.D. Casein and Related Products. In Dairy Powders and Concentrated Products; Wiley-Blackwell: Oxford, UK, 2009; pp. 235–254. ISBN 9781405157643. [Google Scholar]
- Amelia, I.; Drake, M.; Nelson, B.; Barbano, D.M. A new method for the production of low-fat Cheddar cheese. J. Dairy Sci. 2013, 96, 4870–4884. [Google Scholar] [CrossRef]
- Li, B.; Waldron, D.S.; Tobin, J.T.; Subhir, S.; Kelly, A.L.; McSweeney, P.L.H. Evaluation of production of Cheddar cheese from micellar casein concentrate. Int. Dairy J. 2020, 107, 104711. [Google Scholar] [CrossRef]
- Hammam, A.R.A.; Metzger, L.E. Manufacture of culture-based acid curd using micellar casein concentrate. J. Dairy Sci. 2020, 103, 130–131. [Google Scholar]
- Salunke, P. Impact of Transglutaminase on the Functionality of Milk Protein Concentrate and Micellar Casein Concentrate; South Dakota State University: Brookings, SD, USA, 2013. [Google Scholar]
- Hammam, A.R.A.; Beckman, S.L.; Sunkesula, V.; Metzger, L.E. Effect of storage of high concentrated micellar casein on the functional properties of process cheese. J. Dairy Sci. 2019, 102, 34. [Google Scholar]
- Hammam, A.R.A.; Metzger, L.E. Manufacturing of process cheese without emulsifying salt using acid curd. J. Dairy Sci. 2019, 102, 81–82. [Google Scholar]
- Metzger, L.E.; Hammam, A. Process for Manufacture of Process Cheese without Emulsifying Salt. U.S. Patent Application 16/793,818, 20 August 2020. [Google Scholar]
- Hammam, A.R.A.; Metzger, L.E. Manufacture of imitation Mozzarella cheese without emulsifying salts using acid curd and micellar casein concentrate. J. Dairy Sci. 2020, 103, 179. [Google Scholar]
- Bong, D.D.; Moraru, C.I. Use of micellar casein concentrate for Greek-style yogurt manufacturing: Effects on processing and product properties. J. Dairy Sci. 2014, 97, 1259–1269. [Google Scholar] [CrossRef]
- Zulewska, J.; Barbano, D.M. The effect of linear velocity and flux on performance of ceramic graded permeability membranes when processing skim milk at 50 °C. J. Dairy Sci. 2014, 97, 2619–2632. [Google Scholar] [CrossRef] [Green Version]
- Adams, M.C.; Barbano, D.M. Effect of ceramic membrane channel diameter on limiting retentate protein concentration during skim milk microfiltration1. J. Dairy Sci. 2016, 99, 167–182. [Google Scholar] [CrossRef] [PubMed] [Green Version]
- Zulewska, J.; Newbold, M.; Barbano, D.M. Efficiency of serum protein removal from skim milk with ceramic and polymeric membranes at 50 °C. J. Dairy Sci. 2009, 92, 1361–1377. [Google Scholar] [CrossRef] [PubMed]
- Hammam, A.R.A. Production and Storage Stability of High Concentrated Micellar Casein and its Effect on the Functional Properties of Process Cheese Products; South Dakota State University: Brookings, SD, USA, 2019. [Google Scholar]
- Beckman, S.L.; Barbano, D.M. Effect of microfiltration concentration factor on serum protein removal from skim milk using spiral-wound polymeric membranes1. J. Dairy Sci. 2013, 96, 6199–6212. [Google Scholar] [CrossRef] [PubMed]
- Lawrence, N.D.; Kentish, S.E.; O’Connor, A.J.; Barber, A.R.; Stevens, G.W. Microfiltration of skim milk using polymeric membranes for casein concentrate manufacture. Sep. Purif. Technol. 2008, 60, 237–244. [Google Scholar] [CrossRef]
- Govindasamy-Lucey, S.; Jaeggi, J.J.; Johnson, M.E.; Wang, T.; Lucey, J.A. Use of Cold Microfiltration Retentates Produced with Polymeric Membranes for Standardization of Milks for Manufacture of Pizza Cheese. J. Dairy Sci. 2007, 90, 4552–4568. [Google Scholar] [CrossRef] [Green Version]
- Marella, C.; Salunke, P.; Metzger, L.E. Optimization of spiral wound microfiltration process production of micellar casein concentrate. J. Dairy Sci. 2011, 94. [Google Scholar] [CrossRef]
- Carter, B.G.; Cheng, N.; Kapoor, R.; Meletharayil, G.H.; Drake, M.A. Invited review: Microfiltration-derived casein and whey proteins from milk. J. Dairy Sci. 2021. [Google Scholar] [CrossRef] [PubMed]
- Hurt, E.; Barbano, D.M. Processing factors that influence casein and serum protein separation by microfiltration1. J. Dairy Sci. 2010, 93, 4928–4941. [Google Scholar] [CrossRef]
- AOAC International. AOAC Official Methods of Analysis, 17th ed.; AOAC International: Gaithersburg, MD, USA, 2000. [Google Scholar]
- Hartinger, M.; Heidebrecht, H.-J.; Schiffer, S.; Dumpler, J.; Kulozik, U. Milk Protein Fractionation by Means of Spiral-Wound Microfiltration Membranes: Effect of the Pressure Adjustment Mode and Temperature on Flux and Protein Permeation. Foods 2019, 8, 180. [Google Scholar] [CrossRef] [PubMed] [Green Version]


| DF 1 (%) | 0 | 70 | 100 | 150 | ||||||||
|---|---|---|---|---|---|---|---|---|---|---|---|---|
| TMP 2 (kPa) | 34.5 | 62.1 | 103.4 | 34.5 | 62.1 | 103.4 | 34.5 | 62.1 | 103.4 | 34.5 | 62.1 | 103.4 |
| CN/TKN | 0.89 g | 0.89 g | 0.87 h | 0.94 b | 0.93 c | 0.9 f | 0.94 b | 0.93 c,d,e | 0.92 e | 0.96 a | 0.95 b | 0.93 c,d,e |
| CN/TP | 0.90 f | 0.90 f | 0.89 g | 0.94 b,c | 0.94 b,c | 0.92 e | 0.95 b | 0.95 b | 0.93 c,d | 0.96 a | 0.95 b | 0.93 c,d |
| Rej CN | 1.00 a | 0.98 a,b,c | 0.99 a,b | 0.98 a,b,c | 0.99 a,b | 0.99 a,b | 1.00 a | 0.98 a,b,c | 0.97 b,c | 0.98 a,b,c | 0.96 c | 0.97 b,c |
| Rej SP | 0.33 c | 0.40 b | 0.53 a | 0.14 e,f | 0.17 e | 0.32 c,d | 0.13 e,f | 0.17 e | 0.27 c,d | 0.10 f | 0.16 e,f | 0.25 d |
| Run # | Operating Pressure, kPa | DF 1, % | Serum Protein Removal, % | ||||
|---|---|---|---|---|---|---|---|
| Base | Differential | TMP 2 | Actual | Predicted | Difference | ||
| 1 | 34.5 | 103.4 | 86.2 | 100 | 66.54 | 65.56 | −0.98 |
| 2 | 34.5 | 103.4 | 86.2 | 100 | 68.20 | 65.56 | −2.64 |
| 3 | 34.5 | 103.4 | 86.2 | 100 | 65.46 | 65.56 | 0.10 |
| 4 | 34.5 | 103.4 | 86.2 | 100 | 63.40 | 65.56 | 2.16 |
| 5 | 34.5 | 103.4 | 86.2 | 100 | 63.15 | 65.56 | 2.41 |
| 6 | 34.5 | 103.4 | 86.2 | 150 | 67.86 | 74.56 | 6.70 |
| 7 | 34.5 | 103.4 | 86.2 | 150 | 68.84 | 74.56 | 5.72 |
| 8 | 62.1 | 103.4 | 113.8 | 70 | 53.80 | 51.89 | −1.91 |
| 9 | 62.1 | 103.4 | 113.8 | 70 | 52.70 | 51.89 | −0.81 |
| 10 | 62.1 | 103.4 | 113.8 | 100 | 61.33 | 57.29 | −4.04 |
| Pressure | 34.5 Base/86.5 kPa TMP 2 | 62.1 Base/113.8 kPa TMP 2 | ||
|---|---|---|---|---|
| DF 1, % | 100 | 150 | 70 | 100 |
| Item | Mean ± SD (n = 5) | Mean ± SD (n = 3) | Mean ± SD (n = 3) | - |
| SP R, % | 65.4 ± 2.11 | 68.4 ± 0.64 | 53.3 ± 0.78 | 61.3 |
| CN/TNK | 0.92 ± 0.01 | 0.92 ± 0.00 | 0.90 ± 0.01 | 0.91 |
| CN/TP | 0.92 ± 0.01 | 0.93 ± 0.01 | 0.90 ± 0.00 | 0.92 |
| Rej CN | 0.98 ± 0.00 | 0.99 ± 0.01 | 0.99 ± 0.00 | 0.98 |
| Rej SP | 0.27 ± 0.02 | 0.27 ± 0.01 | 0.38 ± 0.01 | 0.30 |
Publisher’s Note: MDPI stays neutral with regard to jurisdictional claims in published maps and institutional affiliations. |
© 2021 by the authors. Licensee MDPI, Basel, Switzerland. This article is an open access article distributed under the terms and conditions of the Creative Commons Attribution (CC BY) license (https://creativecommons.org/licenses/by/4.0/).
Share and Cite
Marella, C.; Sunkesula, V.; Hammam, A.R.A.; Kommineni, A.; Metzger, L.E. Optimization of Spiral-Wound Microfiltration Process Parameters for the Production of Micellar Casein Concentrate. Membranes 2021, 11, 656. https://doi.org/10.3390/membranes11090656
Marella C, Sunkesula V, Hammam ARA, Kommineni A, Metzger LE. Optimization of Spiral-Wound Microfiltration Process Parameters for the Production of Micellar Casein Concentrate. Membranes. 2021; 11(9):656. https://doi.org/10.3390/membranes11090656
Chicago/Turabian StyleMarella, Chenchaiah, Venkateswarlu Sunkesula, Ahmed R. A. Hammam, Anil Kommineni, and Lloyd E. Metzger. 2021. "Optimization of Spiral-Wound Microfiltration Process Parameters for the Production of Micellar Casein Concentrate" Membranes 11, no. 9: 656. https://doi.org/10.3390/membranes11090656
APA StyleMarella, C., Sunkesula, V., Hammam, A. R. A., Kommineni, A., & Metzger, L. E. (2021). Optimization of Spiral-Wound Microfiltration Process Parameters for the Production of Micellar Casein Concentrate. Membranes, 11(9), 656. https://doi.org/10.3390/membranes11090656