
Sustainable Membrane-Based Wastewater Reclamation Employing CO2 to Impede an Ionic Precipitation and Consequent Scale Progression onto the Membrane Surfaces


Abstract
: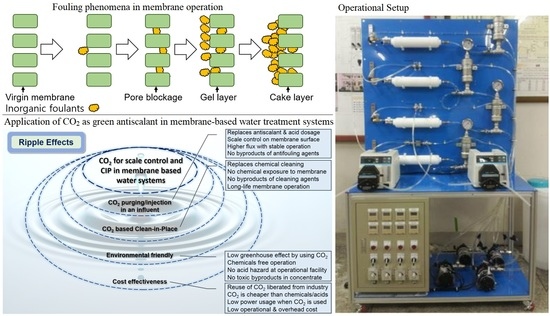
1. Introduction
2. Materials and Methods
2.1. Membranes and Chemical Agents
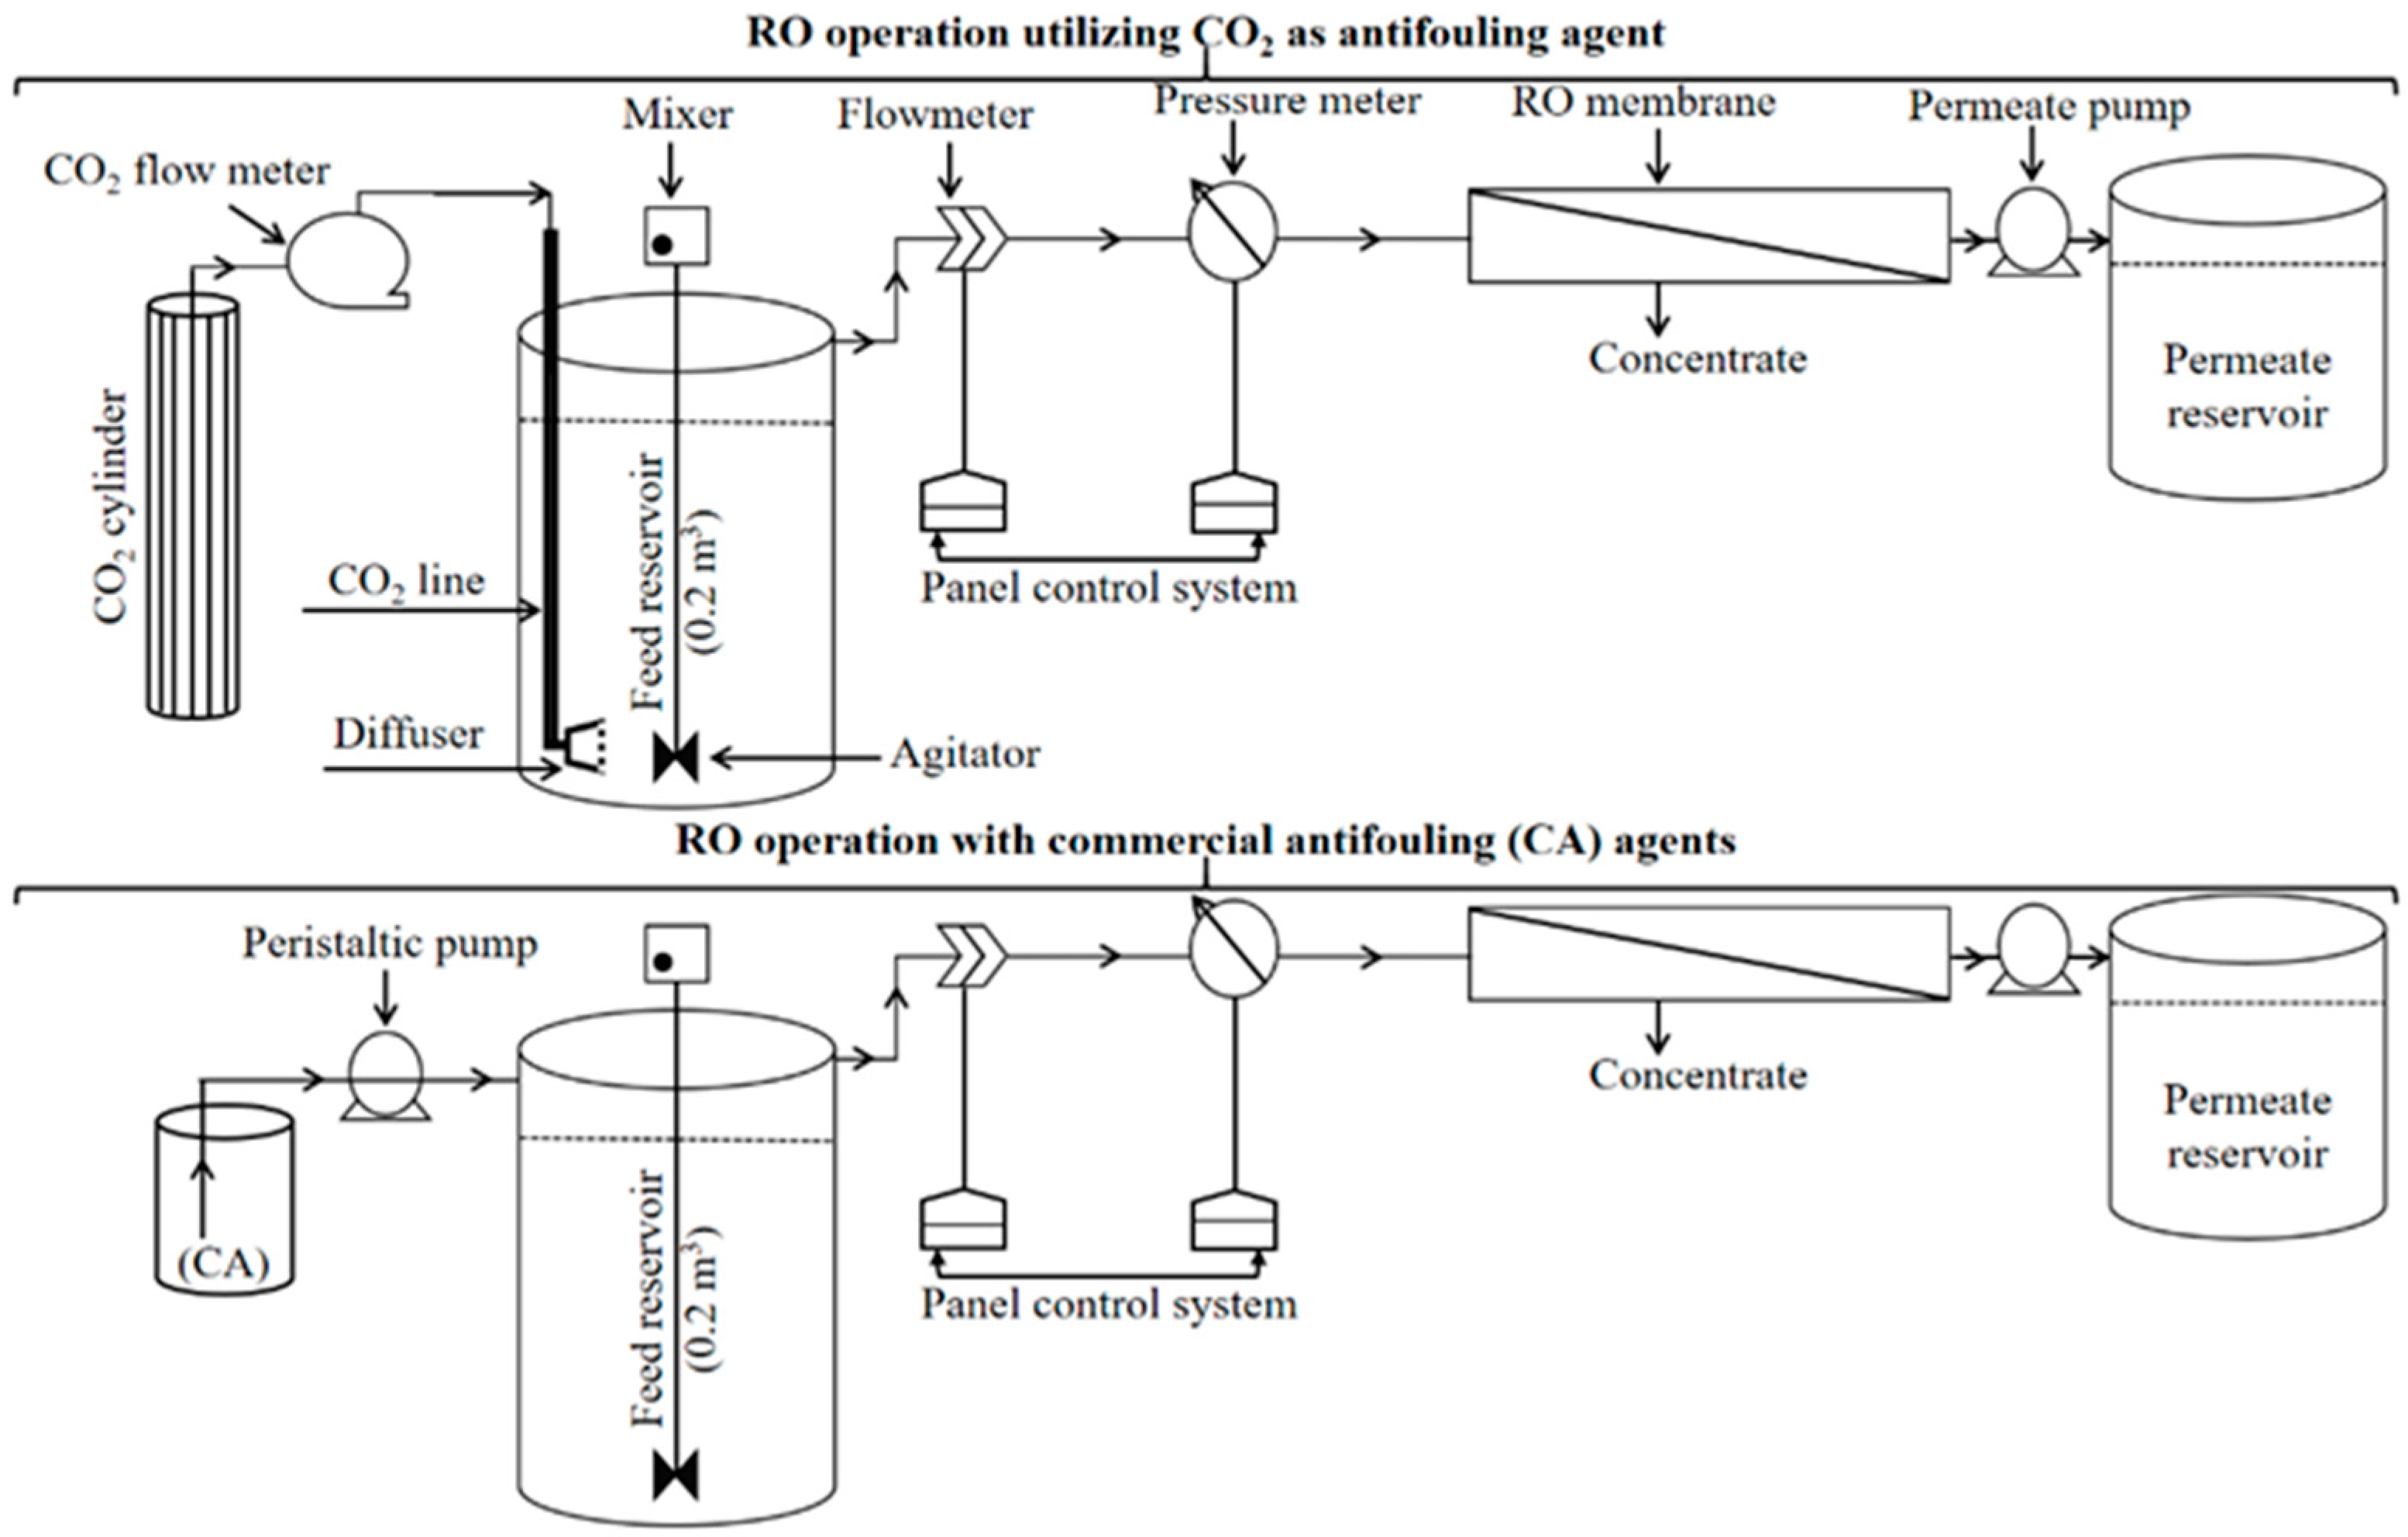
2.2. Membrane Operations
2.3. Instrumentation
3. Results and Discussion
3.1. Operational Performances of RO Schemes
3.2. Mass Balance Estimation for Monobalent and Divalent Ions
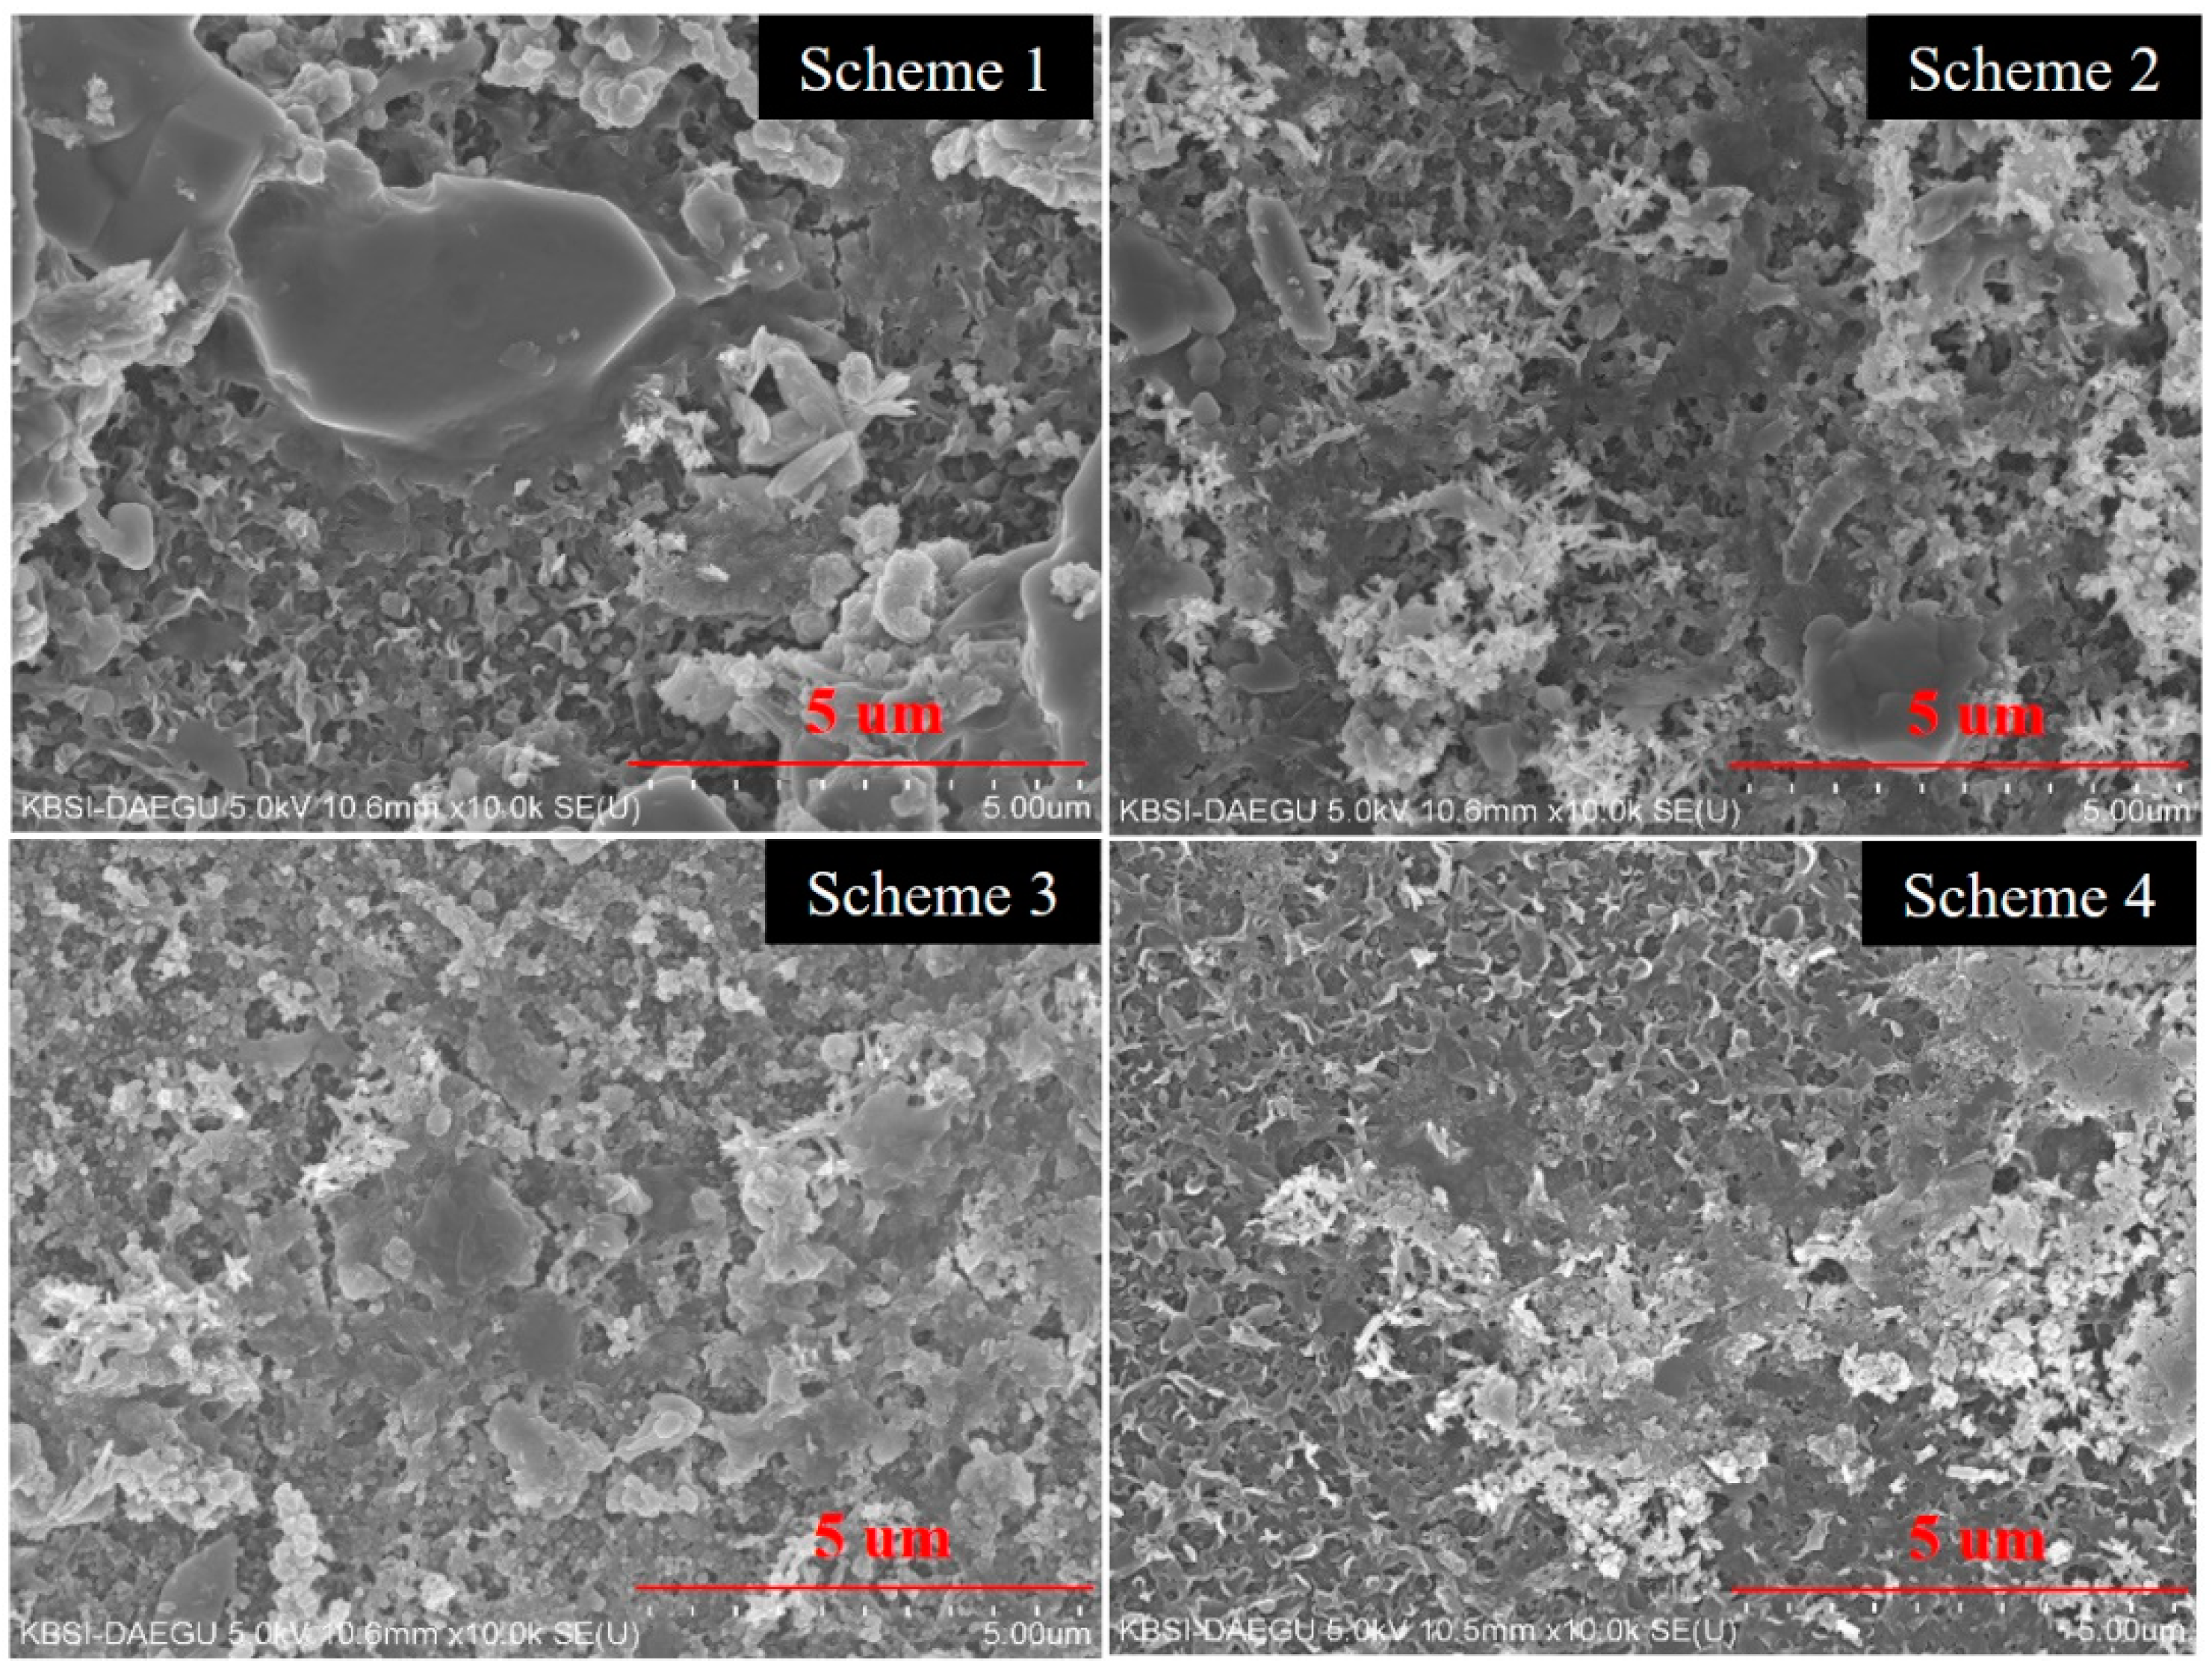
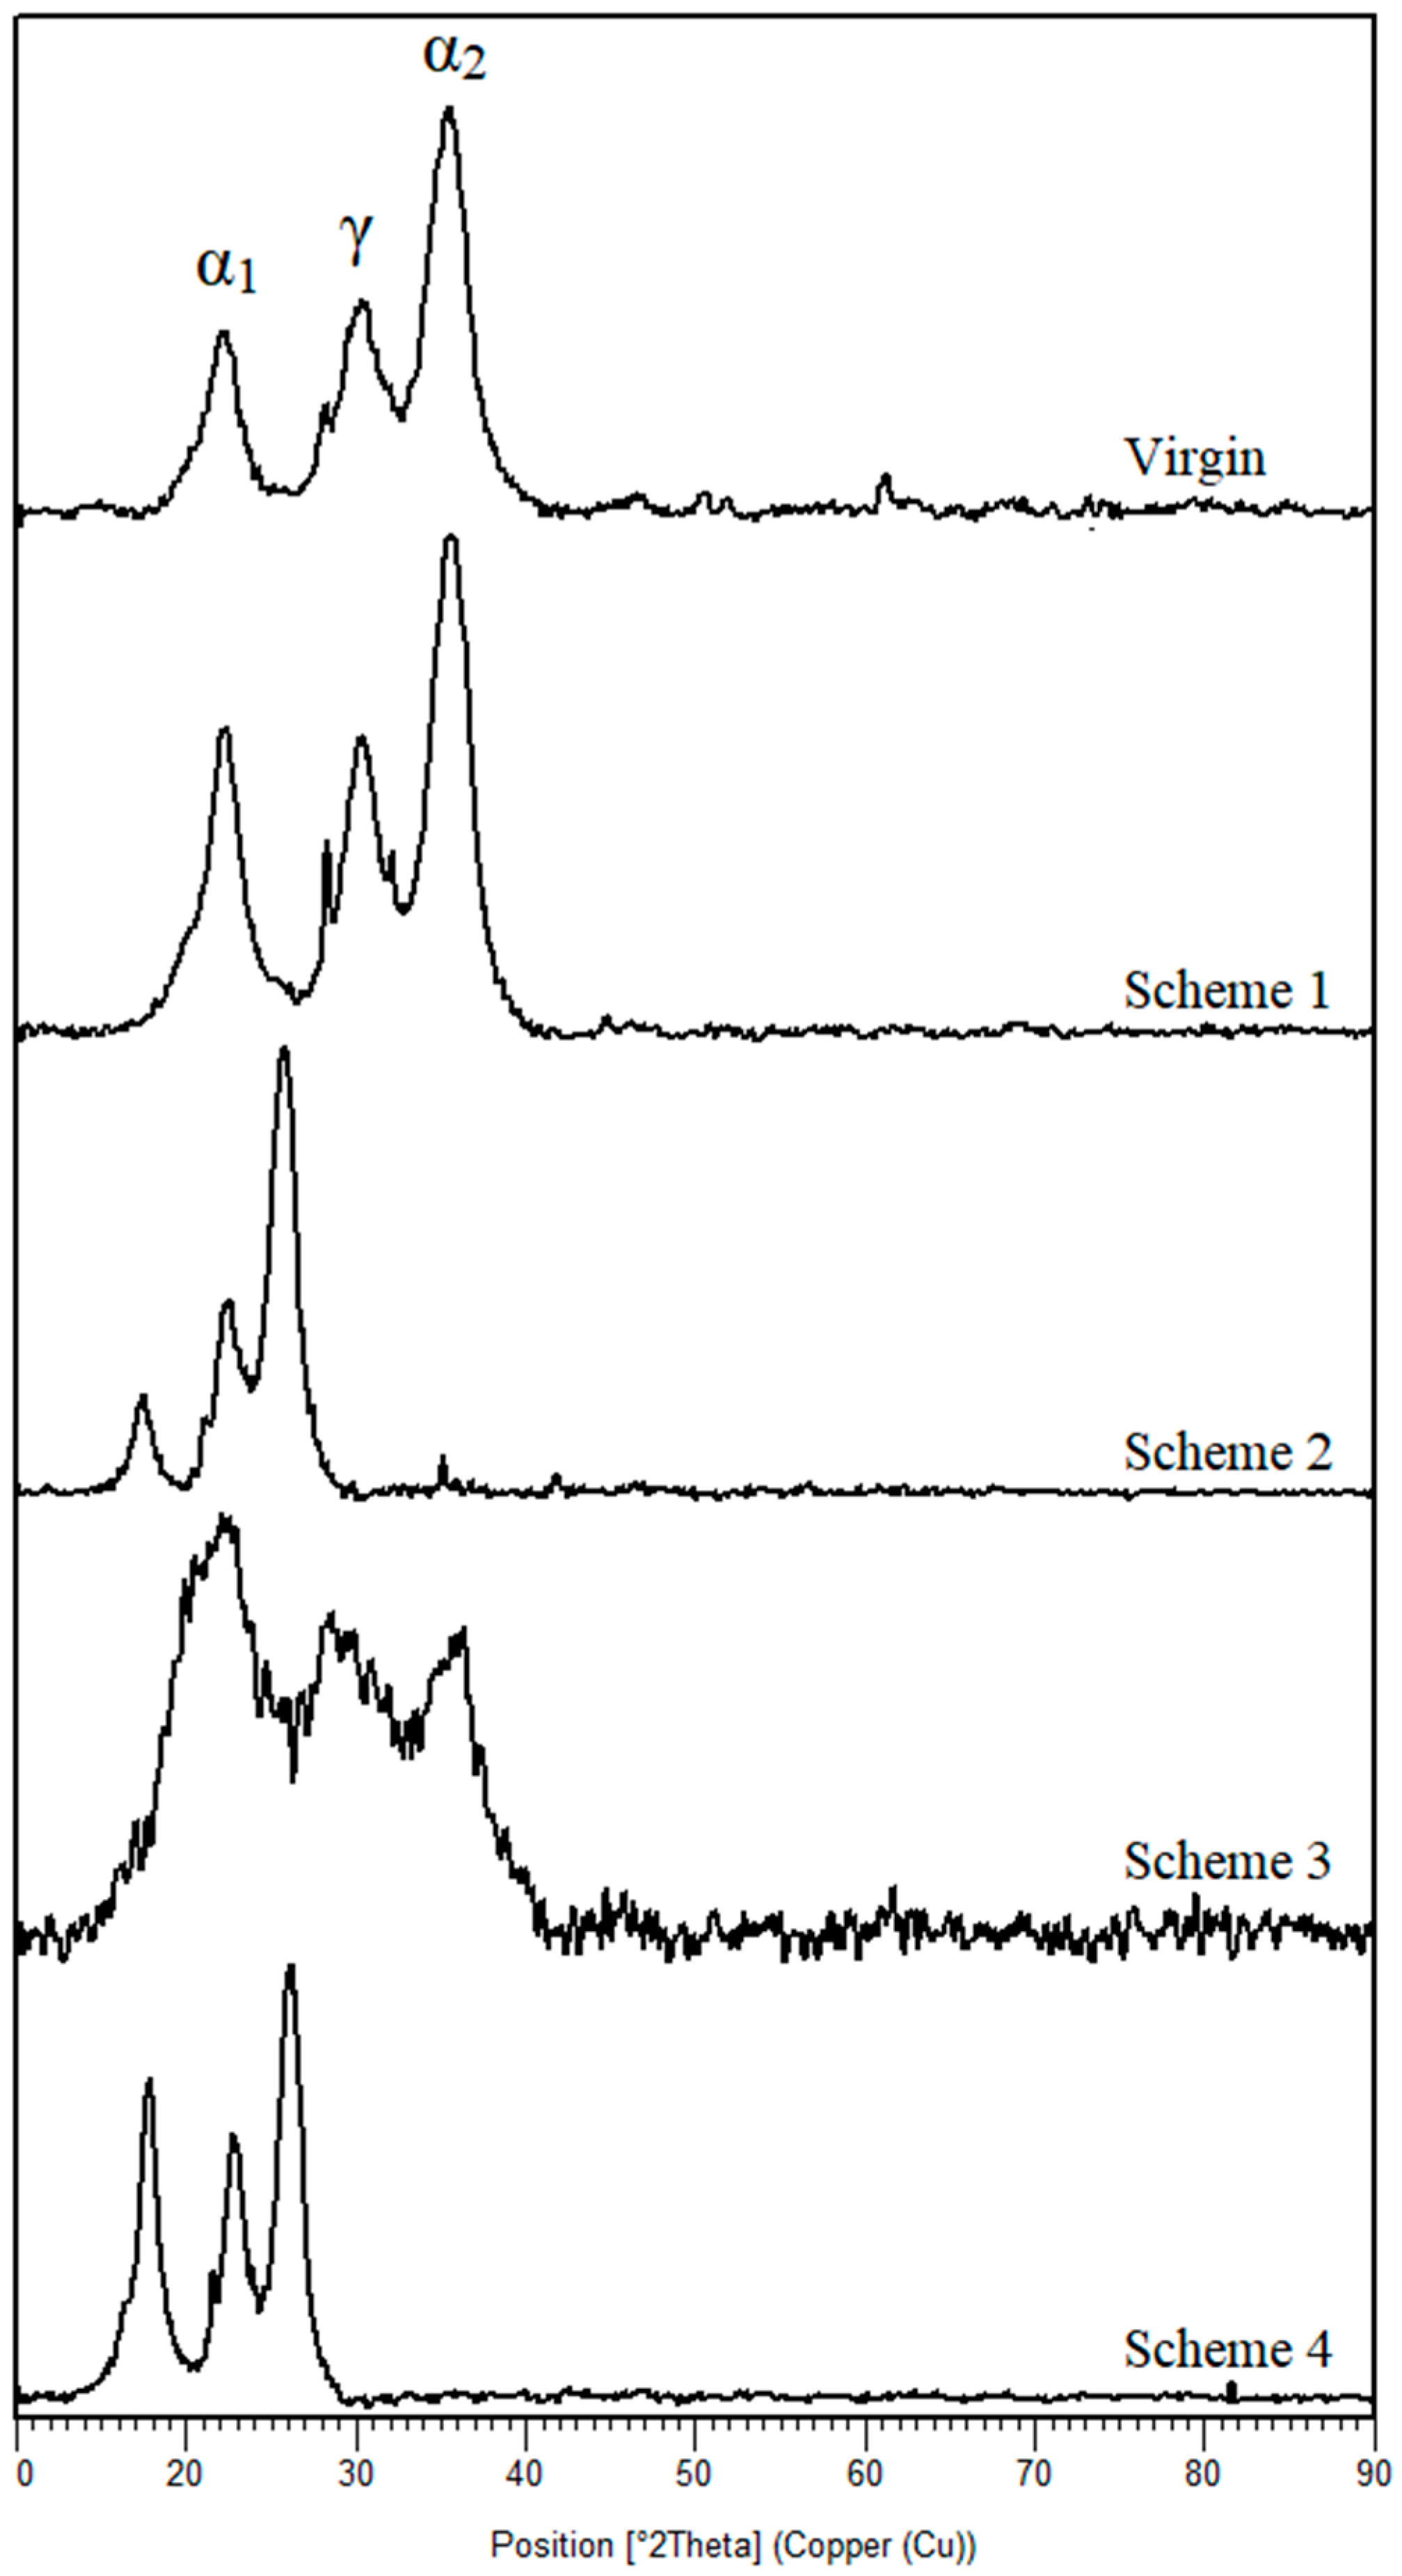
3.3. Membrane Surface Analysis
3.4. Cost Assessment
4. Conclusions
Author Contributions
Funding
Institutional Review Board Statement
Informed Consent Statement
Data Availability Statement
Acknowledgments
Conflicts of Interest
References
- Shen, D. Climatic Change and Water Resources. In Water Resources Management of the People’s Republic of China; Shen, D., Ed.; Springer International Publishing: Cham, Switzerland, 2021; pp. 409–430. ISBN 978-3-030-61931-2. [Google Scholar]
- Higuera, P.E.; Abatzoglou, J.T. Record-setting climate enabled the extraordinary 2020 fire season in the western United States. Glob. Chang. Biol. 2021, 27, 1–2. [Google Scholar] [CrossRef]
- Fawzy, S.; Osman, A.I.; Doran, J.; Rooney, D.W. Strategies for mitigation of climate change: A review. Environ. Chem. Lett. 2020, 18, 2069–2094. [Google Scholar] [CrossRef]
- Al-Ghussain, L. Global warming: Review on driving forces and mitigation. Environ. Prog. Sustain. Energy 2019, 38, 13–21. [Google Scholar] [CrossRef] [Green Version]
- Shahid, M.K.; Batool, A.; Kashif, A.; Nawaz, M.H.; Aslam, M.; Iqbal, N.; Choi, Y. Biofuels and biorefineries: Development, application and future perspectives emphasizing the environmental and economic aspects. J. Environ. Manag. 2021, 297, 113268. [Google Scholar] [CrossRef] [PubMed]
- Bahir, M.; Ouhamdouch, S.; Ouazar, D. An assessment of the changes in the behavior of the groundwater resources in arid environment with global warming in Morocco. Groundw. Sustain. Dev. 2021, 12, 100541. [Google Scholar] [CrossRef]
- Zandalinas, S.I.; Fritschi, F.B.; Mittler, R. Global Warming, Climate Change, and Environmental Pollution: Recipe for a Multifactorial Stress Combination Disaster. Trends Plant Sci. 2021, 26, 588–599. [Google Scholar] [CrossRef]
- Azam, A.; Rafiq, M.; Shafique, M.; Yuan, J. An empirical analysis of the non-linear effects of natural gas, nuclear energy, renewable energy and ICT-Trade in leading CO2 emitter countries: Policy towards CO2 mitigation and economic sustainability. J. Environ. Manag. 2021, 286, 112232. [Google Scholar] [CrossRef]
- Al-Harahsheh, M.; Al-Khatib, R.; Al-Rawajfeh, A. Carbon dioxide storage in Dead Sea water. J. Ind. Eng. Chem. 2021. [Google Scholar] [CrossRef]
- Song, C.; Liu, Q.; Ji, N.; Deng, S.; Zhao, J.; Li, Y.; Song, Y.; Li, H. Alternative pathways for efficient CO2 capture by hybrid processes—A review. Renew. Sustain. Energy Rev. 2018, 82, 215–231. [Google Scholar] [CrossRef]
- Lian, S.; Song, C.; Liu, Q.; Duan, E.; Ren, H.; Kitamura, Y. Recent advances in ionic liquids-based hybrid processes for CO2 capture and utilization. J. Environ. Sci. 2021, 99, 281–295. [Google Scholar] [CrossRef]
- Dickin, S.; Bayoumi, M.; Giné, R.; Andersson, K.; Jiménez, A. Sustainable sanitation and gaps in global climate policy and financing. NPJ Clean Water 2020, 3, 24. [Google Scholar] [CrossRef]
- Shahid, M.K.; Pyo, M.; Choi, Y. Carbonate scale reduction in reverse osmosis membrane by CO2 in wastewater reclamation. Membr. Water Treat. 2017, 8, 125–136. [Google Scholar] [CrossRef]
- Shahid, M.K.; Kashif, A.; Fuwad, A.; Choi, Y. Current advances in treatment technologies for removal of emerging contaminants from water—A critical review. Coord. Chem. Rev. 2021, 442, 213993. [Google Scholar] [CrossRef]
- Couto, C.F.; Santos, A.V.; Amaral, M.C.S.; Lange, L.C.; de Andrade, L.H.; Foureaux, A.F.S.; Fernandes, B.S. Assessing potential of nanofiltration, reverse osmosis and membrane distillation drinking water treatment for pharmaceutically active compounds (PhACs) removal. J. Water Process Eng. 2020, 33, 101029. [Google Scholar] [CrossRef]
- Rout, P.R.; Shahid, M.K.; Dash, R.R.; Bhunia, P.; Liu, D.; Varjani, S.; Zhang, T.C.; Surampalli, R.Y. Nutrient removal from domestic wastewater: A comprehensive review on conventional and advanced technologies. J. Environ. Manag. 2021, 296, 113246. [Google Scholar] [CrossRef]
- Ying, X.-B.; Huang, J.-J.; Shen, D.-S.; Feng, H.-J.; Jia, Y.-F.; Guo, Q.-Q. Fouling behaviors are different at various negative potentials in electrochemical anaerobic membrane bioreactors with conductive ceramic membranes. Sci. Total Environ. 2021, 761, 143199. [Google Scholar] [CrossRef]
- Aslam, M.; Ahmad, R.; Yasin, M.; Khan, A.L.; Shahid, M.K.; Hossain, S.; Khan, Z.; Jamil, F.; Rafiq, S.; Bilad, M.R.; et al. Anaerobic membrane bioreactors for biohydrogen production: Recent developments, challenges and perspectives. Bioresour. Technol. 2018, 269, 452–464. [Google Scholar] [CrossRef] [PubMed] [Green Version]
- Fritzmann, C.; Löwenberg, J.; Wintgens, T.; Melin, T. State-of-the-art of reverse osmosis desalination. Desalination 2007, 216, 1–76. [Google Scholar] [CrossRef]
- Shahid, M.K.; Kashif, A.; Rout, P.R.; Aslam, M.; Fuwad, A.; Choi, Y.; J, R.B.; Park, J.H.; Kumar, G. A brief review of anaerobic membrane bioreactors emphasizing recent advancements, fouling issues and future perspectives. J. Environ. Manag. 2020, 270, 110909. [Google Scholar] [CrossRef]
- Alnajjar, H.; Tabatabai, A.; Alpatova, A.; Leiknes, T.; Ghaffour, N. Organic fouling control in reverse osmosis (RO) by effective membrane cleaning using saturated CO2 solution. Sep. Purif. Technol. 2021, 264, 118410. [Google Scholar] [CrossRef]
- Feiner, M.; Beggel, S.; Jaeger, N.; Geist, J. Increased RO concentrate toxicity following application of antiscalants—Acute toxicity tests with the amphipods Gammarus pulex and Gammarus roeseli. Environ. Pollut. 2015, 197, 309–312. [Google Scholar] [CrossRef] [PubMed]
- Shahid, M.K.; Pyo, M.; Choi, Y.-G. Inorganic fouling control in reverse osmosis wastewater reclamation by purging carbon dioxide. Environ. Sci. Pollut. Res. 2019, 26, 1094–1102. [Google Scholar] [CrossRef] [PubMed]
- Shahid, M.K.; Pyo, M.; Choi, Y.-G. The operation of reverse osmosis system with CO2 as a scale inhibitor: A study on operational behavior and membrane morphology. Desalination 2017, 426, 11–20. [Google Scholar] [CrossRef]
- Cai, Y.-H.; Galili, N.; Gelman, Y.; Herzberg, M.; Gilron, J. Evaluating the impact of pretreatment processes on fouling of reverse osmosis membrane by secondary wastewater. J. Memb. Sci. 2021, 623, 119054. [Google Scholar] [CrossRef]
- Jung, O.; Saravia, F.; Wagner, M.; Heißler, S.; Horn, H. Quantifying Concentration Polarization—Raman Microspectroscopy for In-Situ Measurement in a Flat Sheet Cross-flow Nanofiltration Membrane Unit. Sci. Rep. 2019, 9, 15885. [Google Scholar] [CrossRef] [PubMed] [Green Version]
- Rahardianto, A.; Gu, H.; Khan, B.M.; Plumlee, M.H. Real-time reverse osmosis monitoring for antiscalant dose selection in advanced treatment of wastewater. AWWA Water Sci. 2020, 2, e1196. [Google Scholar] [CrossRef]
- Shahid, M.K.; Choi, Y.-G. The comparative study for scale inhibition on surface of RO membranes in wastewater reclamation: CO2 purging versus three different antiscalants. J. Memb. Sci. 2017, 546, 61–69. [Google Scholar] [CrossRef]
- Alpatova, A.; Qamar, A.; Al-Ghamdi, M.; Lee, J.; Ghaffour, N. Effective membrane backwash with carbon dioxide under severe fouling and operation conditions. J. Memb. Sci. 2020, 611, 118290. [Google Scholar] [CrossRef]
- Mangal, M.N.; Salinas-Rodriguez, S.G.; Dusseldorp, J.; Kemperman, A.J.B.; Schippers, J.C.; Kennedy, M.D.; van der Meer, W.G.J. Effectiveness of antiscalants in preventing calcium phosphate scaling in reverse osmosis applications. J. Memb. Sci. 2021, 623, 119090. [Google Scholar] [CrossRef]
- García-Triñanes, P.; Chairopoulou, M.A.; Campos, L.C. Investigating reverse osmosis membrane fouling and scaling by membrane autopsy of a bench scale device. Environ. Technol. 2021, 1–14. [Google Scholar] [CrossRef] [PubMed]
- Yanar, N.; Liang, Y.; Yang, E.; Park, H.; Son, M.; Choi, H. Electrically Polarized Graphene-Blended Spacers for Organic Fouling Reduction in Forward Osmosis. Membranes 2021, 11, 36. [Google Scholar] [CrossRef] [PubMed]
- Bristow, N.W.; Vogt, S.J.; Bucs, S.S.; Vrouwenvelder, J.S.; Johns, M.L.; Fridjonsson, E.O. Novel Magnetic Resonance Measurements of Fouling in Operating Spiral Wound Reverse Osmosis Membrane Modules. Water Res. 2021, 196, 117006. [Google Scholar] [CrossRef]
- Yaagoob, I.Y.; Aldahdooh, M.K.; Al-Taq, A.A.; Al-Muallem, H.A.; Mazumder, M.A.J.; Ali, S.A. Synthesis of stimuli-responsive ionic cyclopolymers in search of phosphorous-free antiscalants. J. Appl. Polym. Sci. 2021, 138, 50402. [Google Scholar] [CrossRef]
- Kerdi, S.; Qamar, A.; Alpatova, A.; Vrouwenvelder, J.S.; Ghaffour, N. Membrane filtration performance enhancement and biofouling mitigation using symmetric spacers with helical filaments. Desalination 2020, 484, 114454. [Google Scholar] [CrossRef] [Green Version]
- Cai, Y.-H.; Burkhardt, C.J.; Schäfer, A.I. Renewable energy powered membrane technology: Impact of osmotic backwash on scaling during solar irradiance fluctuation. J. Memb. Sci. 2021, 619, 118799. [Google Scholar] [CrossRef]
- Guillen-Burrieza, E.; Thomas, R.; Mansoor, B.; Johnson, D.; Hilal, N.; Arafat, H. Effect of dry-out on the fouling of PVDF and PTFE membranes under conditions simulating intermittent seawater membrane distillation (SWMD). J. Memb. Sci. 2013, 438, 126–139. [Google Scholar] [CrossRef]
- Melliti, E.; Touati, K.; Van der Bruggen, B.; Elfil, H. Effect of Fe2+ ions on gypsum precipitation during bulk crystallization of reverse osmosis concentrates. Chemosphere 2021, 263, 127866. [Google Scholar] [CrossRef] [PubMed]
- Lin, D.; Bai, L.; Xu, D.; Zhang, H.; Guo, T.; Li, G.; Liang, H. Effects of oxidation on humic-acid-enhanced gypsum scaling in different nanofiltration phases: Performance, mechanisms and prediction by differential log-transformed absorbance spectroscopy. Water Res. 2021, 195, 116989. [Google Scholar] [CrossRef]
- Ben Ahmed, S.; Tlili, M.M.; Ben Amor, M. Influence of a polyacrylate antiscalant on gypsum nucleation and growth. Cryst. Res. Technol. 2008, 43, 935–942. [Google Scholar] [CrossRef]
- Prisciandaro, M.; Olivieri, E.; Lancia, A.; Musmarra, D. PBTC as an antiscalant for gypsum precipitation: Interfacial tension and activation energy estimation. Ind. Eng. Chem. Res. 2012, 51, 12844–12851. [Google Scholar] [CrossRef]
- Jiang, W.; Xu, X.; Lin, L.; Wang, H.; Shaw, R.; Lucero, D.; Xu, P. A Pilot Study of an Electromagnetic Field for Control of Reverse Osmosis Membrane Fouling and Scaling During Brackish Groundwater Desalination. Water 2019, 11, 1015. [Google Scholar] [CrossRef] [Green Version]
- Mehta, B.B.; Joshi, R.N.; Raval, H.D. A novel ultra-low energy reverse osmosis membrane modified by chitosan with glutaraldehyde crosslinking. J. Appl. Polym. Sci. 2018, 135, 45971. [Google Scholar] [CrossRef]
- Raval, H.D.; Samnani, M.D.; Gauswami, M. V Surface modification of thin film composite reverse osmosis membrane by glycerol assisted oxidation with sodium hypochlorite. Appl. Surf. Sci. 2018, 427, 37–44. [Google Scholar] [CrossRef]
- Farias-Aguilar, J.C.; Ramírez-Moreno, M.J.; Téllez-Jurado, L.; Balmori-Ramírez, H. Low pressure and low temperature synthesis of polyamide-6 (PA6) using Na0 as catalyst. Mater. Lett. 2014, 136, 388–392. [Google Scholar] [CrossRef]
- Hart, P.W.; Colson, G.W.; Burris, J. Application of carbon dioxide to reduce water-side lime scale in heat exchangers. J. Sci. Technol. For. Prod. Process. 2011, 1, 67–70. [Google Scholar]
- Gao, Y.; Qin, J.; Wang, Z.; Østerhus, S.W. Backpulsing technology applied in MF and UF processes for membrane fouling mitigation: A review. J. Memb. Sci. 2019, 587, 117136. [Google Scholar] [CrossRef]


| Parameter | Analytical Result | Parameter | Analytical Result |
|---|---|---|---|
| pH | 7.11–7.25 | Conductivity | 1850–2450 µS/cm |
| Na+ | 470–490 mg/L | K+ | 50 ± 5 mg/L |
| Ca2+ | 190–210 mg/L | Mg2+ | 85–105 mg/L |
Publisher’s Note: MDPI stays neutral with regard to jurisdictional claims in published maps and institutional affiliations. |
© 2021 by the authors. Licensee MDPI, Basel, Switzerland. This article is an open access article distributed under the terms and conditions of the Creative Commons Attribution (CC BY) license (https://creativecommons.org/licenses/by/4.0/).
Share and Cite
Shahid, M.K.; Choi, Y. Sustainable Membrane-Based Wastewater Reclamation Employing CO2 to Impede an Ionic Precipitation and Consequent Scale Progression onto the Membrane Surfaces. Membranes 2021, 11, 688. https://doi.org/10.3390/membranes11090688
Shahid MK, Choi Y. Sustainable Membrane-Based Wastewater Reclamation Employing CO2 to Impede an Ionic Precipitation and Consequent Scale Progression onto the Membrane Surfaces. Membranes. 2021; 11(9):688. https://doi.org/10.3390/membranes11090688
Chicago/Turabian StyleShahid, Muhammad Kashif, and Younggyun Choi. 2021. "Sustainable Membrane-Based Wastewater Reclamation Employing CO2 to Impede an Ionic Precipitation and Consequent Scale Progression onto the Membrane Surfaces" Membranes 11, no. 9: 688. https://doi.org/10.3390/membranes11090688