

Analysis of the Influence of Process Parameters on the Properties of Homogeneous and Heterogeneous Membranes for Gas Separation


Abstract
:1. Introduction
2. Materials and Methods
2.1. Flat Membranes
2.2. Time Lag Method
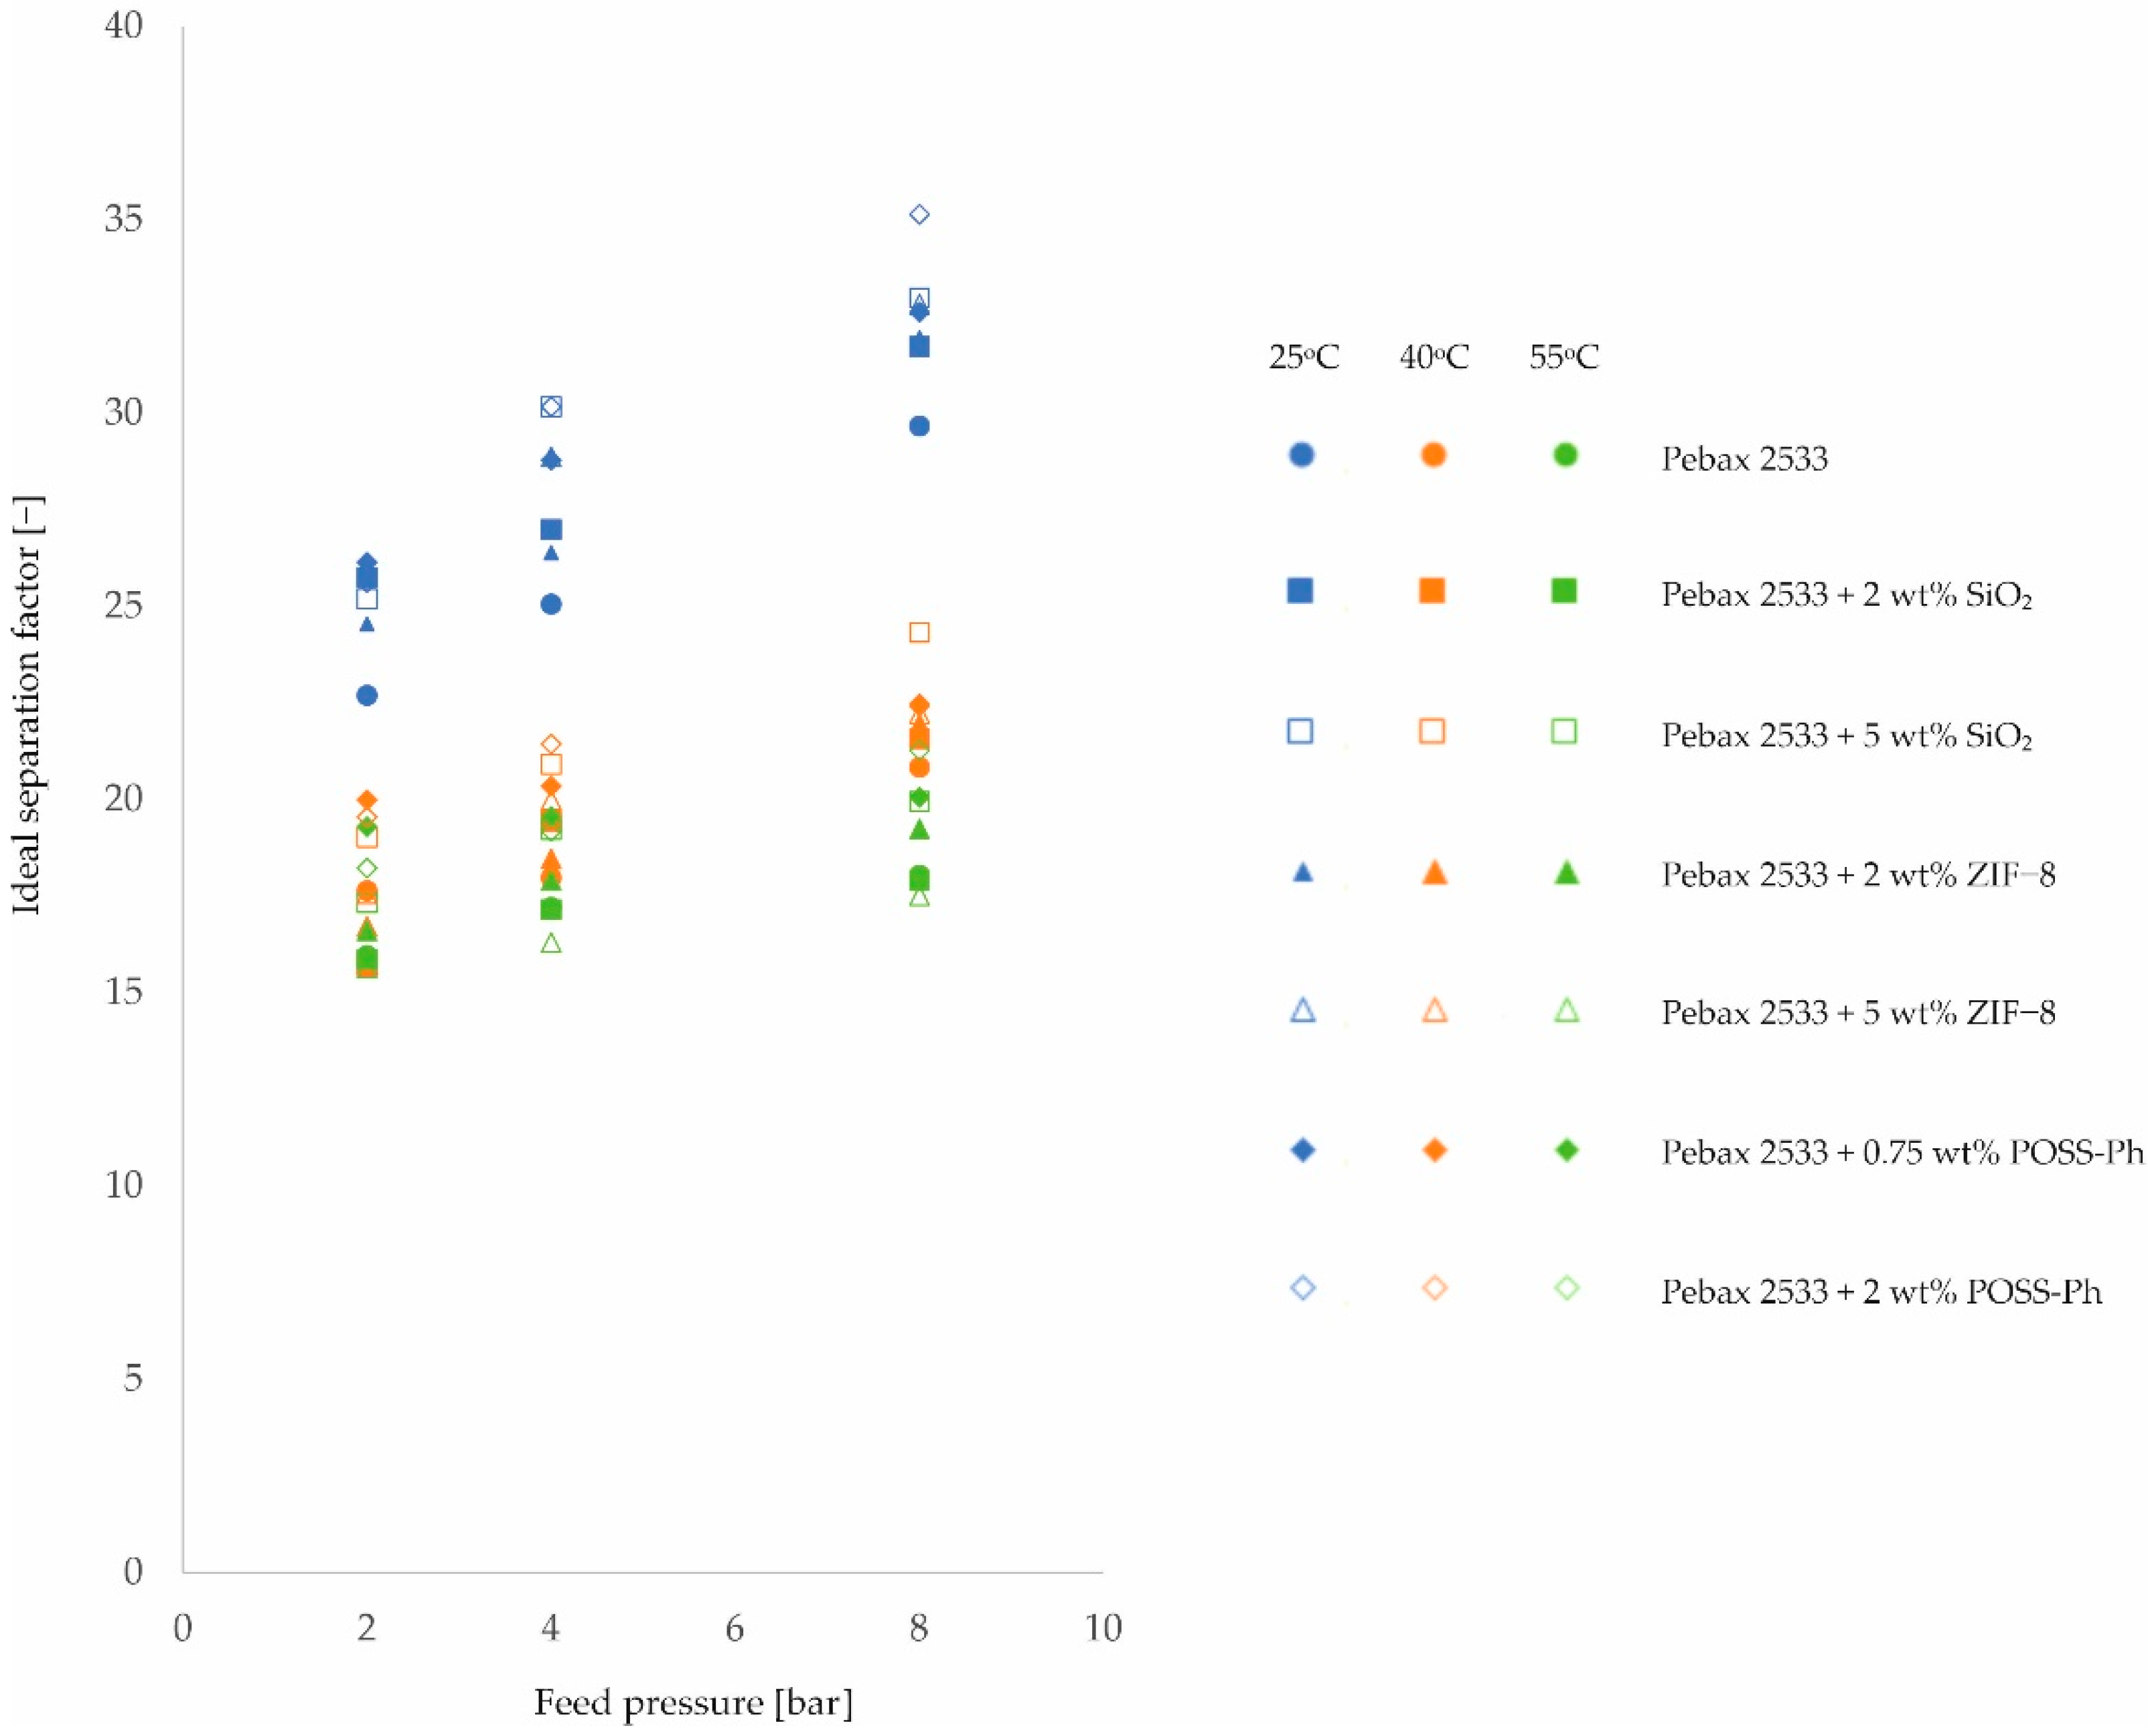
3. Results and Discussion
4. Conclusions
Author Contributions
Funding
Institutional Review Board Statement
Data Availability Statement
Conflicts of Interest
Appendix A

| Membrane Type | Feed Pressure [bar] | Permeability Pi [barrer] | ||||||||
|---|---|---|---|---|---|---|---|---|---|---|
| N2 | CH4 | CO2 | ||||||||
| Process Temperature [ °C] | Process Temperature [ °C] | Process Temperature [ °C] | ||||||||
| 25 | 4[°C] | 55 | 25 | 4[°C] | 55 | 25 | 4[°C] | 55 | ||
| PEBAX 2533 | 2 | 5.5 | 11.8 | 13.4 | 20.4 | 39.0 | 46.1 | 123.7 | 207.9 | 214.0 |
| ±0.1 | ±0.3 | ±0.3 | ±0.3 | ±0.6 | ±0.7 | ±1.0 | ±1.7 | ±1.7 | ||
| 4 | 5.3 | 11.7 | 12.7 | 19.2 | 37.2 | 44.7 | 132.8 | 210.4 | 218.7 | |
| ±0.1 | ±0.3 | ±0.3 | ±0.3 | ±0.6 | ±0.7 | ±1.1 | ±1.7 | ±1.7 | ||
| 8 | 4.9 | 10.0 | 12.3 | 18.7 | 33.5 | 41.9 | 145.4 | 208.4 | 222.0 | |
| ±0.1 | ±0.3 | ±0.3 | ±0.3 | ±0.5 | ±0.7 | ±1.2 | ±1.7 | ±1.8 | ||
| Membrane Type | Feed Pressure [bar] | Permeability Pi [barrer] | ||||||||
|---|---|---|---|---|---|---|---|---|---|---|
| N2 | CH4 | CO2 | ||||||||
| Process Temperature [ °C] | Process Temperature [ °C] | Process Temperature [ °C] | ||||||||
| 25 | 4[°C] | 55 | 25 | 4[°C] | 55 | 25 | 4[°C] | 55 | ||
| PEBAX 2533 +2 wt% SiO2 | 2 | 6.0 | 14.6 | 17.0 | 20.5 | 42.3 | 50.0 | 155.7 | 230.2 | 269.2 |
| ±0.2 | ±0.4 | ±0.4 | ±0.3 | ±0.7 | ±0.8 | ±1.2 | ±1.8 | ±2.2 | ||
| 4 | 5.9 | 12.2 | 15.8 | 20.3 | 38.0 | 49.4 | 158.0 | 238.1 | 270.6 | |
| ±0.1 | ±0.3 | ±0.4 | ±0.3 | ±0.6 | ±0.8 | ±1.3 | ±1.9 | ±2.2 | ||
| 8 | 5.1 | 11.2 | 15.1 | 19.0 | 38.1 | 46.9 | 162.3 | 240.9 | 269.7 | |
| ±0.1 | ±0.3 | ±0.4 | ±0.3 | ±0.6 | ±0.8 | ±1.3 | ±1.9 | ±2.2 | ||
| PEBAX 2533 +5 wt% SiO2 | 2 | 6.6 | 12.8 | 16.1 | 23.2 | 41.0 | 49.8 | 167.0 | 243.8 | 279.8 |
| ±0.2 | ±0.3 | ±0.4 | ±0.4 | ±0.7 | ±0.8 | ±1.3 | ±2.0 | ±2.2 | ||
| 4 | 5.6 | 12.4 | 14.7 | 21.3 | 39.8 | 47.6 | 169.5 | 258.6 | 282.5 | |
| ±0.1 | ±0.3 | ±0.4 | ±0.3 | ±0.6 | ±0.8 | ±1.4 | ±2.1 | ±2.3 | ||
| 8 | 5.2 | 10.5 | 14.0 | 19.2 | 36.7 | 44.3 | 171.5 | 256.4 | 280.4 | |
| ±0.1 | ±0.3 | ±0.4 | ±0.3 | ±0.6 | ±0.7 | ±1.4 | ±2.1 | ±2.2 | ||
| Membrane Type | Feed Pressure [bar] | Permeability Pi [barrer] | ||||||||
|---|---|---|---|---|---|---|---|---|---|---|
| N2 | CH4 | CO2 | ||||||||
| Process Temperature [ °C] | Process Temperature [ °C] | Process Temperature [ °C] | ||||||||
| 25 | 4[°C] | 55 | 25 | 4[°C] | 55 | 25 | 4[°C] | 55 | ||
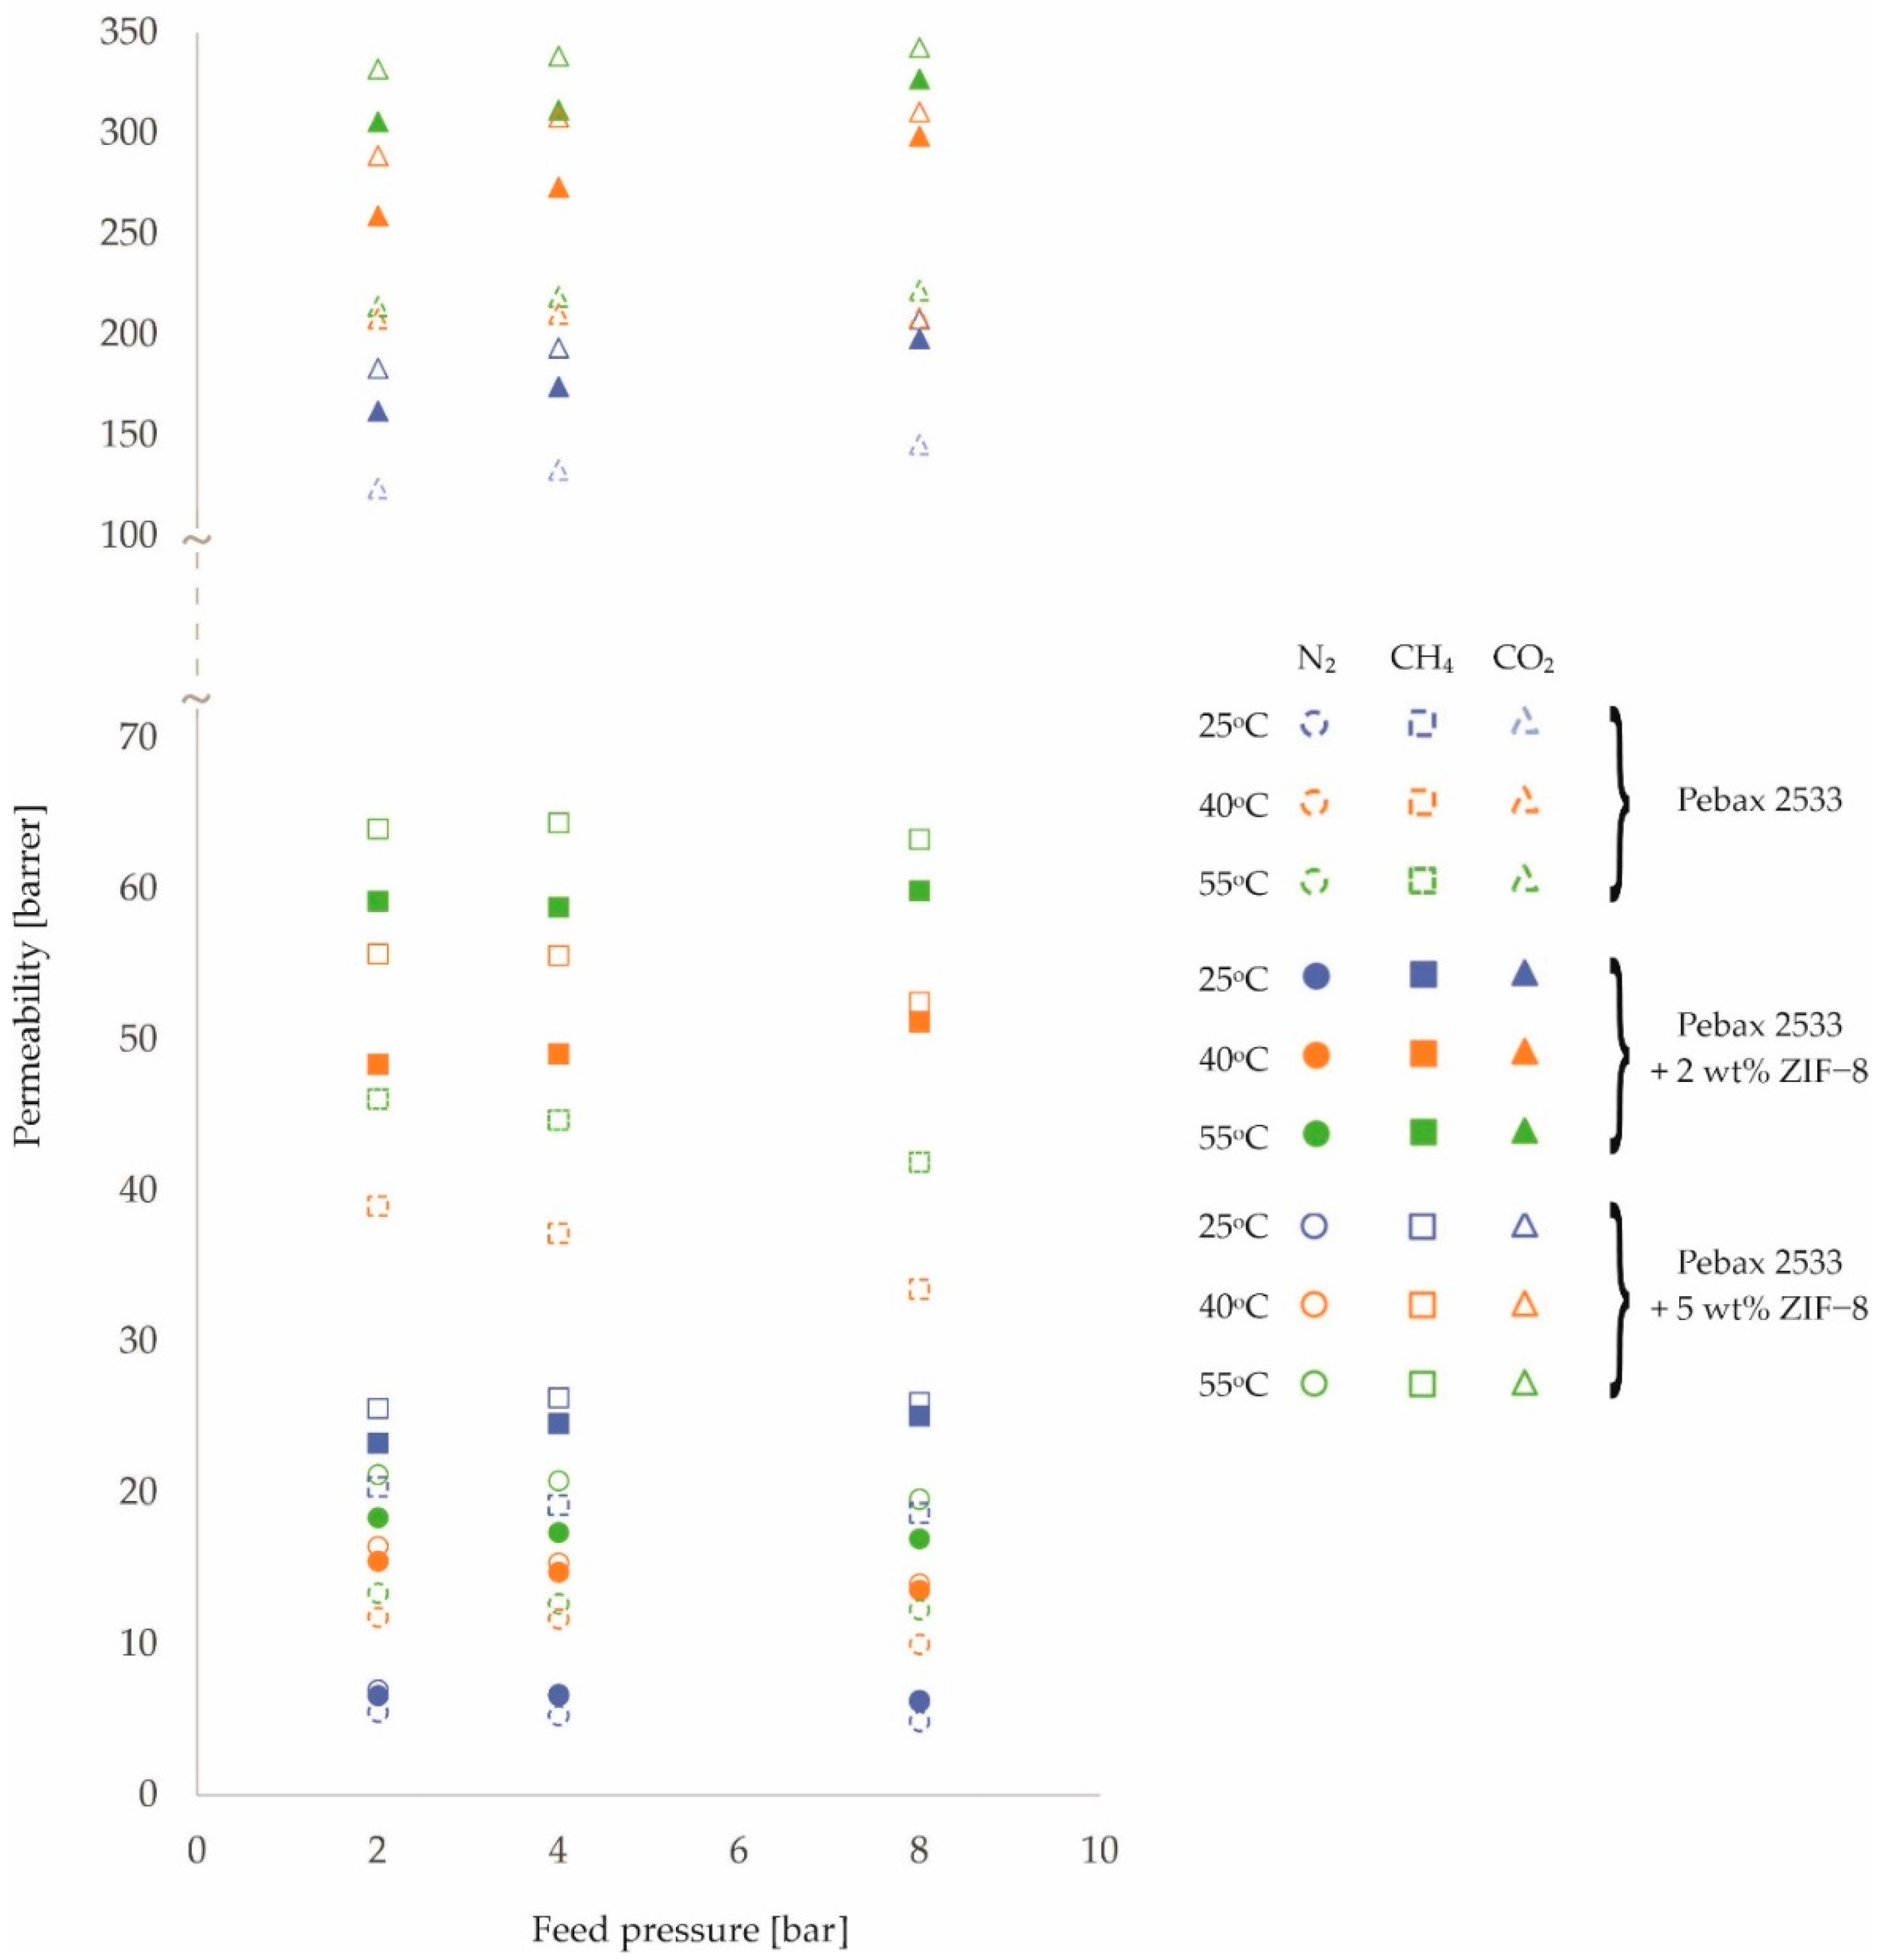
| PEBAX 2533 +2 wt% ZIF−8 | 2 | 6.6 | 15.5 | 18.4 | 23.3 | 48.4 | 59.2 | 162.0 | 259.1 | 305.9 |
| ±0.2 | ±0.4 | ±0.5 | ±0.4 | ±0.8 | ±0.9 | ±1.3 | ±2.1 | ±2.4 | ||
| 4 | 6.6 | 14.8 | 17.4 | 24.6 | 49.1 | 58.8 | 174.2 | 273.3 | 311.6 | |
| ±0.2 | ±0.4 | ±0.4 | ±0.4 | ±0.8 | ±0.9 | ±1.4 | ±2.2 | ±2.5 | ||
| 8 | 6.2 | 13.6 | 17.0 | 25.1 | 51.2 | 59.9 | 198.1 | 298.6 | 327.1 | |
| ±0.2 | ±0.3 | ±0.4 | ±0.4 | ±0.8 | ±1.0 | ±1.6 | ±2.4 | ±2.6 | ||
| PEBAX 2533 +5 wt% ZIF−8 | 2 | 7.0 | 16.5 | 21.2 | 25.6 | 55.7 | 64.0 | 183.3 | 289.0 | 332.0 |
| ±0.2 | ±0.4 | ±0.5 | ±0.4 | ±0.9 | ±1.0 | ±1.5 | ±2.3 | ±2.7 | ||
| 4 | 6.7 | 15.4 | 20.8 | 26.3 | 55.6 | 64.4 | 193.5 | 308.0 | 338.4 | |
| ±0.2 | ±0.4 | ±0.5 | ±0.4 | ±0.9 | ±1.0 | ±1.5 | ±2.5 | ±2.7 | ||
| 8 | 6.3 | 14.0 | 19.6 | 26.0 | 52.5 | 63.3 | 207.7 | 310.8 | 342.7 | |
| ±0.2 | ±0.3 | ±0.5 | ±0.4 | ±0.8 | ±1.0 | ±1.7 | ±2.5 | ±2.7 | ||
| Membrane Type | Feed Pressure [bar] | Permeability Pi [barrer] | ||||||||
|---|---|---|---|---|---|---|---|---|---|---|
| N2 | CH4 | CO2 | ||||||||
| Process Temperature [ °C] | Process Temperature [ °C] | Process Temperature [ °C] | ||||||||
| 25 | 4[°C] | 55 | 25 | 4[°C] | 55 | 25 | 4[°C] | 55 | ||
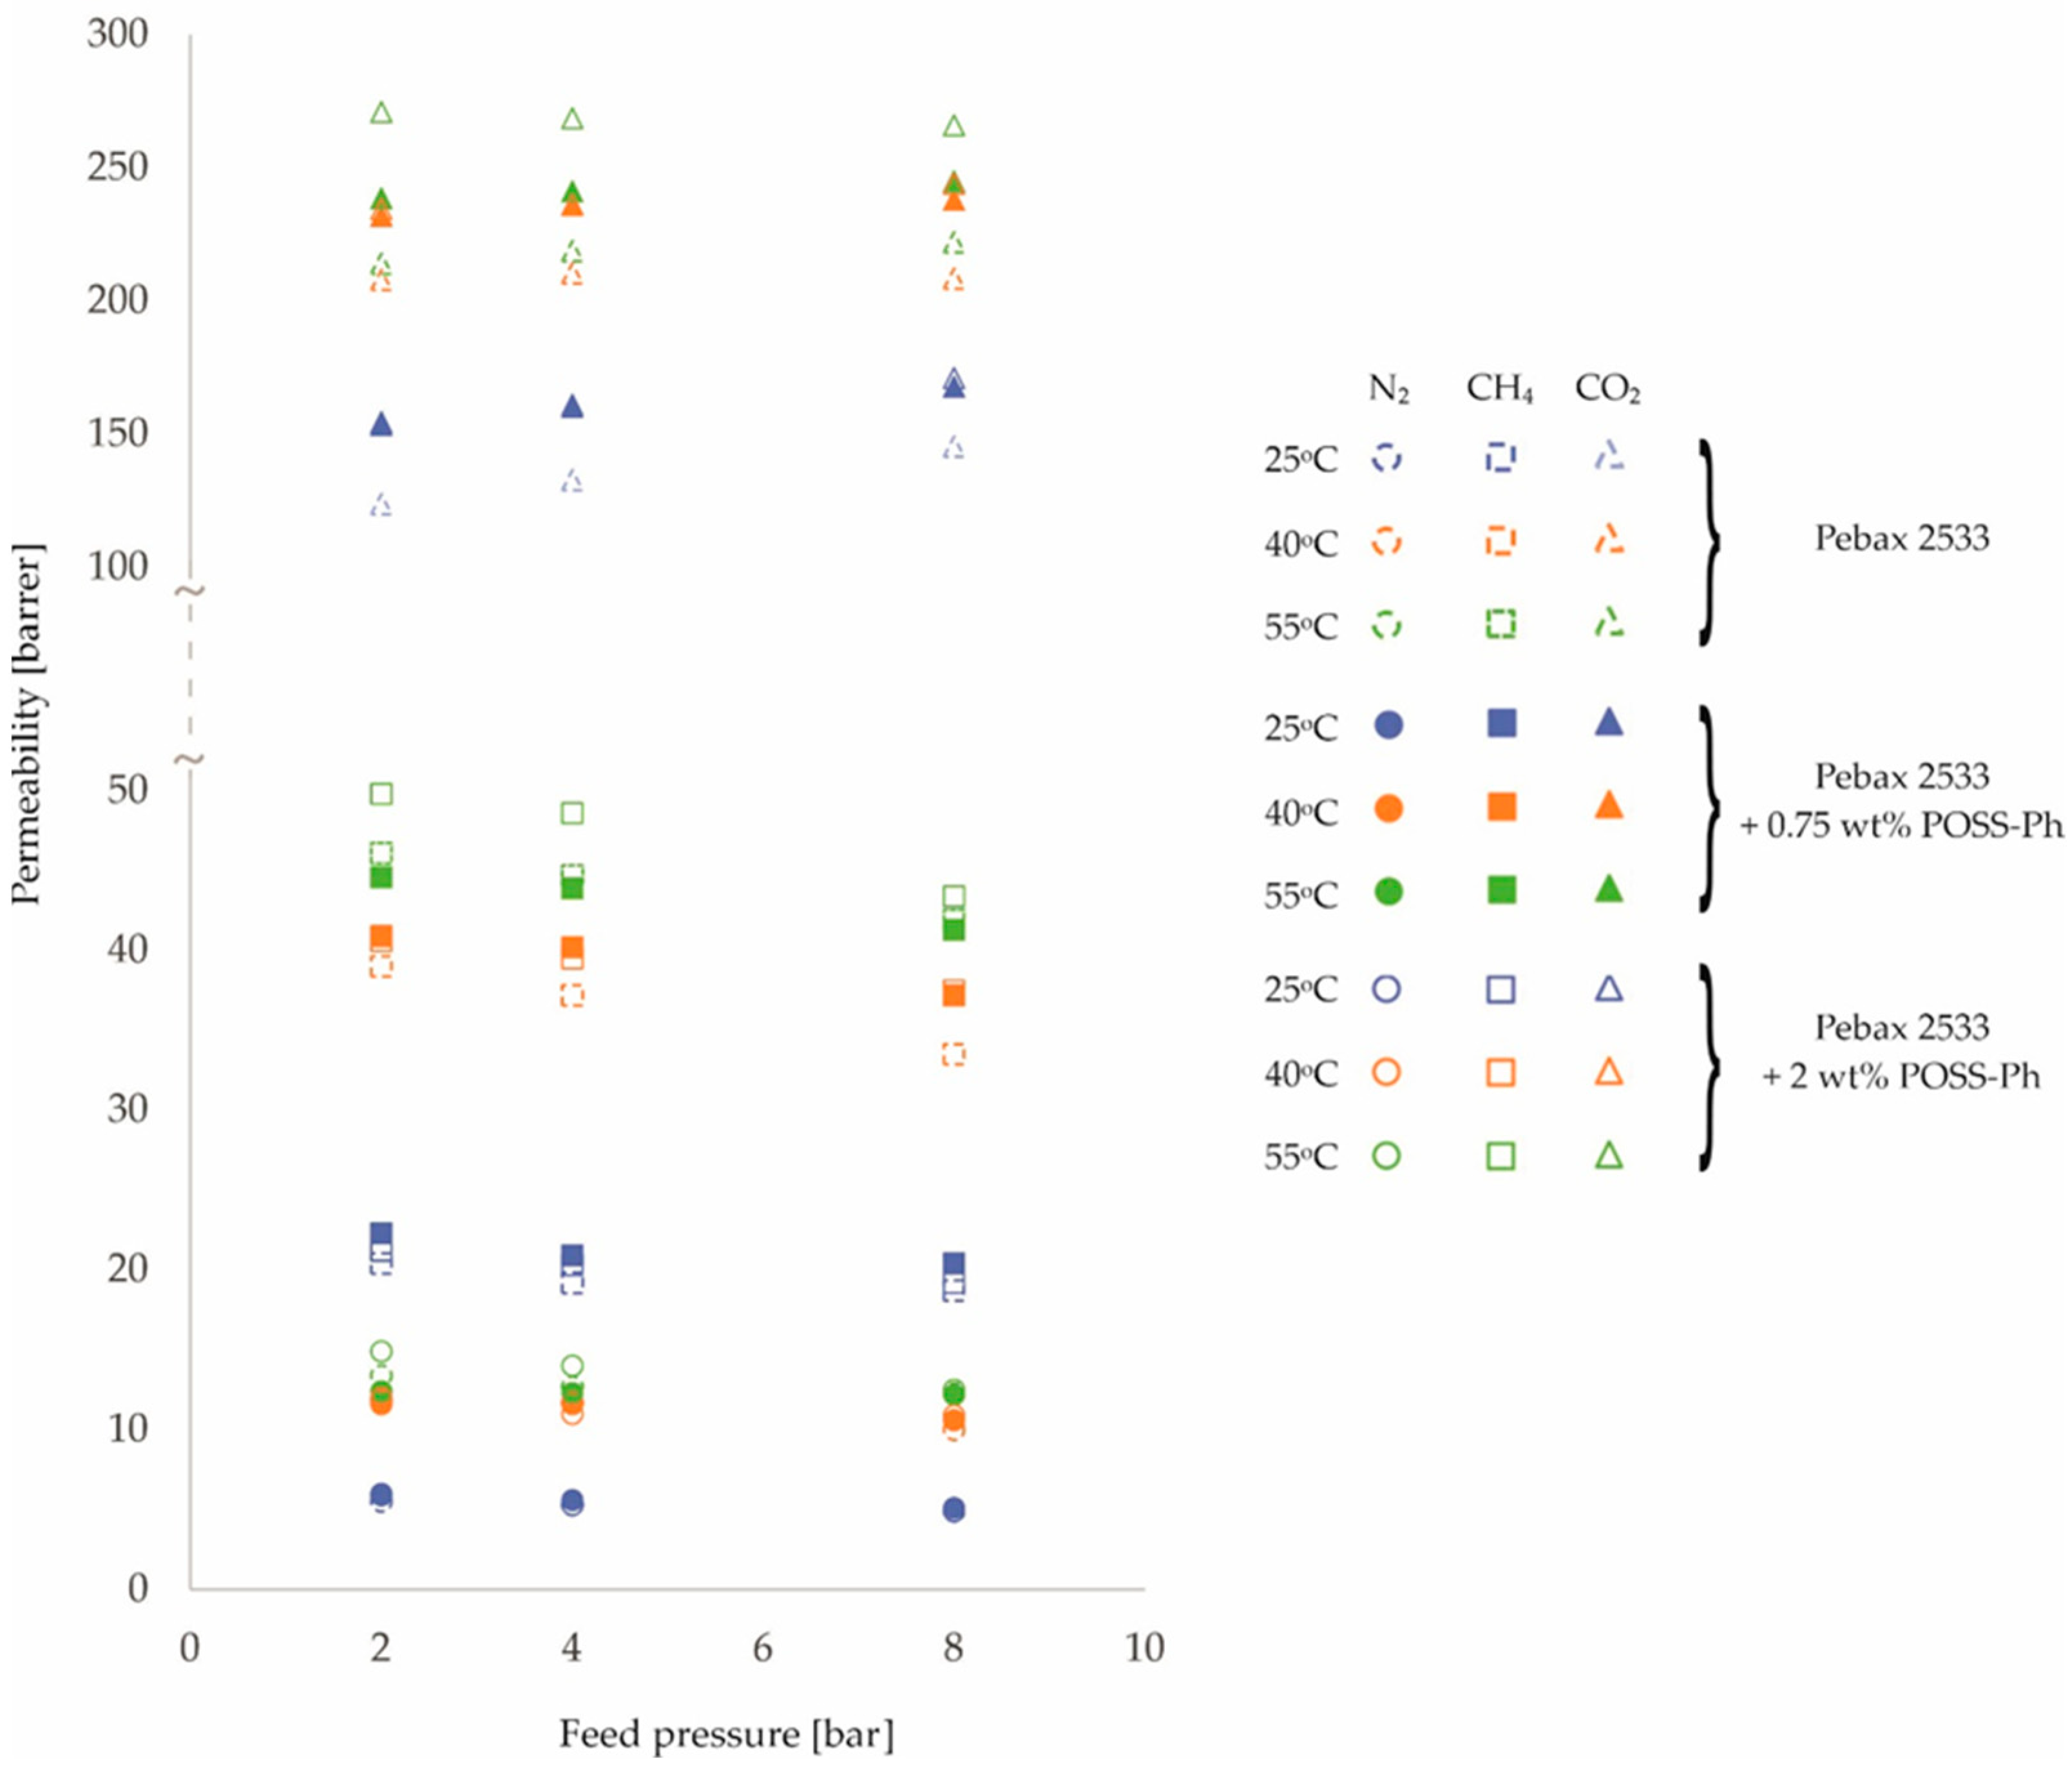
| PEBAX 2533 +0.75 wt% POSS-Ph | 2 | 5.9 | 11.6 | 12.4 | 22.3 | 40.9 | 44.6 | 153.5 | 232.0 | 238.5 |
| ±0.1 | ±0.3 | ±0.3 | ±0.4 | ±0.7 | ±0.7 | ±1.2 | ±1.9 | ±1.9 | ||
| 4 | 5.6 | 11.6 | 12.3 | 20.9 | 40.2 | 43.9 | 160.3 | 236.1 | 241.2 | |
| ±0.1 | ±0.3 | ±0.3 | ±0.3 | ±0.6 | ±0.7 | ±1.3 | ±1.9 | ±1.9 | ||
| 8 | 5.1 | 10.6 | 12.2 | 20.4 | 37.2 | 41.3 | 167.8 | 238.0 | 244.9 | |
| ±0.1 | ±0.3 | ±0.3 | ±0.3 | ±0.6 | ±0.7 | ±1.3 | ±1.9 | ±2.0 | ||
| PEBAX 2533 +2 wt% POSS-Ph | 2 | 6.0 | 12.0 | 14.9 | 21.2 | 40.6 | 49.8 | 154.5 | 234.6 | 271.0 |
| ±0.2 | ±0.3 | ±0.4 | ±0.3 | ±0.7 | ±0.8 | ±1.2 | ±1.9 | ±2.2 | ||
| 4 | 5.3 | 11.0 | 14.0 | 20.3 | 39.5 | 48.6 | 161.0 | 236.2 | 268.6 | |
| ±0.1 | ±0.3 | ±0.4 | ±0.3 | ±0.6 | ±0.8 | ±1.3 | ±1.9 | ±2.1 | ||
| 8 | 4.9 | 10.9 | 12.5 | 19.2 | 37.5 | 43.4 | 171.1 | 244.0 | 266.0 | |
| ±0.1 | ±0.3 | ±0.3 | ±0.3 | ±0.6 | ±0.7 | ±1.4 | ±2.0 | ±2.1 | ||
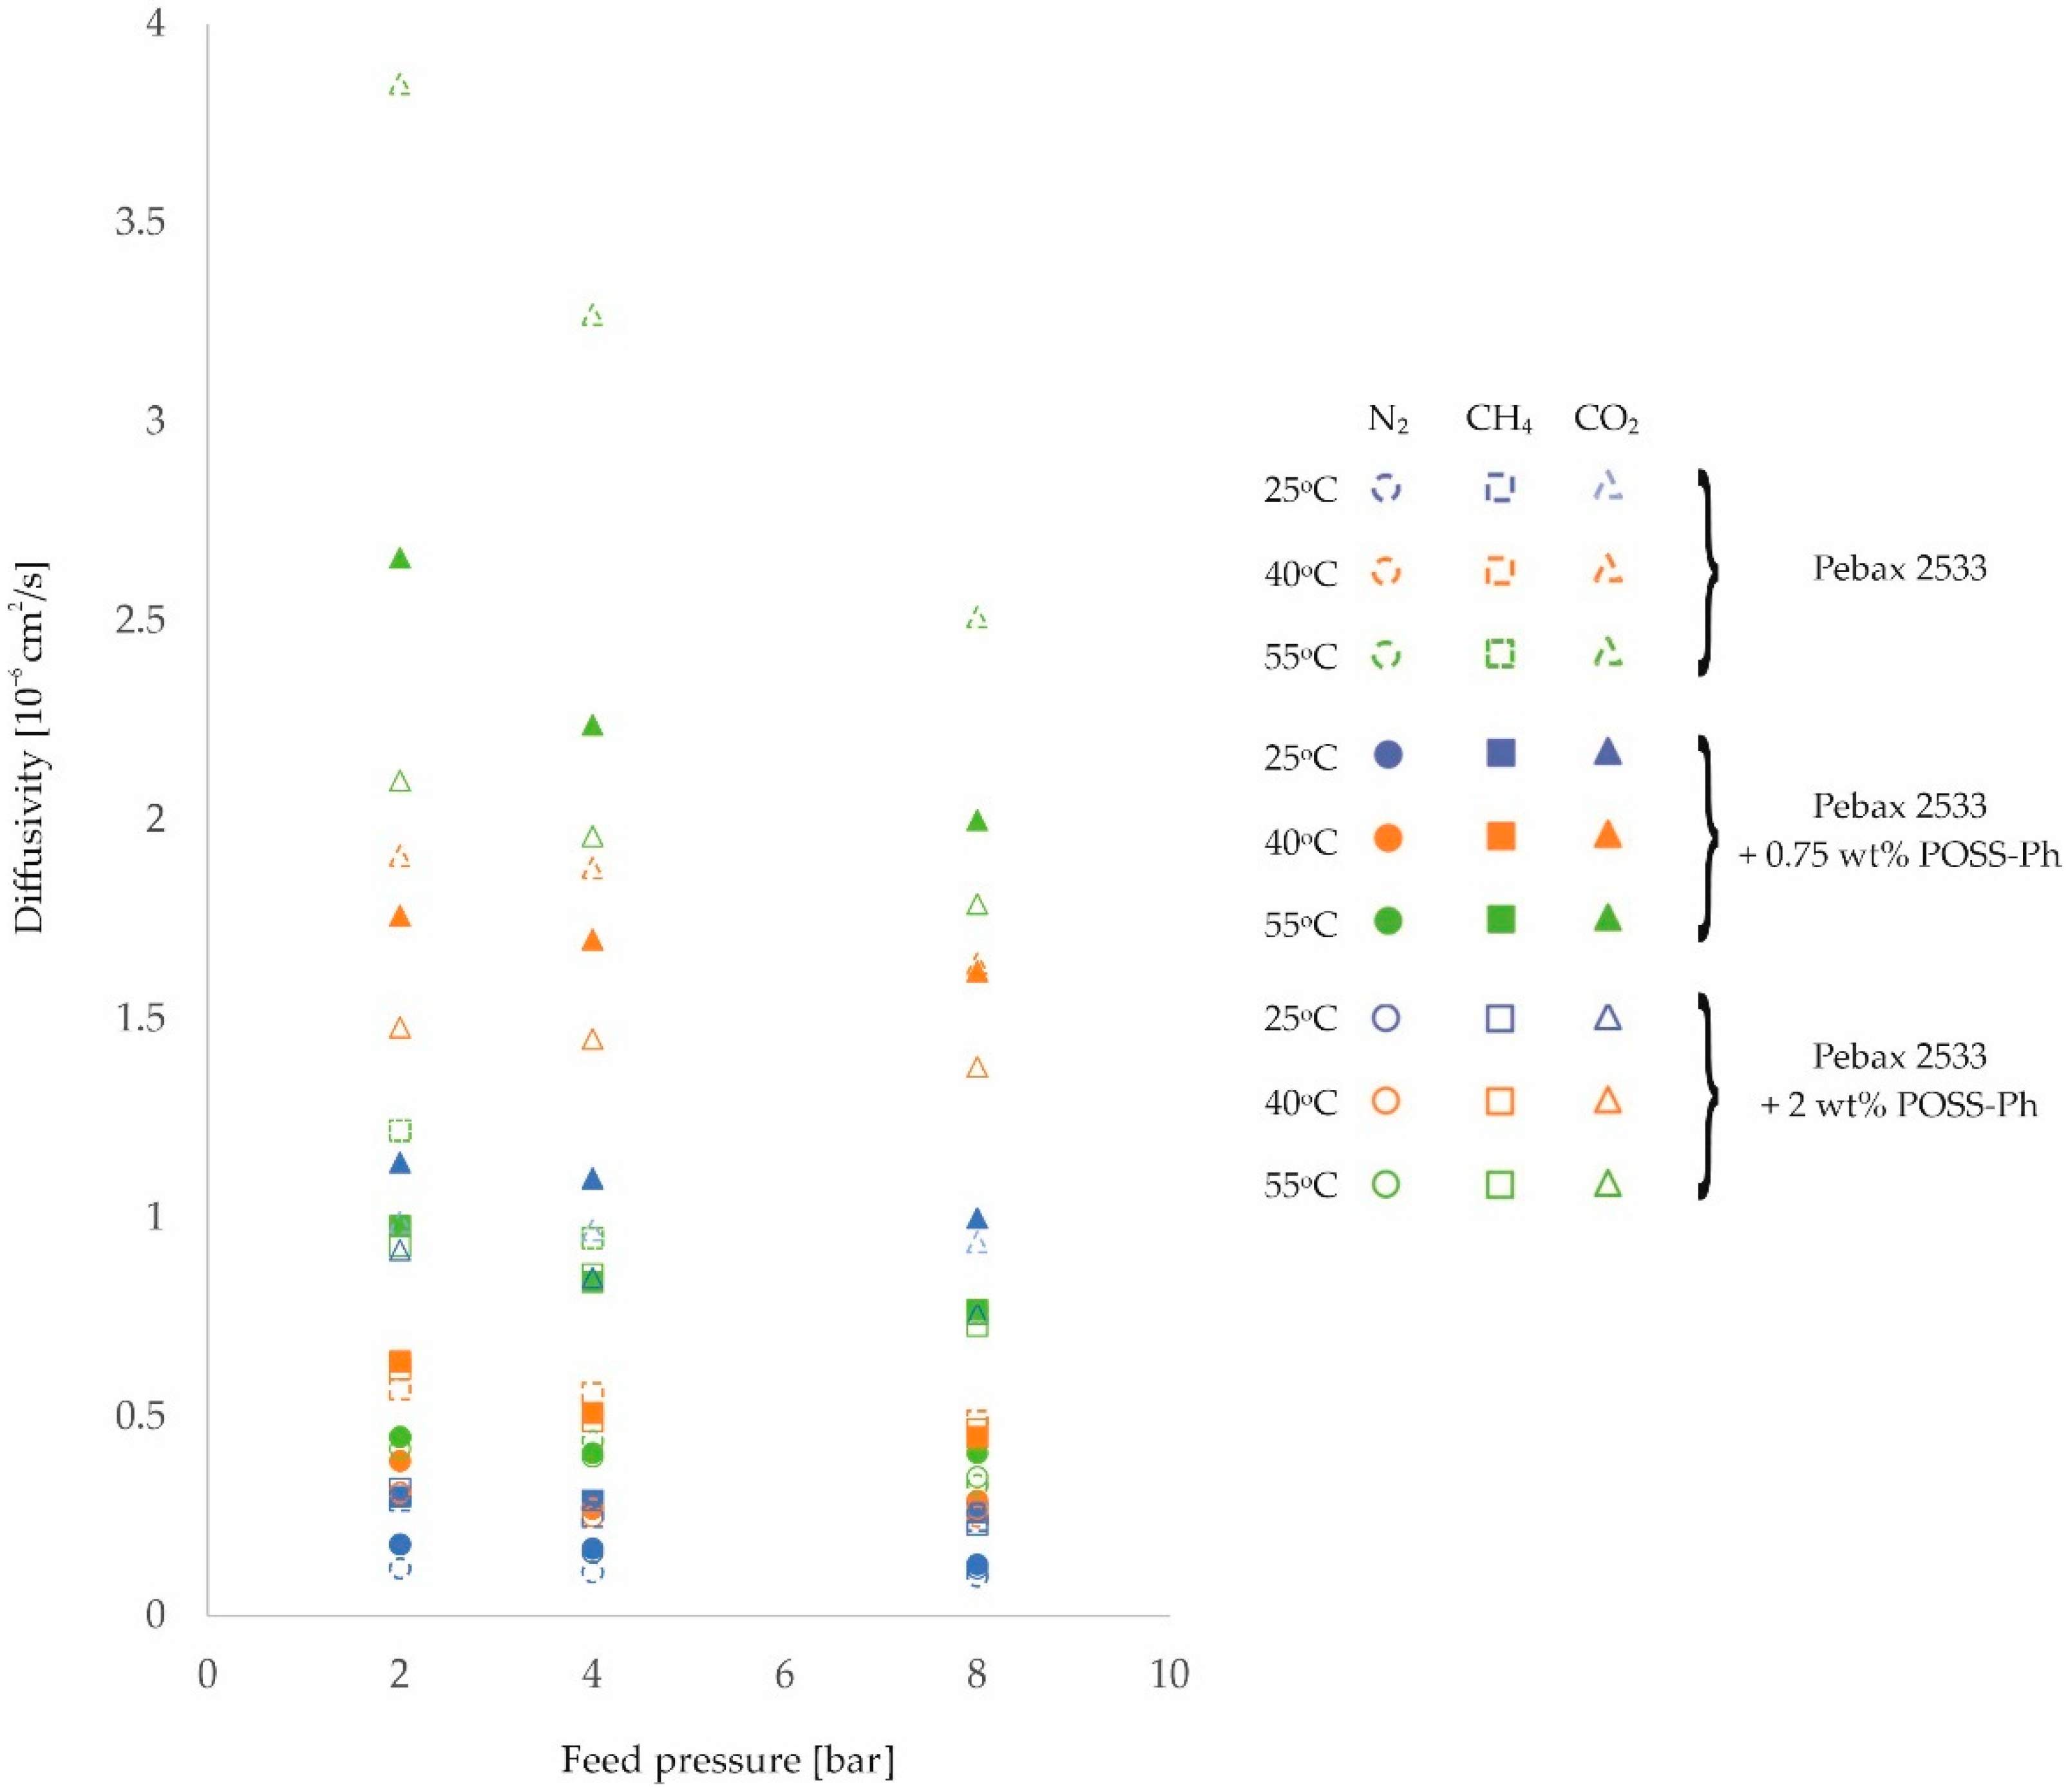
| Membrane Type | Feed Pressure [bar] | Diffusivity Di [10−6 cm2/s] | ||||||||
|---|---|---|---|---|---|---|---|---|---|---|
| N2 | CH4 | CO2 | ||||||||
| Process Temperature [ °C] | Process Temperature [ °C] | Process Temperature [ °C] | ||||||||
| 25 | 4[°C] | 55 | 25 | 4[°C] | 55 | 25 | 4[°C] | 55 | ||
| PEBAX 2533 | 2 | 0.12 | 0.31 | 0.45 | 0.29 | 0.57 | 1.22 | 0.99 | 1.91 | 3.85 |
| ±0.01 | ±0.02 | ±0.03 | ±0.01 | ±0.04 | ±0.09 | ±0.06 | ±0.11 | ±0.22 | ||
| 4 | 0.11 | 0.27 | 0.44 | 0.25 | 0.56 | 0.95 | 0.97 | 1.88 | 3.27 | |
| ±0.01 | ±0.02 | ±0.03 | ±0.01 | ±0.04 | ±0.07 | ±0.06 | ±0.11 | ±0.19 | ||
| 8 | 0.10 | 0.25 | 0.33 | 0.24 | 0.49 | 0.76 | 0.94 | 1.64 | 2.51 | |
| ±0.01 | ±0.02 | ±0.02 | ±0.01 | ±0.03 | ±0.05 | ±0.05 | ±0.09 | ±0.14 | ||
| Membrane type | Feed pressure [bar] | Diffusivity Di [10−6 cm2/s] | ||||||||
|---|---|---|---|---|---|---|---|---|---|---|
| N2 | CH4 | CO2 | ||||||||
| Process temperature [ °C] | Process temperature [ °C] | Process temperature [ °C] | ||||||||
| 25 | 4[°C] | 55 | 25 | 4[°C] | 55 | 25 | 4[°C] | 55 | ||
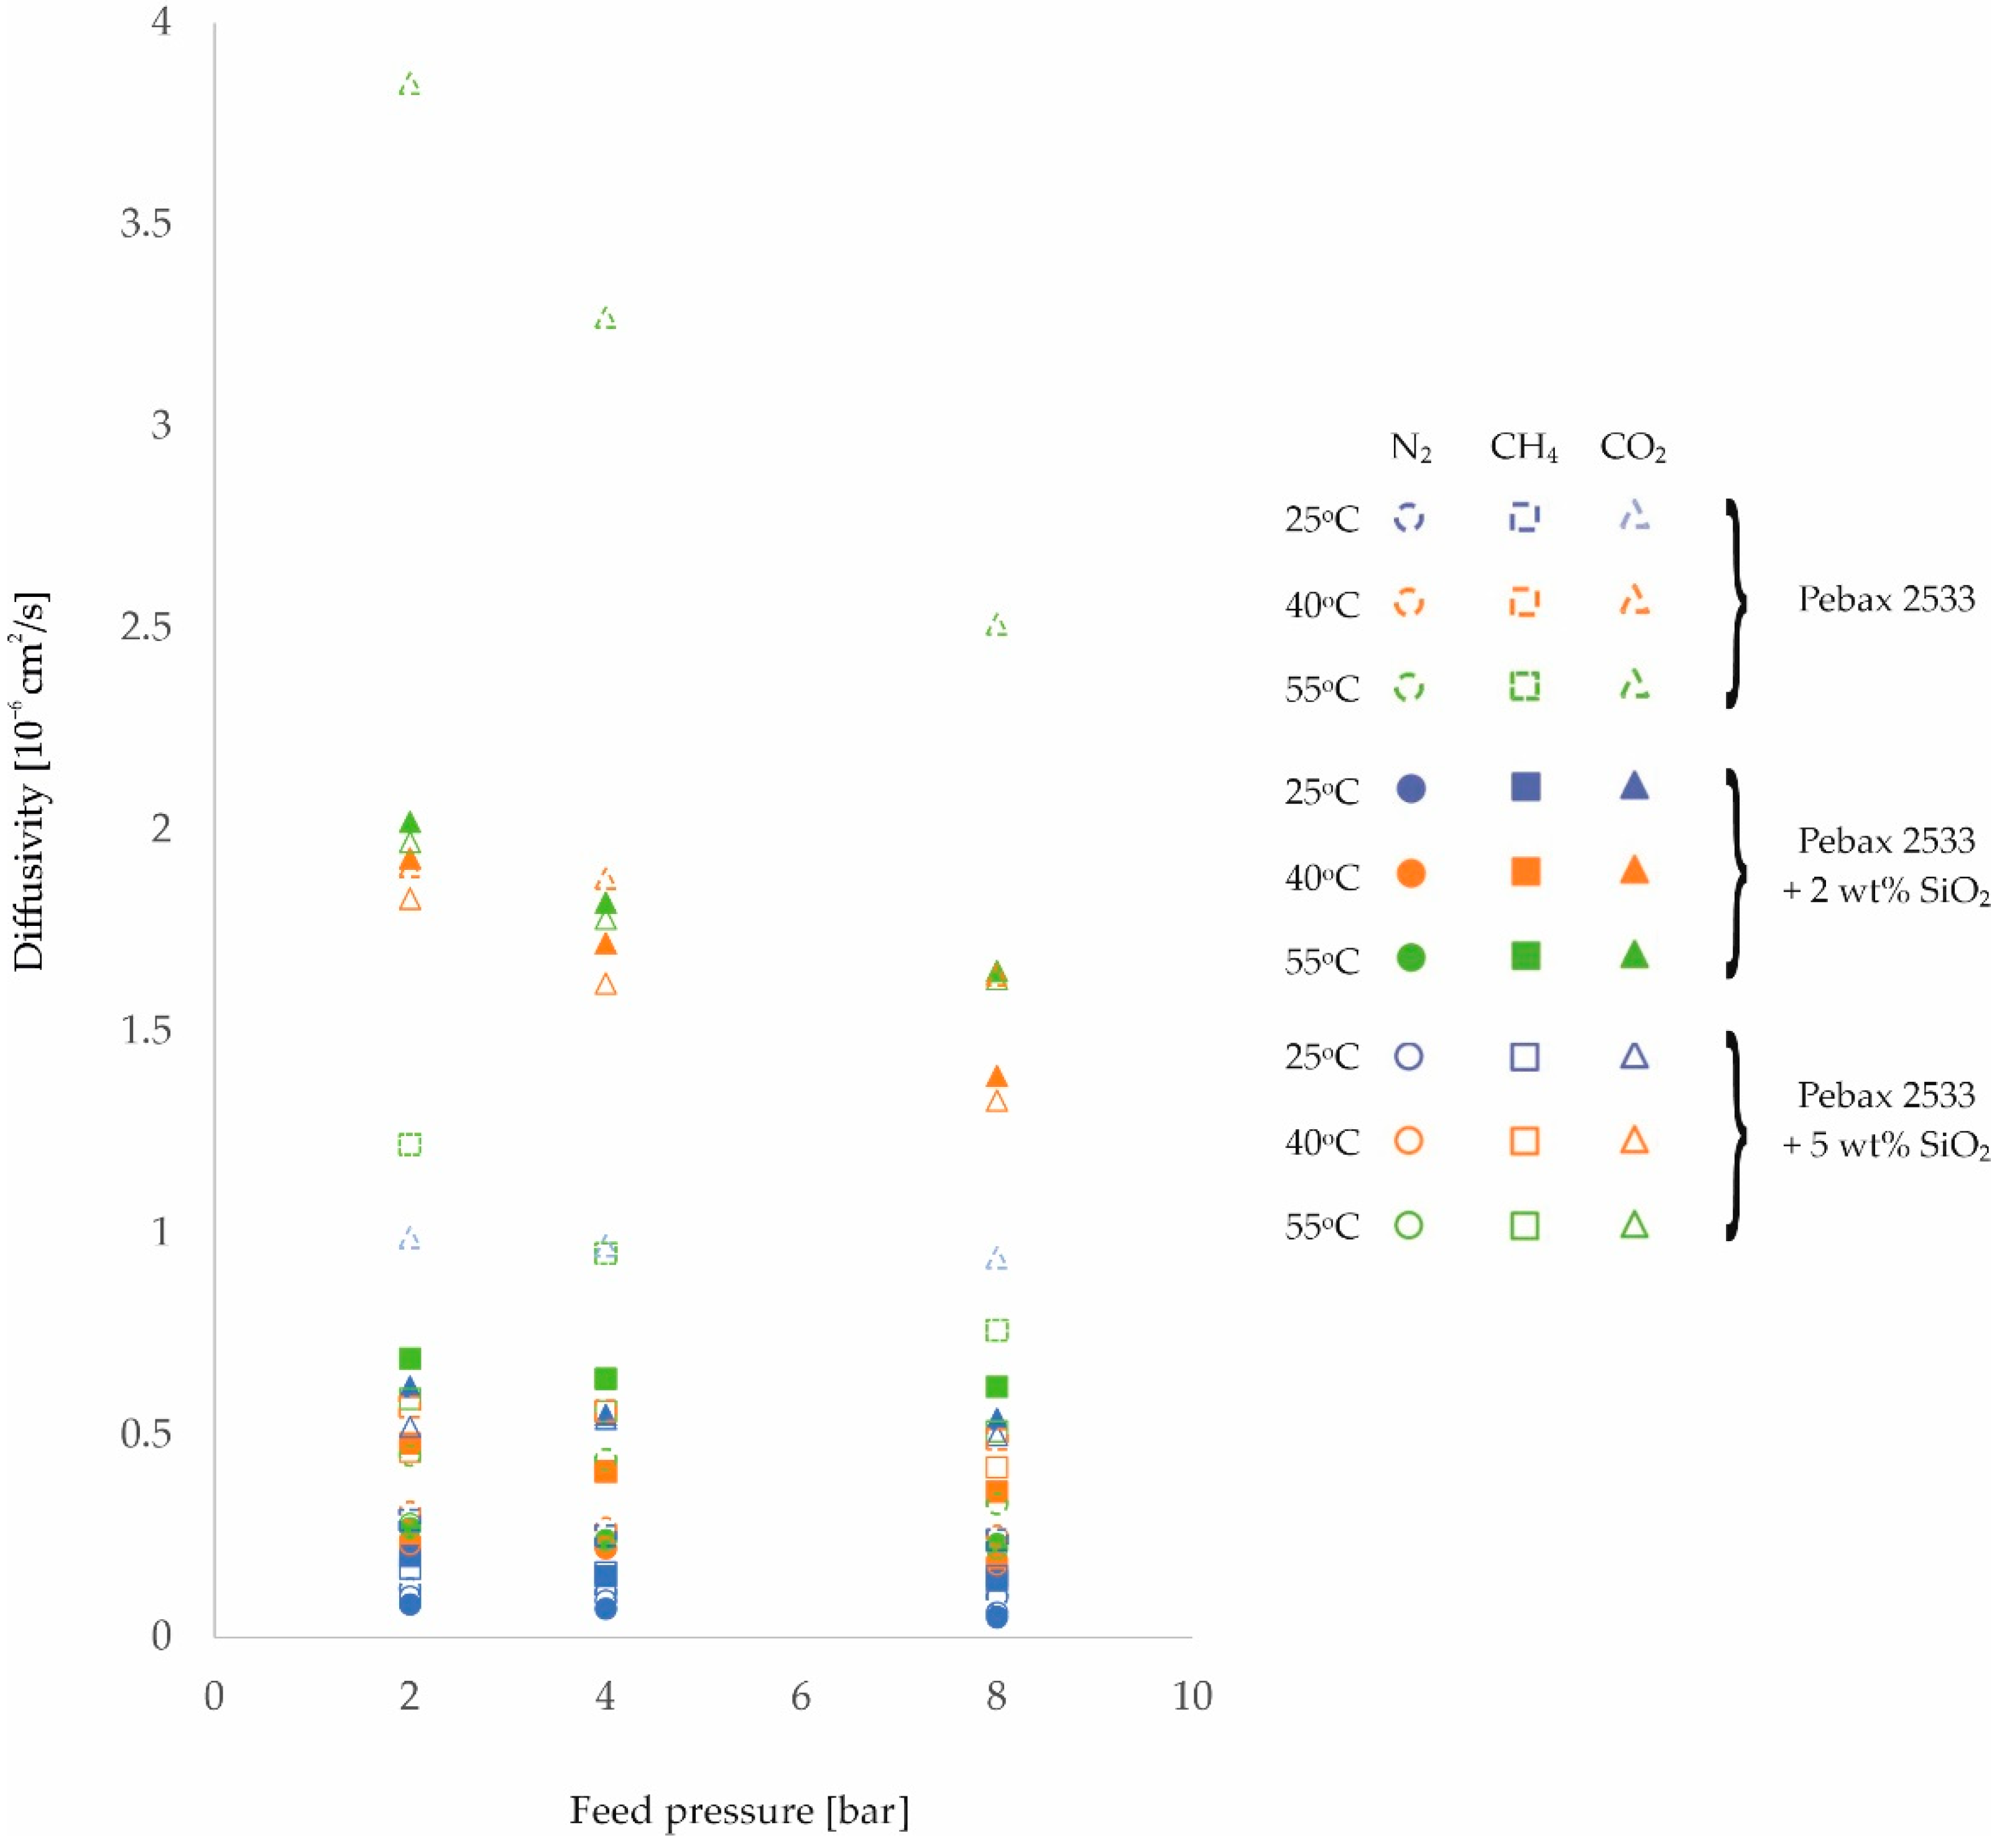
| PEBAX 2533 +2 wt% SiO2 | 2 | 0.08 | 0.24 | 0.27 | 0.20 | 0.48 | 0.69 | 0.62 | 1.93 | 2.02 |
| ±0.01 | ±0.02 | ±0.02 | ±0.00 | ±0.03 | ±0.05 | ±0.04 | ±0.11 | ±0.12 | ||
| 4 | 0.07 | 0.22 | 0.24 | 0.15 | 0.41 | 0.64 | 0.55 | 1.72 | 1.82 | |
| ±0.00 | ±0.02 | ±0.02 | ±0.00 | ±0.03 | ±0.04 | ±0.03 | ±0.10 | ±0.1 | ||
| 8 | 0.05 | 0.19 | 0.23 | 0.14 | 0.36 | 0.62 | 0.54 | 1.39 | 1.65 | |
| ±0.00 | ±0.01 | ±0.02 | ±0.00 | ±0.03 | ±0.04 | ±0.03 | ±0.08 | ±0.09 | ||
| PEBAX 2533 +5 wt% SiO2 | 2 | 0.10 | 0.23 | 0.28 | 0.17 | 0.46 | 0.59 | 0.52 | 1.83 | 1.97 |
| ±0.01 | ±0.02 | ±0.02 | ±0.00 | ±0.03 | ±0.04 | ±0.03 | ±0.1 | ±0.11 | ||
| 4 | 0.09 | 0.22 | 0.24 | 0.16 | 0.41 | 0.56 | 0.54 | 1.62 | 1.78 | |
| ±0.01 | ±0.02 | ±0.02 | ±0.00 | ±0.03 | ±0.04 | ±0.03 | ±0.09 | ±0.1 | ||
| 8 | 0.06 | 0.18 | 0.22 | 0.15 | 0.42 | 0.51 | 0.50 | 1.33 | 1.63 | |
| ±0.00 | ±0.01 | ±0.02 | ±0.00 | ±0.03 | ±0.04 | ±0.03 | ±0.08 | ±0.09 | ||
| Membrane Type | Feed Pressure [bar] | Diffusivity Di [10−6 cm2/s] | ||||||||
|---|---|---|---|---|---|---|---|---|---|---|
| N2 | CH4 | CO2 | ||||||||
| Process Temperature [ °C] | Process Temperature [ °C] | Process Temperature [ °C] | ||||||||
| 25 | 4[°C] | 55 | 25 | 4[°C] | 55 | 25 | 4[°C] | 55 | ||
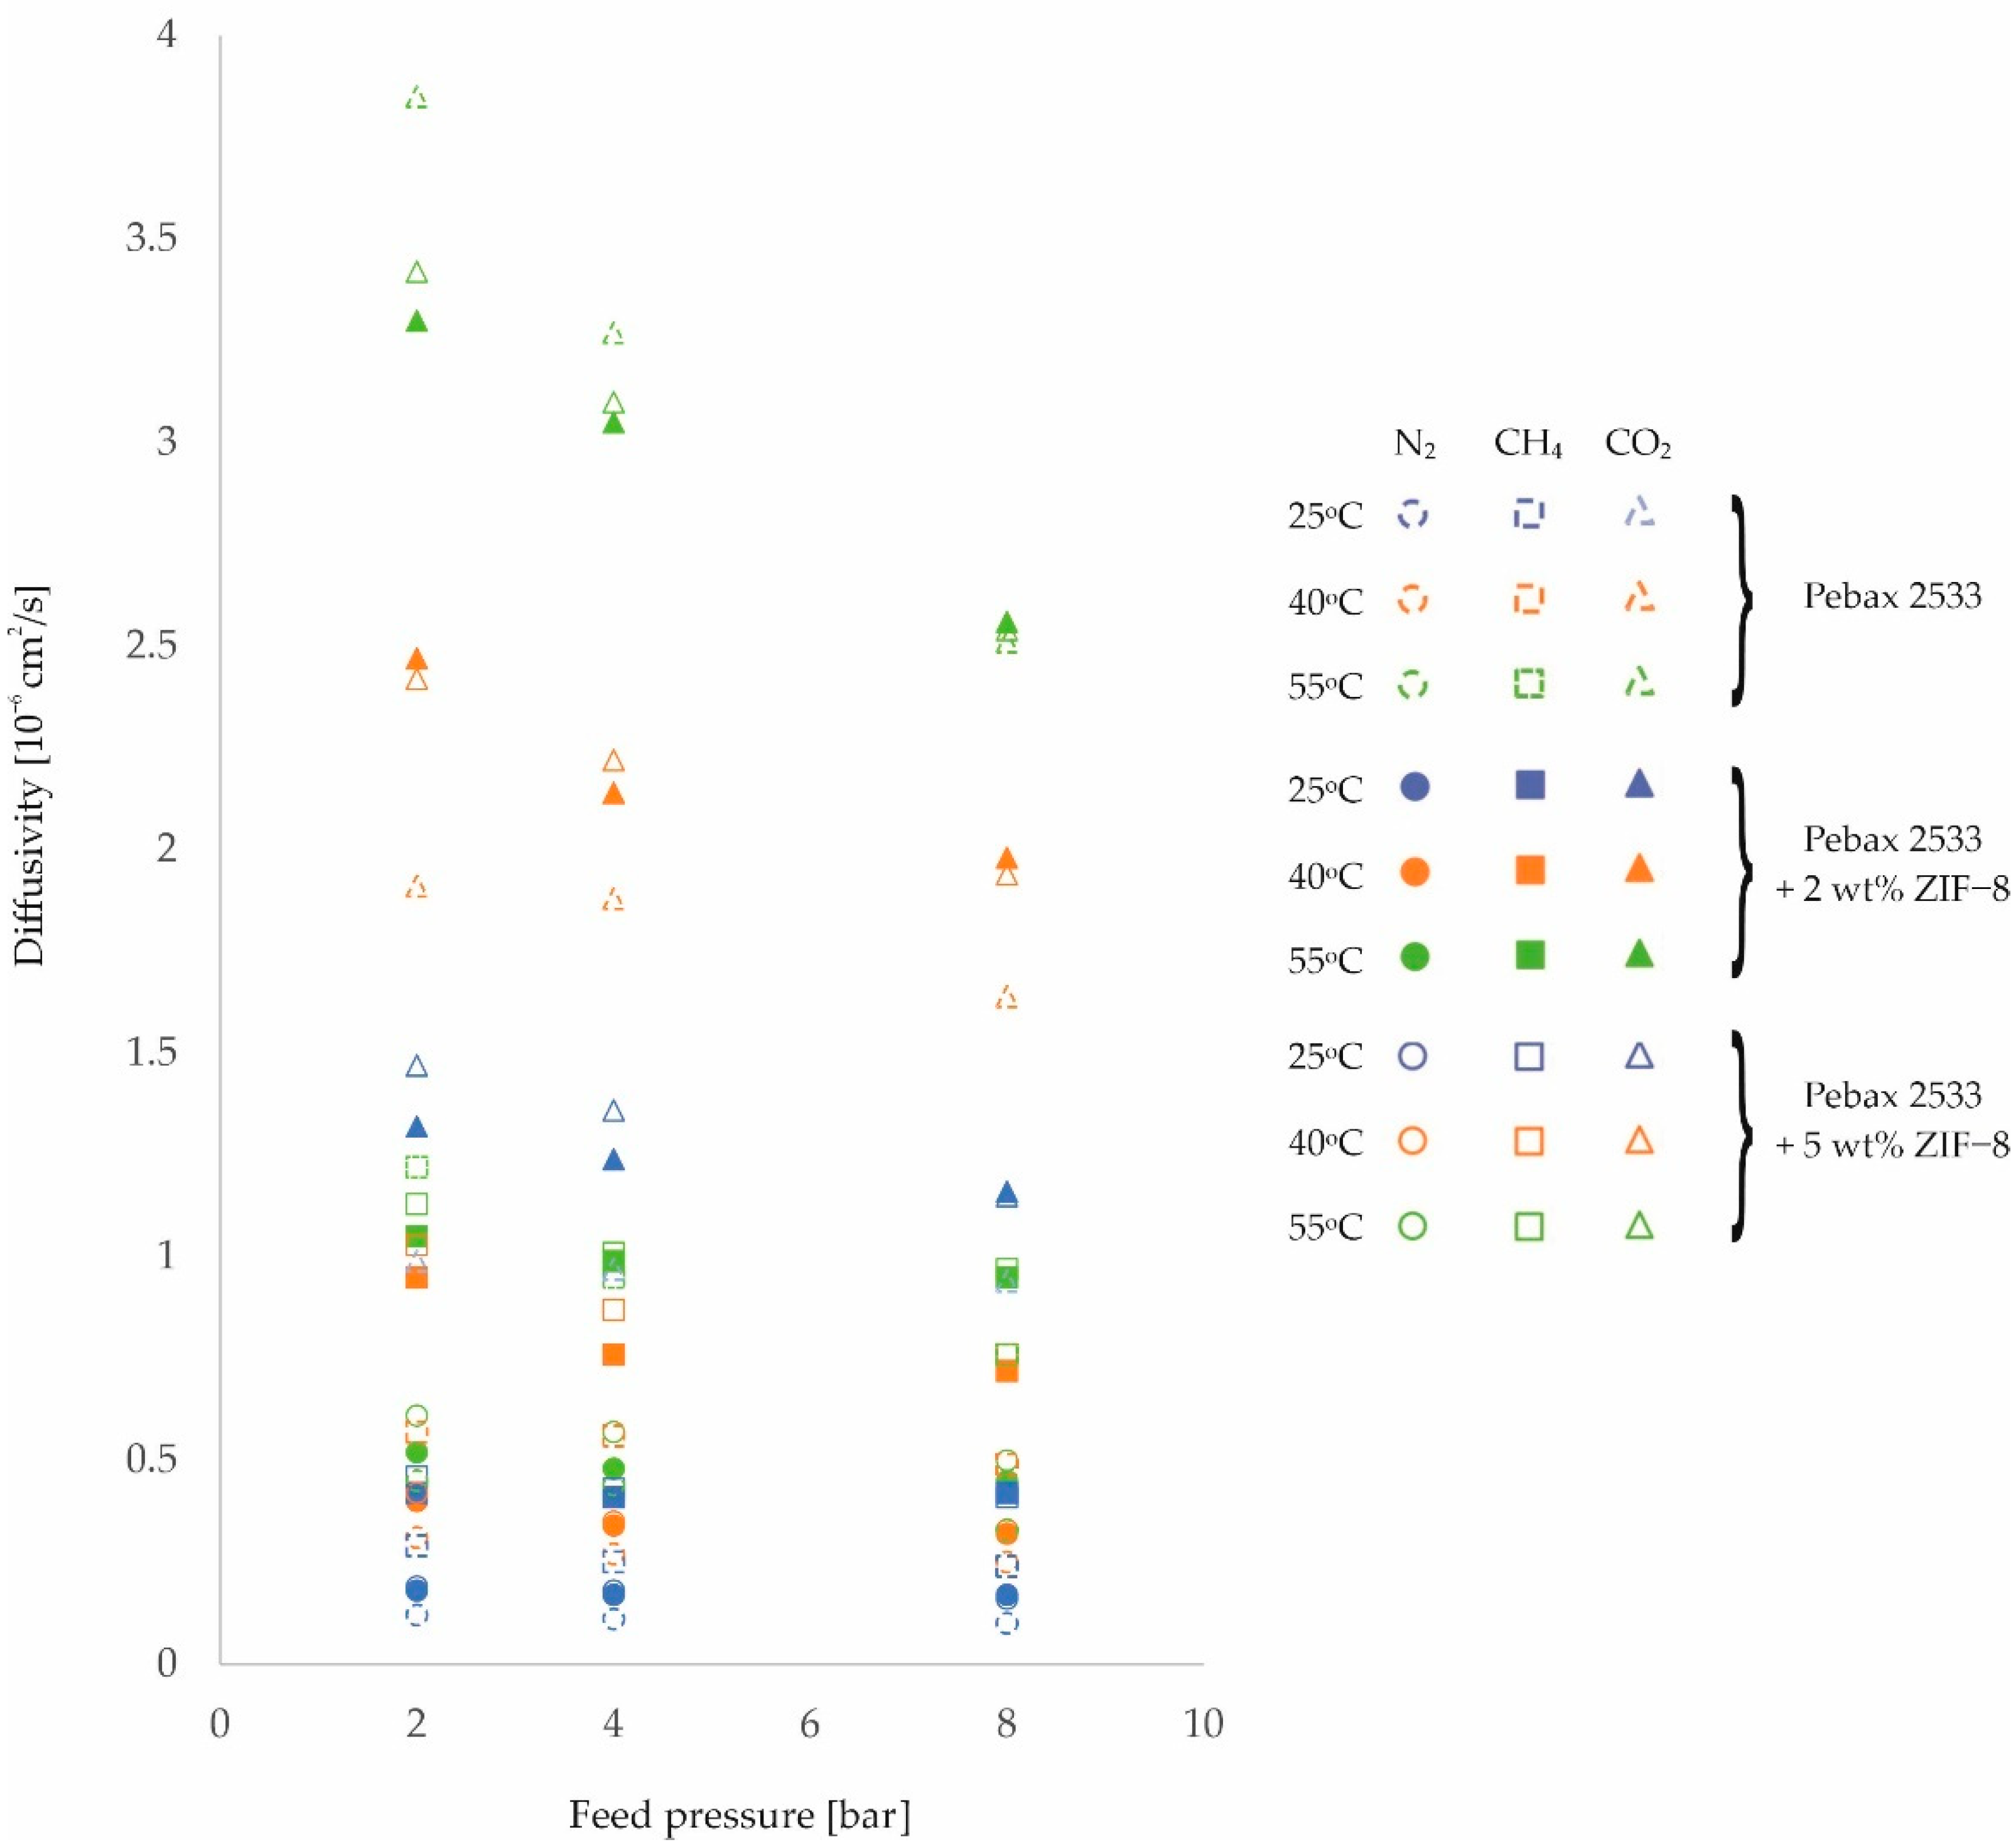
| PEBAX 2533 +2 wt% ZIF−8 | 2 | 0.18 | 0.40 | 0.52 | 0.42 | 0.95 | 1.05 | 1.32 | 2.47 | 3.30 |
| ±0.01 | ±0.03 | ±0.04 | ±0.01 | ±0.07 | ±0.07 | ±0.08 | ±0.14 | ±0.19 | ||
| 4 | 0.17 | 0.34 | 0.48 | 0.41 | 0.76 | 0.99 | 1.24 | 2.14 | 3.05 | |
| ±0.01 | ±0.02 | ±0.03 | ±0.01 | ±0.05 | ±0.07 | ±0.07 | ±0.12 | ±0.17 | ||
| 8 | 0.17 | 0.32 | 0.45 | 0.42 | 0.72 | 0.95 | 1.16 | 1.98 | 2.56 | |
| ±0.01 | ±0.02 | ±0.03 | ±0.01 | ±0.05 | ±0.07 | ±0.07 | ±0.11 | ±0.15 | ||
| PEBAX 2533 +5 wt% ZIF−8 | 2 | 0.19 | 0.42 | 0.61 | 0.46 | 1.03 | 1.13 | 1.47 | 2.42 | 3.42 |
| ±0.01 | ±0.03 | ±0.04 | ±0.01 | ±0.07 | ±0.08 | ±0.08 | ±0.14 | ±0.19 | ||
| 4 | 0.18 | 0.35 | 0.57 | 0.43 | 0.87 | 1.01 | 1.36 | 2.22 | 3.10 | |
| ±0.01 | ±0.02 | ±0.04 | ±0.01 | ±0.06 | ±0.07 | ±0.08 | ±0.13 | ±0.18 | ||
| 8 | 0.16 | 0.33 | 0.50 | 0.41 | 0.76 | 0.97 | 1.15 | 1.94 | 2.54 | |
| ±0.01 | ±0.02 | ±0.04 | ±0.01 | ±0.05 | ±0.07 | ±0.07 | ±0.11 | ±0.14 | ||
| Membrane Type | Feed Pressure [bar] | Diffusivity Di [10−6 cm2/s] | ||||||||
|---|---|---|---|---|---|---|---|---|---|---|
| N2 | CH4 | CO2 | ||||||||
| Process Temperature [ °C] | Process Temperature [ °C] | Process Temperature [ °C] | ||||||||
| 25 | 4[°C] | 55 | 25 | 4[°C] | 55 | 25 | 4[°C] | 55 | ||
| PEBAX 2533 +0.75 wt% POSS-Ph | 2 | 0.18 | 0.39 | 0.45 | 0.30 | 0.64 | 0.98 | 1.14 | 1.76 | 2.66 |
| ±0.01 | ±0.03 | ±0.03 | ±0.01 | ±0.04 | ±0.07 | ±0.06 | ±0.10 | ±0.15 | ||
| 4 | 0.17 | 0.27 | 0.41 | 0.29 | 0.51 | 0.84 | 1.10 | 1.70 | 2.24 | |
| ±0.01 | ±0.02 | ±0.03 | ±0.01 | ±0.04 | ±0.06 | ±0.06 | ±0.10 | ±0.13 | ||
| 8 | 0.13 | 0.29 | 0.41 | 0.26 | 0.45 | 0.77 | 1.00 | 1.62 | 2.00 | |
| ±0.01 | ±0.02 | ±0.03 | ±0.01 | ±0.03 | ±0.05 | ±0.06 | ±0.09 | ±0.11 | ||
| PEBAX 2533 +2 wt% POSS-Ph | 2 | 0.18 | 0.31 | 0.42 | 0.32 | 0.62 | 0.93 | 0.92 | 1.48 | 2.10 |
| ±0.01 | ±0.02 | ±0.03 | ±0.01 | ±0.04 | ±0.07 | ±0.05 | ±0.08 | ±0.12 | ||
| 4 | 0.16 | 0.25 | 0.40 | 0.29 | 0.49 | 0.86 | 0.85 | 1.45 | 1.96 | |
| ±0.01 | ±0.02 | ±0.03 | ±0.01 | ±0.03 | ±0.06 | ±0.05 | ±0.08 | ±0.11 | ||
| 8 | 0.12 | 0.27 | 0.35 | 0.23 | 0.47 | 0.73 | 0.76 | 1.38 | 1.79 | |
| ±0.01 | ±0.02 | ±0.02 | ±0.01 | ±0.03 | ±0.05 | ±0.04 | ±0.08 | ±0.10 | ||
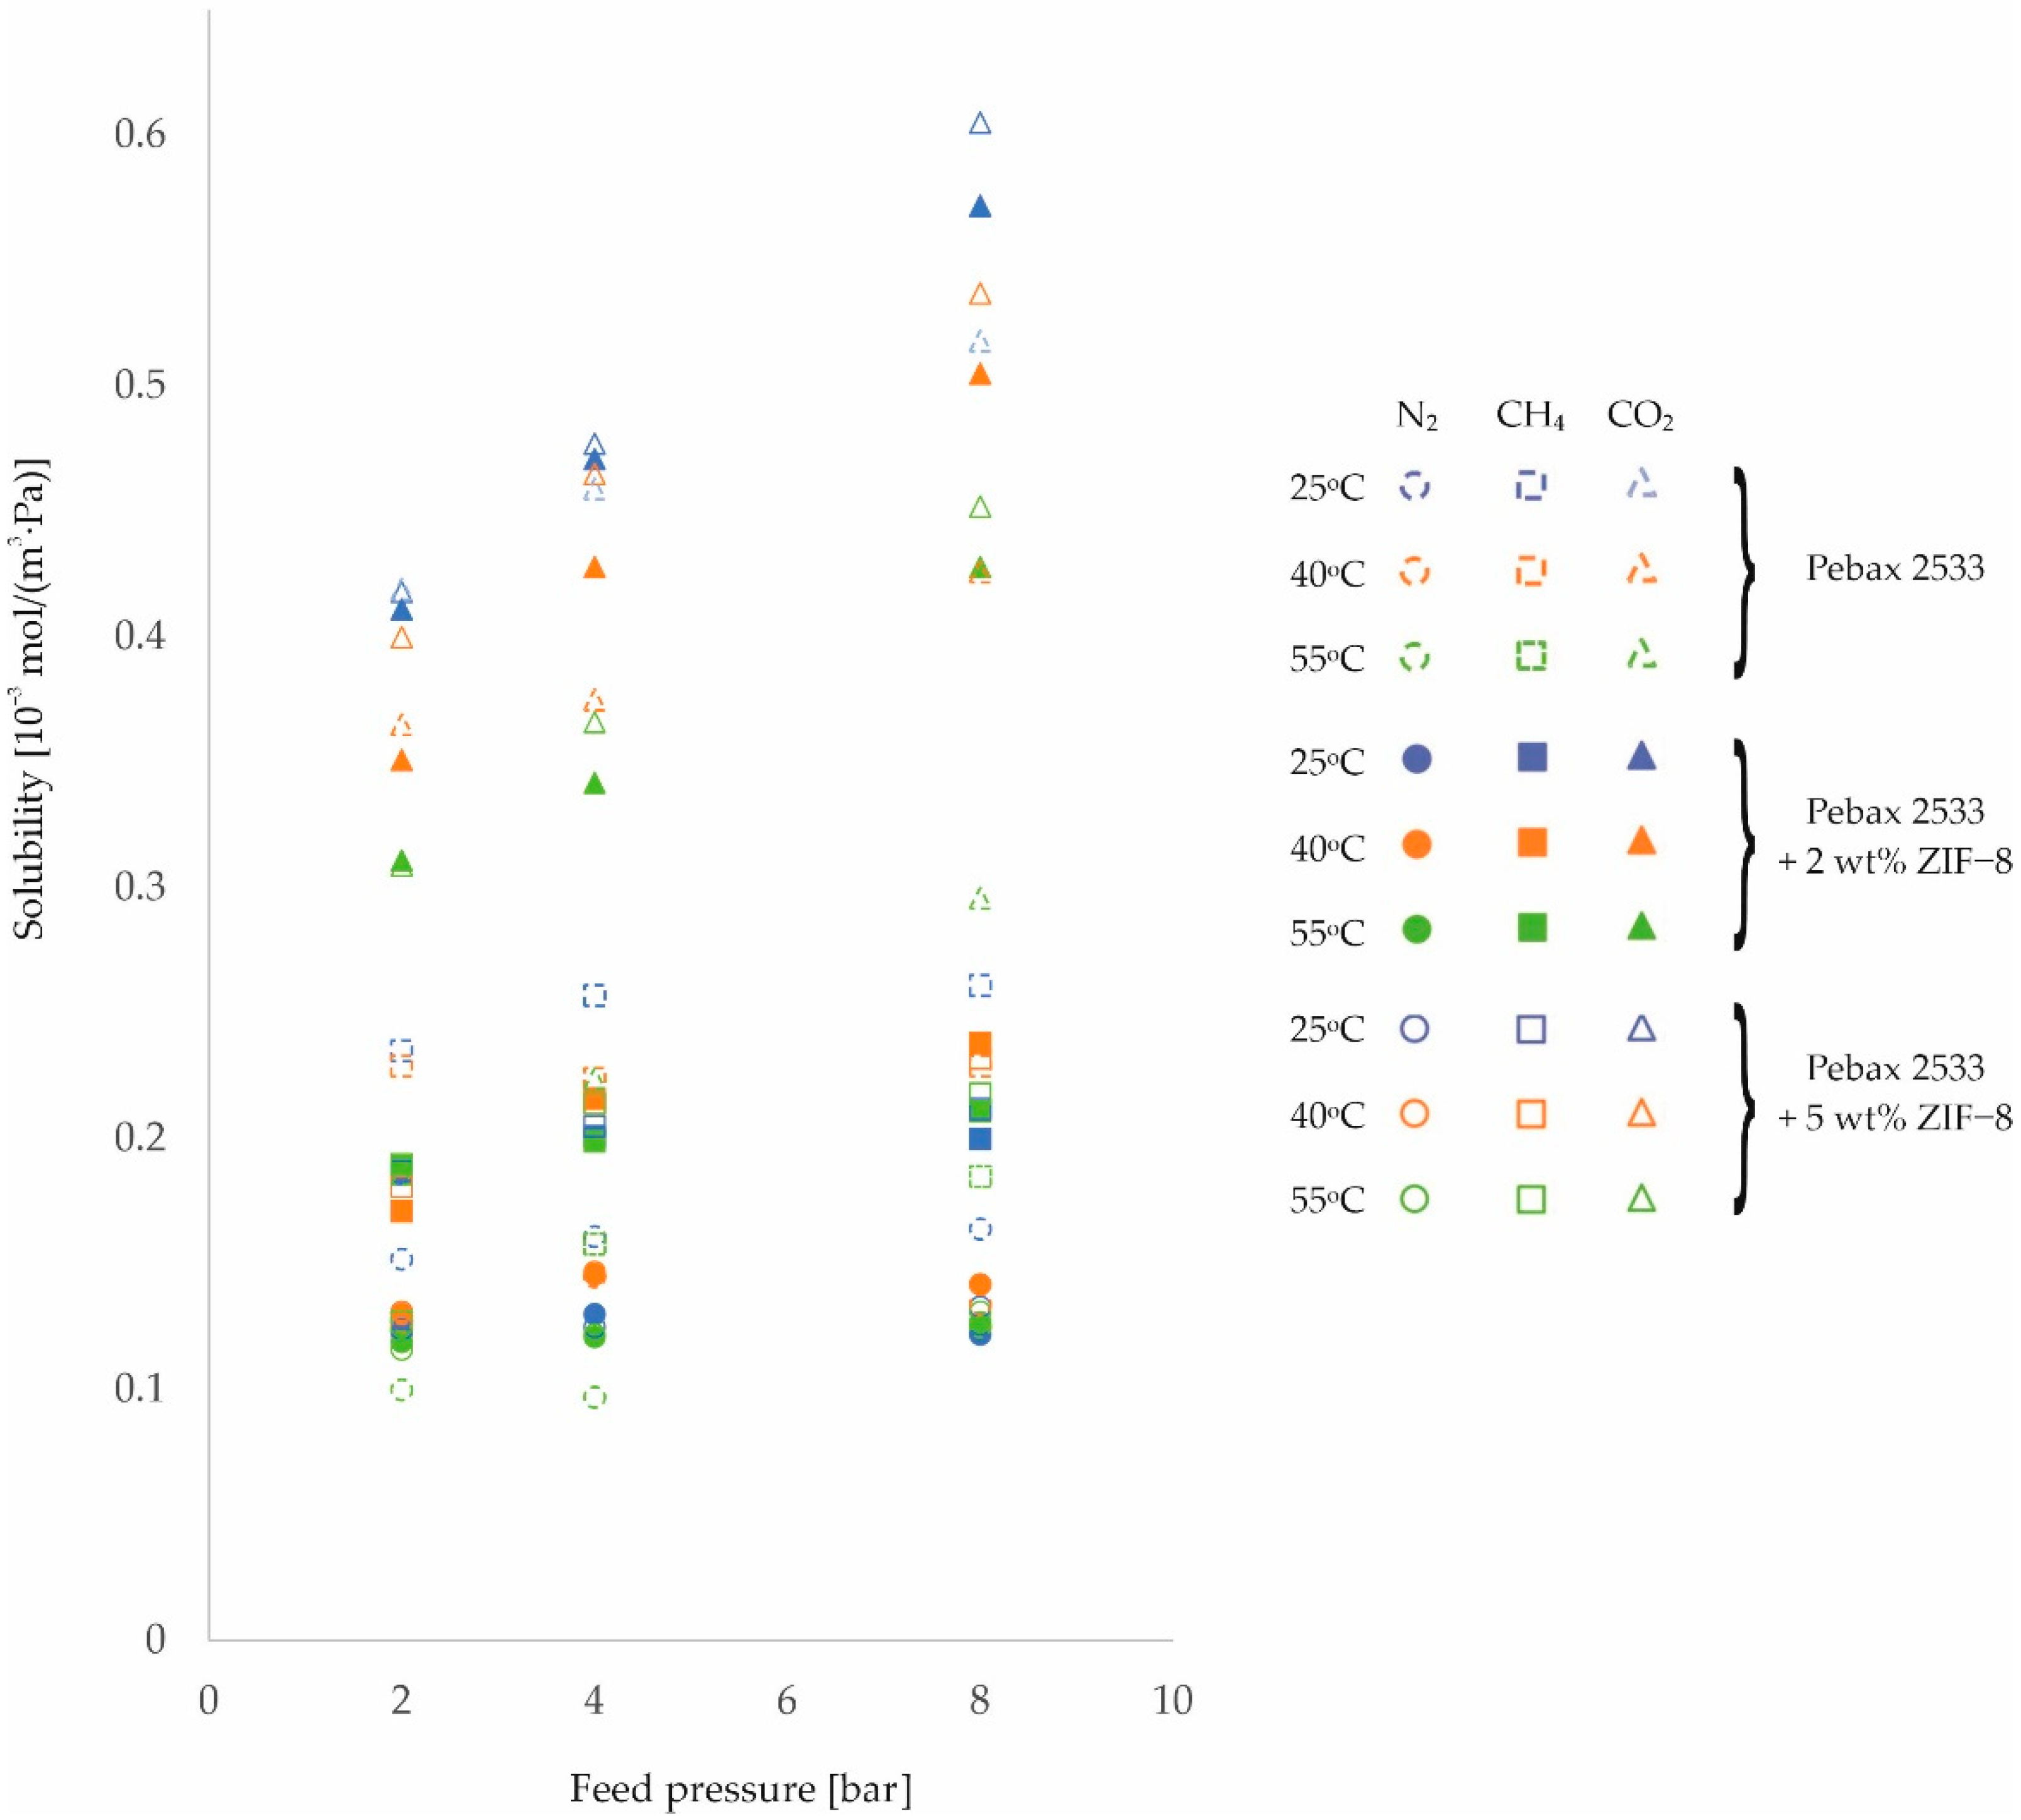
| Membrane Type | Feed Pressure [bar] | Solubility Si [10−3 mol/(m3·Pa)] | ||||||||
|---|---|---|---|---|---|---|---|---|---|---|
| N2 | CH4 | CO2 | ||||||||
| Process Temperature [ °C] | Process Temperature [ °C] | Process Temperature [ °C] | ||||||||
| 25 | 4[°C] | 55 | 25 | 4[°C] | 55 | 25 | 4[°C] | 55 | ||
| PEBAX 2533 | 2 | 0.152 | 0.127 | 0.100 | 0.235 | 0.229 | 0.127 | 0.419 | 0.365 | 0.186 |
| ±0.010 | ±0.008 | ±0.006 | ±0.007 | ±0.007 | ±0.004 | ±0.025 | ±0.022 | ±0.011 | ||
| 4 | 0.161 | 0.145 | 0.097 | 0.257 | 0.224 | 0.158 | 0.459 | 0.375 | 0.224 | |
| ±0.010 | ±0.009 | ±0.006 | ±0.008 | ±0.007 | ±0.005 | ±0.028 | ±0.022 | ±0.013 | ||
| 8 | 0.164 | 0.134 | 0.125 | 0.261 | 0.229 | 0.185 | 0.518 | 0.426 | 0.296 | |
| ±0.010 | ±0.008 | ±0.008 | ±0.008 | ±0.007 | ±0.006 | ±0.031 | ±0.026 | ±0.018 | ||
| Membrane Type | Feed Pressure [bar] | Solubility Si [10−3 mol/(m3·Pa)] | ||||||||
|---|---|---|---|---|---|---|---|---|---|---|
| N2 | CH4 | CO2 | ||||||||
| Process Temperature [ °C] | Process Temperature [ °C] | Process Temperature [ °C] | ||||||||
| 25 | 4[°C] | 55 | 25 | 4[°C] | 55 | 25 | 4[°C] | 55 | ||
| PEBAX 2533 +2 wt% SiO2 | 2 | 0.260 | 0.204 | 0.209 | 0.345 | 0.298 | 0.243 | 0.846 | 0.400 | 0.446 |
| ±0.016 | ±0.013 | ±0.013 | ±0.011 | ±0.009 | ±0.008 | ±0.051 | ±0.024 | ±0.027 | ||
| 4 | 0.283 | 0.186 | 0.220 | 0.443 | 0.310 | 0.257 | 0.956 | 0.464 | 0.498 | |
| ±0.018 | ±0.012 | ±0.014 | ±0.014 | ±0.010 | ±0.008 | ±0.057 | ±0.028 | ±0.030 | ||
| 8 | 0.317 | 0.197 | 0.222 | 0.439 | 0.355 | 0.255 | 1.006 | 0.581 | 0.546 | |
| ±0.020 | ±0.012 | ±0.014 | ±0.014 | ±0.011 | ±0.008 | ±0.06 | ±0.035 | ±0.033 | ||
| PEBAX 2533 +5 wt% SiO2 | 2 | 0.226 | 0.186 | 0.196 | 0.454 | 0.298 | 0.283 | 1.076 | 0.446 | 0.476 |
| ±0.014 | ±0.012 | ±0.012 | ±0.014 | ±0.009 | ±0.009 | ±0.065 | ±0.027 | ±0.029 | ||
| 4 | 0.216 | 0.184 | 0.201 | 0.447 | 0.325 | 0.284 | 1.053 | 0.536 | 0.532 | |
| ±0.014 | ±0.012 | ±0.013 | ±0.014 | ±0.010 | ±0.009 | ±0.063 | ±0.032 | ±0.032 | ||
| 8 | 0.290 | 0.193 | 0.215 | 0.433 | 0.295 | 0.289 | 1.149 | 0.648 | 0.576 | |
| ±0.018 | ±0.012 | ±0.014 | ±0.013 | ±0.009 | ±0.009 | ±0.069 | ±0.039 | ±0.035 | ||
| Membrane Type | Feed Pressure [bar] | Solubility Si [10−3 mol/(m3·Pa)] | ||||||||
|---|---|---|---|---|---|---|---|---|---|---|
| N2 | CH4 | CO2 | ||||||||
| Process Temperature [ °C] | Process Temperature [ °C] | Process Temperature [ °C] | ||||||||
| 25 | 4[°C] | 55 | 25 | 4[°C] | 55 | 25 | 4[°C] | 55 | ||
| PEBAX 2533 +2 wt% ZIF−8 | 2 | 0.123 | 0.130 | 0.119 | 0.186 | 0.171 | 0.189 | 0.411 | 0.351 | 0.311 |
| ±0.008 | ±0.008 | ±0.007 | ±0.006 | ±0.005 | ±0.006 | ±0.025 | ±0.021 | ±0.019 | ||
| 4 | 0.130 | 0.146 | 0.121 | 0.201 | 0.216 | 0.199 | 0.471 | 0.428 | 0.342 | |
| ±0.008 | ±0.009 | ±0.008 | ±0.006 | ±0.007 | ±0.006 | ±0.028 | ±0.026 | ±0.021 | ||
| 8 | 0.122 | 0.142 | 0.127 | 0.200 | 0.238 | 0.211 | 0.572 | 0.505 | 0.428 | |
| ±0.008 | ±0.009 | ±0.008 | ±0.006 | ±0.007 | ±0.007 | ±0.034 | ±0.03 | ±0.026 | ||
| PEBAX 2533 +5 wt% ZIF−8 | 2 | 0.124 | 0.131 | 0.116 | 0.187 | 0.181 | 0.190 | 0.418 | 0.400 | 0.309 |
| ±0.008 | ±0.008 | ±0.007 | ±0.006 | ±0.006 | ±0.006 | ±0.025 | ±0.024 | ±0.019 | ||
| 4 | 0.125 | 0.147 | 0.122 | 0.205 | 0.214 | 0.214 | 0.477 | 0.465 | 0.366 | |
| ±0.008 | ±0.009 | ±0.008 | ±0.006 | ±0.007 | ±0.007 | ±0.029 | ±0.028 | ±0.022 | ||
| 8 | 0.133 | 0.142 | 0.131 | 0.212 | 0.232 | 0.218 | 0.605 | 0.537 | 0.452 | |
| ±0.008 | ±0.009 | ±0.008 | ±0.007 | ±0.007 | ±0.007 | ±0.036 | ±0.032 | ±0.027 | ||
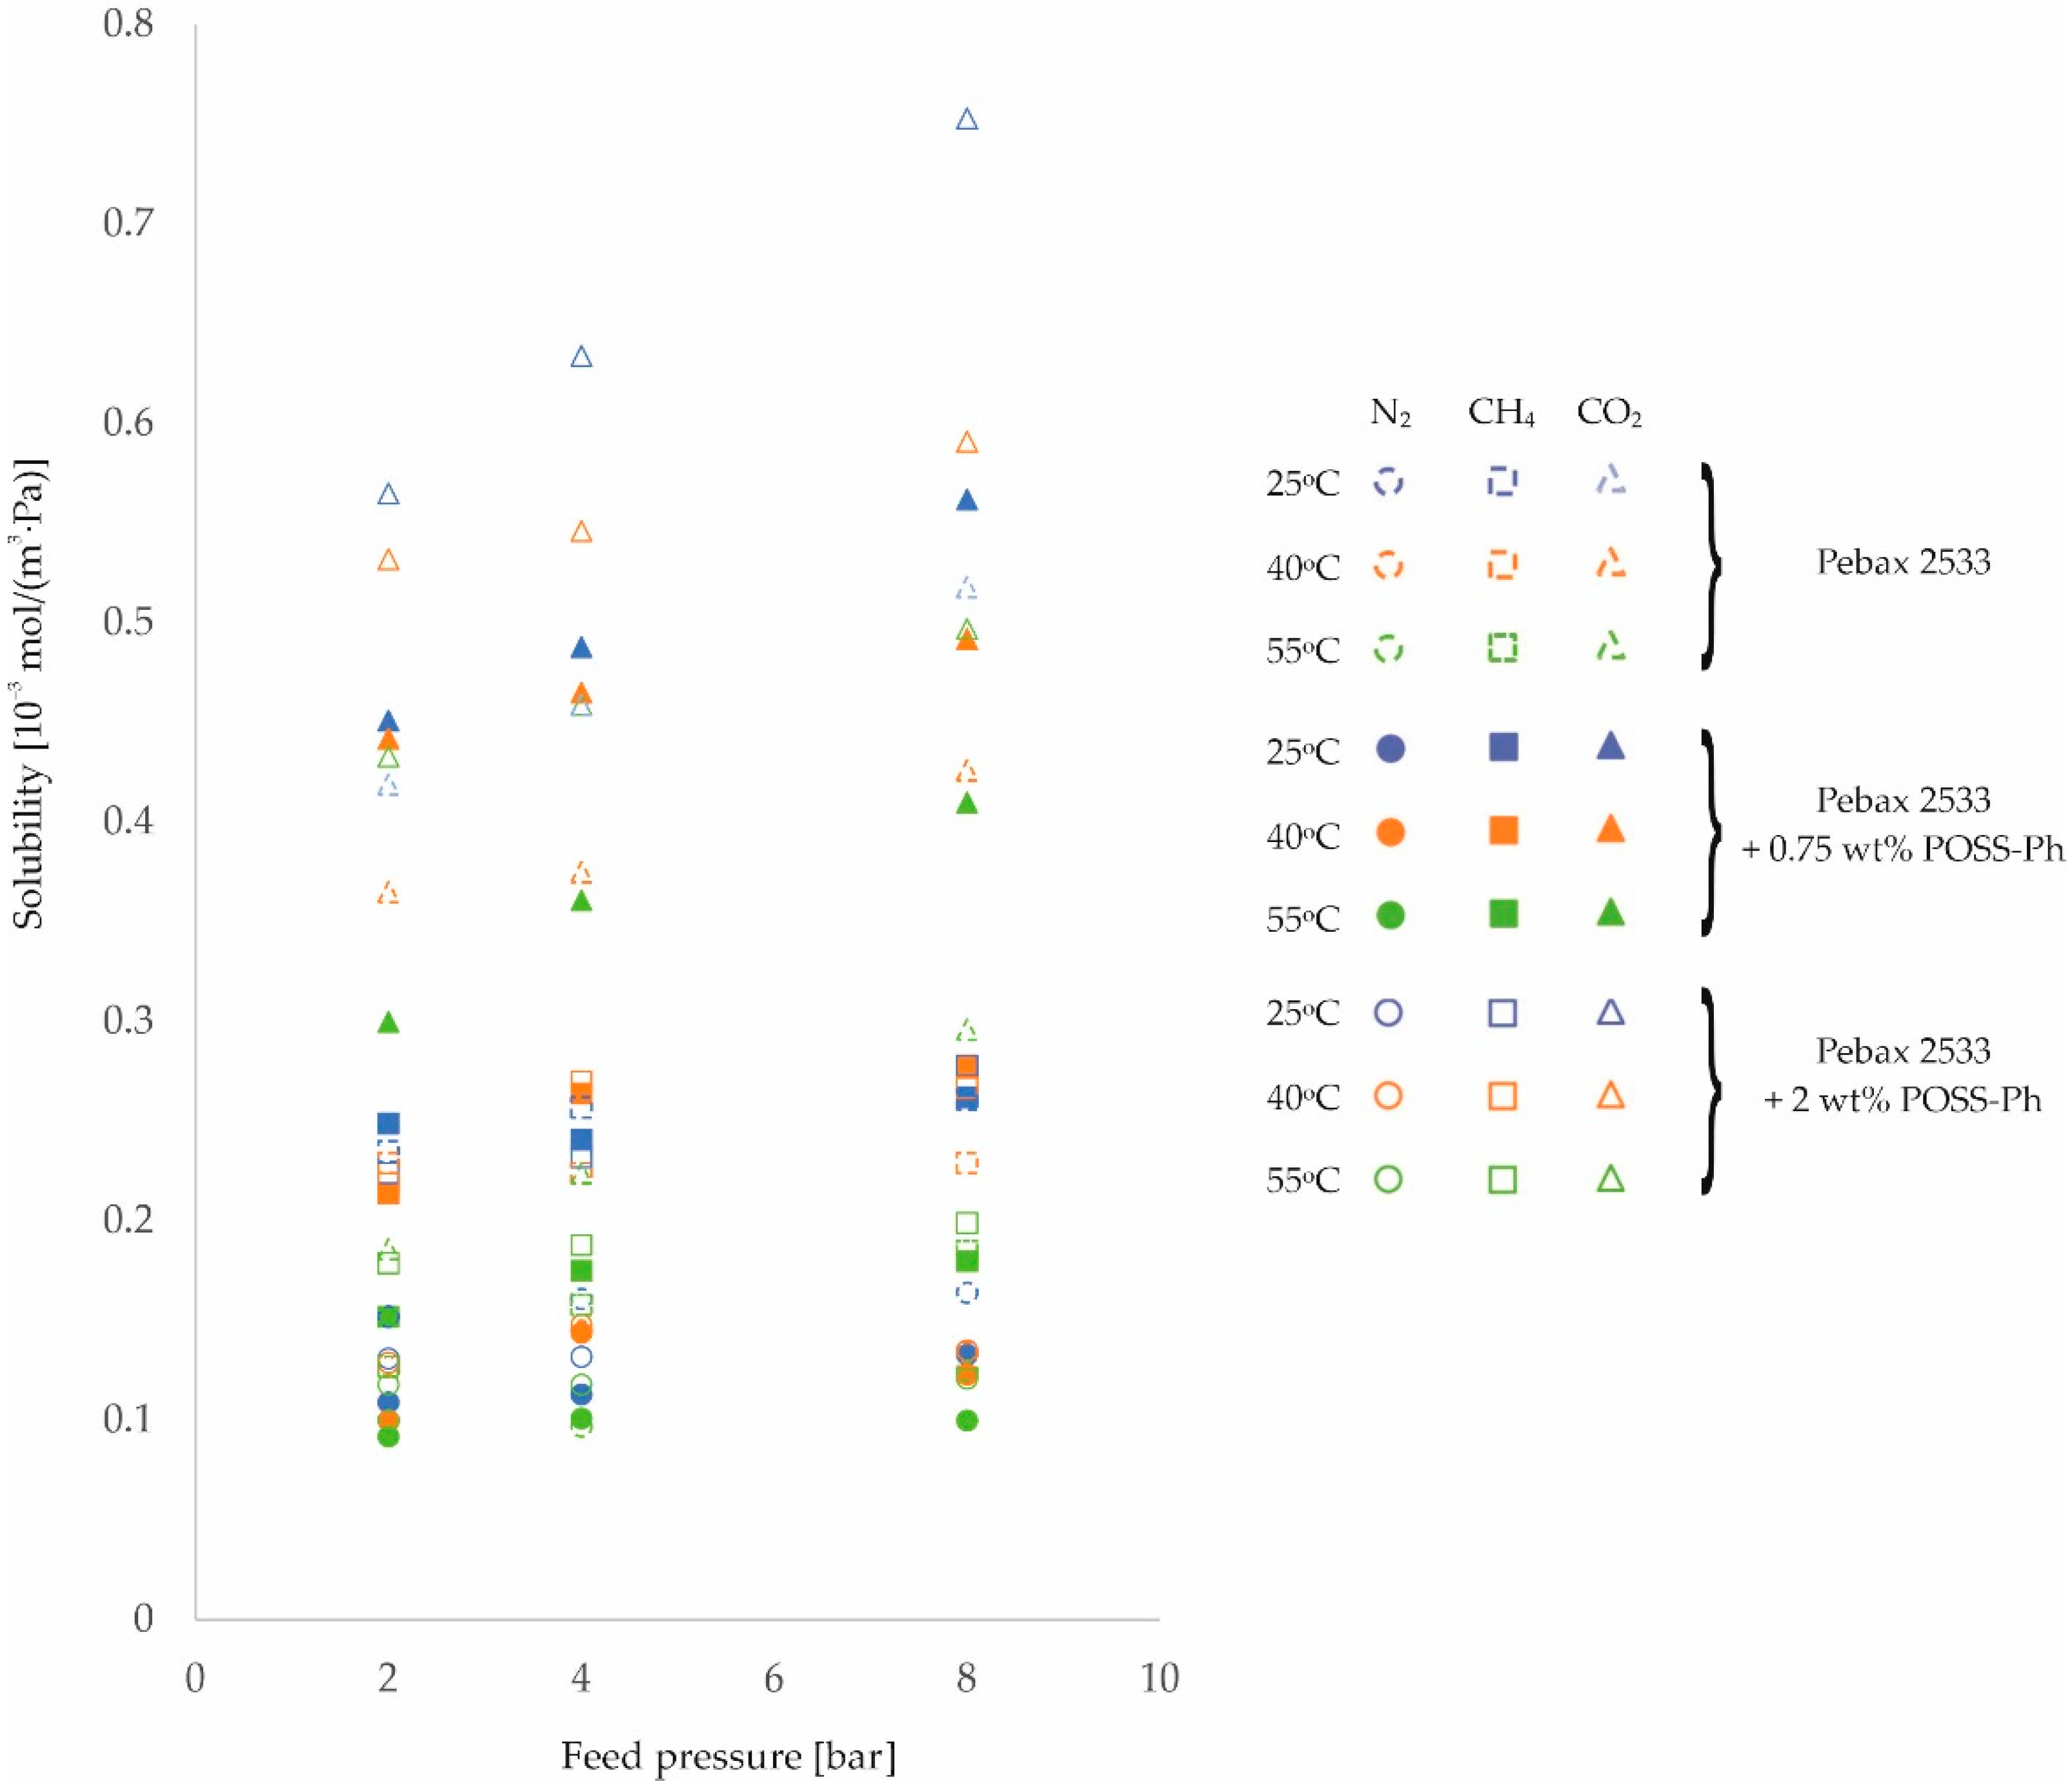
| Membrane Type | Feed Pressure [bar] | Solubility Si [10−3 mol/(m3·Pa)] | ||||||||
|---|---|---|---|---|---|---|---|---|---|---|
| N2 | CH4 | CO2 | ||||||||
| Process Temperature [ °C] | Process Temperature [ °C] | Process Temperature [ °C] | ||||||||
| 25 | 4[°C] | 55 | 25 | 4[°C] | 55 | 25 | 4[°C] | 55 | ||
| PEBAX 2533 +0.75 wt% POSS-Ph | 2 | 0.109 | 0.100 | 0.092 | 0.249 | 0.214 | 0.152 | 0.451 | 0.442 | 0.300 |
| ±0.007 | ±0.006 | ±0.006 | ±0.013 | ±0.009 | ±0.009 | ±0.027 | ±0.026 | ±0.018 | ||
| 4 | 0.113 | 0.144 | 0.101 | 0.241 | 0.264 | 0.175 | 0.488 | 0.465 | 0.361 | |
| ±0.007 | ±0.009 | ±0.006 | ±0.008 | ±0.007 | ±0.005 | ±0.029 | ±0.028 | ±0.022 | ||
| 8 | 0.133 | 0.123 | 0.100 | 0.262 | 0.277 | 0.180 | 0.562 | 0.492 | 0.410 | |
| ±0.008 | ±0.008 | ±0.006 | ±0.008 | ±0.009 | ±0.006 | ±0.034 | ±0.03 | ±0.025 | ||
| PEBAX 2533 +2 wt% POSS-Ph | 2 | 0.131 | 0.129 | 0.118 | 0.224 | 0.219 | 0.179 | 0.565 | 0.532 | 0.433 |
| ±0.008 | ±0.008 | ±0.007 | ±0.007 | ±0.007 | ±0.006 | ±0.034 | ±0.032 | ±0.026 | ||
| 4 | 0.132 | 0.148 | 0.118 | 0.232 | 0.270 | 0.188 | 0.634 | 0.546 | 0.459 | |
| ±0.008 | ±0.009 | ±0.007 | ±0.007 | ±0.008 | ±0.006 | ±0.038 | ±0.033 | ±0.028 | ||
| 8 | 0.135 | 0.135 | 0.121 | 0.278 | 0.267 | 0.199 | 0.753 | 0.591 | 0.497 | |
| ±0.008 | ±0.008 | ±0.008 | ±0.009 | ±0.008 | ±0.006 | ±0.045 | ±0.035 | ±0.03 | ||
References
- Liang, C.Z.; Chung, T.S.; Lai, J.Y. A review of polymeric composite membranes for gas separation and energy production. Prog. Polym. Sci. 2019, 97, 101141. [Google Scholar] [CrossRef]
- Bai, W.; Feng, J.; Luo, C.; Zhang, P.; Wang, H.; Yang, Y.; Zhao, Y.; Fan, H. A comprehensive review on oxygen transport membranes: Development history, current status, and future directions. Int. J. Hydrog. Energy 2021, 46, 36257–36290. [Google Scholar] [CrossRef]
- Hashim, S.M.; Mohamed, A.R.; Bhatia, S. Current status of ceramic-based membranes for oxygen separation from air. Adv. Colloid Interface Sci. 2010, 160, 88–100. [Google Scholar] [CrossRef] [PubMed]
- Han, J.; Bai, L.; Yang, B.; Bai, Y.; Luo, S.; Zeng, S.; Gao, H.; Nie, Y.; Ji, X.; Zhang, S.; et al. Highly selective oxygen/nitrogen separation membrane engineered using a porphyrin-based oxygen carrier. Membranes 2019, 9, 115. [Google Scholar] [CrossRef] [PubMed] [Green Version]
- Baena-Moreno, F.M.; le Saché, E.; Pastor-Perez, L.; Reina, T.R. Membrane-based technologies for biogas upgrading: A review. Environ. Chem. Lett. 2020, 18, 1649–1658. [Google Scholar] [CrossRef]
- Shin, M.S.; Jung, K.H.; Kwag, J.H.; Jeon, Y.W. Biogas separation using a membrane gas separator: Focus on CO2 upgrading without CH4 loss. Process Saf. Environ. Prot. 2019, 129, 348–358. [Google Scholar] [CrossRef]
- Yang, L.; Zhang, S.; Wu, H.; Ye, C.; Liang, X.; Wang, S.; Wu, X.; Wu, Y.; Ren, Y.; Liu, Y.; et al. Porous organosilicon nanotubes in pebax-based mixed-matrix membranes for biogas purification. J. Membr. Sci. 2019, 573, 301–308. [Google Scholar] [CrossRef]
- Dai, Z.; Deng, J.; He, X.; Scholes, C.A.; Jiang, X.; Wang, B.; Guo, H.; Ma, Y.; Deng, L. Helium separation using membrane technology: Recent advances and perspectives. Sep. Purif. 2021, 274, 119044. [Google Scholar] [CrossRef]
- Wang, X.; Shan, M.; Liu, X.; Wang, M.; Doherty, C.M.; Osadchii, D.; Kapteijn, F. High-performance polybenzimidazole membranes for helium extraction from natural gas. ACS Appl. Mater. Interfaces 2019, 11, 20098–20103. [Google Scholar] [CrossRef] [Green Version]
- Shahbaz, M.; Al-Ansari, T.; Aslam, M.; Khan, Z.; Inayat, A.; Athar, M.; Naqvi, S.R.; Ahmed, M.A.; McKay, G. A state of the art review on biomass processing and conversion technologies to produce hydrogen and its recovery via membrane separation. Int. J. Hydrog. Energy 2020, 45, 15166–15195. [Google Scholar] [CrossRef]
- Nayebossadri, S.; Speight, J.D.; Book, D. Hydrogen separation from blended natural gas and hydrogen by Pd-based membranes. Int. J. Hydrog. Energy 2019, 44, 29092–29099. [Google Scholar] [CrossRef]
- Cardoso, S.P.; Azenha, I.S.; Lin, Z.; Portugal, I.; Rodrigues, A.E.; Silva, C.M. Inorganic membranes for hydrogen separation. Sep. Purif. Rev. 2018, 47, 229–266. [Google Scholar] [CrossRef]
- Lei, L.; Lindbråthen, A.; Zhang, X.; Favvas, E.P.; Sandru, M.; Hillestad, M.; He, X. Preparation of carbon molecular sieve membranes with remarkable CO2/CH4 selectivity for high-pressure natural gas sweetening. J. Membr. Sci. 2020, 614, 118529. [Google Scholar] [CrossRef]
- Momeni, M.; Kojabad, M.E.; Khanmohammadi, S.; Farhadi, Z.; Ghalandarzadeh, R.; Babaluo, A.; Zare, M. Impact of support on the fabrication of poly (ether-b-amide) composite membrane and economic evaluation for natural gas sweetening. J. Nat. Gas Sci. Eng. 2019, 62, 236–246. [Google Scholar] [CrossRef]
- Quek, V.C.; Shah, N.; Chachuat, B. Modeling for design and operation of high-pressure membrane contactors in natural gas sweetening. Chem. Eng. Res. Des. 2018, 132, 1005–1019. [Google Scholar] [CrossRef]
- Bui, D.T.; Vivekh, P.; Islam, M.R.; Chua, K.J. Studying the characteristics and energy performance of a composite hollow membrane for air dehumidification. Appl. Energy 2022, 306, 118161. [Google Scholar] [CrossRef]
- Chen, G.Q.; Kanehashi, S.; Doherty, C.M.; Hill, A.J.; Kentish, S.E. Water vapor permeation through cellulose acetate membranes and its impact upon membrane separation performance for natural gas purification. J. Membr. Sci. 2015, 487, 249–255. [Google Scholar] [CrossRef] [Green Version]
- Bolto, B.; Hoang, M.; Xie, Z. A review of water recovery by vapour permeation through membranes. Water Res. 2012, 46, 259–266. [Google Scholar] [CrossRef]
- Ramírez-Santos, Á.A.; Bozorg, M.; Addis, B.; Piccialli, V.; Castel, C.; Favre, E. Optimization of multistage membrane gas separation processes. Example of application to CO2 capture from blast furnace gas. J. Membr. Sci. 2018, 566, 346–366. [Google Scholar] [CrossRef]
- Samei, M.; Raisi, A. Separation of nitrogen from methane by multi-stage membrane processes: Modeling, simulation, and cost estimation. J. Nat. Gas Sci. Eng. 2022, 98, 104380. [Google Scholar] [CrossRef]
- Tao, J.; Wang, J.; Zhu, L.; Chen, X. Integrated design of multi-stage membrane separation for landfill gas with uncertain feed. J. Membr. Sci. 2019, 590, 117260. [Google Scholar] [CrossRef]
- Brunetti, A.; Drioli, E.; Lee, Y.M.; Barbieri, G. Engineering evaluation of CO2 separation by membrane gas separation systems. J. Membr. Sci. 2014, 454, 305–315. [Google Scholar] [CrossRef]
- He, Y.; Li, G.; Wang, H.; Zhao, J.; Su, H.; Huang, Q. Effect of operating conditions on separation performance of reactive dye solution with membrane process. J. Membr. Sci. 2008, 321, 183–189. [Google Scholar] [CrossRef]
- Szwast, M.; Polak, D.; Marcjaniak, B. The influence of temperature and pressure of the feed on physical and chemical parameters of the membrane made of PEBA copolymer. Desalin. Water Treat. 2018, 128, 193–198. [Google Scholar] [CrossRef]
- Robeson, L.M. Correlation of separation factor versus permeability for polymeric membranes. J. Membr. Sci. 1991, 62, 165–185. [Google Scholar] [CrossRef]
- Freeman, B.D. Basis of permeability/selectivity tradeoff relations in polymeric gas separation membranes. Macromolecules 1999, 32, 375–380. [Google Scholar] [CrossRef]
- Robeson, L.M. The upper bound revisited. J. Membr. Sci. 2008, 320, 390–400. [Google Scholar] [CrossRef]
- Goh, P.S.; Ismail, A.F.; Sanip, S.M.; Ng, B.C.; Aziz, M. Recent advances of inorganic fillers in mixed matrix membrane for gas separation. Sep. Purif. 2011, 81, 243–264. [Google Scholar] [CrossRef]
- Jeazet, H.B.T.; Staudt, C.; Janiak, C. Metal–organic frameworks in mixed-matrix membranes for gas separation. Dalton Trans. 2012, 41, 14003–14027. [Google Scholar] [CrossRef]
- Li, W.; Peng, L.; Li, Y.; Chen, Z.; Duan, C.; Yan, S.; Yuan, B. Hyper cross-linked polymers containing amino group functionalized polyimide mixed matrix membranes for gas separation. J. Appl. Polym. Sci. 2022, 139, 52171. [Google Scholar] [CrossRef]
- Polak, D.; Szwast, M. Material and process tests of heterogeneous membranes containing ZIF-8, SiO2 and POSS-Ph. Materials 2022, 15, 6455. [Google Scholar] [CrossRef] [PubMed]
- Yazid, A.F.; Mukhtar, H.; Nasir, R.; Mohshim, D.F. Incorporating Carbon Nanotubes in Nanocomposite Mixed-Matrix Membranes for Gas Separation: A Review. Membranes 2022, 12, 589. [Google Scholar] [CrossRef] [PubMed]
- Bhide, B.D.; Stern, S.A. Membrane processes for the removal of acid gases from natural gas. I. Process configurations and optimization of operating conditions. J. Membr. Sci. 1993, 81, 209–237. [Google Scholar] [CrossRef]
- Clarizia, G. Strong and weak points of membrane systems applied to gas separation. Chem. Eng. Trans. 2009, 17, 1675–1680. [Google Scholar]
- Ji, G.; Wang, G.; Hooman, K.; Bhatia, S.; da Costa, J.C.D. Simulation of binary gas separation through multi-tube molecular sieving membranes at high temperatures. J. Chem. Eng. 2013, 218, 394–404. [Google Scholar] [CrossRef]
- Zhao, L.; Riensche, E.; Menzer, R.; Blum, L.; Stolten, D. A parametric study of CO2/N2 gas separation membrane processes for post-combustion capture. J. Membr. Sci. 2008, 325, 284–294. [Google Scholar] [CrossRef]
- Sanders, D.F.; Smith, Z.P.; Guo, R.; Robeson, L.M.; McGrath, J.E.; Paul, D.R.; Freeman, B.D. Energy-efficient polymeric gas separation membranes for a sustainable future: A review. Polymer 2013, 54, 4729–4761. [Google Scholar] [CrossRef] [Green Version]
- Castel, C.; Wang, L.; Corriou, J.P.; Favre, E. Steady vs unsteady membrane gas separation processes. Chem. Eng. Sci. 2018, 183, 136–147. [Google Scholar] [CrossRef]
- Frisch, H.L. The time lag in diffusion. J. Phys. Chem. 1957, 61, 93–95. [Google Scholar] [CrossRef]
- Rutherford, S.W.; Do, D.D. Review of time lag permeation technique as a method for characterisation of porous media and membranes. Adsorption 1997, 3, 283–312. [Google Scholar] [CrossRef]
- Laidler, K.J. The development of the Arrhenius equation. J. Chem. Educ. 1984, 61, 494. [Google Scholar] [CrossRef]
- Gajdoš, J.; Galić, K.; Kurtanjek, Ž.; Ciković, N. Gas permeability and DSC characteristics of polymers used in food packaging. Polym. Test. 2000, 20, 49–57. [Google Scholar] [CrossRef]
- Roth, C.B.; Dutcher, J.R. Glass transition and chain mobility in thin polymer films. J. Electroanal. Chem. 2005, 584, 13–22. [Google Scholar] [CrossRef]
- Adam, G.; Gibbs, J.H. On the temperature dependence of cooperative relaxation properties in glass-forming liquids. J. Chem. Phys. 1965, 43, 139–146. [Google Scholar] [CrossRef] [Green Version]
- Lee, J.Y.; Park, C.Y.; Moon, S.Y.; Choi, J.H.; Chang, B.J.; Kim, J.H. Surface-attached brush-type CO2-philic poly (PEGMA)/PSf composite membranes by UV/ozone-induced graft polymerization: Fabrication, characterization, and gas separation properties. J. Membr. Sci. 2019, 589, 117214. [Google Scholar] [CrossRef]
- Sadeghi, M.; Talakesh, M.M.; Arabi Shamsabadi, A.; Soroush, M. Novel application of a polyurethane membrane for efficient separation of hydrogen sulfide from binary and ternary gas mixtures. ChemistrySelect 2018, 3, 3302–3308. [Google Scholar] [CrossRef]
- Fried, J.R.; Hu, N. The molecular basis of CO2 interaction with polymers containing fluorinated groups: Computational chemistry of model compounds and molecular simulation of poly [bis (2, 2, 2-trifluoroethoxy) phosphazene]. Polymer 2003, 44, 4363–4372. [Google Scholar] [CrossRef]
- Zhao, Y.; Jung, B.T.; Ansaloni, L.; Ho, W.W. Multiwalled carbon nanotube mixed matrix membranes containing amines for high pressure CO2/H2 separation. J. Membr. Sci. 2014, 459, 233–243. [Google Scholar] [CrossRef]
- Frey, S.L.; Zhang, D.; Carignano, M.A.; Szleifer, I.; Lee, K.Y.C. Effects of block copolymer’s architecture on its association with lipid membranes: Experiments and simulations. Chem. Phys. 2007, 127, 114904. [Google Scholar] [CrossRef]
- Deng, Q.; Zandiehnadem, F.; Jean, Y.C. Free-volume distributions of an epoxy polymer probed by positron annihilation: Temperature dependance. Macromolecules 1992, 25, 1090–1095. [Google Scholar] [CrossRef]
- Dlubek, G.; Saarinen, K.; Fretwell, H.M. The temperature dependence of the local free volume in polyethylene and polytetrafluoroethylene: A positron lifetime study. J. Polym. Sci. B: Polym. Phys. 1998, 36, 1513–1528. [Google Scholar] [CrossRef]
- Mehio, N.; Dai, S.; Jiang, D.E. Quantum mechanical basis for kinetic diameters of small gaseous molecules. J. Phys. Chem. A 2014, 118, 1150–1154. [Google Scholar] [CrossRef]
- Costello, L.M.; Koros, W.J. Temperature dependence of gas sorption and transport properties in polymers: Measurement and applications. Ind. Eng. Chem. Res. 1992, 31, 2708–2714. [Google Scholar] [CrossRef]
- Davis, P.K.; Lundy, G.D.; Palamara, J.E.; Duda, J.L.; Danner, R.P. New pressure-decay techniques to study gas sorption and diffusion in polymers at elevated pressures. Ind. Eng. Chem. Res. 2004, 43, 1537–1542. [Google Scholar] [CrossRef]
- Finotello, A.; Bara, J.E.; Camper, D.; Noble, R.D. Room-temperature ionic liquids: Temperature dependence of gas solubility selectivity. Ind. Eng. Chem. Res. 2008, 47, 3453–3459. [Google Scholar] [CrossRef]
- Klopffer, M.H.; Flaconneche, B. Transport properties of gases in polymers: Bibliographic review. Oil Gas Sci. Technol. 2001, 56, 223–244. [Google Scholar] [CrossRef]
- Gugliuzza, A.; Drioli, E. Role of additives in the water vapor transport through block co-poly (amide/ether) membranes: Effects on surface and bulk polymer properties. Eur. Polym. J. 2004, 40, 2381–2389. [Google Scholar] [CrossRef]
- Gao, J.; Mao, H.; Jin, H.; Chen, C.; Feldhoff, A.; Li, Y. Functionalized ZIF-7/Pebax®2533 mixed matrix membranes for CO2/N2 separation. Micropor. Mesopor. Mater. 2020, 297, 110030. [Google Scholar] [CrossRef]
- Casadei, R.; Giacinti Baschetti, M.; Yoo, M.J.; Park, H.B.; Giorgini, L. Pebax®2533/graphene oxide nanocomposite membranes for carbon capture. Membranes 2020, 10, 188. [Google Scholar] [CrossRef]
- Gugliuzza, A.; Fabiano, R.; Garavaglia, M.G.; Spisso, A.; Drioli, E. Study of the surface character as responsible for controlling interfacial forces at membrane–feed interface. J. Colloid Interface Sci. 2006, 303, 388–403. [Google Scholar] [CrossRef]
- Li, G.; Kujawski, W.; Knozowska, K.; Kujawa, J. Pebax®2533/PVDF thin film mixed matrix membranes containing MIL-101 (Fe)/GO composite for CO2 capture. RSC Adv. 2022, 12, 29124. [Google Scholar] [CrossRef]
- Li, G.; Kujawski, W.; Knozowska, K.; Kujawa, J. Thin film mixed matrix hollow fiber membrane fabricated by incorporation of amine functionalized metal-organic framework for CO2/N2 separation. Materials 2021, 14, 3366. [Google Scholar] [CrossRef] [PubMed]
- Nafisi, V.; Hägg, M.B. Development of dual layer of ZIF-8/PEBAX-2533 mixed matrix membrane for CO2 capture. J. Membr. Sci. 2014, 459, 244–255. [Google Scholar] [CrossRef]
- Gugliuzza, A.; Drioli, E. Evaluation of CO2 permeation through functional assembled mono-layers: Relationships between structure and transport. Polymer 2005, 46, 9994–10003. [Google Scholar] [CrossRef]
- Ansari, A.; Navarchian, A.H.; Rajati, H. Permselectivity improvement of PEBAX®2533 membrane by addition of glassy polymers (Matrimid® and polystyrene) for CO2/N2 separation. J. Appl. Polym. Sci. 2022, 139, e51556. [Google Scholar] [CrossRef]
- Hassanzadeh, H.; Abedini, R.; Ghorbani, M. CO2 Separation over N2 and CH4 Light Gases in Sorbitol-Modified Poly(ether-block-amide)(Pebax 2533) Membrane. Ind. Eng. Chem. Res. 2022, 61, 13669–13682. [Google Scholar] [CrossRef]
- De Luca, G.; Gugliuzza, A.; Drioli, E. Competitive hydrogen-bonding interactions in modified polymer membranes: A density functional theory investigation. J. Phys. Chem. B 2009, 113, 5473–5477. [Google Scholar] [CrossRef]
- Rahman, M.M.; Filiz, V.; Shishatskiy, S.; Abetz, C.; Neumann, S.; Bolmer, S.; Khan, M.M.; Abetz, V. PEBAX® with PEG functionalized POSS as nanocomposite membranes for CO2 separation. J. Membr. Sci. 2013, 437, 286–297. [Google Scholar] [CrossRef] [Green Version]
- Lee, S.; Park, S.C.; Kim, T.Y.; Kang, S.W.; Kang, Y.S. Direct molecular interaction of CO2 with KTFSI dissolved in Pebax 2533 and their use in facilitated CO2 transport membranes. J. Membr. Sci. 2018, 548, 358–362. [Google Scholar] [CrossRef]


Publisher’s Note: MDPI stays neutral with regard to jurisdictional claims in published maps and institutional affiliations. |
© 2022 by the authors. Licensee MDPI, Basel, Switzerland. This article is an open access article distributed under the terms and conditions of the Creative Commons Attribution (CC BY) license (https://creativecommons.org/licenses/by/4.0/).
Share and Cite
Polak, D.; Szwast, M. Analysis of the Influence of Process Parameters on the Properties of Homogeneous and Heterogeneous Membranes for Gas Separation. Membranes 2022, 12, 1016. https://doi.org/10.3390/membranes12101016
Polak D, Szwast M. Analysis of the Influence of Process Parameters on the Properties of Homogeneous and Heterogeneous Membranes for Gas Separation. Membranes. 2022; 12(10):1016. https://doi.org/10.3390/membranes12101016
Chicago/Turabian StylePolak, Daniel, and Maciej Szwast. 2022. "Analysis of the Influence of Process Parameters on the Properties of Homogeneous and Heterogeneous Membranes for Gas Separation" Membranes 12, no. 10: 1016. https://doi.org/10.3390/membranes12101016
APA StylePolak, D., & Szwast, M. (2022). Analysis of the Influence of Process Parameters on the Properties of Homogeneous and Heterogeneous Membranes for Gas Separation. Membranes, 12(10), 1016. https://doi.org/10.3390/membranes12101016