
Water Flux Prediction in Direct Contact Membrane Distillation Subject to Inorganic Fouling


Abstract
:
1. Introduction
2. Materials and Methods
2.1. Experimental Setup
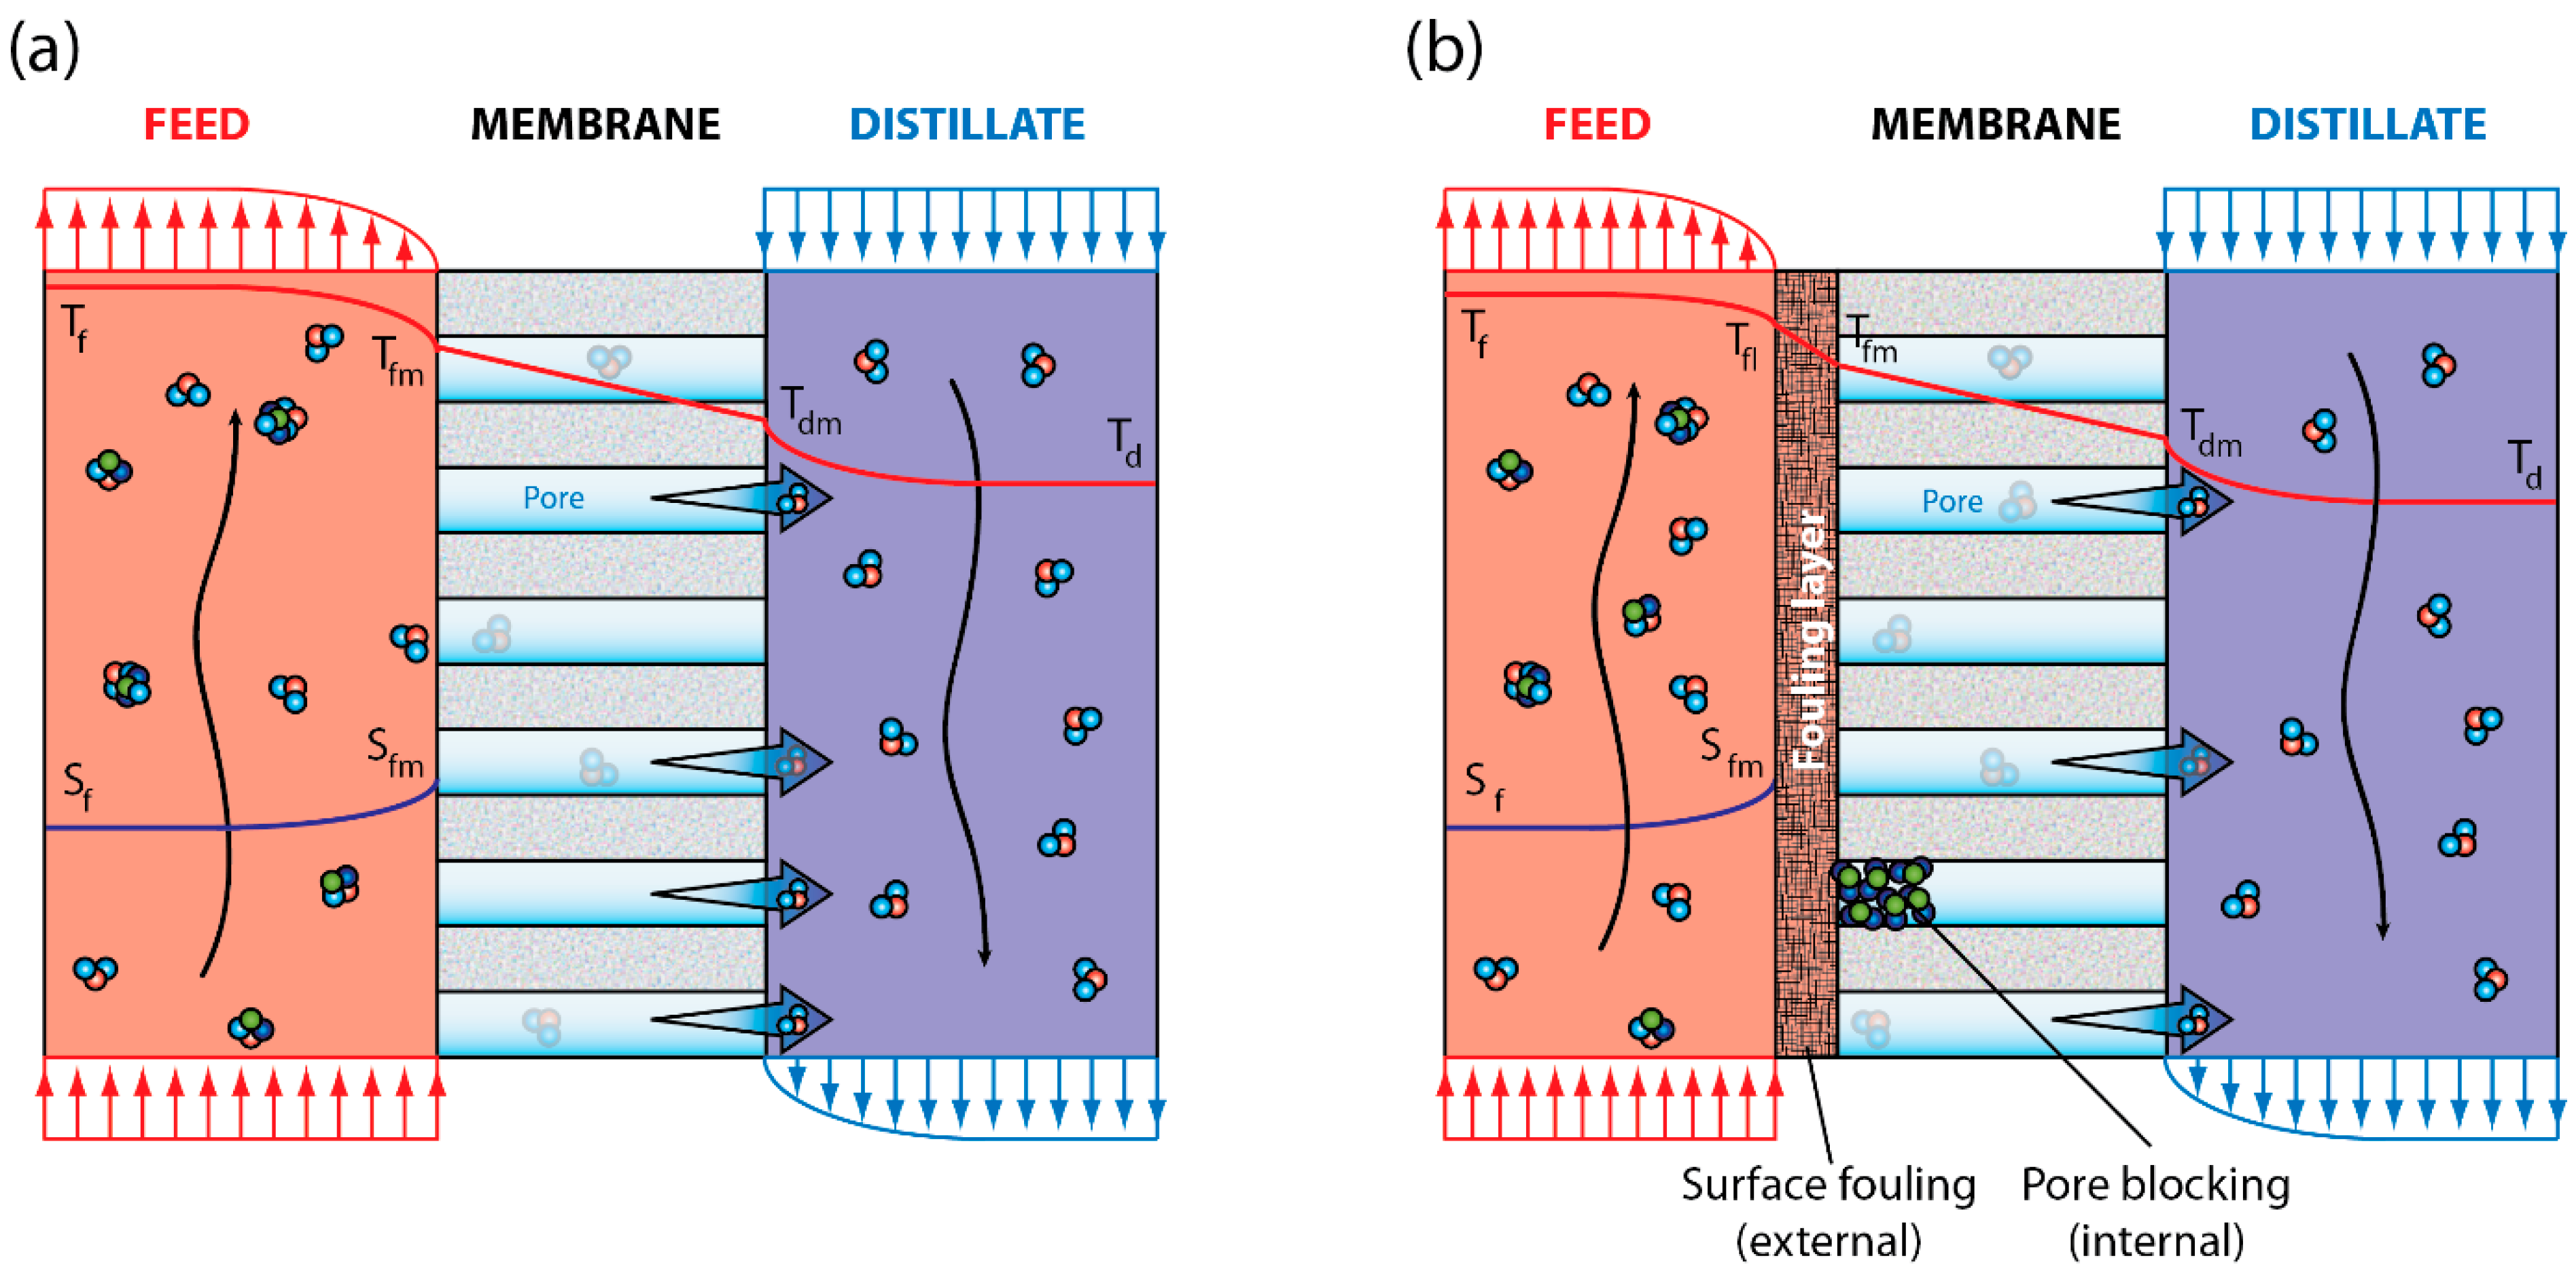
2.2. Heat and Mass Transfer Model for DCMD with Fouling
2.3. Membrane Module and Laboratory Experiments
2.3.1. Membrane Module
2.3.2. Laboratory Experiments
2.4. Microscopy
3. Results
3.1. Water Flux Prediction
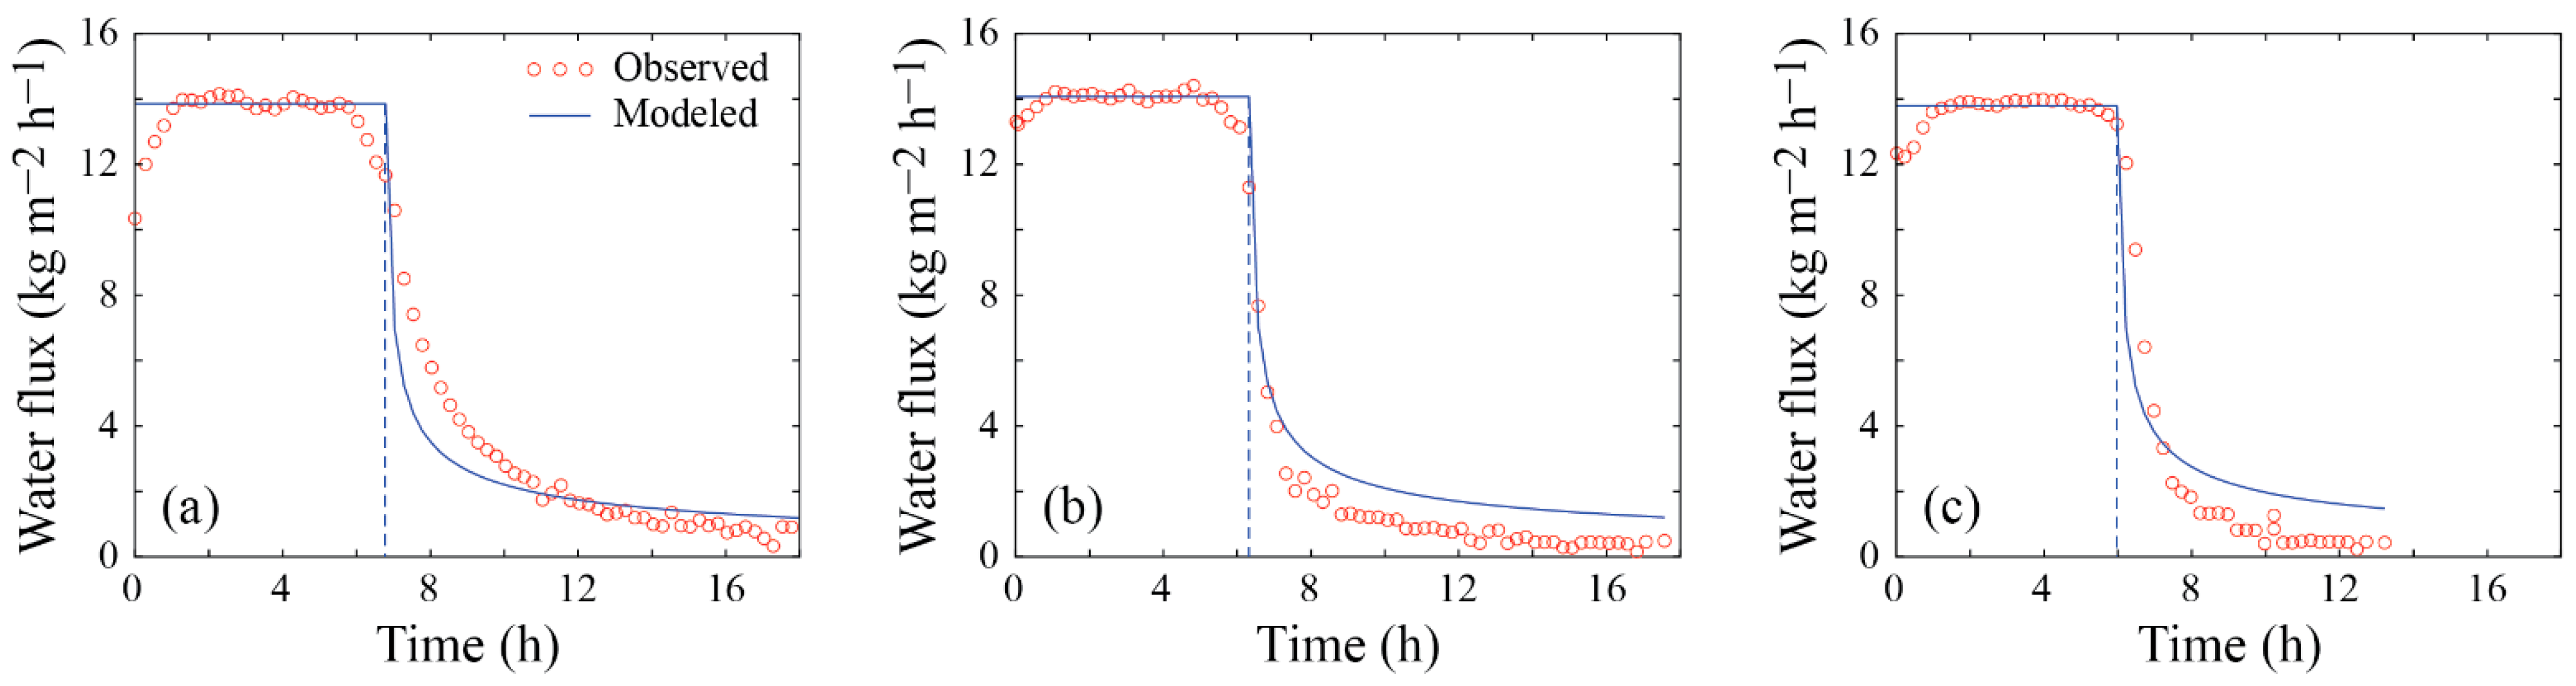
3.1.1. Experiment 1
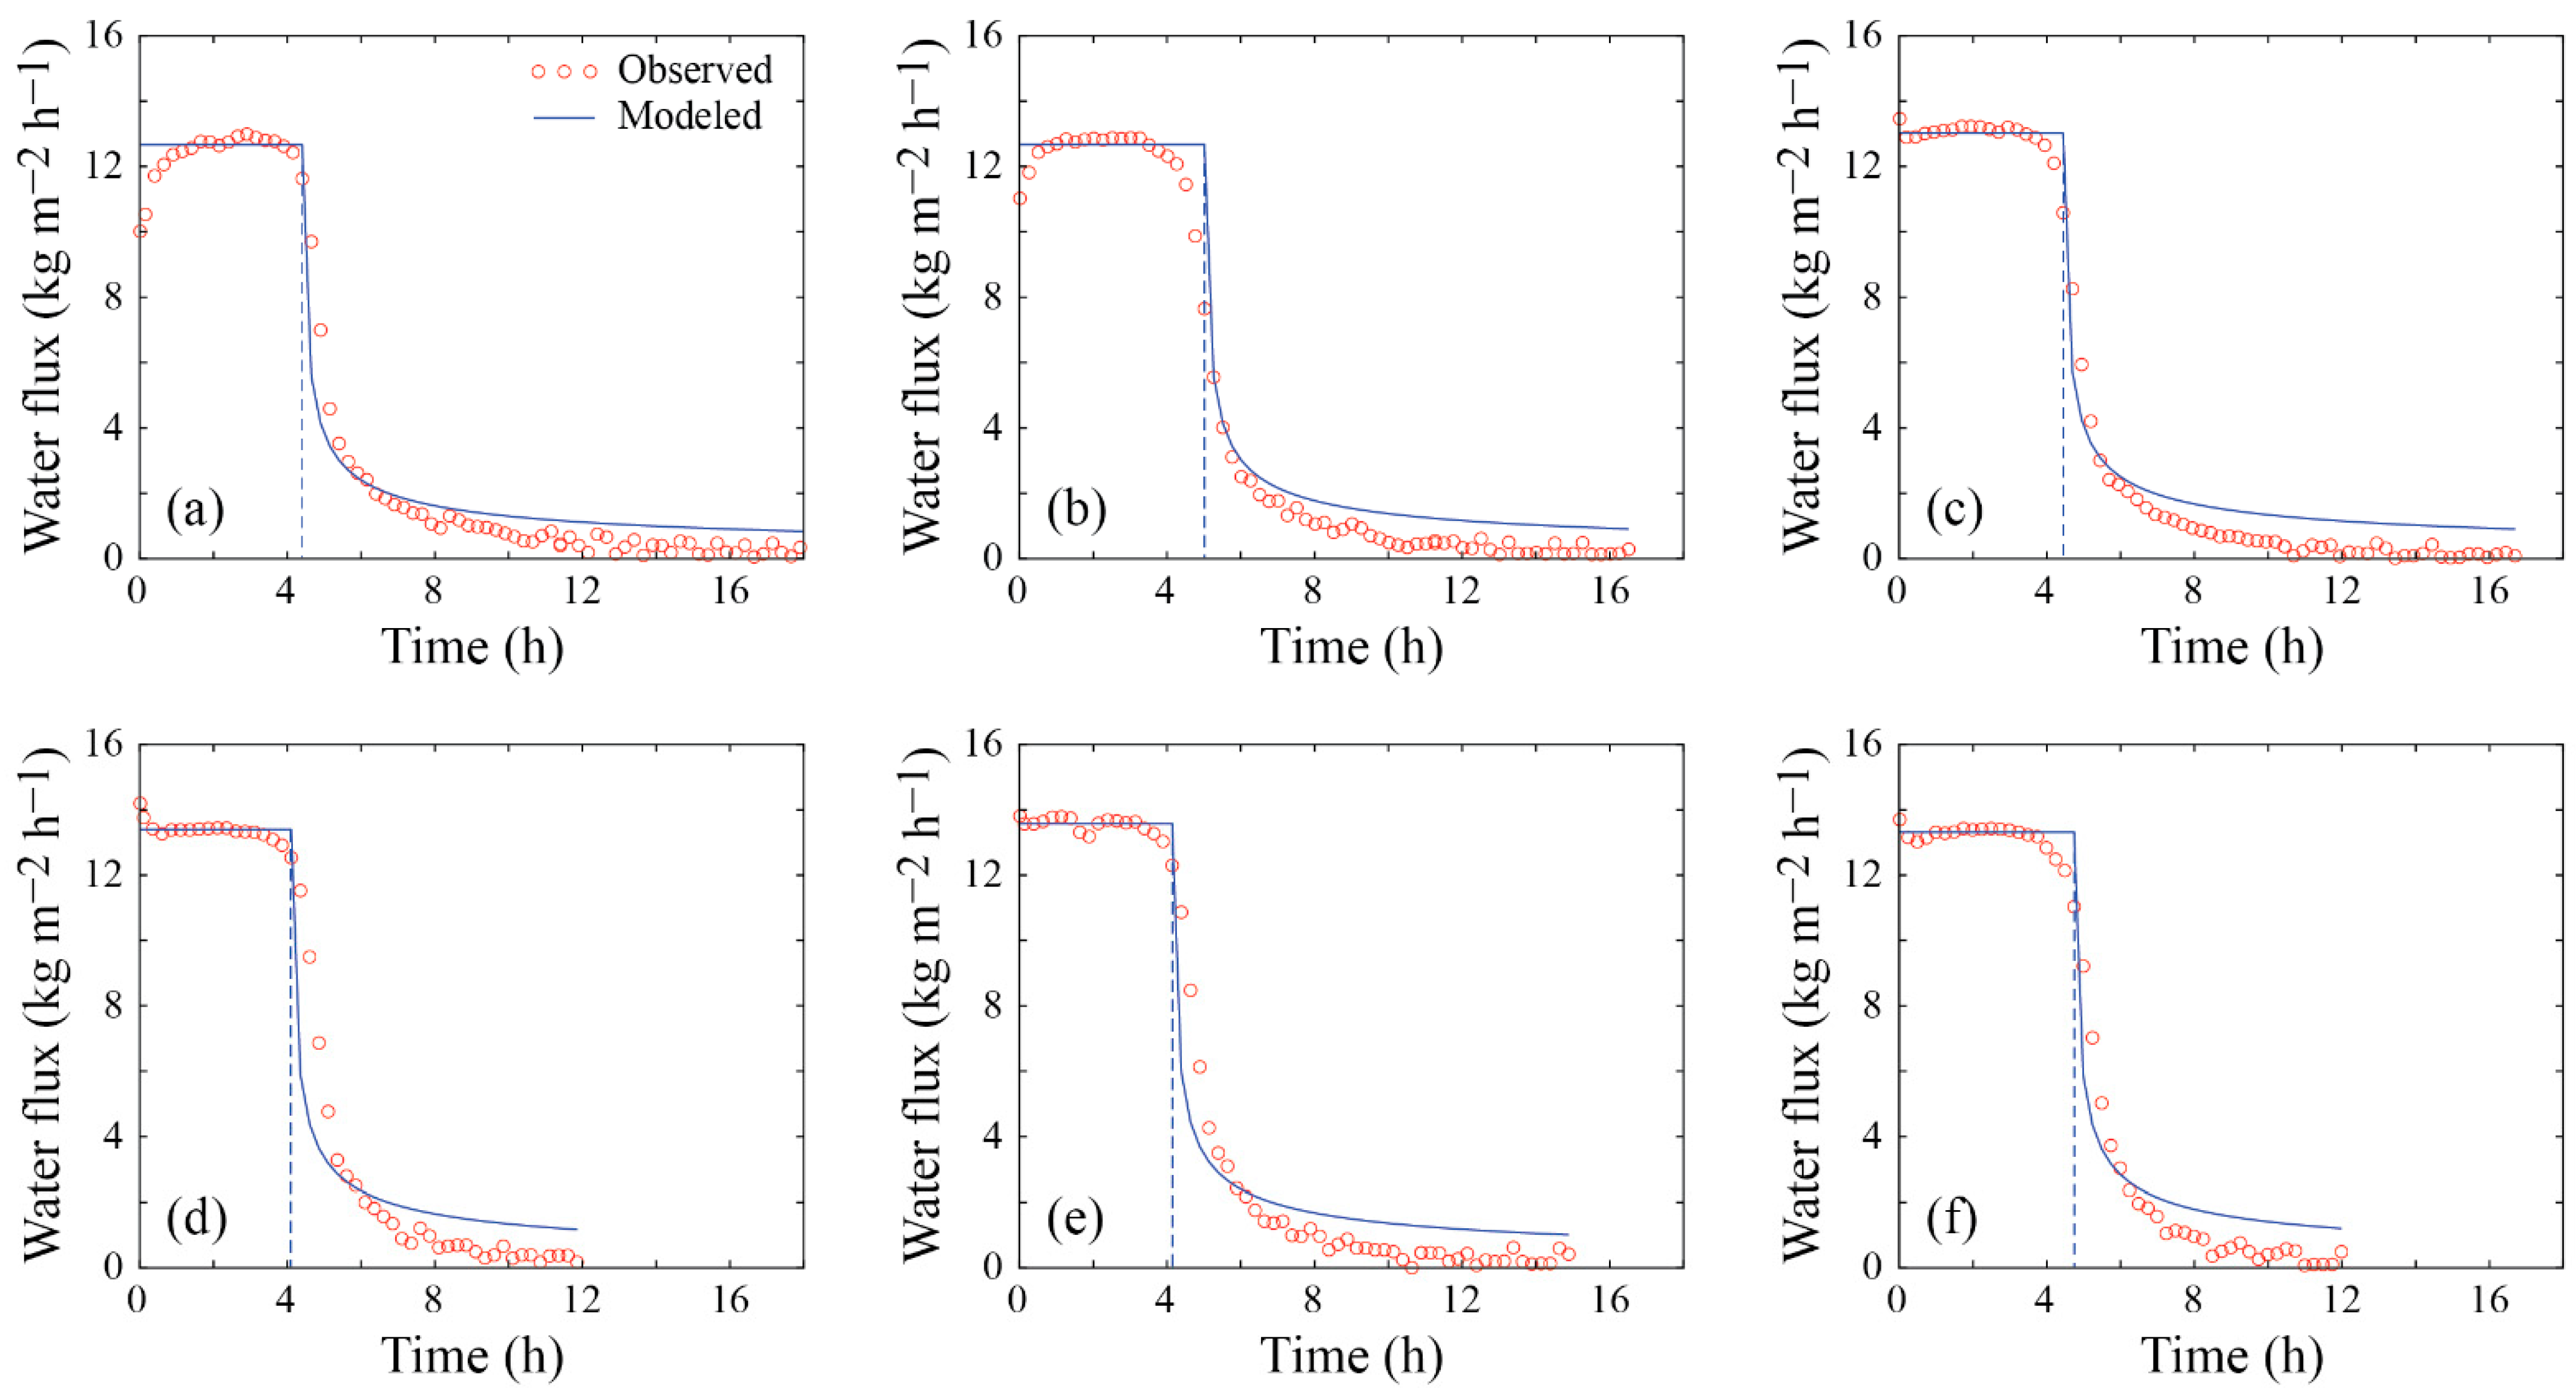
3.1.2. Experiment 2
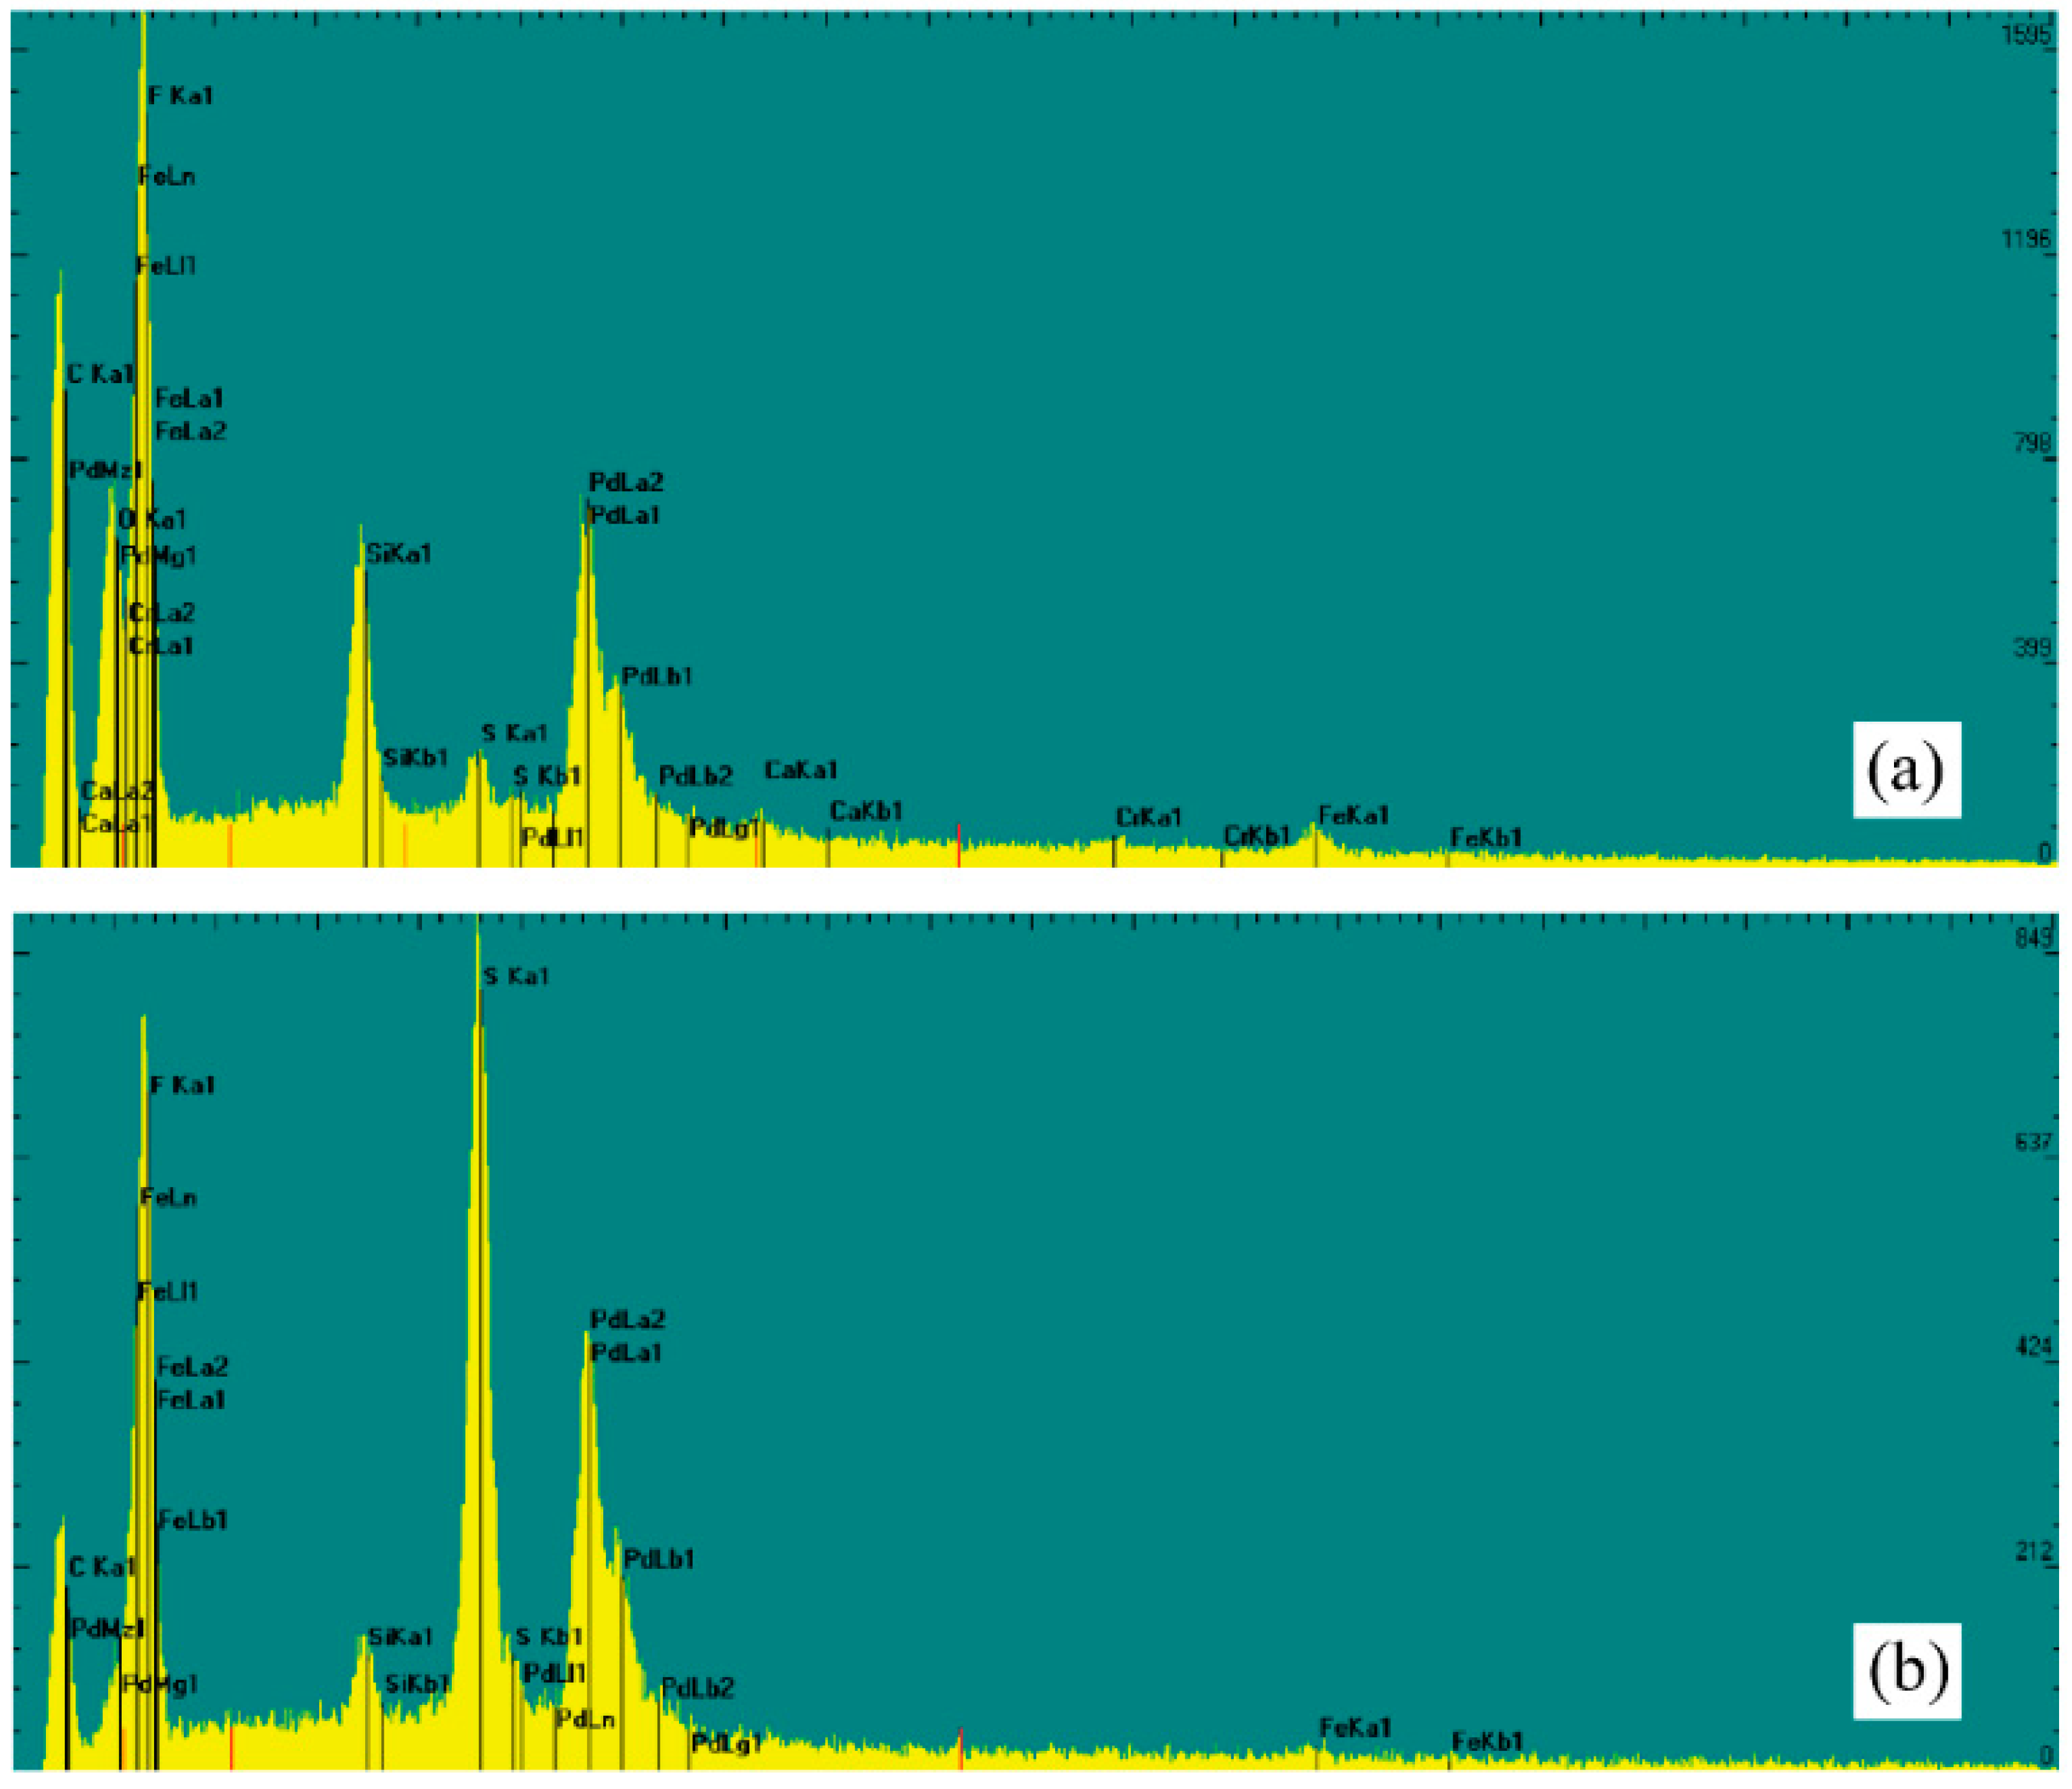
3.2. Microscopy
4. Discussion
5. Conclusions
Supplementary Materials
Author Contributions
Funding
Institutional Review Board Statement
Data Availability Statement
Acknowledgments
Conflicts of Interest
Appendix A. Estimation of the Heat and Mass Transfer Coefficients Used in the Model
References
- Kummu, M.; Ward, P.J.; de Moel, H.; Varis, O. Is Physical Water Scarcity a New Phenomenon? Global Assessment of Water Shortage over the Last Two Millennia. Environ. Res. Lett. 2010, 5, 034006. [Google Scholar] [CrossRef] [Green Version]
- Konapala, G.; Mishra, A.K.; Wada, Y.; Mann, M.E. Climate Change Will Affect Global Water Availability through Compounding Changes in Seasonal Precipitation and Evaporation. Nat. Commun. 2020, 11, 3044. [Google Scholar] [CrossRef] [PubMed]
- Tian, P.; Lu, H.; Feng, W.; Guan, Y.; Xue, Y. Large Decrease in Streamflow and Sediment Load of Qinghai–Tibetan Plateau Driven by Future Climate Change: A Case Study in Lhasa River Basin. Catena 2020, 187, 104340. [Google Scholar] [CrossRef]
- Maharjan, M.; Aryal, A.; Talchabhadel, R.; Thapa, B.R. Impact of Climate Change on the Streamflow Modulated by Changes in Precipitation and Temperature in the North Latitude Watershed of Nepal. Hydrology 2021, 8, 117. [Google Scholar] [CrossRef]
- Mengistu, D.; Bewket, W.; Dosio, A.; Panitz, H.-J. Climate Change Impacts on Water Resources in the Upper Blue Nile (Abay) River Basin, Ethiopia. J. Hydrol. 2021, 592, 125614. [Google Scholar] [CrossRef]
- Charcosset, C. A Review of Membrane Processes and Renewable Energies for Desalination. Desalination 2009, 245, 214–231. [Google Scholar] [CrossRef]
- Tijing, L.D.; Woo, Y.C.; Choi, J.-S.; Lee, S.; Kim, S.-H.; Shon, H.K. Fouling and Its Control in Membrane Distillation—A Review. J. Membr. Sci. 2015, 475, 215–244. [Google Scholar] [CrossRef]
- Ricart, S.; Villar-Navascués, R.A.; Hernández-Hernández, M.; Rico-Amorós, A.M.; Olcina-Cantos, J.; Moltó-Mantero, E. Extending Natural Limits to Address Water Scarcity? The Role of Non-Conventional Water Fluxes in Climate Change Adaptation Capacity: A Review. Sustainability 2021, 13, 2473. [Google Scholar] [CrossRef]
- Roggenburg, M.; Warsinger, D.M.; Evans, H.B.; Castillo, L. Combatting Water Scarcity and Economic Distress along the US-Mexico Border Using Renewable Powered Desalination. Appl. Energy 2021, 291, 116765. [Google Scholar] [CrossRef]
- Alvez, A.; Aitken, D.; Rivera, D.; Vergara, M.; McIntyre, N.; Concha, F. At the Crossroads: Can Desalination Be a Suitable Public Policy Solution to Address Water Scarcity in Chile’s Mining Zones? J. Environ. Manag. 2020, 258, 110039. [Google Scholar] [CrossRef]
- Esmaeilion, F.; Ahmadi, A.; Hoseinzadeh, S.; Aliehyaei, M.; Makkeh, S.A.; Garcia, D.A. Renewable Energy Desalination; a Sustainable Approach for Water Scarcity in arid Lands. Int. J. Sustain. Eng. 2021, 14, 1916–1942. [Google Scholar] [CrossRef]
- Ramli, M.R.M.; Radzi, N.H.M.; Esham, M.I.M.; Alsebaeai, M.K.; Ahmad, A.L. Advanced Application and Fouling Control in Hollow Fibre Direct Contact Membrane Distillation (HF-DCMD). Arab. J. Sci. Eng. 2021, 46, 6439–6456. [Google Scholar] [CrossRef]
- González, D.; Amigo, J.; Suárez, F. Membrane Distillation: Perspectives for Sustainable and Improved Desalination. Renew. Sustain. Energy Rev. 2017, 80, 238–259. [Google Scholar] [CrossRef]
- Suárez, F.; Tyler, S.W.; Childress, A.E. A Theoretical Study of a Direct Contact Membrane Distillation System Coupled to a Salt-Gradient Solar Pond for Terminal Lakes Reclamation. Water Res. 2010, 44, 4601–4615. [Google Scholar] [CrossRef] [PubMed]
- Suárez, F.; Ruskowitz, J.A.; Tyler, S.W.; Childress, A.E. Renewable Water: Direct Contact Membrane Distillation Coupled with Solar Ponds. Appl. Energy 2015, 158, 532–539. [Google Scholar] [CrossRef] [Green Version]
- Suárez, F.; Muñoz, J.F.; Fernández, B.; Dorsaz, J.-M.; Hunter, C.K.; Karavitis, C.A.; Gironás, J. Integrated Water Resource Management and Energy Requirements for Water Supply in the Copiapó River Basin, Chile. Water 2014, 6, 2590–2613. [Google Scholar] [CrossRef] [Green Version]
- Hailemariam, R.H.; Woo, Y.C.; Damtie, M.M.; Kim, B.C.; Park, K.-D.; Choi, J.-S. Reverse Osmosis Membrane Fabrication and Modification Technologies and Future Trends: A Review. Adv. Colloid Interface Sci. 2020, 276, 102100. [Google Scholar] [CrossRef] [PubMed]
- Askari, I.B.; Ameri, M. A Techno-Economic Review of Multi Effect Desalination Systems Integrated with Different Solar Thermal Sources. Appl. Therm. Eng. 2021, 185, 116323. [Google Scholar] [CrossRef]
- Moharram, N.A.; Bayoumi, S.; Hanafy, A.A.; El-Maghlany, W.M. Hybrid Desalination and Power Generation Plant Utilizing Multi-Stage Flash and Reverse Osmosis Driven by Parabolic Trough Collectors. Case Stud. Therm. Eng. 2021, 23, 100807. [Google Scholar] [CrossRef]
- Deshmukh, A.; Boo, C.; Karanikola, V.; Lin, S.; Straub, A.P.; Tong, T.; Warsinger, D.M.; Elimelech, M. Membrane Distillation at the Water-Energy Nexus: Limits, Opportunities, and Challenges. Energy Environ. Sci. 2018, 11, 1177–1196. [Google Scholar] [CrossRef]
- Cath, T.Y.; Childress, A.E.; Elimelech, M. Forward Osmosis: Principles, Applications, and Recent Developments. J. Membr. Sci. 2006, 281, 70–87. [Google Scholar] [CrossRef]
- Camacho, L.M.; Dumée, L.; Zhang, J.; Li, J.; Duke, M.; Gomez, J.; Gray, S. Advances in Membrane Distillation for Water Desalination and Purification Applications. Water 2013, 5, 94–196. [Google Scholar] [CrossRef] [Green Version]
- Curcio, E.; Drioli, E. Membrane Distillation and Related Operations—A Review. Sep. Purif. Rev. 2005, 34, 35–86. [Google Scholar] [CrossRef]
- Amigo, J.; Urtubia, R.; Suárez, F. Exploring the Interactions between Hydrodynamics and Fouling in Membrane Distillation Systems–A Multiscale Approach Using CFD. Desalination 2018, 444, 63–74. [Google Scholar] [CrossRef]
- Alkhudhiri, A.; Darwish, N.; Hilal, N. Membrane Distillation: A Comprehensive Review. Desalination 2012, 287, 2–18. [Google Scholar] [CrossRef]
- Anvari, A.; Yancheshme, A.A.; Kekre, K.M.; Ronen, A. State-of-the-Art Methods for Overcoming Temperature Polarization in Membrane Distillation Process: A Review. J. Membr. Sci. 2020, 616, 118413. [Google Scholar] [CrossRef]
- Suárez, F.; Urtubia, R. Tackling the Water-Energy Nexus: An Assessment of Membrane Distillation Driven by Salt-Gradient Solar Ponds. Clean Technol. Environ. Policy 2016, 18, 1697–1712. [Google Scholar] [CrossRef]
- Nakoa, K.; Rahaoui, K.; Date, A.; Akbarzadeh, A. An Experimental Review on Coupling of Solar Pond with Membrane Distillation. Sol. Energy 2015, 119, 319–331. [Google Scholar] [CrossRef]
- Hsu, S.T.; Cheng, K.T.; Chiou, J.S. Seawater Desalination by Direct Contact Membrane Distillation. Desalination 2002, 143, 279–287. [Google Scholar] [CrossRef]
- Mathioulakis, E.; Belessiotis, V.; Delyannis, E. Desalination by Using Alternative Energy: Review and State-of-the-Art. Desalination 2007, 203, 346–365. [Google Scholar] [CrossRef]
- Al-Obaidani, S.; Curcio, E.; Macedonio, F.; Di Profio, G.; Al-Hinai, H.; Drioli, E. Potential of Membrane Distillation in Seawater Desalination: Thermal Efficiency, Sensitivity Study and Cost Estimation. J. Membr. Sci. 2008, 323, 85–98. [Google Scholar] [CrossRef]
- El-Bourawi, M.S.; Ding, Z.; Ma, R.; Khayet, M. A Framework for Better Understanding Membrane Distillation Separation Process. J. Membr. Sci. 2006, 285, 4–29. [Google Scholar] [CrossRef]
- Cath, T.Y.; Adams, V.D.; Childress, A.E. Experimental Study of Desalination Using Direct Contact Membrane Distillation: A New Approach to Flux Enhancement. J. Membr. Sci. 2004, 228, 5–16. [Google Scholar] [CrossRef]
- Gryta, M. Influence of Polypropylene Membrane Surface Porosity on the Performance of Membrane Distillation Process. J. Membr. Sci. 2007, 287, 67–78. [Google Scholar] [CrossRef]
- He, F.; Gilron, J.; Lee, H.; Song, L.; Sirkar, K.K. Potential for Scaling by Sparingly Soluble Salts in Crossflow DCMD. J. Membr. Sci. 2008, 311, 68–80. [Google Scholar] [CrossRef]
- Warsinger, D.M.; Swaminathan, J.; Guillen-Burrieza, E.; Arafat, H.A.; Lienhard, J.H.V. Scaling and Fouling in Membrane Distillation for Desalination Applications: A Review. Desalination 2015, 356, 294–313. [Google Scholar] [CrossRef]
- Srisurichan, S.; Jiraratananon, R.; Fane, A.G. Mass Transfer Mechanisms and Transport Resistances in Direct Contact Membrane Distillation Process. J. Membr. Sci. 2006, 277, 186–194. [Google Scholar] [CrossRef]
- Alklaibi, A.M.; Lior, N. Membrane-Distillation Desalination: Status and Potential. Desalination 2005, 171, 111–131. [Google Scholar] [CrossRef]
- Zou, T.; Dong, X.; Kang, G.; Zhou, M.; Li, M.; Cao, Y. Fouling Behavior and Scaling Mitigation Strategy of CaSO4 in Submerged Vacuum Membrane Distillation. Desalination 2018, 425, 86–93. [Google Scholar] [CrossRef]
- Tong, T.; Wallace, A.F.; Zhao, S.; Wang, Z. Mineral Scaling in Membrane Desalination: Mechanisms, Mitigation Strategies, and Feasibility of Scaling-Resistant Membranes. J. Membr. Sci. 2019, 579, 52–69. [Google Scholar] [CrossRef]
- Xiao, Z.; Guo, H.; He, H.; Liu, Y.; Li, X.; Zhang, Y.; Yin, H.; Volkov, A.V.; He, T. Unprecedented Scaling/Fouling Resistance of Omniphobic Polyvinylidene Fluoride Membrane with Silica Nanoparticle Coated Micropillars in Direct Contact Membrane Distillation. J. Membr. Sci. 2020, 599, 117819. [Google Scholar] [CrossRef]
- Tang, C.Y.; Chong, T.H.; Fane, A.G. Colloidal Interactions and Fouling of NF and RO Membranes: A Review. Adv. Colloid Interface Sci. 2011, 164, 126–143. [Google Scholar] [CrossRef] [PubMed]
- Li, B.; Yun, Y.; Liu, G.; Li, C.; Li, X.; Hilal, M.; Yang, W.; Wang, M. Direct Contact Membrane Distillation with Softening Pre-Treatment for Effective Reclaiming Flue Gas Desulfurization Wastewater. Sep. Purif. Technol. 2021, 277, 119637. [Google Scholar] [CrossRef]
- Zhang, Z.; Lokare, O.R.; Gusa, A.V.; Vidic, R.D. Pretreatment of Brackish Water Reverse Osmosis (BWRO) Concentrate to Enhance Water Recovery in Inland Desalination Plants by Direct Contact Membrane Distillation (DCMD). Desalination 2021, 508, 115050. [Google Scholar] [CrossRef]
- Santos, P.G.; Scherer, C.M.; Fisch, A.G.; Rodrigues, M.A.S. Membrane Distillation: Pre-Treatment Effects on Fouling Dynamics. Membranes 2021, 11, 958. [Google Scholar] [CrossRef] [PubMed]
- Gryta, M. Fouling in Direct Contact Membrane Distillation Process. J. Membr. Sci. 2008, 325, 383–394. [Google Scholar] [CrossRef]
- Abdel-Karim, A.; Leaper, S.; Skuse, C.; Zaragoza, G.; Gryta, M.; Gorgojo, P. Membrane Cleaning and Pretreatments in Membrane Distillation–A Review. Chem. Eng. J. 2021, 422, 129696. [Google Scholar] [CrossRef]
- Ho, C.-C.; Zydney, A.L. A Combined Pore Blockage and Cake Filtration Model for Protein Fouling during Microfiltration. J. Colloid Interface Sci. 2000, 232, 389–399. [Google Scholar] [CrossRef]
- Tien, C.; Bai, R. An Assessment of the Conventional Cake Filtration Theory. Chem. Eng. Sci. 2003, 58, 1323–1336. [Google Scholar] [CrossRef]
- del Río, M.B. Predicción del Flujo de Agua en Membranas de Destilación Con Formación de Fouling; Pontificia Universidad Católica de Chile: Santiago, Chile, 2017. [Google Scholar]
- Martínez, L.; Rodríguez-Maroto, J.M. Characterization of Membrane Distillation Modules and Analysis of Mass Flux Enhancement by Channel Spacers. J. Membr. Sci. 2006, 274, 123–137. [Google Scholar] [CrossRef]
- Yun, Y.; Ma, R.; Zhang, W.; Fane, A.G.; Li, J. Direct Contact Membrane Distillation Mechanism for High Concentration NaCl Solutions. Desalination 2006, 188, 251–262. [Google Scholar] [CrossRef]
- Liu, C.; Huang, Y.; Shen, W.; Cui, J. Kinetics of Hydroxyapatite Precipitation at PH 10 to 11. Biomaterials 2001, 22, 301–306. [Google Scholar] [CrossRef]
- Alkhatib, A.; Ayari, M.A.; Hawari, A.H. Fouling Mitigation Strategies for Different Foulants in Membrane Distillation. Chem. Eng. Process.-Process Intensif. 2021, 167, 108517. [Google Scholar] [CrossRef]
- Guillen-Burrieza, E.; Ruiz-Aguirre, A.; Zaragoza, G.; Arafat, H.A. Membrane Fouling and Cleaning in Long Term Plant-Scale Membrane Distillation Operations. J. Membr. Sci. 2014, 468, 360–372. [Google Scholar] [CrossRef]
- Liu, L.; Xiao, Z.; Liu, Y.; Li, X.; Yin, H.; Volkov, A.; He, T. Understanding the Fouling/Scaling Resistance of Superhydrophobic/Omniphobic Membranes in Membrane Distillation. Desalination 2021, 499, 114864. [Google Scholar] [CrossRef]
- Phattaranawik, J.; Jiraratananon, R.; Fane, A.G. Heat Transport and Membrane Distillation Coefficients in Direct Contact Membrane Distillation. J. Membr. Sci. 2003, 212, 177–193. [Google Scholar] [CrossRef]


| Parameters | Experiment 1 | Experiment 2 |
|---|---|---|
| Feed solution composition | 20.5 g CaCl2∙2H2O 18.7 g MgSO4∙6H2O 4.5 g NaCl | 20.5 g CaCl2∙2H2O 10.8 g Na2∙SO 1.2 g NaCl |
| Feed solution volume (L) | 4 | 4 |
| Feed salinity (%) | 1.09 | 0.81 |
| Cleaning solution composition | 20 g EDTA 5 g NaOH | 11.7 g NaCl |
| Cleaning solution volume (L) | 2 | 2 |
| Time of cleaning (min) | 30 | 30 |
| Rinse volume (L) | 12 | 12 |
| Number of cleaning cycles | 2 | 5 |
| Pa (kPa) | 94 | 94 |
| P (kPa) | 101.3 | 101.3 |
| Feed channel temperature (°C) | 38.8 | 40.0 |
| Distillate channel temperature (°C) | 20.8 | 20.0 |
| (W m−2 °C−1) | 1.20 × 10⁴ | 1.21 × 10⁴ |
| (W m−2 °C−1) | 9.55 × 10³ | 9.46 × 10³ |
| (m s−1) | 1.89 × 10⁻⁴ | 1.90 × 10⁻⁴ |
| Cleaning Cycle | Experiment 1 | Experiment 2 | ||||||
|---|---|---|---|---|---|---|---|---|
| (kg h−1) | Error in precipitated salts (kg) | (h) | R (%) | (kg h−1) | Error in precipitated salts (kg) | (h) | R (%) | |
| New membrane | 1.21 × 10⁻³ | 4.95 × 10⁻¹⁰ | 6.79 | 42 | 5.20 × 10⁻⁴ | 2.51 × 10⁻¹⁰ | 4.39 | 25 |
| After first cleaning | 9.34 × 10⁻⁴ | 1.45 × 10⁻¹¹ | 6.31 | 37 | 6.81 × 10⁻⁴ | 1.64 × 10⁻¹⁰ | 5.00 | 25 |
| After second cleaning | 1.39 × 10⁻³ | 1.55 × 10⁻¹⁰ | 5.96 | 34 | 6.72 × 10⁻⁴ | 1.91 × 10⁻¹⁰ | 4.43 | 25 |
| After third cleaning | - | - | - | - | 1.13 × 10⁻³ | 2.37 × 10⁻¹⁰ | 4.09 | 25 |
| After fourth cleaning | - | - | - | - | 8.28 × 10⁻⁴ | 2.38 × 10⁻¹⁰ | 4.12 | 25 |
| After fifth cleaning | - | - | - | - | 1.12 × 10⁻³ | 1.81 × 10⁻¹⁰ | 4.73 | 26 |
Publisher’s Note: MDPI stays neutral with regard to jurisdictional claims in published maps and institutional affiliations. |
© 2022 by the authors. Licensee MDPI, Basel, Switzerland. This article is an open access article distributed under the terms and conditions of the Creative Commons Attribution (CC BY) license (https://creativecommons.org/licenses/by/4.0/).
Share and Cite
Suárez, F.; del Río, M.B.; Aravena, J.E. Water Flux Prediction in Direct Contact Membrane Distillation Subject to Inorganic Fouling. Membranes 2022, 12, 157. https://doi.org/10.3390/membranes12020157
Suárez F, del Río MB, Aravena JE. Water Flux Prediction in Direct Contact Membrane Distillation Subject to Inorganic Fouling. Membranes. 2022; 12(2):157. https://doi.org/10.3390/membranes12020157
Chicago/Turabian StyleSuárez, Francisco, María B. del Río, and Jazmín E. Aravena. 2022. "Water Flux Prediction in Direct Contact Membrane Distillation Subject to Inorganic Fouling" Membranes 12, no. 2: 157. https://doi.org/10.3390/membranes12020157
APA StyleSuárez, F., del Río, M. B., & Aravena, J. E. (2022). Water Flux Prediction in Direct Contact Membrane Distillation Subject to Inorganic Fouling. Membranes, 12(2), 157. https://doi.org/10.3390/membranes12020157