
Analytical Model for Concentration (Pressure) Impedance of a Low-Pt PEM Fuel Cell Oxygen Electrode


Abstract
:1. Introduction
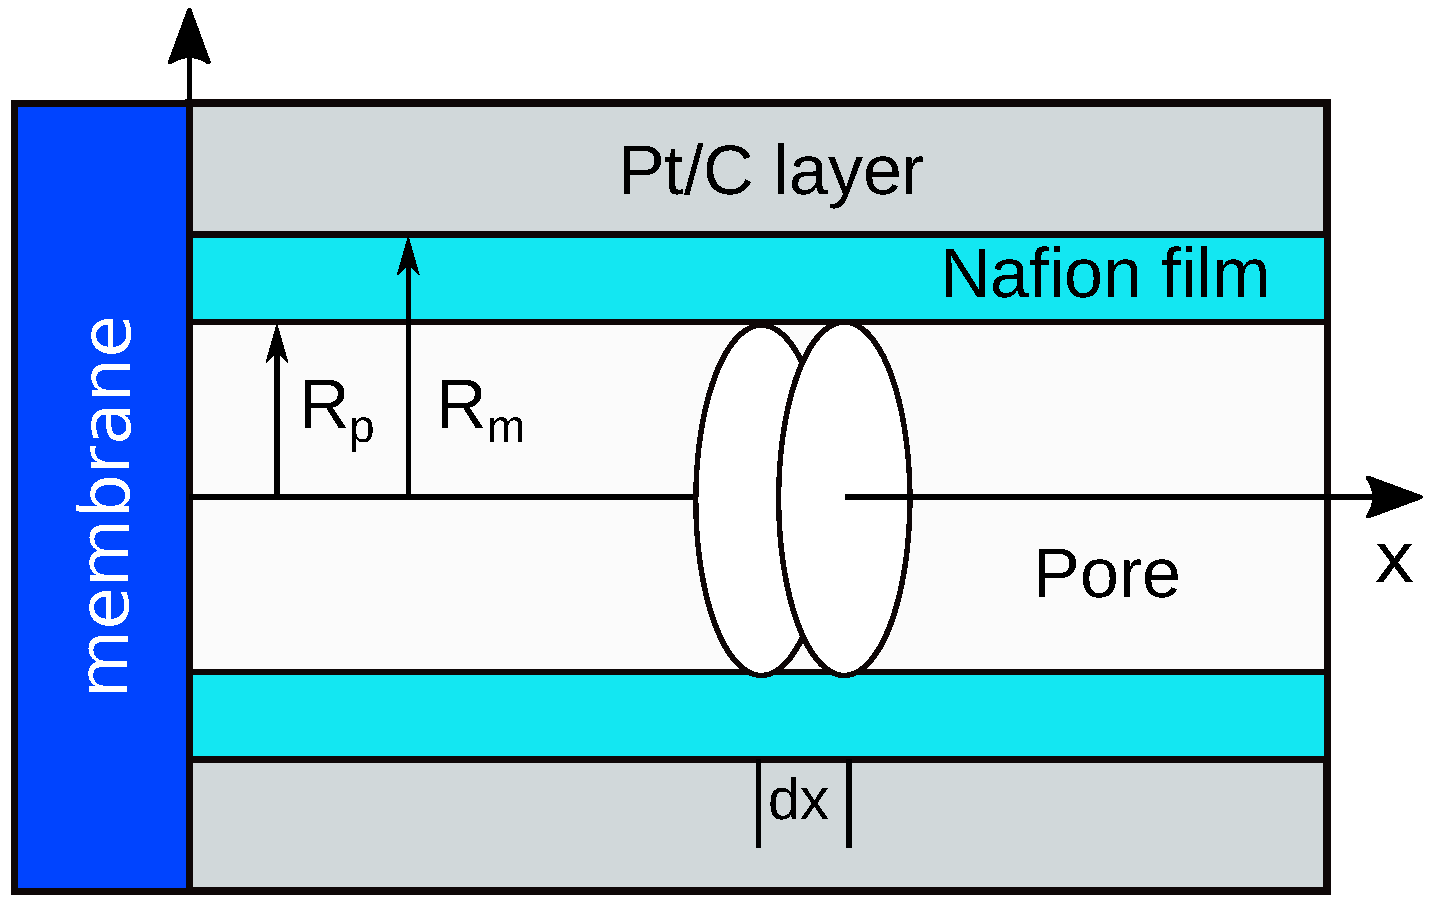
2. Model
2.1. Basic Transient Equations
- Oxygen transport loss in the gas-diffusion layer is small;
- Proton transport in the CCL is fast;
- Oxygen consumption in the CCL is large.
2.2. Equations for Perturbation Amplitudes
2.3. Static Equations and Solutions
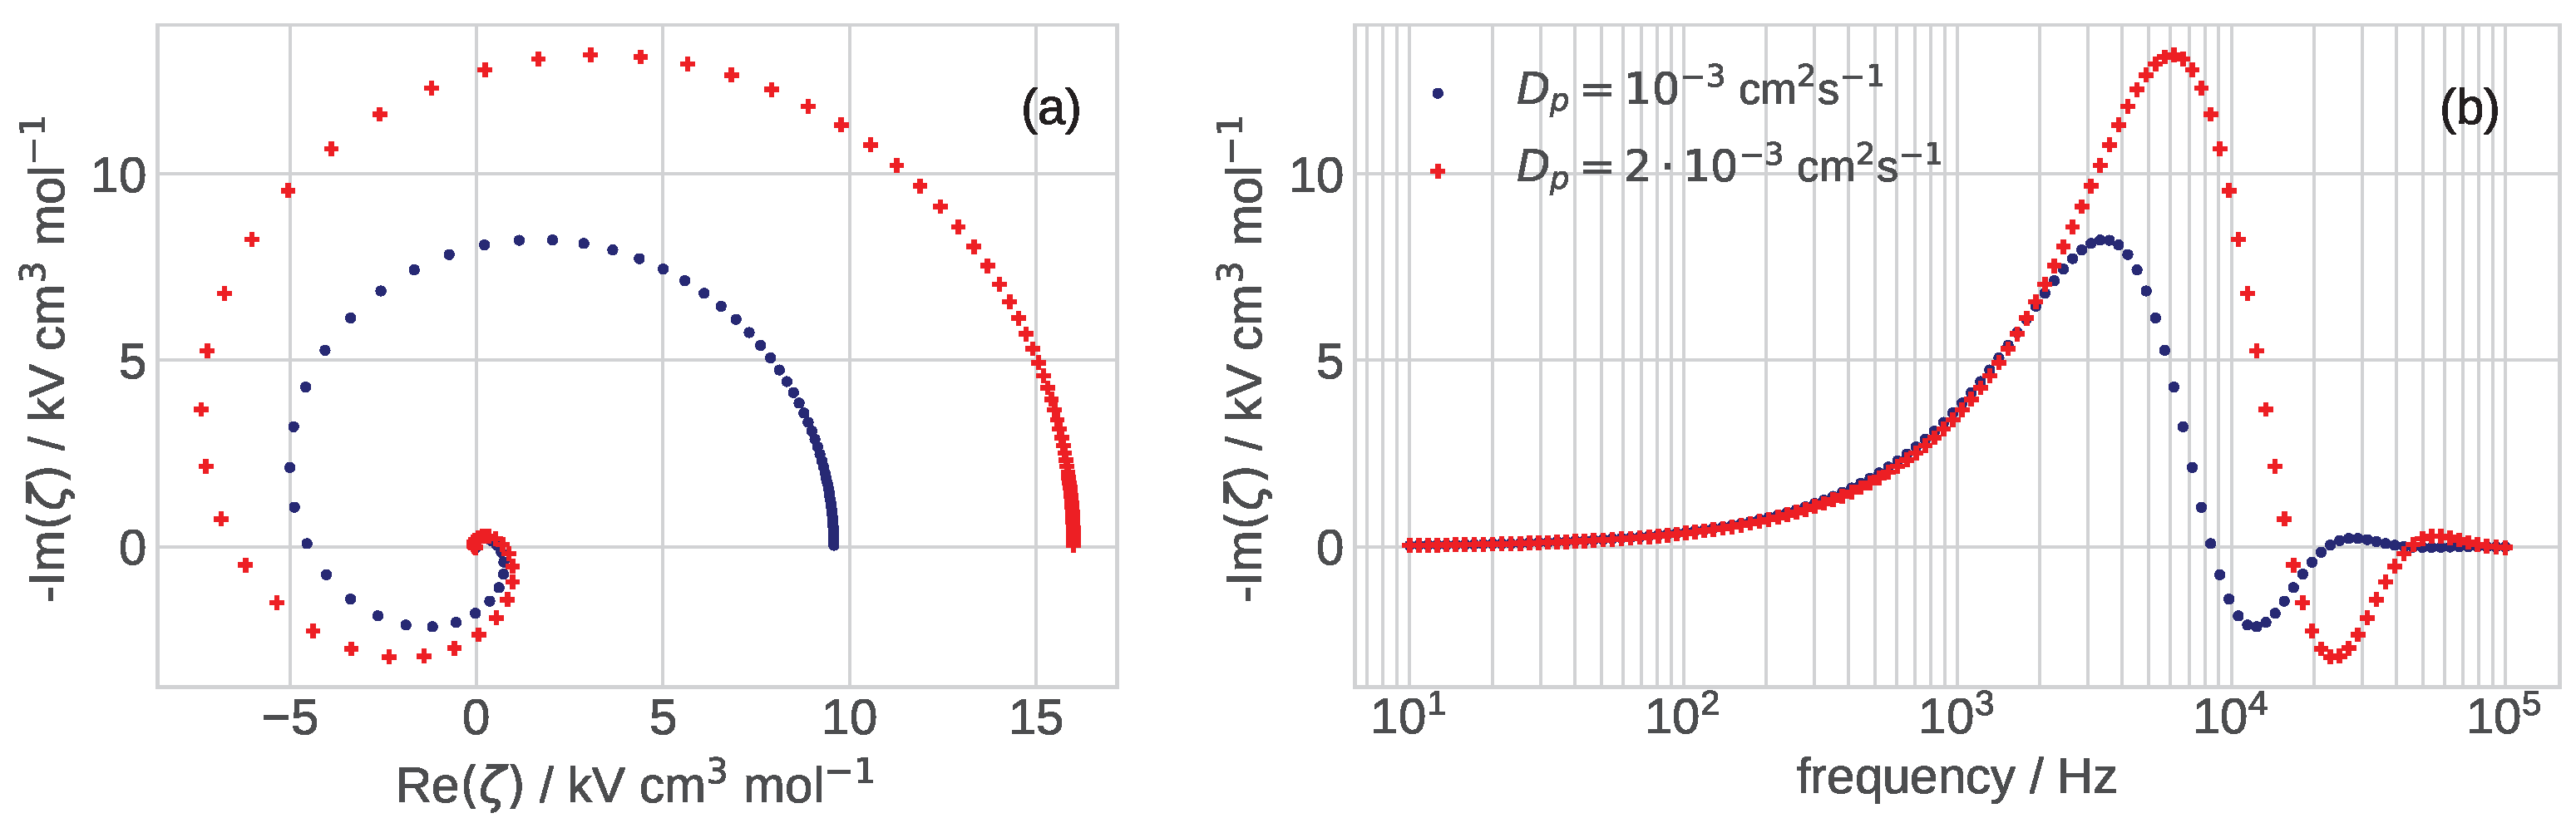
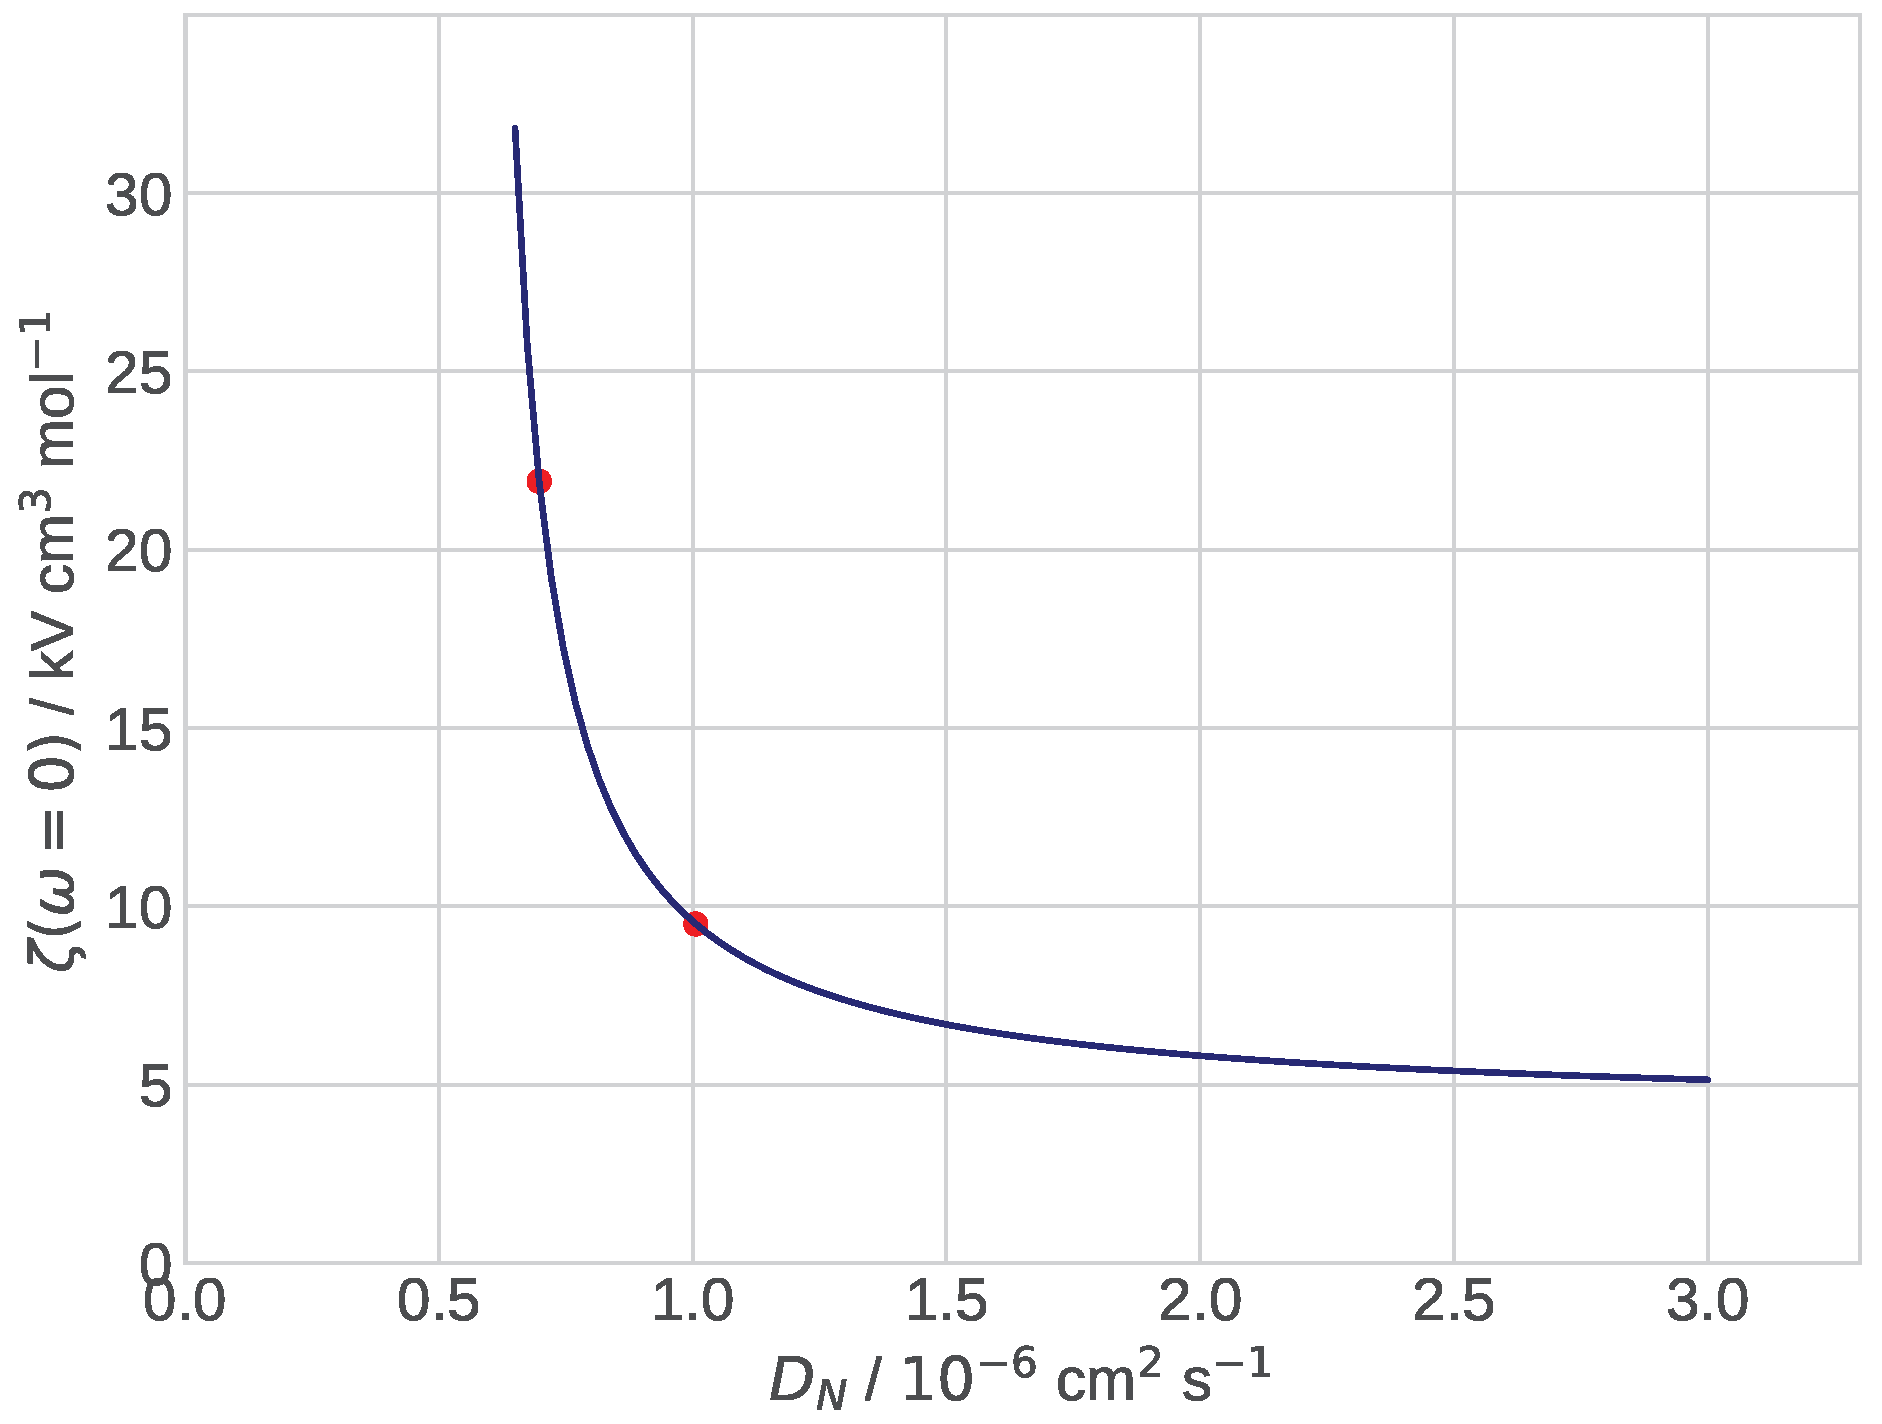
3. Results and Discussion
4. Conclusions
Funding
Institutional Review Board Statement
Informed Consent Statement
Data Availability Statement
Conflicts of Interest
Nomenclature
| Marks dimensionless variables | |
| b | ORR Tafel slope, V |
| Double layer volumetric capacitance, F cm | |
| c | Oxygen molar concentration in the pore, mol cm |
| Static oxygen concentration at | |
| the CCL/GDL interface, mol cm | |
| Oxygen concentration in the channel, mol cm | |
| Oxygen concentration in the Nafion film, mol cm | |
| = | |
| Reference (inlet) oxygen concentration, mol cm | |
| Oxygen diffusion coefficient in the GDL, cm s | |
| Oxygen diffusion coefficient in the pore, cm s | |
| Oxygen diffusion coefficient in the Nafion film, cm s | |
| F | Faraday constant, C mol |
| ORR volumetric exchange current density, A cm | |
| Imaginary unit | |
| j | Local proton current density along the pore, A cm |
| Limiting current density due to oxygen transport in Nafion film, A cm | |
| Characteristic current density of proton transport, A cm, Equation (34) | |
| Cell current density, A cm | |
| Dimensionless Henry’s constant for oxygen solubility in Nafion, mol/mol | |
| GDL thickness, cm | |
| Pore length (CCL thickness), cm | |
| Nafion film thickness, cm | |
| Radial oxygen flux in the Nafion film, mol cm s | |
| q | Auxiliary parameter, Equation (A4) |
| Radius of a Pt/C tube, cm | |
| Pore radius, cm | |
| r | Radial coordinate, cm |
| x | Coordinate along the pore, cm |
| Subscripts: | |
| 0 | Membrane/CCL interface |
| 1 | CCL/GDL interface |
| h | Channel |
| m | Pt/C (metal) surface |
| N | Nafion film |
| p | Pore/Nafion film interface |
| Superscripts: | |
| 0 | Steady-state value |
| 1 | Small-amplitude perturbation |
| lim | Limiting |
| Greek: | |
| = | |
| ORR overpotential, positive by convention, V | |
| Concentration impedance, V cm mol | |
| Auxiliary dimensionless parameter, Equation (18) | |
| Nafion film proton conductivity, S cm | |
| Auxiliary dimensionless parameter, Equation (31) | |
| = , dimensionless frequency | |
| Angular frequency of the AC signal, s |
Appendix A. Coefficients in Equations (29)–(33)
References
- Ono, Y.; Mashio, T.; Takaichi, S.; Ohma, A.; Kanesaka, H.; Shinohara, K. The Analysis of Performance Loss with Low Platinum Loaded Cathode Catalyst Layers. ECS Trans. 2010, 28, 69–78. [Google Scholar] [CrossRef]
- Greszler, T.A.; Caulk, D.; Sinha, P. The Impact of Platinum Loading on Oxygen Transport Resistance. J. Electrochem. Soc. 2012, 159, F831–F840. [Google Scholar] [CrossRef]
- Nonoyama, N.; Okazaki, S.; Weber, A.Z.; Ikogi, Y.; Yoshida, T. Analysis of Oxygen-Transport Diffusion Resistance in Proton-Exchange-Membrane Fuel Cells. J. Electrochem. Soc. 2011, 158, B416–B423. [Google Scholar] [CrossRef]
- Owejan, J.P.; Owejan, J.E.; Gu, W. Impact of Platinum Loading and Catalyst Layer Structure on PEMFC Performance. J. Electrochem. Soc. 2013, 160, F824–F833. [Google Scholar] [CrossRef]
- Weber, A.Z.; Kusoglu, A. Unexplained Transport Resistances for Low–Loaded Fuel–Cell Catalyst Layers. J. Mater. Chem. A 2014, 2, 17207–17211. [Google Scholar] [CrossRef]
- Kongkanand, A.; Mathias, M.F. The Priority and Challenge of High-Power Performance of LowPlatinum Proton-Exchange Membrane Fuel Cells. Phys. Chem. Lett. 2016, 7, 1127–1137. [Google Scholar] [CrossRef]
- Kudo, K.; Jinnouchi, R.; Morimoto, Y. Humidity and Temperature Dependences of Oxygen Transport Resistance of Nafion Thin Film on Platinum Electrode. Electrochim. Acta 2016, 209, 682–690. [Google Scholar] [CrossRef]
- Freiberg, A.T.S.; Tucker, M.C.; Weber, A.Z. Polarization Loss Correction Derived from Hydrogen Local–Resistance Measurement in Low Pt–Loaded Polymer–Electrolyte Fuel Cells. Electrochem. Commun. 2017, 79, 14–17. [Google Scholar] [CrossRef] [Green Version]
- Schuler, T.; Chowdhury, A.; Freiberg, A.T.; Sneed, B.; Spingler, F.B.; Tucker, M.C.; More, K.L.; Radke, C.J.; Weber, A.Z. Fuel-Cell Catalyst-Layer Resistance via Hydrogen Limiting-Current Measurementss. J. Electrochem. Soc. 2019, 166, F3020–F3031. [Google Scholar] [CrossRef] [Green Version]
- Reshetenko, T.; Kulikovsky, A. A Single–Pore Model for Cathode Catalyst Layer Impedance: The Effect of Nafion Film on PEM Fuel Cell Performance. RSC Adv. 2019, 9, 38797–38806. [Google Scholar] [CrossRef] [Green Version]
- Ivers-Tiffée, E.; Weber, A. Evaluation of Electrochemical Impedance Spectra by the Distribution of Relaxation Times. J. Ceram. Soc. Jpn. 2017, 125, 193–201. [Google Scholar] [CrossRef] [Green Version]
- Kulikovsky, A. Impedance and resistivity of low–Pt cathode in a PEM fuel cell. J. Electrochem. Soc. 2021, 168, 044512. [Google Scholar] [CrossRef]
- Niroumand, A.M.; Merida, W.; Eikerling, M.; Saif, M. Pressure–Voltage Oscillations as a Diagnostic Tool for PEFC Cathodes. Electrochem. Commun. 2010, 12, 122–124. [Google Scholar] [CrossRef]
- Engebretsen, E.; Mason, T.J.; Shearing, P.R.; Hinds, G.; Brett, D.J.L. Electrochemical Pressure Impedance Spectroscopy Applied to the Study of Polymer Electrolyte Fuel Cells. Electrochem. Commun. 2017, 75, 60–63. [Google Scholar] [CrossRef]
- Sorrentino, A.; Vidakovic-Koch, T.; Hanke-Rauschenbach, R.; Sundmacher, K. Concentration–Alternating Frequency Response: A New Method for Studying Polymer Electrolyte Membrane Fuel Cell Dynamics. Electrochim. Acta 2017, 243, 53–64. [Google Scholar] [CrossRef] [Green Version]
- Shirsath, A.V.; Rael, S.; Bonnet, C.; Schiffer, L.; Bessler, W.; Lapicque, F. Electrochemical Pressure Impedance Spectroscopy for Investigation of Mass Transfer in Polymer Electrolyte Membrane Fuel Cells. Curr. Opin. Electrochem. 2020, 20, 82–87. [Google Scholar] [CrossRef]
- Kubannek, F.; Krewer, U. Studying the Interaction of Mass Transport and Electrochemical Reaction Kinetics by Species Frequency Response Analysis. J. Electrochem. Soc. 2020, 167, 144510. [Google Scholar] [CrossRef]
- Schiffer, L.; Shirsath, A.V.; Raël, S.; Lapicque, F.; Bessler, W.G. Electrochemical Pressure 190 Impedance Spectroscopy for Polymer Electrolyte Membrane Fuel Cells: A Combined Modeling 191 and Experimental Analysis. J. Electrochem. Soc. 2021, 169, 034503. [Google Scholar] [CrossRef]
- Kulikovsky, A. Analytical Model for PEM Fuel Cell Concentration Impedance. J. Electroanal. Chem. 2021, 899, 115672. [Google Scholar] [CrossRef]
- Kulikovsky, A. The Effect of Nafion Film on the Cathode Catalyst Layer Performance in a Low–Pt PEM Fuel Cell. Electrochem. Commun. 2019, 103, 61–65. [Google Scholar] [CrossRef]


| Tafel slope b, V | 0.03 |
| Exchange current density , A cm | |
| Double layer capacitance , F cm | 20 |
| Oxygen diffusion coefficient in | |
| the Nafion film, , cm s | ≃ |
| Dimensionless Henry’s constant for | |
| O solubility in water at 80 C, | 6.76 × |
| Catalyst layer thickness , cm | (3 m) |
| Nafion film thickness , cm | (10 nm) |
| Pore radius | (30 nm) |
| Cell current density , A cm | 1.5 |
| Pressure | Standard |
| Cell temperature T, K | 273 + 80 |
Publisher’s Note: MDPI stays neutral with regard to jurisdictional claims in published maps and institutional affiliations. |
© 2022 by the author. Licensee MDPI, Basel, Switzerland. This article is an open access article distributed under the terms and conditions of the Creative Commons Attribution (CC BY) license (https://creativecommons.org/licenses/by/4.0/).
Share and Cite
Kulikovsky, A. Analytical Model for Concentration (Pressure) Impedance of a Low-Pt PEM Fuel Cell Oxygen Electrode. Membranes 2022, 12, 356. https://doi.org/10.3390/membranes12040356
Kulikovsky A. Analytical Model for Concentration (Pressure) Impedance of a Low-Pt PEM Fuel Cell Oxygen Electrode. Membranes. 2022; 12(4):356. https://doi.org/10.3390/membranes12040356
Chicago/Turabian StyleKulikovsky, Andrei. 2022. "Analytical Model for Concentration (Pressure) Impedance of a Low-Pt PEM Fuel Cell Oxygen Electrode" Membranes 12, no. 4: 356. https://doi.org/10.3390/membranes12040356