
Investigation of Pretreatment of Textile Wastewater for Membrane Processes and Reuse for Washing Dyeing Machines


Abstract
: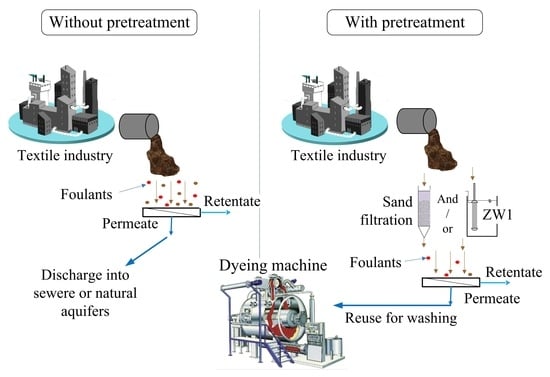
1. Introduction
2. Materials and Methods
2.1. Sampling and Analytical Methods
2.2. Lab Scale Experimental Procedures
3. Results
3.1. Characterization of Textile Wastewater
3.2. Removal of Pollutants in the Examined Pretreatments
3.2.1. Sand Filtration
3.2.2. Coagulation
3.2.3. Coagulation/Flocculation
3.2.4. UF Hollow Fiber ZW1
3.3. Effects of SF and ZW1 Effluents on 5 and 50 kDa Membranes Treatment
3.4. Effect of Pretreatment on the UF Flat Sheet Membrane Flux
3.5. Selecting the Best Pretreatment
3.6. Possibility of Reusing TWW in Washing Dyeing Machines
4. Conclusions
Supplementary Materials
Author Contributions
Funding
Institutional Review Board Statement
Informed Consent Statement
Data Availability Statement
Conflicts of Interest
References
- Li, K.; Jiang, C.; Wang, J.; Wei, Y. The color removal and fate of organic pollutants in a pilot-scale MBR-NF combined process treating textile wastewater with high water recovery. Water Sci. Technol. 2016, 73, 1426–1433. [Google Scholar] [CrossRef] [PubMed] [Green Version]
- Wang, L.; Ding, X.; Wu, X. Blue and grey water footprint of textile industry in China. Water Sci. Technol. 2013, 68, 2485–2491. [Google Scholar] [CrossRef] [PubMed]
- Raja, A.; Arputharaj, A.; Saxena, S.; Patil, P. Water requirement and sustainability of textile processing industries. In Water in Textiles and Fashion; Woodhead Publishing: Duxford, UK, 2019; pp. 155–173. [Google Scholar]
- Cinperi, N.C.; Ozturk, E.; Yigit, N.O.; Kitis, M. Treatment of woolen textile wastewater using membrane bioreactor, nanofiltration and reverse osmosis for reuse in production processes. J. Clean. Prod. 2019, 223, 837–848. [Google Scholar] [CrossRef]
- Töre, G.Y.; Ata, R.; Çelik, S.Ö.; Sesler, Ş.K. Colour Removal from Biologically Treated Textile Dyeing Wastewater with Natural and Novel Pre-Hydrolysed Coagulants. J. Turk. Chem. Soc. Sect. A Chem. 2017, 5, 23–36. [Google Scholar] [CrossRef]
- Ağtaş, M.; Yılmaz, Ö.; Dilaver, M.; Alp, K.; Koyuncu, I. Hot water recovery and reuse in textile sector with pilot scale ceramic ultrafiltration/nanofiltration membrane system. J. Clean. Prod. 2020, 256, 120359. [Google Scholar] [CrossRef]
- Balcik-Canbolat, C.; Sengezer, C.; Sakar, H.; Karagunduz, A.; Keskinler, B. Recovery of real dye bath wastewater using integrated membrane process: Considering water recovery, membrane fouling and reuse potential of membranes. Environ. Technol. 2017, 38, 2668–2676. [Google Scholar] [CrossRef]
- Liang, C.-Z.; Sun, S.-P.; Li, F.-Y.; Ong, Y.-K.; Chung, T.-S. Treatment of highly concentrated wastewater containing multiple synthetic dyes by a combined process of coagulation/flocculation and nanofiltration. J. Membr. Sci. 2014, 469, 306–315. [Google Scholar] [CrossRef]
- Karisma, D.; Febrianto, G.; Mangindaan, D. Polyetherimide thin film composite (PEI-TFC) membranes for nanofiltration treatment of dyes wastewater. In Proceedings of the IOP Conference series: Earth and environmental science, Banda Aceh, Indonesia, 26–27 September 2018; p. 012057. [Google Scholar]
- Lafi, R.; Gzara, L.; Lajimi, R.H.; Hafiane, A. Treatment of textile wastewater by a hybrid ultrafiltration/electrodialysis process. Chem. Eng. Processing Process. Intensif. 2018, 132, 105–113. [Google Scholar] [CrossRef]
- Buscio, V.; Crespi, M.; Gutiérrez-Bouzán, C. Application of PVDF ultrafiltration membranes to treat and reuse textile wastewater. Desalin. Water Treat. 2016, 57, 8090–8096. [Google Scholar] [CrossRef] [Green Version]
- Unlu, M.; Yukseler, H.; Yetis, U. Indigo dyeing wastewater reclamation by membrane-based filtration and coagulation processes. Desalination 2009, 240, 178–185. [Google Scholar] [CrossRef]
- Manholer, D.D.; de Souza, M.T.F.; Ambrosio, E.; Freitas, T.K.F.d.S.; Geraldino, H.C.L.; Garcia, J.C. Coagulation/flocculation of textile effluent using a natural coagulant extracted from Dillenia indica. Water Sci. Technol. 2019, 80, 979–988. [Google Scholar] [CrossRef] [PubMed]
- Ouattara, J.-M.P.; Tchéhué, P.O.; Coulibaly, L.; Savané, I. Pretreatment of textile industry effluents with a perforated intermittent sand filter. Int. J. Innov. Sci. Res. 2016, 27, 303–311. [Google Scholar]
- Buscio, V.; Marín, M.J.; Crespi, M.; Gutiérrez-Bouzán, C. Reuse of textile wastewater after homogenization–decantation treatment coupled to PVDF ultrafiltration membranes. Chem. Eng. J. 2015, 265, 122–128. [Google Scholar] [CrossRef] [Green Version]
- Ribeiro, M.C.M.; Starling, M.C.V.; Leão, M.M.D.; de Amorim, C.C. Textile wastewater reuse after additional treatment by Fenton’s reagent. Environ. Sci. Pollut. Res. 2017, 24, 6165–6175. [Google Scholar] [CrossRef]
- Shaikh, M.A. Water conservation in textile industry. Pak. Text. J. 2009, 58, 48–51. [Google Scholar]
- Rosa, J.M.; Fileti, A.M.; Tambourgi, E.B.; Santana, J.C. Dyeing of cotton with reactive dyestuffs: The continuous reuse of textile wastewater effluent treated by Ultraviolet/Hydrogen peroxide homogeneous photocatalysis. J. Clean. Prod. 2015, 90, 60–65. [Google Scholar] [CrossRef]
- Leal, T.W.; Lourenco, L.A.; Scheibe, A.S.; de Souza, S.M.G.U.; de Souza, A.A.U. Textile wastewater treatment using low-cost adsorbent aiming the water reuse in dyeing process. J. Environ. Chem. Eng. 2018, 6, 2705–2712. [Google Scholar] [CrossRef]
- Rice, E.; Baird, R.; Eaton, A.; Clesceri, L. Standard Methods Fort he Examination of Water and Wastewater. Part 2012, 2540, 2–66. [Google Scholar]
- Korenak, J.; Ploder, J.; Trček, J.; Hélix-Nielsen, C.; Petrinic, I. Decolourisations and biodegradations of model azo dye solutions using a sequence batch reactor, followed by ultrafiltration. Int. J. Environ. Sci. Technol. 2018, 15, 483–492. [Google Scholar] [CrossRef] [Green Version]
- Dolar, D.; Racar, M.; Košutić, K. Municipal wastewater reclamation and water reuse for irrigation by membrane processes. Chem. Biochem. Eng. Q. 2019, 33, 417–425. [Google Scholar] [CrossRef]
- Racar, M.; Obajdin, K.; Dolar, D.; Košutić, K. Pretreatment for the reclamation of rendering plant secondary effluent with NF/RO: UF flat sheet versus UF hollow fiber membranes. Clean Technol. Environ. Policy 2020, 22, 399–408. [Google Scholar] [CrossRef]
- Yaseen, D.; Scholz, M. Textile dye wastewater characteristics and constituents of synthetic effluents: A critical review. Int. J. Environ. Sci. Technol. 2019, 16, 1193–1226. [Google Scholar] [CrossRef] [Green Version]
- Thomas, O.; Burgess, C. UV-Visible Spectrophotometry of Water and Wastewater; Elsevier: Amsterdam, The Netherlands, 2017. [Google Scholar]
- Hussain, J.; Hussain, I.; Arif, M. Characterization of textile wastewater. J. Ind. Pollut. Control 2004, 20, 137–144. [Google Scholar]
- Kaetzl, K.; Lübken, M.; Nettmann, E.; Krimmler, S.; Wichern, M. Slow sand filtration of raw wastewater using biochar as an alternative filtration media. Sci. Rep. 2020, 10, 1229. [Google Scholar] [CrossRef] [PubMed] [Green Version]
- Lindroos, A.-J.; Lindholm-Lehto, P.; Pulkkinen, J.; Kiuru, T.; Vielma, J. The Effect of Filtration with Natural Esker Sand on the Removal of Organic Carbon and Suspended Solids from the Effluent of Experimental Recirculating Aquaculture Systems. Water Air Soil Pollut. 2020, 231, 209. [Google Scholar] [CrossRef]
- Verma, S.; Daverey, A.; Sharma, A. Slow sand filtration for water and wastewater treatment–a review. Environ. Technol. Rev. 2017, 6, 47–58. [Google Scholar] [CrossRef]
- Naghan, D.J.; Motevalli, M.D.; Mirzaei, N.; Javid, A.; Ghaffari, H.R.; Ahmadpour, M.; Moradi, M.; Sharafi, K. Efficiency comparison of alum and ferric chloride coagulants in removal of dye and organic material from industrial wastewater-a case study. Bulg. Chem. Commun. 2015, 47, 206–210. [Google Scholar]
- Dalvand, A.; Ehrampoush, M.H.; Ghaneian, M.T.; Mokhtari, M.; Ebrahimi, A.A.; Malek Ahmadi, R.; Mahvi, A.H. Application of chemical coagulation process for direct dye removal from textile wastewater. J. Environ. Health Sustain. Dev. 2017, 2, 333–339. [Google Scholar]
- Lara, P.; Rodríguez, D.; Peñuela, G. Application of coagulation by sweep for removal of metals in natural water used in dairy cattle. Afinidad 2016, 73, 576. [Google Scholar]
- Riera-Torres, M.; Gutiérrez-Bouzán, C.; Crespi, M. Combination of coagulation–flocculation and nanofiltration techniques for dye removal and water reuse in textile effluents. Desalination 2010, 252, 53–59. [Google Scholar] [CrossRef]
- Han, G.; Feng, Y.; Chung, T.-S.; Weber, M.; Maletzko, C. Phase inversion directly induced tight ultrafiltration (UF) hollow fiber membranes for effective removal of textile dyes. Environ. Sci. Technol. 2017, 51, 14254–14261. [Google Scholar] [CrossRef] [PubMed]
- Woerner, D.L. Membrane technology in textile operations. In Koch Membrane Systems; Springer: Wilmington, MA, USA, 2003. [Google Scholar]
- Choo, K.-H.; Choi, S.-J.; Hwang, E.-D. Effect of coagulant types on textile wastewater reclamation in a combined coagulation/ultrafiltration system. Desalination 2007, 202, 262–270. [Google Scholar] [CrossRef]
- Alardhi, S.M.; Alrubaye, J.M.; Albayati, T.M. Hollow fiber ultrafiltration membrane for methyl green dye removal. Eng. Technol. J. 2020, 38, 1077–1083. [Google Scholar] [CrossRef]
- Sherhan, B.Y.; Abbas, A.D.; Alsalhy, Q.F.; Rashad, A.A.; Rashad, Z.W.; Shawkat, A.A.; Abbas, T.K.; Kareem, N.A.A. Produced water treatment using ultrafiltration and nanofiltration membranes. Al Khwarizmi Eng. J. 2016, 12, 10–18. [Google Scholar]
- Ćurić, I.; Dolar, D.; Karadakić, K. Textile wastewater reusability in knitted fabric washing process using UF membrane technology. J. Clean. Prod. 2021, 299, 126899. [Google Scholar] [CrossRef]
- Malik, S.N.; Ghosh, P.C.; Vaidya, A.N.; Waindeskar, V.; Das, S.; Mudliar, S.N. Comparison of coagulation, ozone and ferrate treatment processes for color, COD and toxicity removal from complex textile wastewater. Water Sci. Technol. 2017, 76, 1001–1010. [Google Scholar] [CrossRef]


| Membrane | Material | Maximum Working Pressure/Bar | pH Range | Typical Flux/Pressure LMH/Bar | MWCO/kDa |
|---|---|---|---|---|---|
| PT | PES/PSf 1 | 10 | 1–11 | 153/3.45 | 5 |
| MW | PAN 2 | 7 | 2–9 | 299/1.32 | 50 |
| Parameter | Sample | SF-PT | SF-MW | ZW1-PT | ZW1-MW | |
|---|---|---|---|---|---|---|
| Turbidity (NTU) | Influent | 90.1 | 61.9 | 3.57 | 23.2 | |
| Effluent | 0.85 | 1.55 | 3.38 | 3.19 | ||
| TOC (mg L−1) | Influent | 195.8 | 266.9 | 311.0 | 157.8 | |
| Effluent | 19.5 | 192 | 18.2 | 71.3 | ||
| Color (SAC) | 436 nm (m−1) | Influent | 160 | 103 | 35 | 36 |
| Effluent | 4 | 8 | 19 | 13 | ||
| 525 nm (m−1) | Influent | 106 | 64 | 24 | 16 | |
| Effluent | 2 | 3 | 5 | 7 | ||
| 620 nm (m−1) | Influent | 76 | 48 | 18 | 5 | |
| Effluent | 1 | 1 | 3 | 1 | ||
| PT Peak Position (cm−1) | Probable Functional Group | MW Peak Position (cm−1) | Probable Functional Group |
|---|---|---|---|
| 3500 | 1. N-H2 asymmetric stretching vibration of free NH2 2. O-H stretching vibration of single bridged compound | 3367 | 1. O-H stretching vibration of single bridged compound 2. N-H2 asymmetric stretching vibration of free NH2 |
| 3303 | 1. O-H stretching vibration of single bridged compound 2. N-H2 asymmetric stretching vibration of free NH2 | 2859 | 1. O-H stretching vibration of single bridged compound 2. N-H2 asymmetric stretching vibration of free NH2 |
| 2948 | 1. C-H asymmetric and symmetric stretching of alkane | 2304 | 1. N-H2 asymmetric stretching of NH2 salt |
| 2918 | 2. C-H asymmetric and symmetric stretching of alkane | 806 | 1. N-H strong and broad stretching of primary and secondary amines 2. C-H strong stretching of aromatics 3. C-Cl medium stretching of alkyl halides |
| - | - | 714 | 4. C-H rock medium stretching of alkanes |
| Parameter | Drinking Water | Permeate ZW1-PT |
|---|---|---|
| pH | 6.7 | 8.2 |
| Total hardness (mg L−1 CaCO3) | 214 | 67.7 |
| Conductivity (µS cm−1) | 545.0 | 1925 |
| Magnesium (mg L−1) | 7 | 5.87 |
| Calcium (mg L−1) | 64 | 17.5 |
Publisher’s Note: MDPI stays neutral with regard to jurisdictional claims in published maps and institutional affiliations. |
© 2022 by the authors. Licensee MDPI, Basel, Switzerland. This article is an open access article distributed under the terms and conditions of the Creative Commons Attribution (CC BY) license (https://creativecommons.org/licenses/by/4.0/).
Share and Cite
Ćurić, I.; Dolar, D. Investigation of Pretreatment of Textile Wastewater for Membrane Processes and Reuse for Washing Dyeing Machines. Membranes 2022, 12, 449. https://doi.org/10.3390/membranes12050449
Ćurić I, Dolar D. Investigation of Pretreatment of Textile Wastewater for Membrane Processes and Reuse for Washing Dyeing Machines. Membranes. 2022; 12(5):449. https://doi.org/10.3390/membranes12050449
Chicago/Turabian StyleĆurić, Iva, and Davor Dolar. 2022. "Investigation of Pretreatment of Textile Wastewater for Membrane Processes and Reuse for Washing Dyeing Machines" Membranes 12, no. 5: 449. https://doi.org/10.3390/membranes12050449