
Apple Juice, Manure and Whey Concentration with Forward Osmosis Using Electrospun Supported Thin-Film Composite Membranes


Abstract
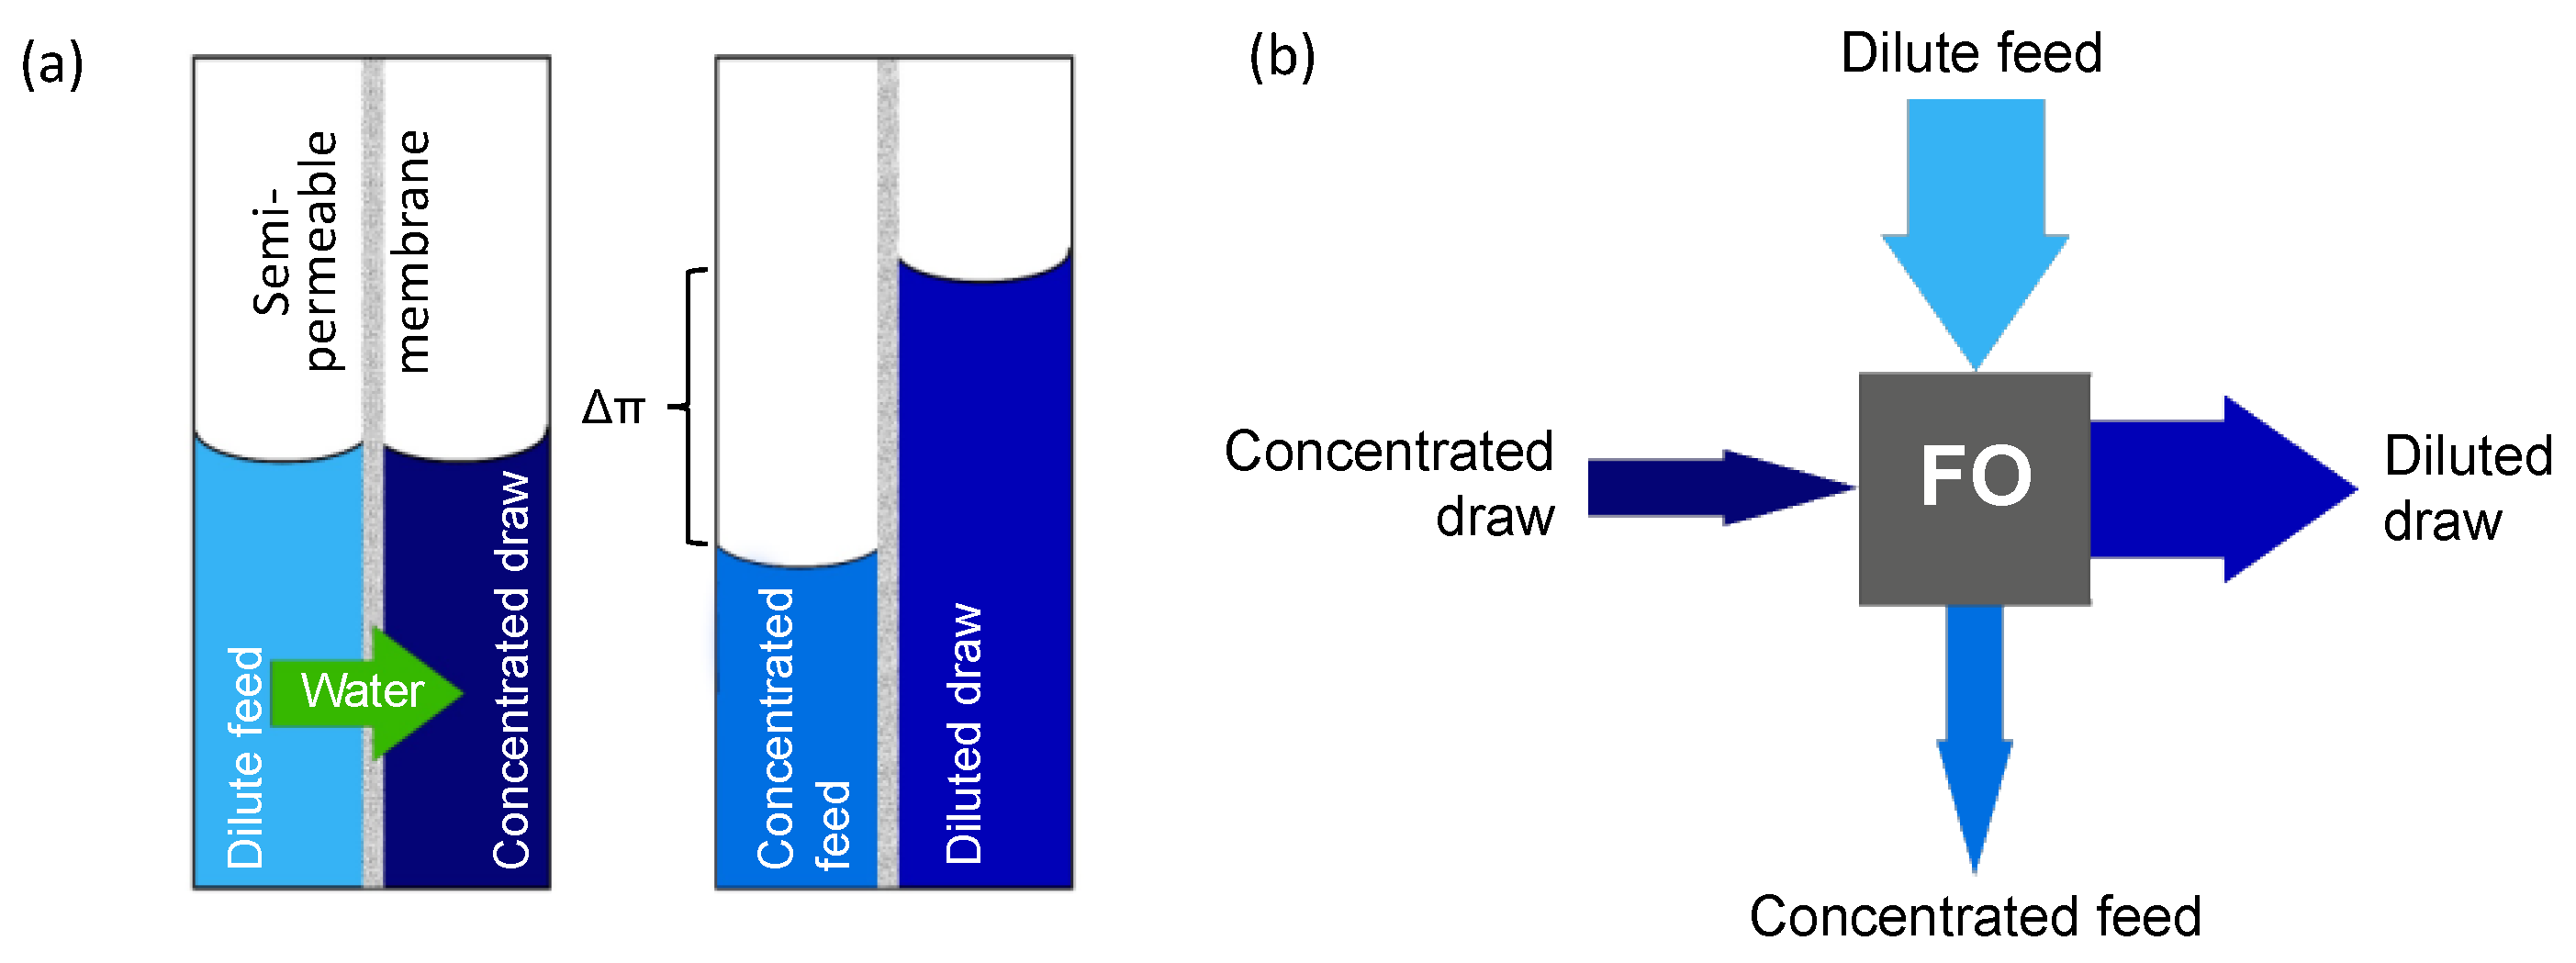
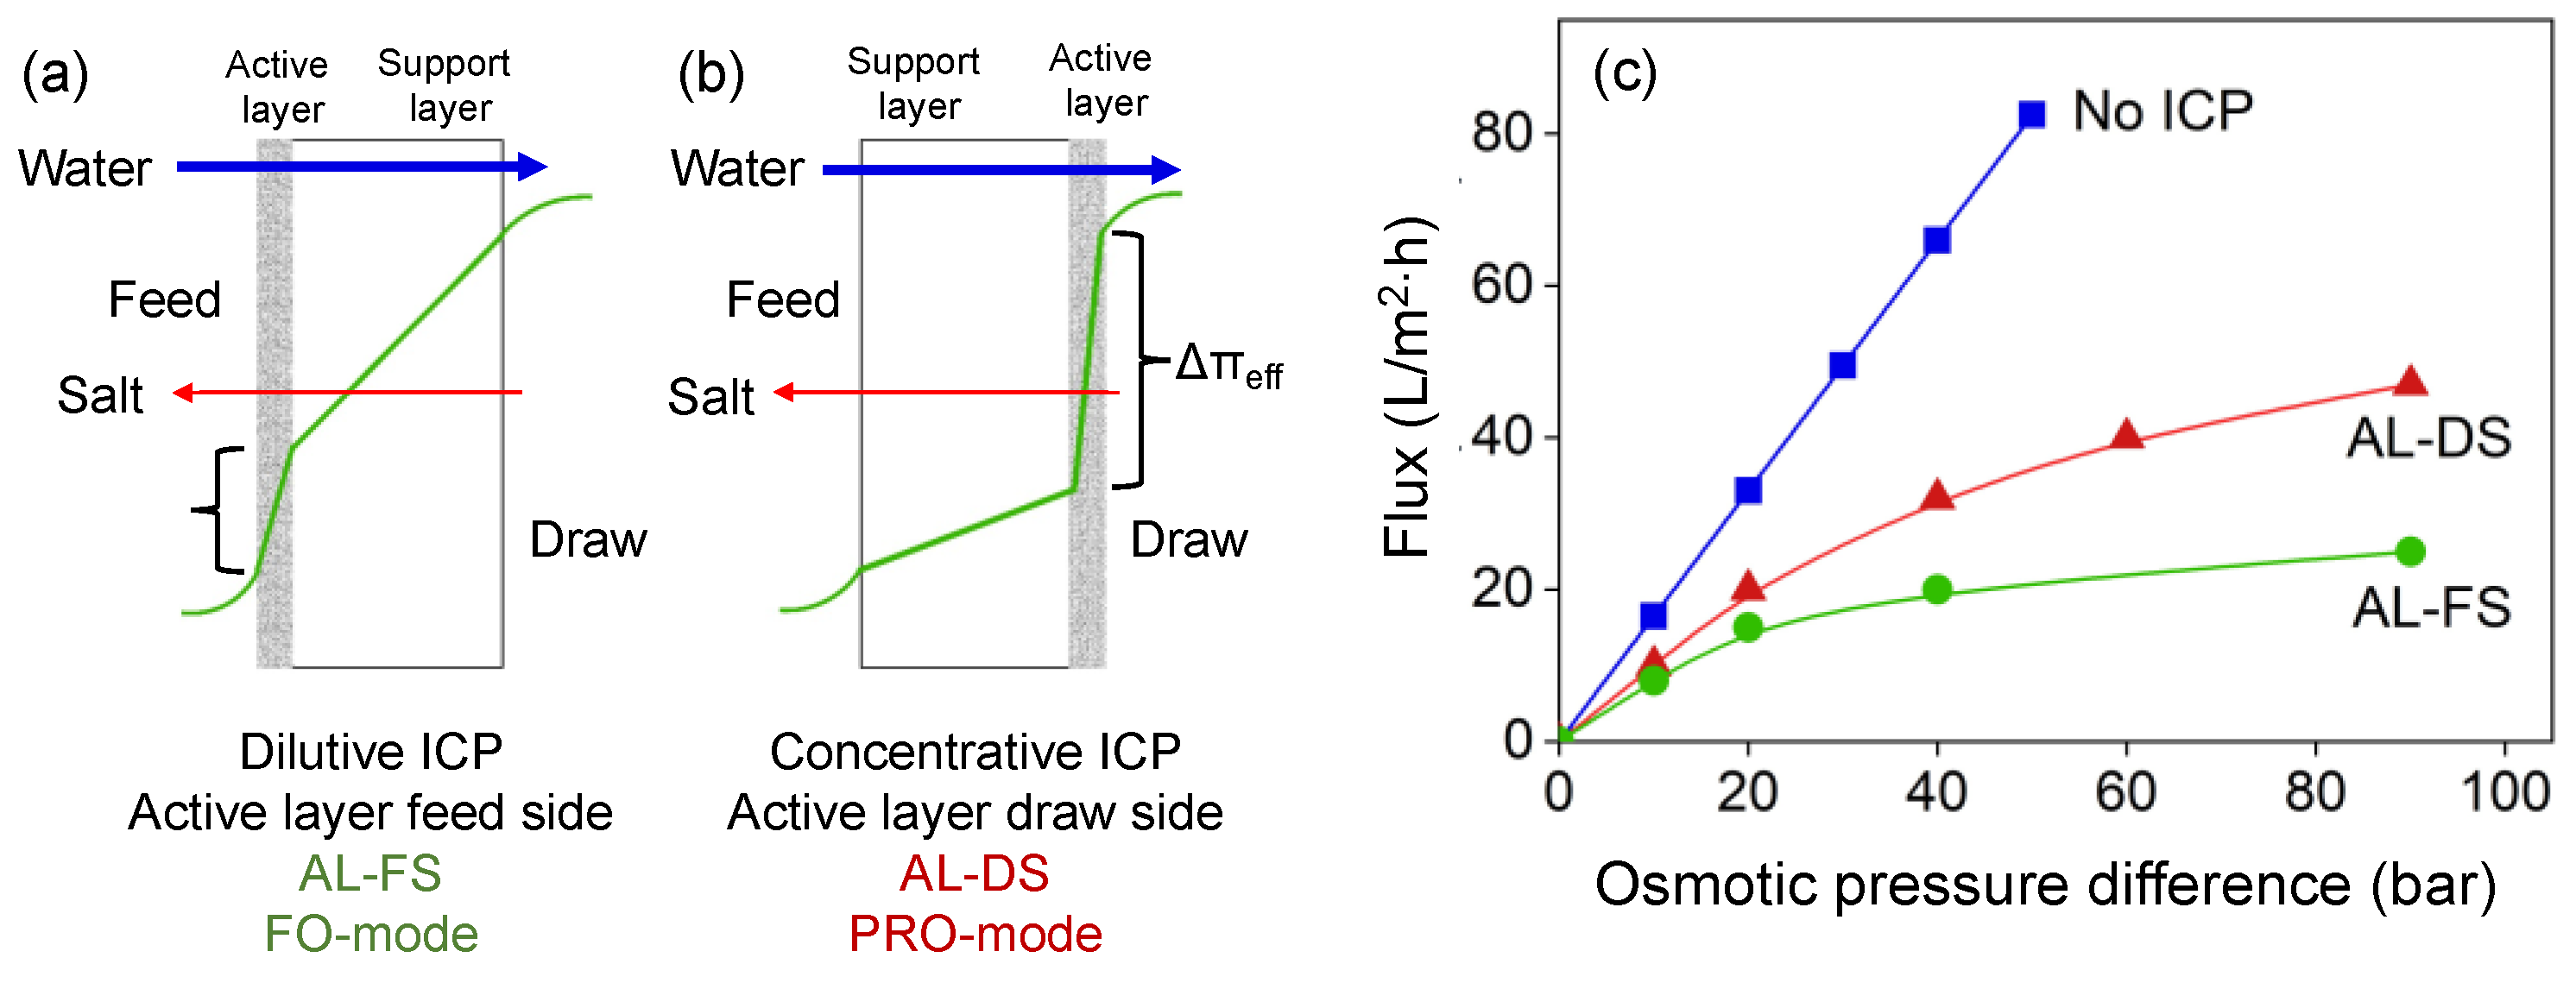
:1. Introduction
2. Experimental Section
2.1. Materials
2.2. Membrane Preparation
2.2.1. Electrospinning of the Support Membrane
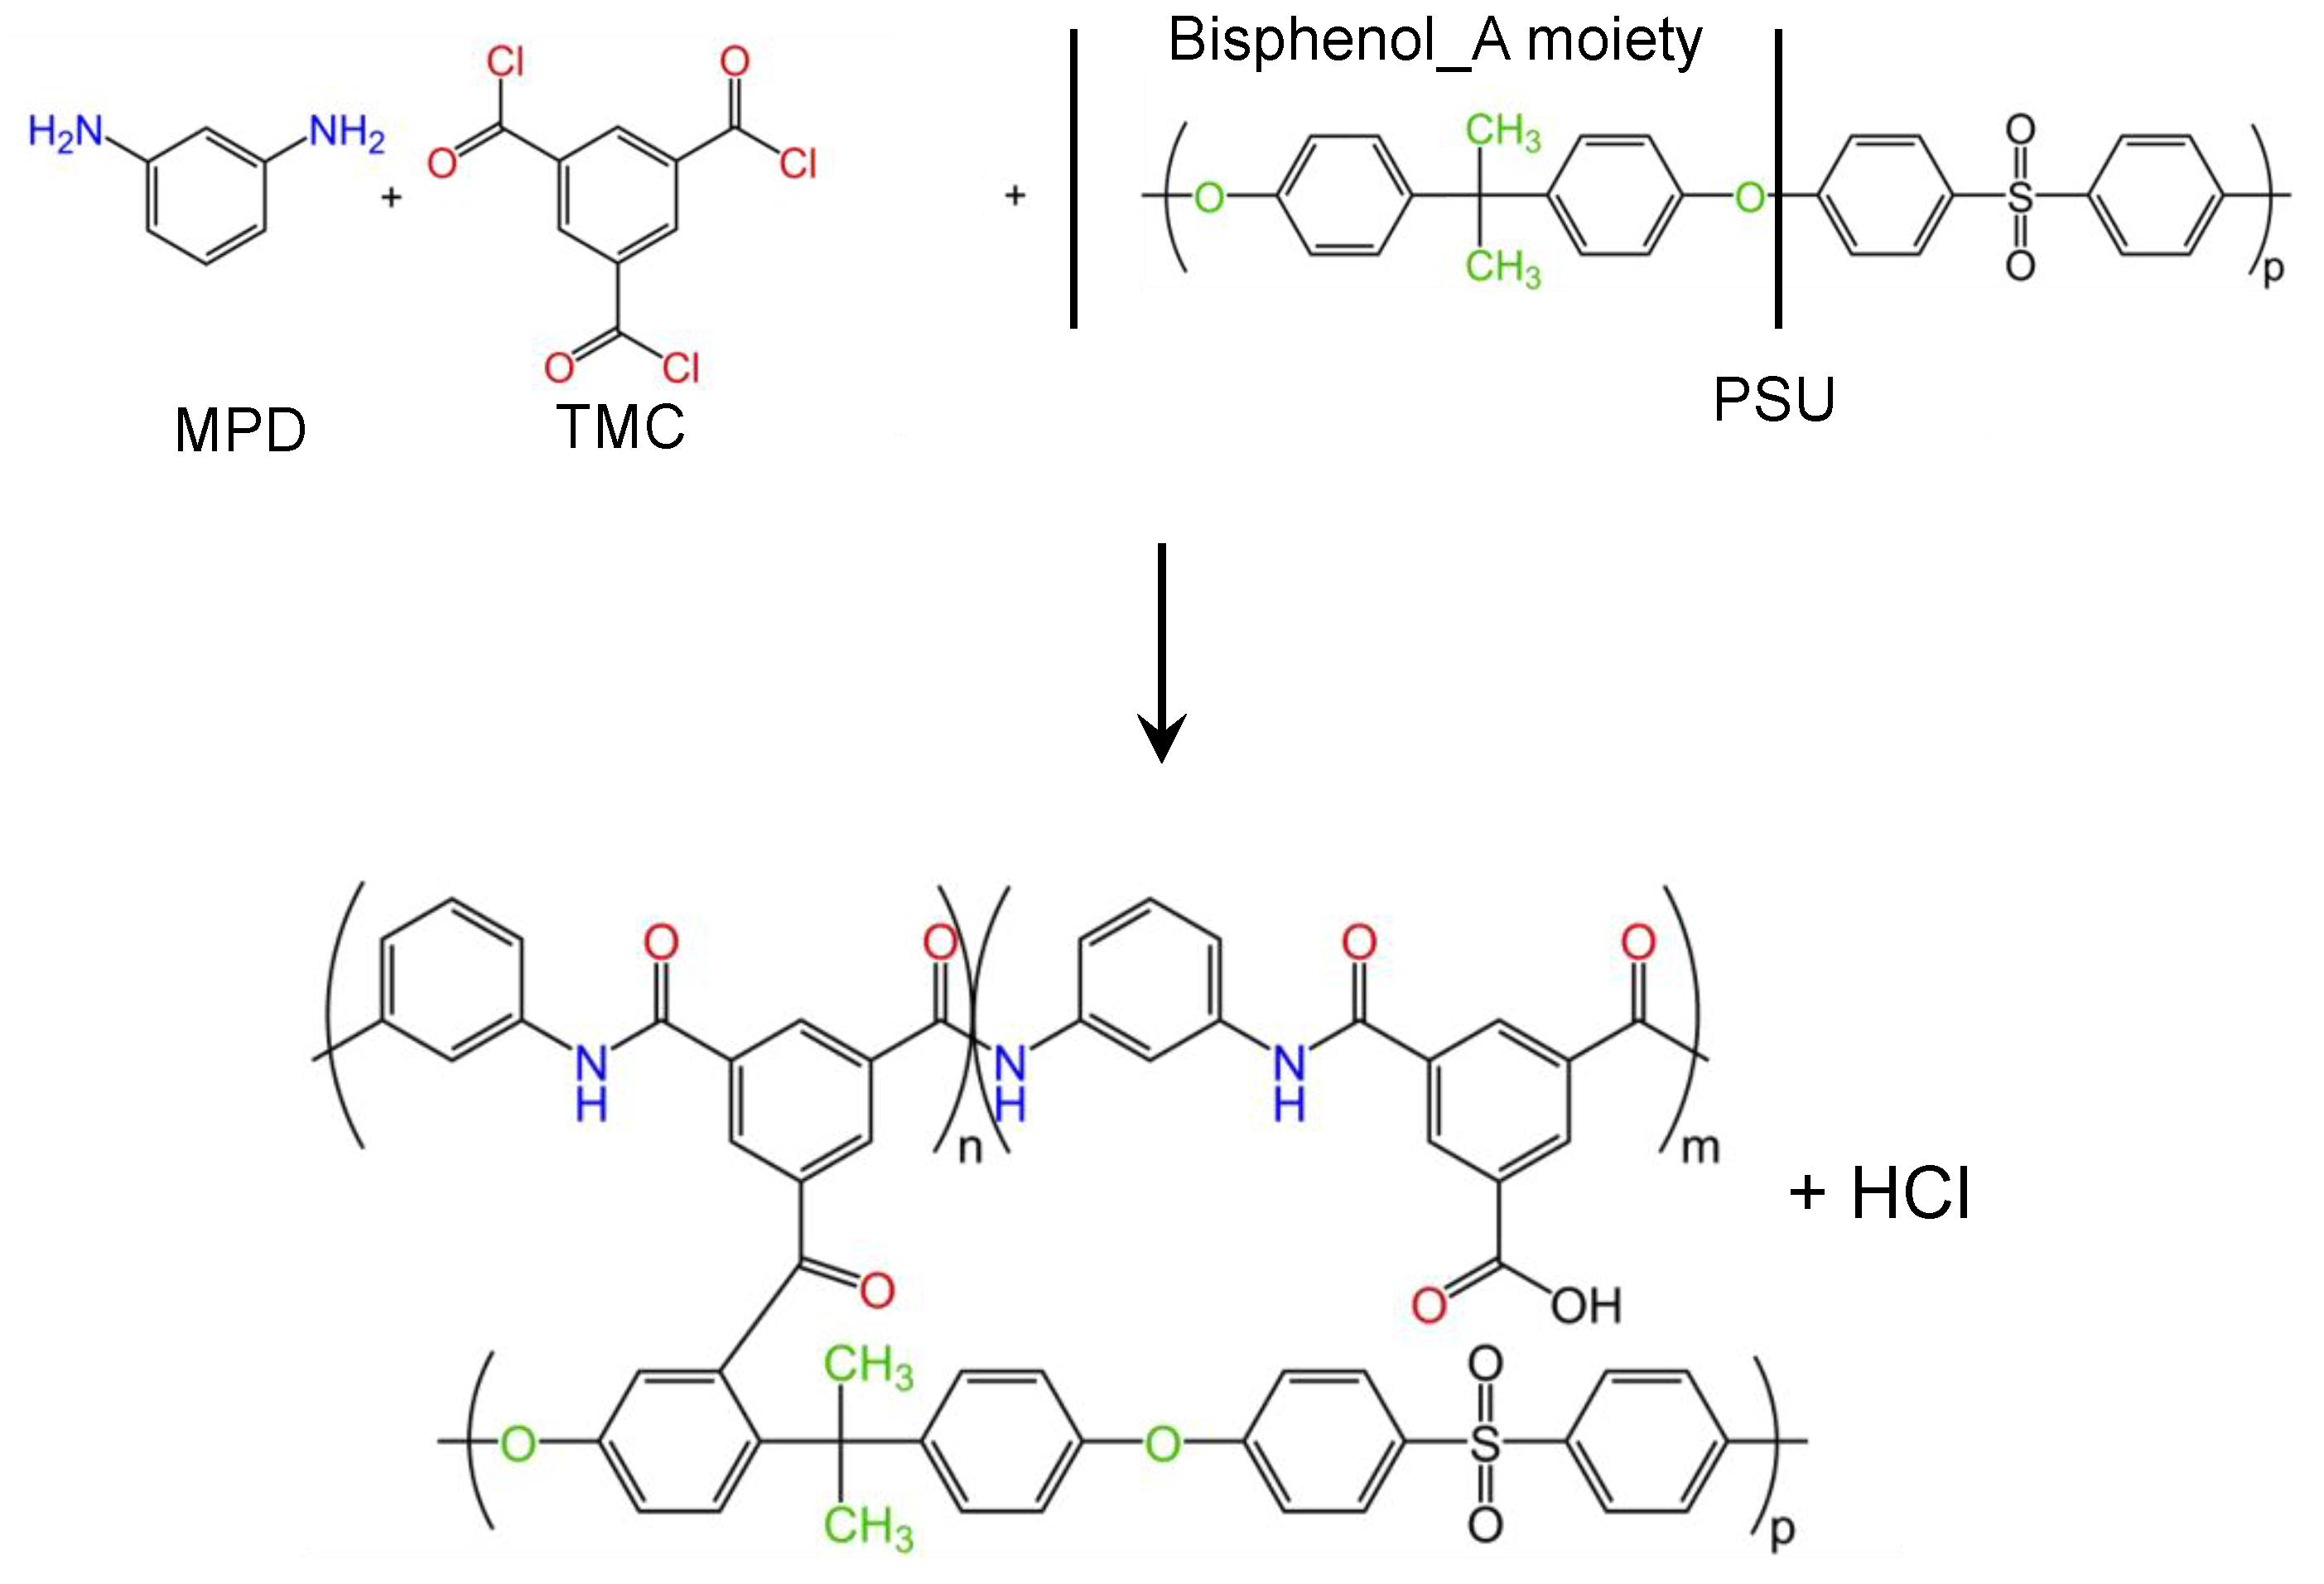
2.2.2. Polyamide Coating of the Electrospun Support Membrane
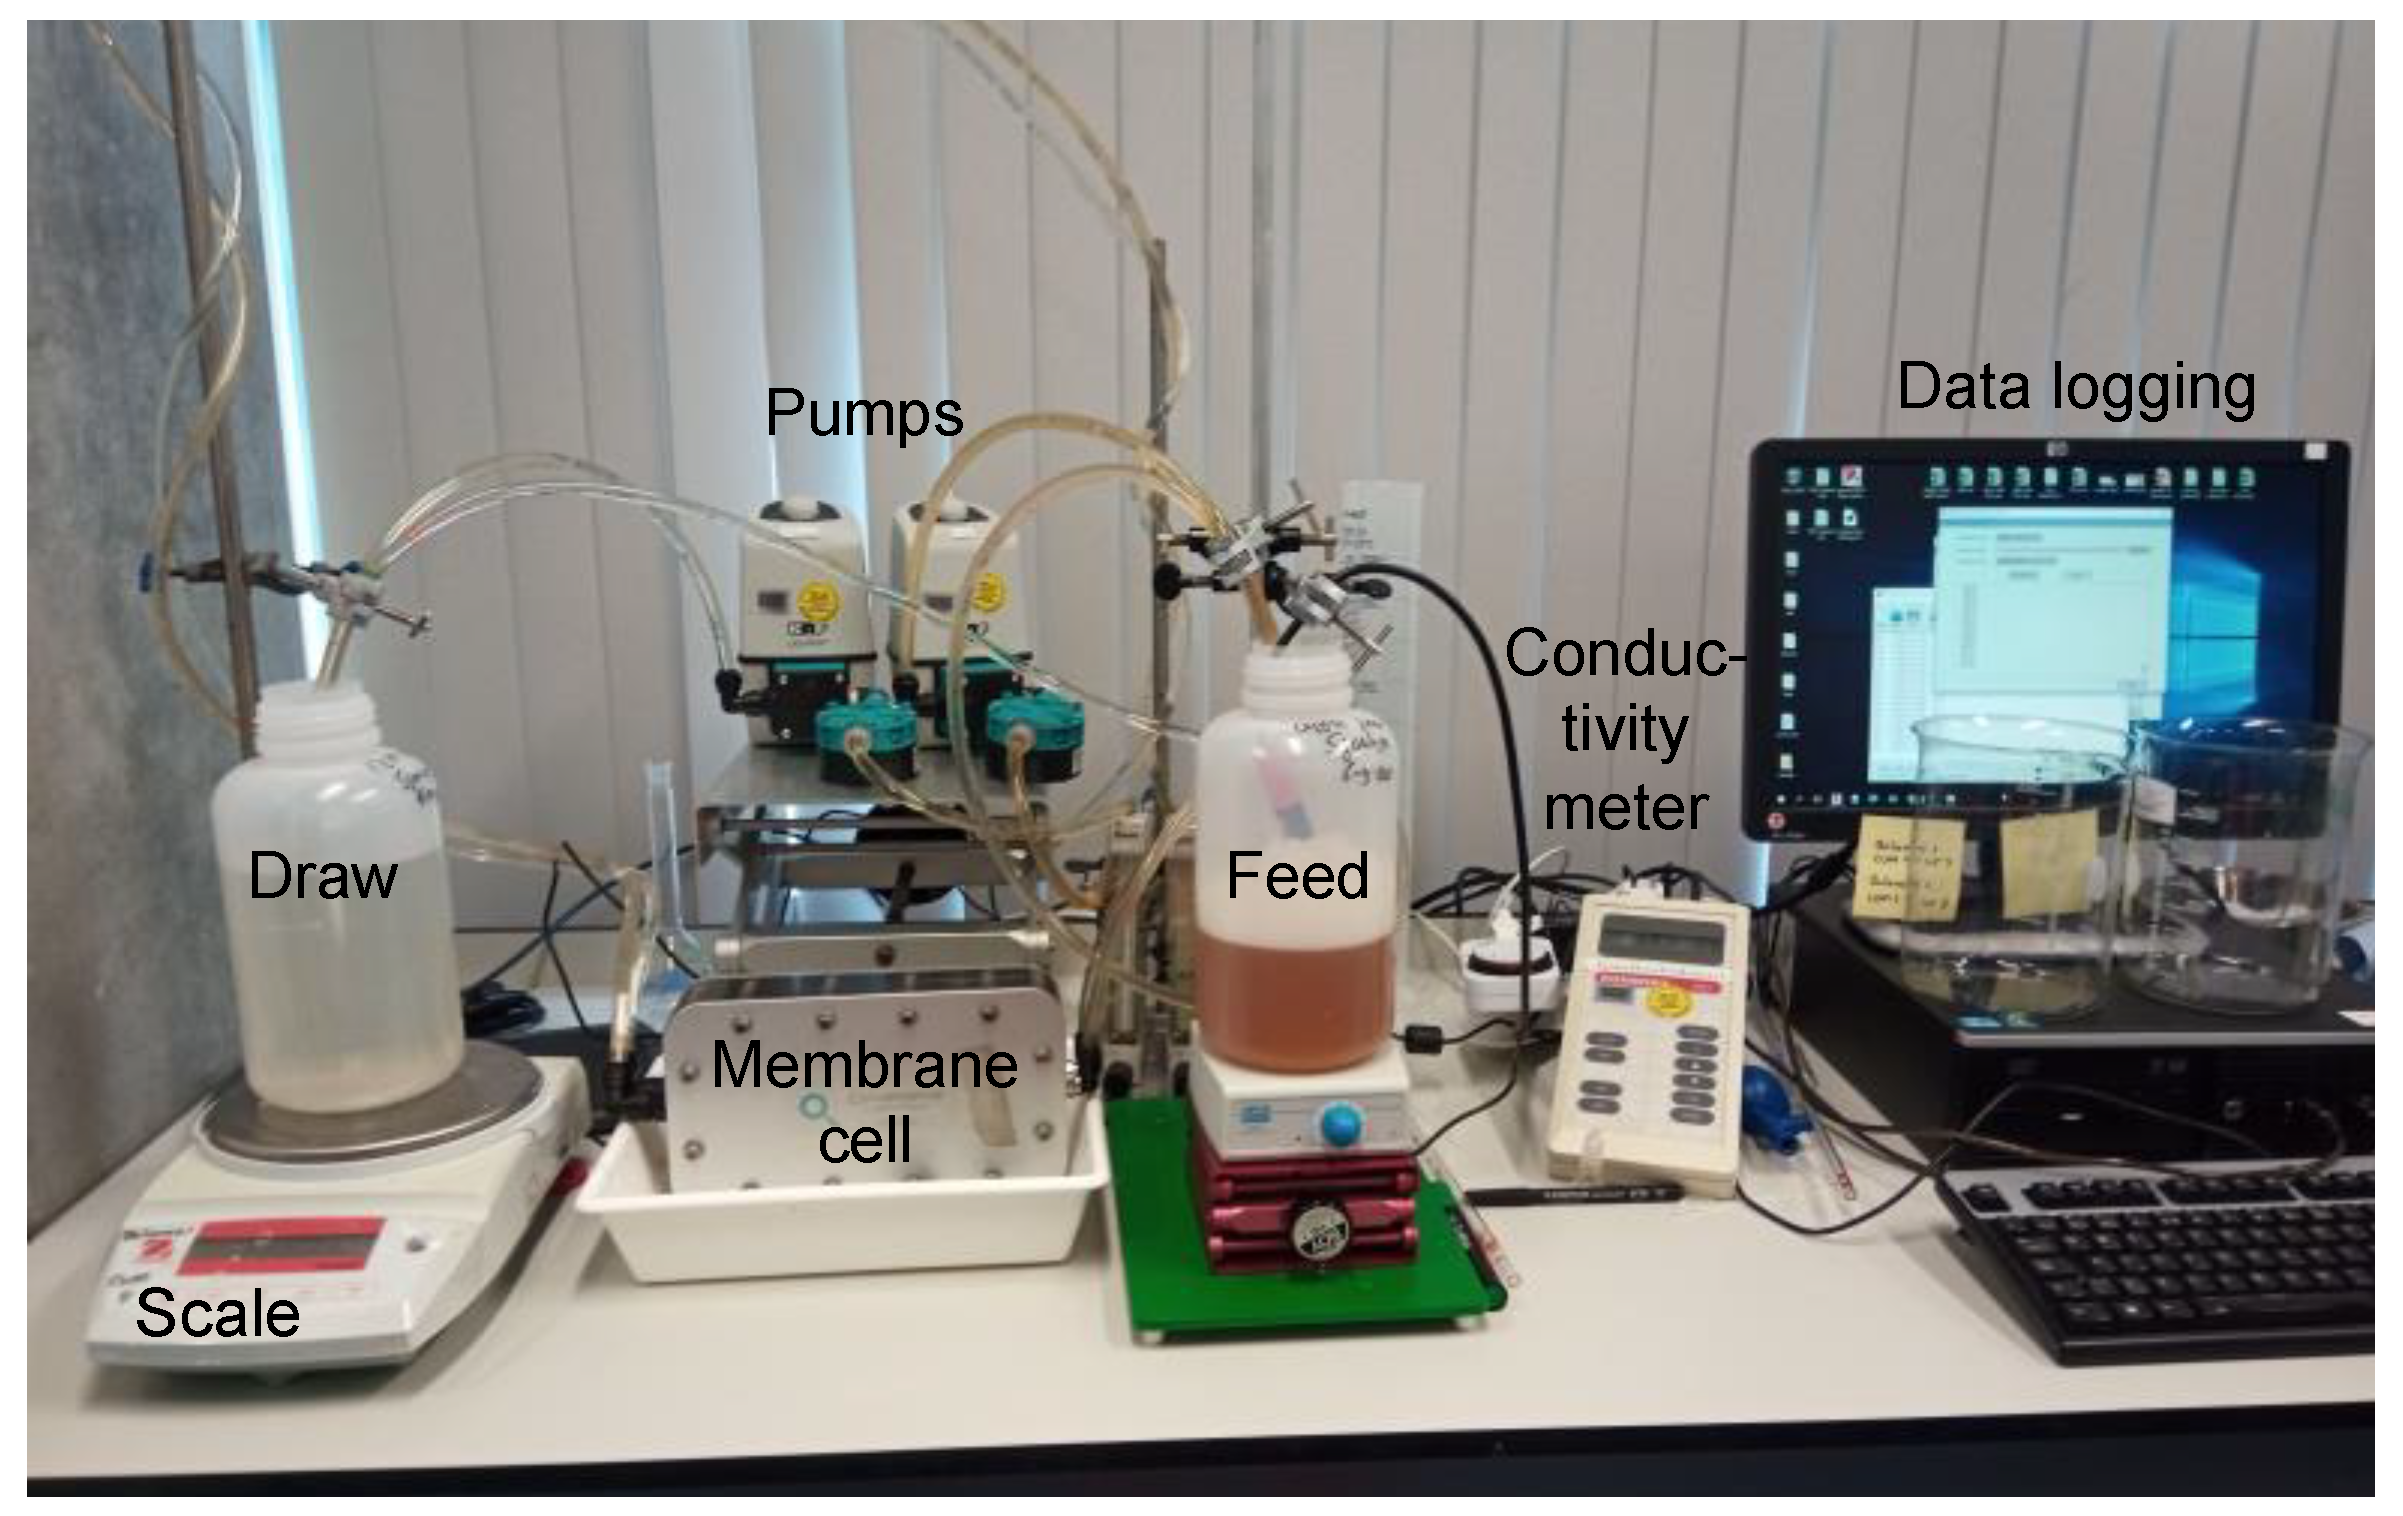
2.3. Forward Osmosis Performance
2.4. Sample Characterization
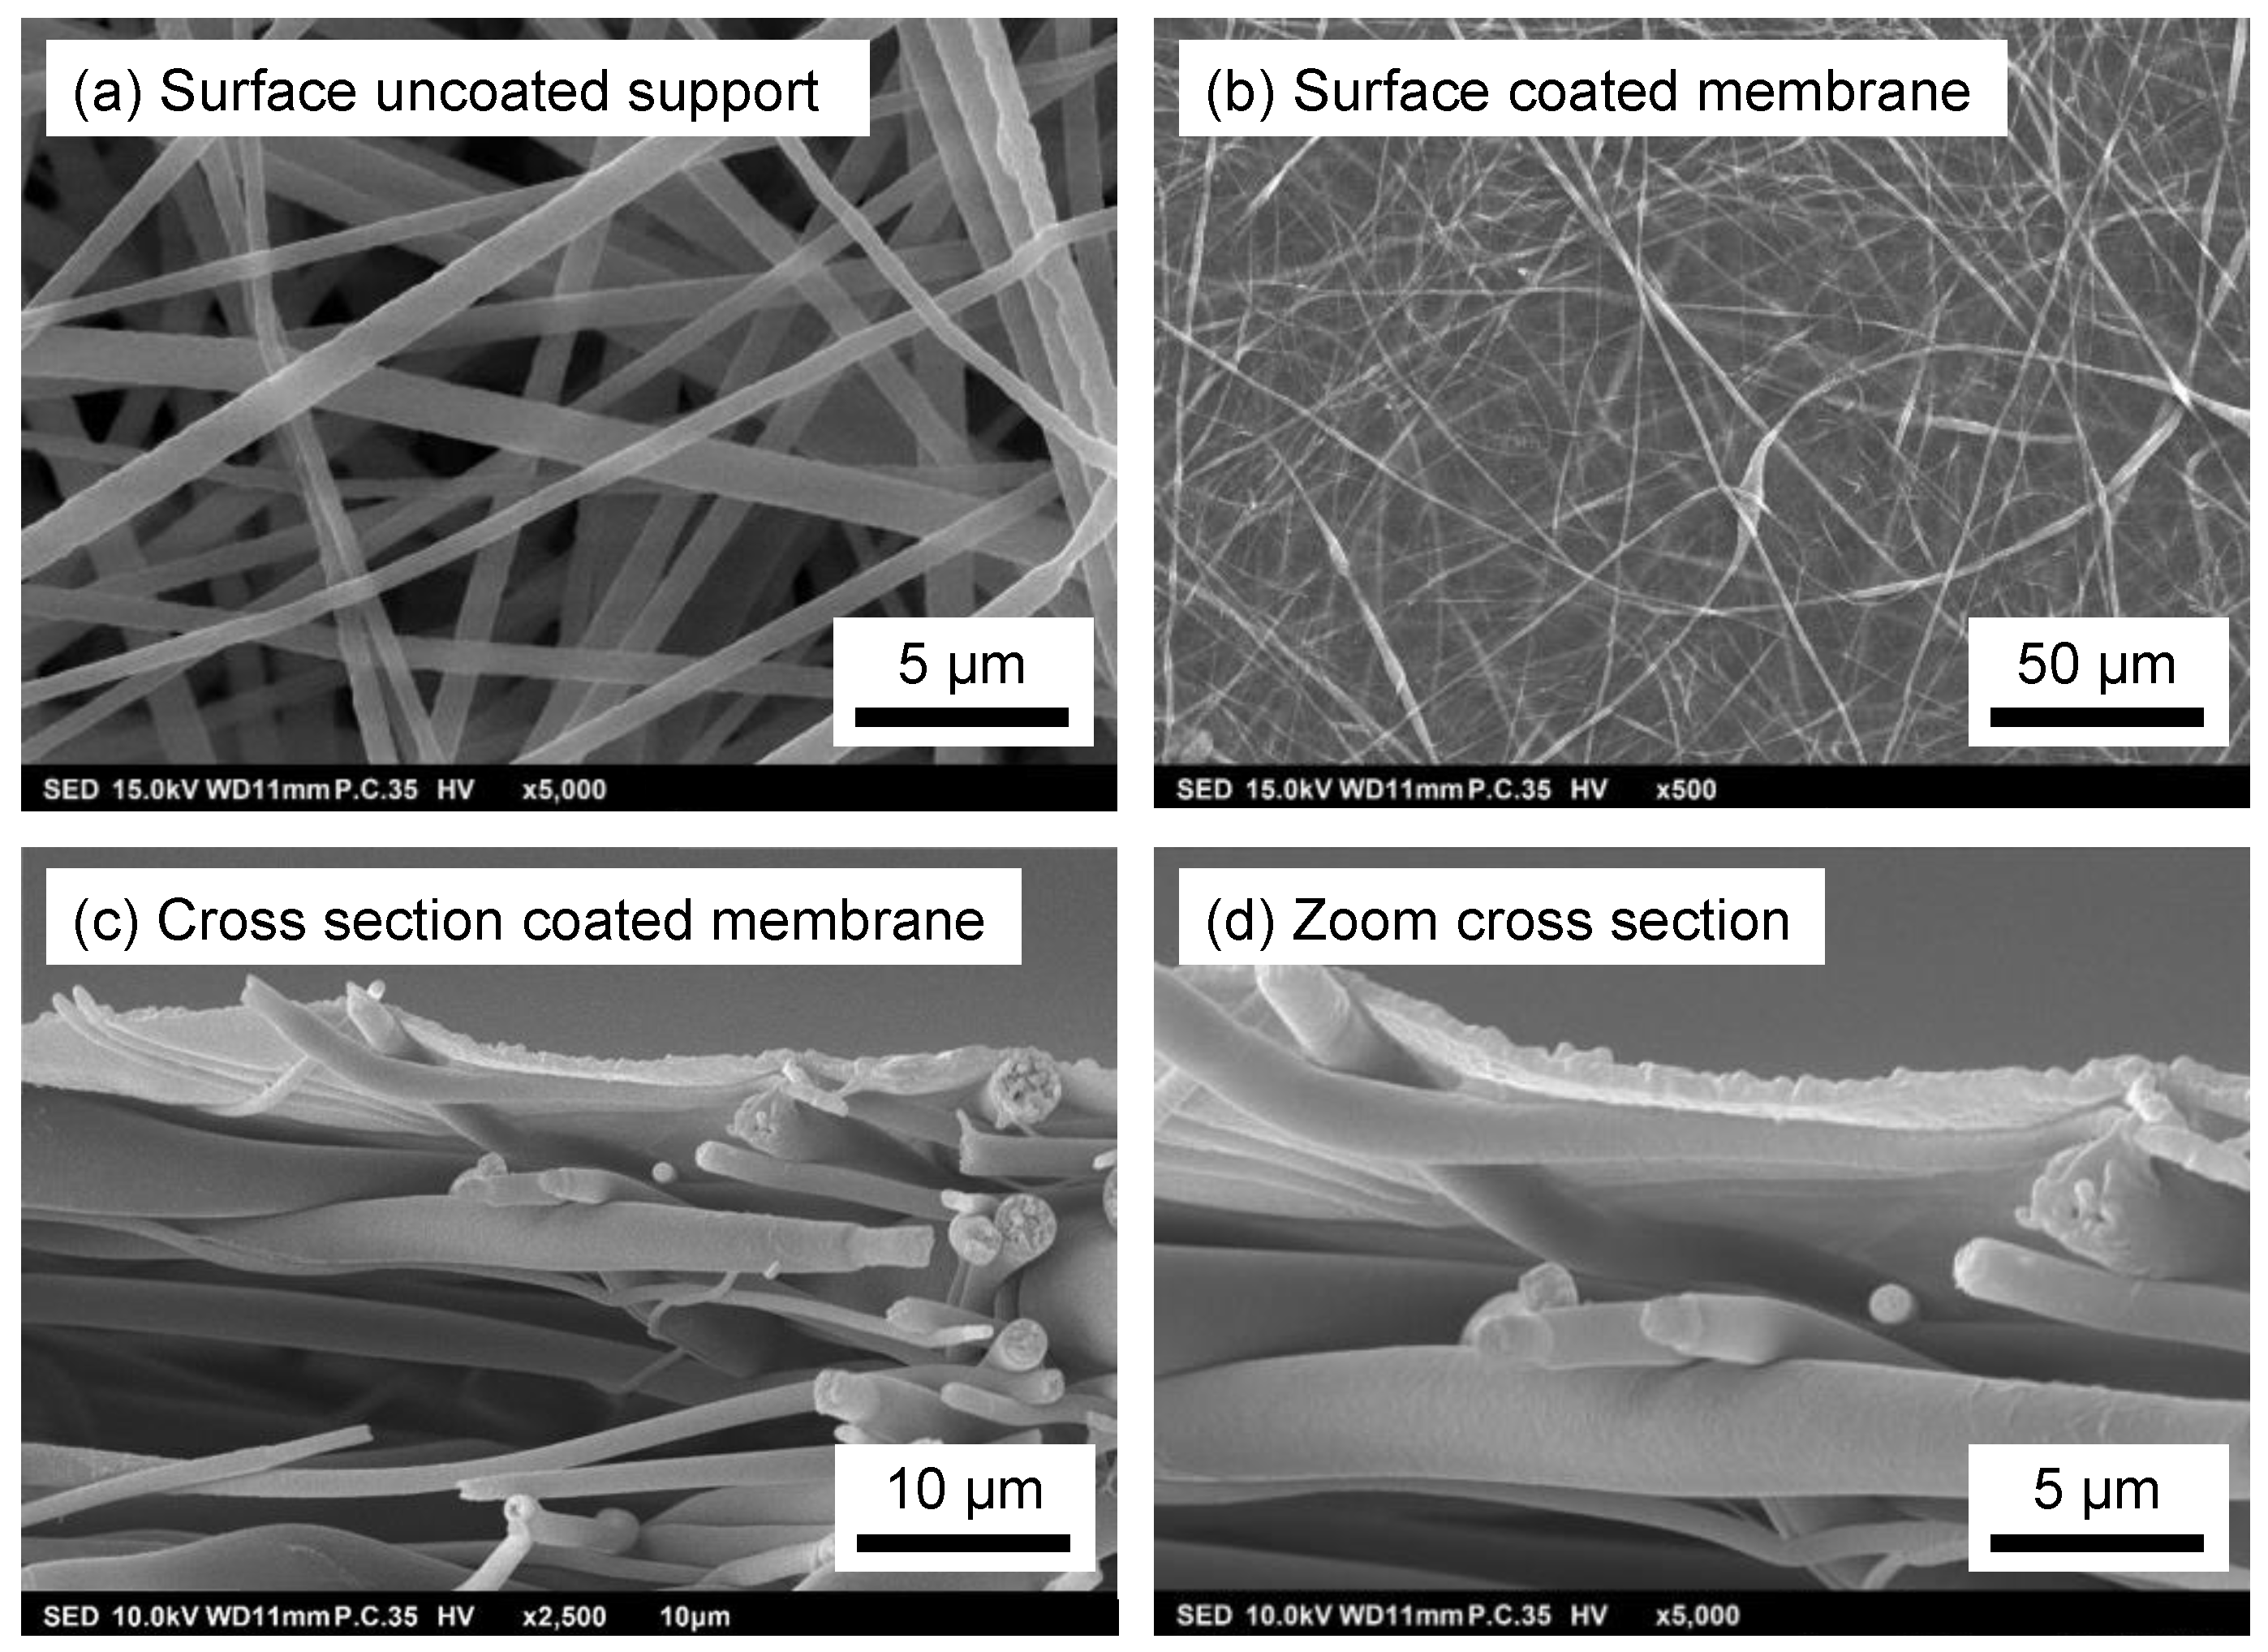
2.4.1. Scanning Electron Microscopy (SEM)
2.4.2. Total Organic Carbon (TOC) Measurement
2.4.3. Atomic Absorption Spectroscopy (AAS)
2.4.4. Ultraviolet–Visible Spectroscopy (UV–Vis)
3. Results and Discussion
3.1. Membrane Preparation
3.2. Ideal Membrane Performance Using Clean Water

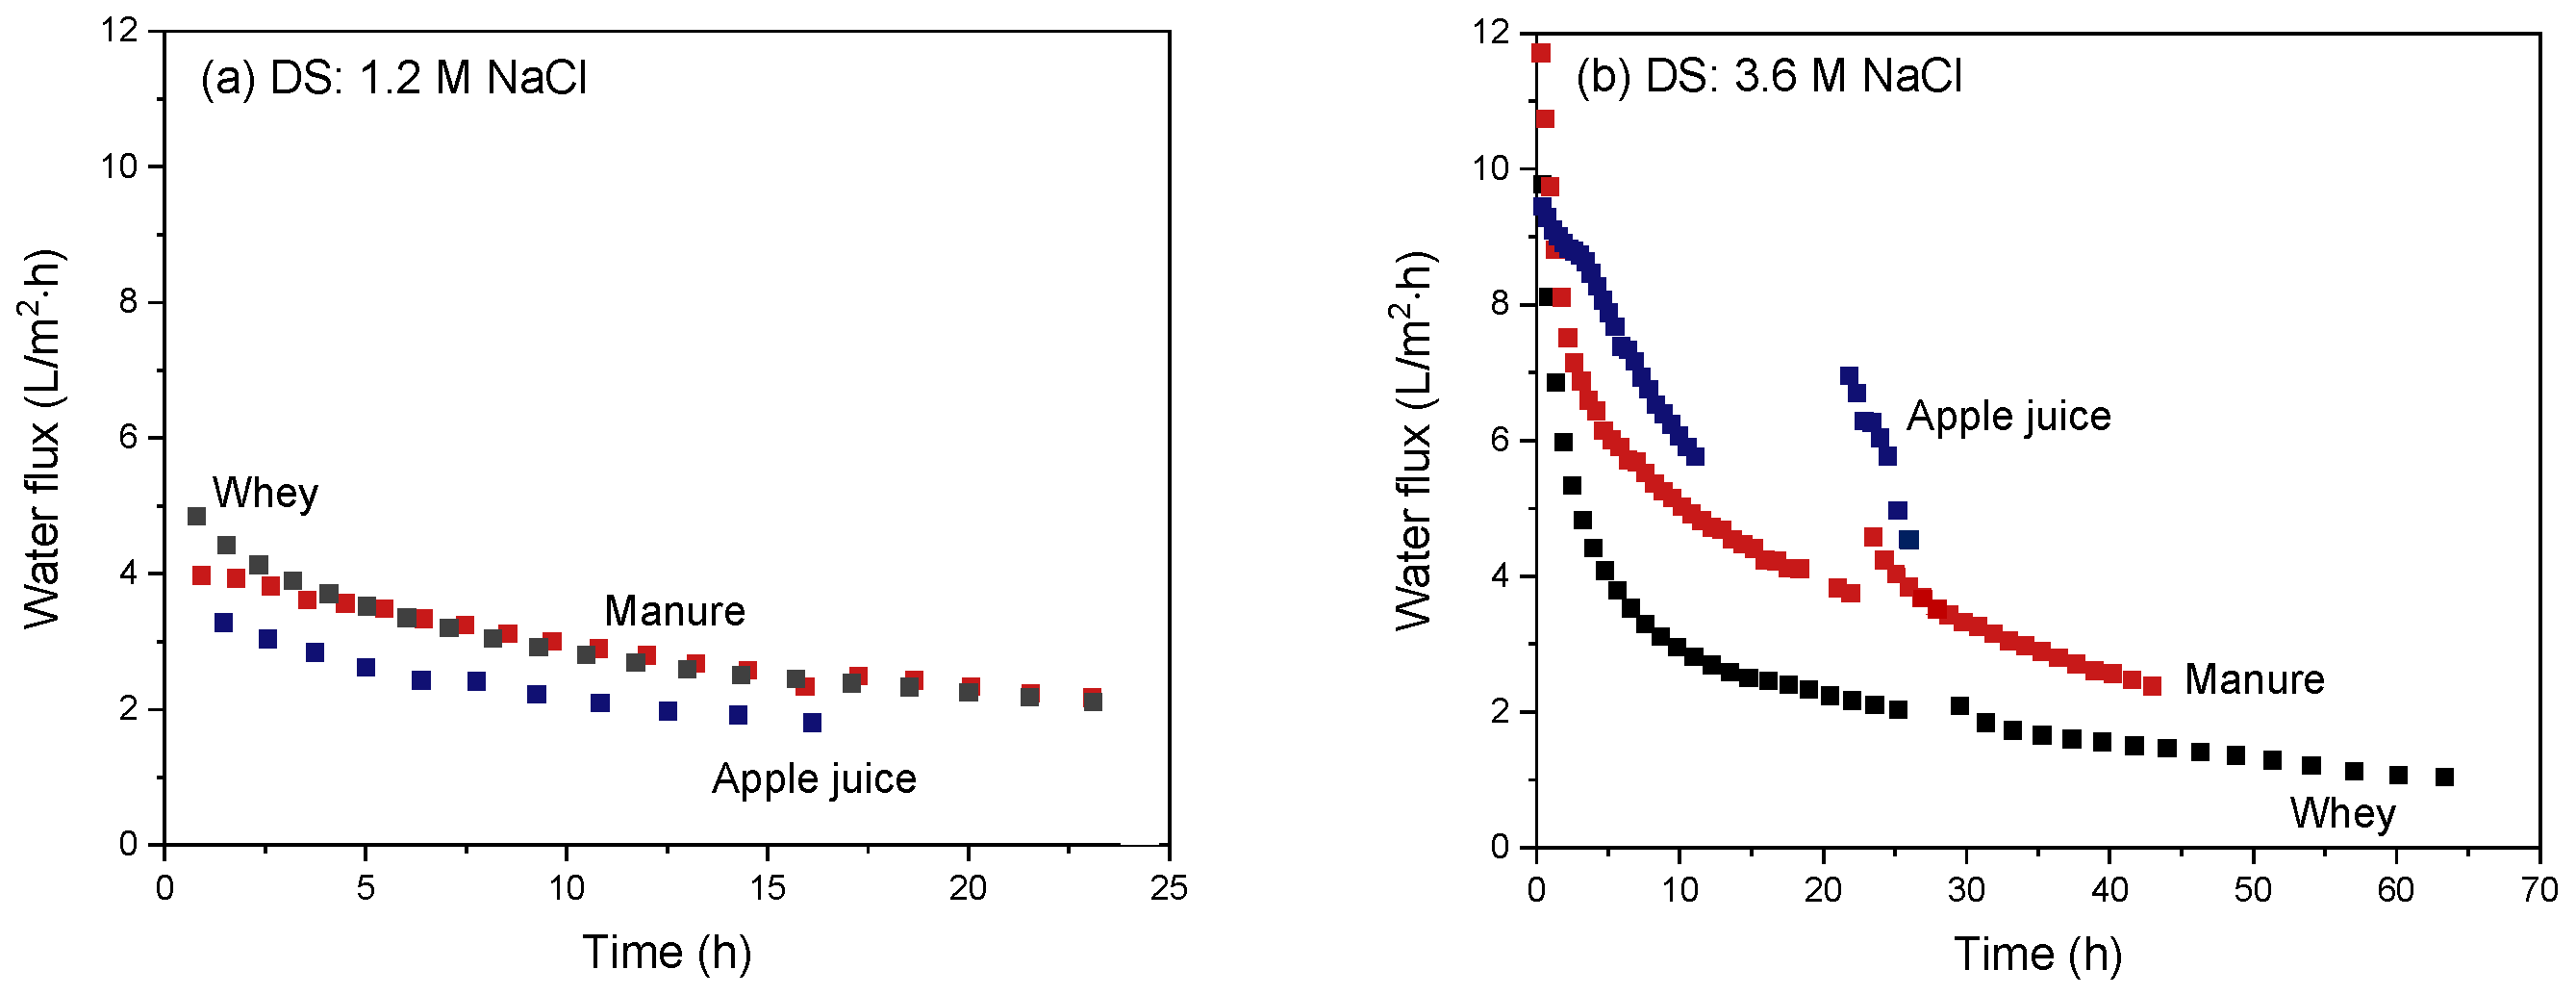
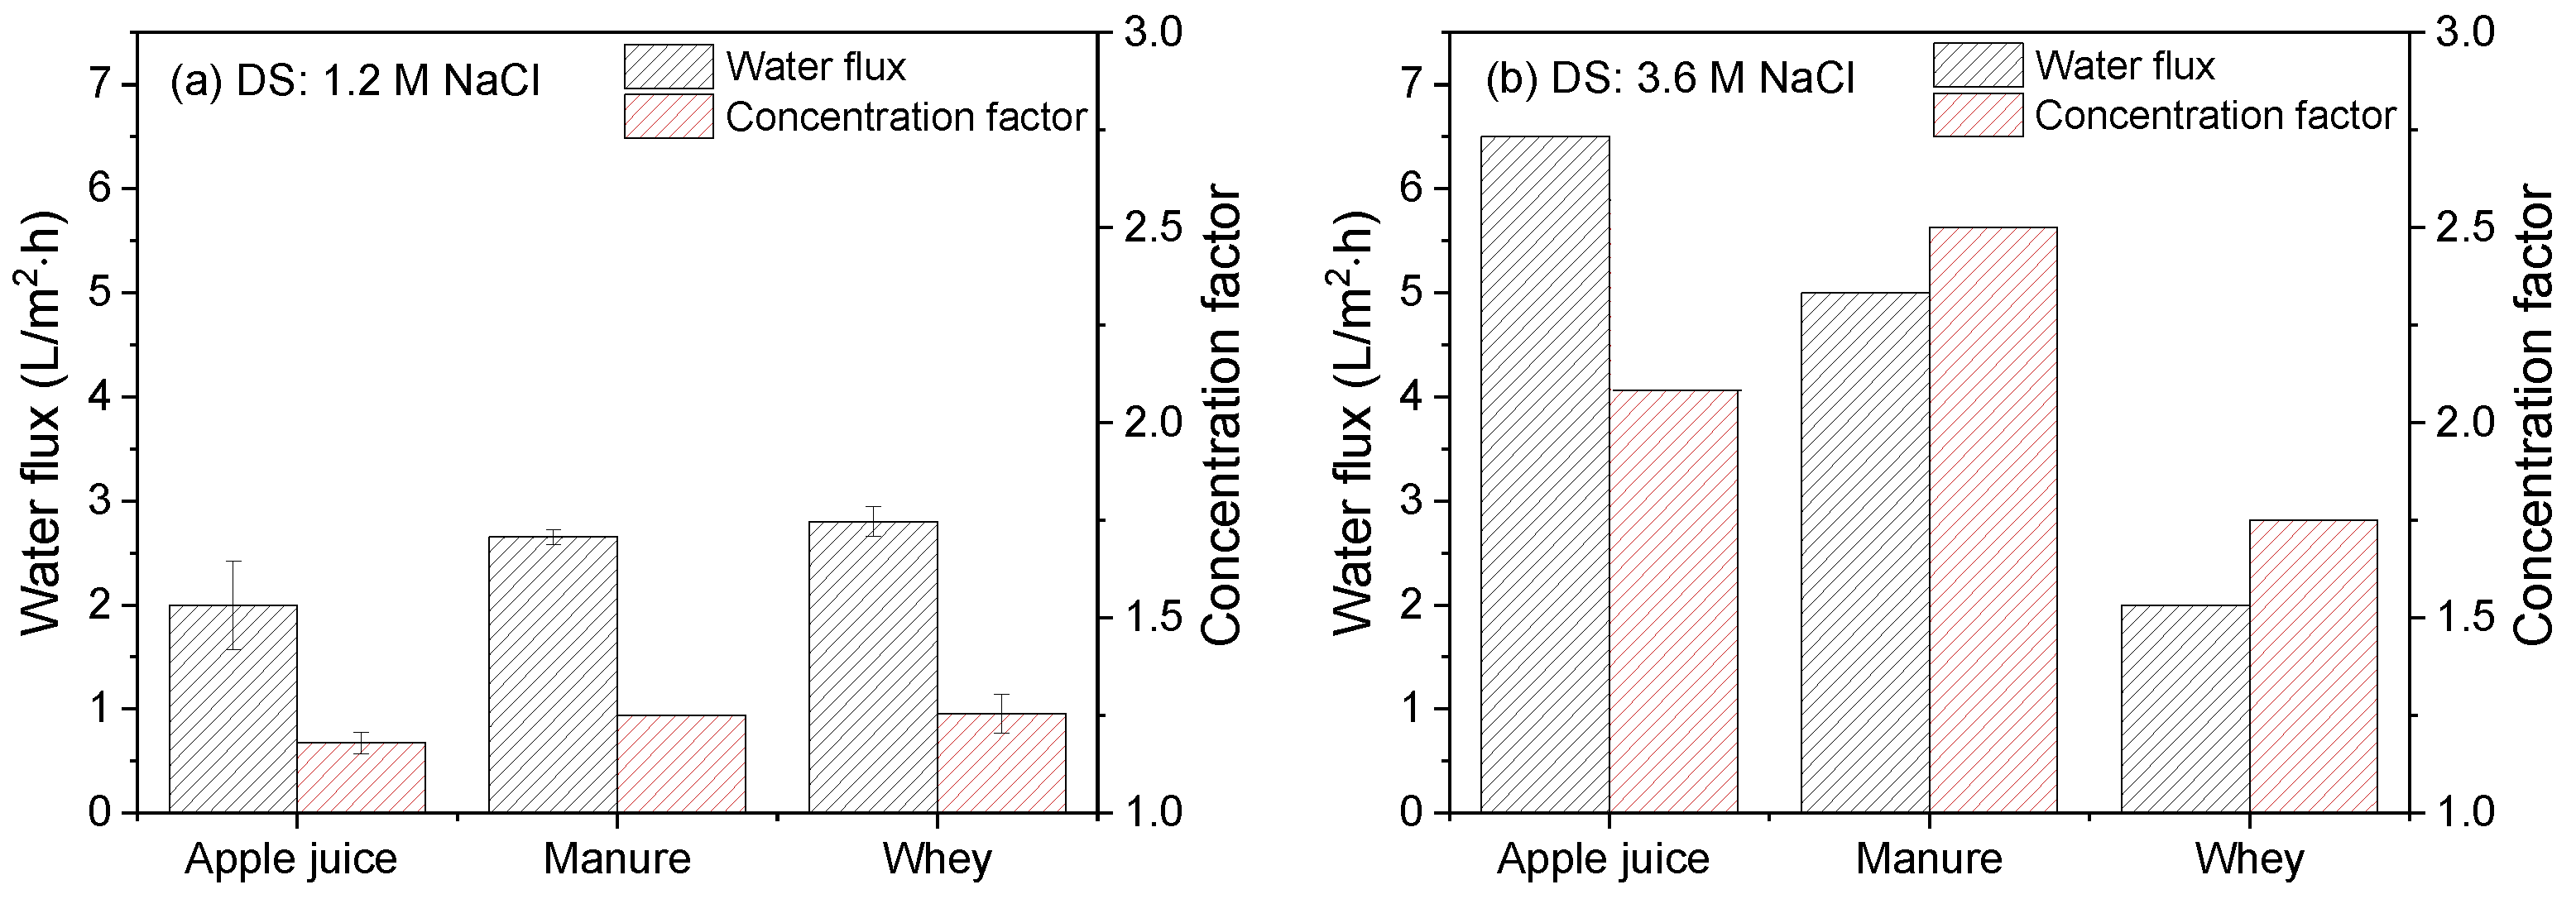
3.3. Membrane Performance with Real Industrial Feed Streams
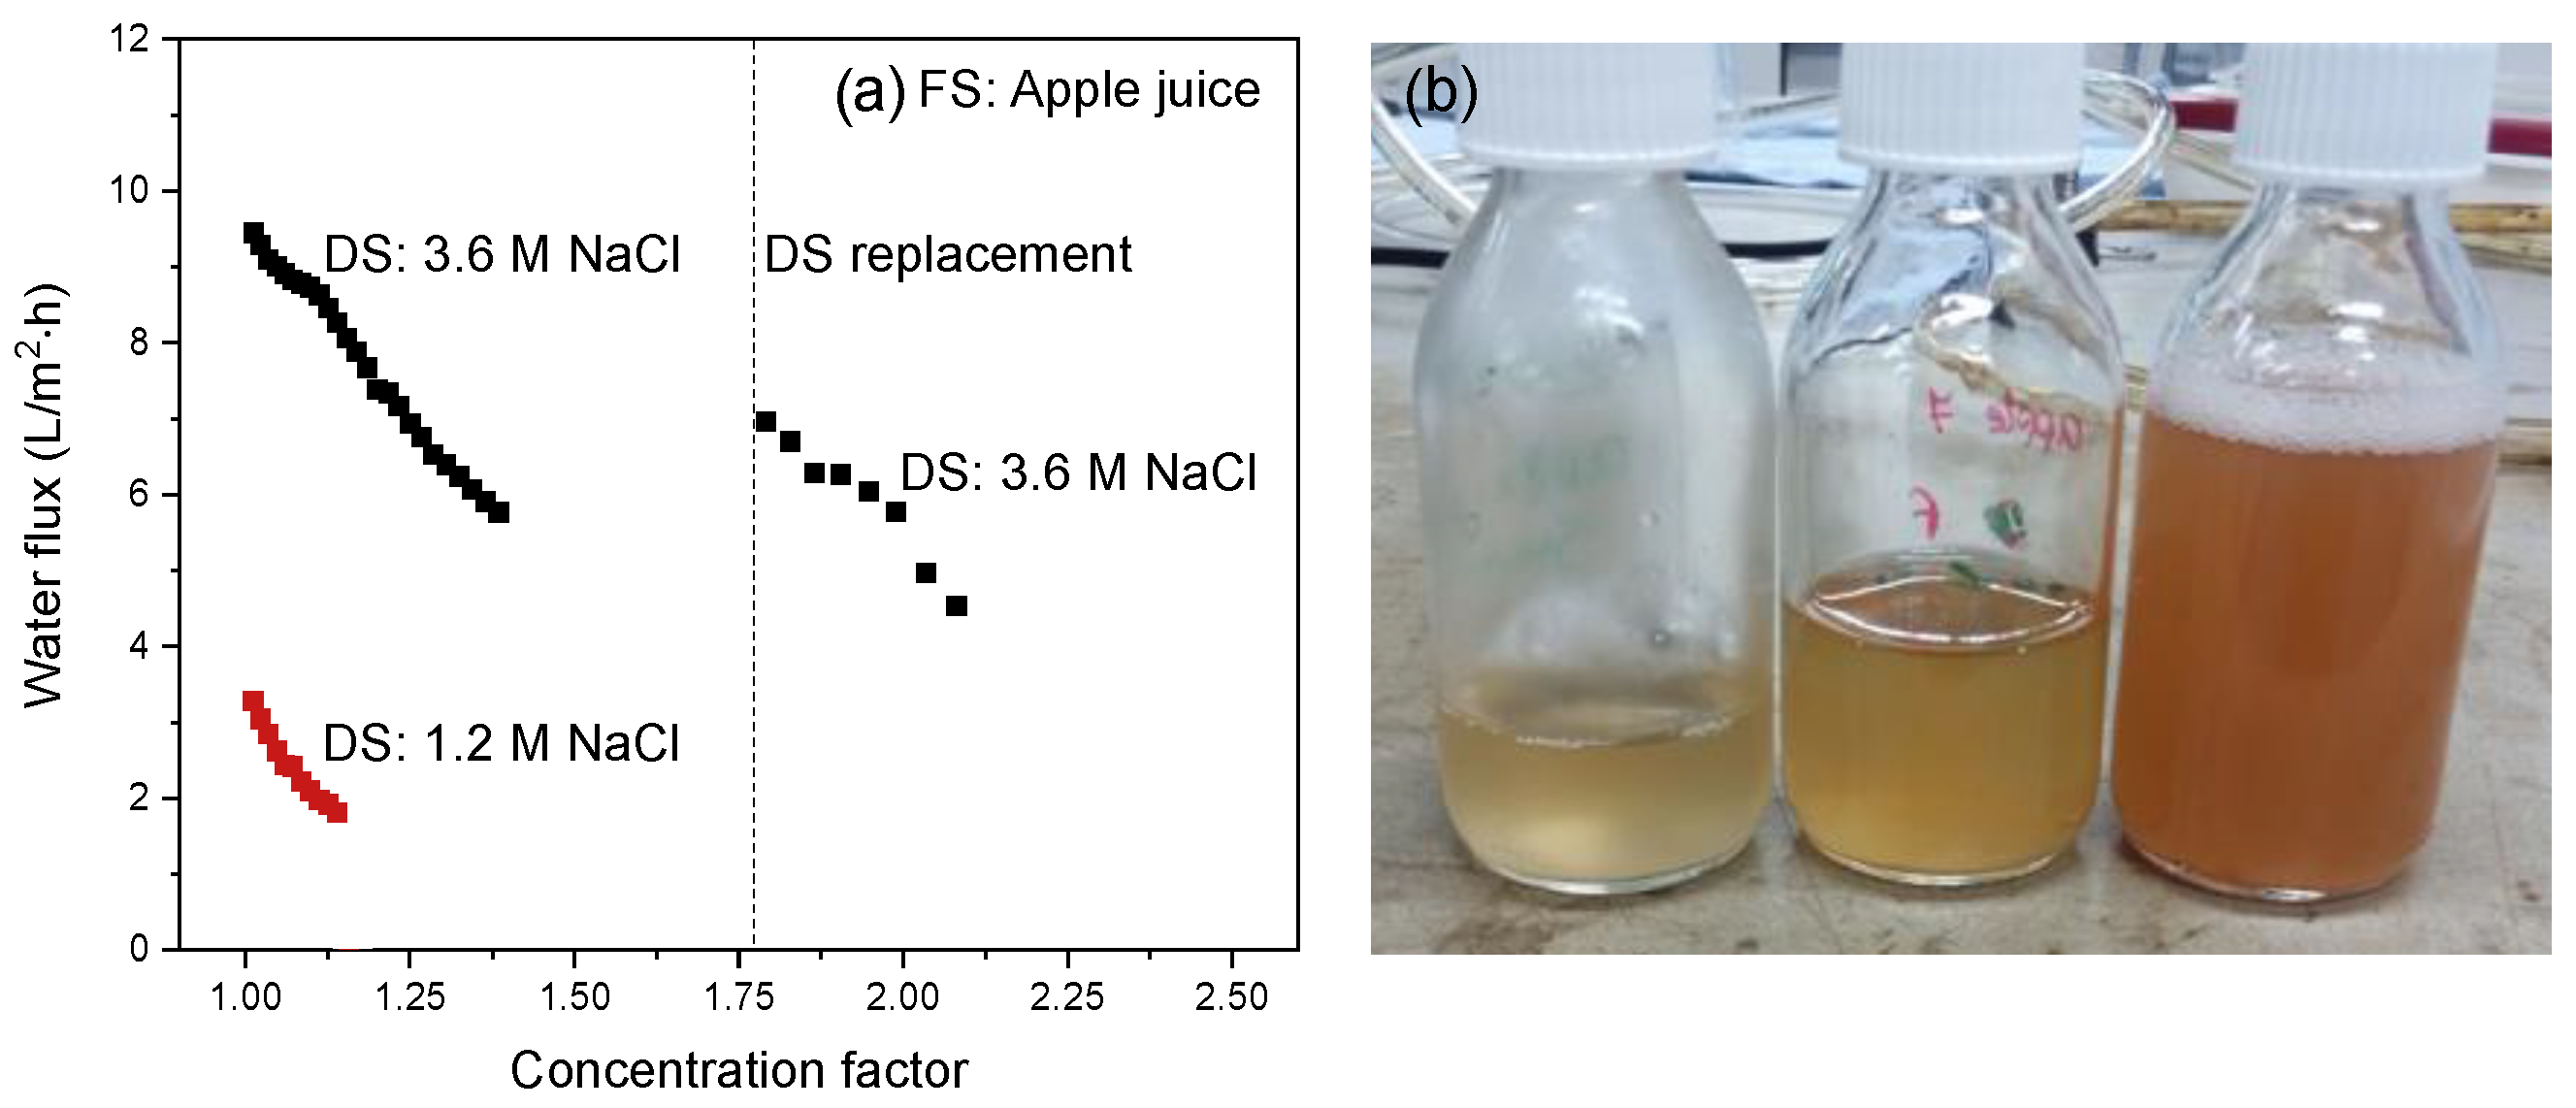
3.3.1. Apple Juice as Feed Stream
3.3.2. Manure as Feed Stream
3.3.3. Whey as Feed Stream
4. Conclusions
Author Contributions
Funding
Data Availability Statement
Acknowledgments
Conflicts of Interest
References
- Li, Z.; Wu, C.; Huang, J.; Zhou, R.; Jin, Y. Membrane fouling behavior of forward osmosis for fruit juice concentration. Membranes 2021, 11, 611. [Google Scholar] [CrossRef] [PubMed]
- Li, Y.; Xu, Z.; Xie, M.; Zhang, B.; Li, G.; Luo, W. Resource recovery from digested manure concentrate: Comparison between conventional and aquaporin thin-film composite forward osmosis membranes. J. Memb. Sci. 2020, 593, 117436. [Google Scholar] [CrossRef]
- Chen, G.Q.; Artemi, A.; Lee, J.; Gras, S.L.; Kentish, S.E. A pilot scale study on the concentration of milk and whey by forward osmosis. Sep. Purif. Technol. 2019, 215, 652. [Google Scholar] [CrossRef]
- Chun, Y.; Mulcahy, D.; Zou, L.; Kim, I.S. A Short Review of Membrane Fouling in Forward Osmosis Processes. Membranes 2017, 7, 30. [Google Scholar] [CrossRef] [PubMed] [Green Version]
- Mohammadifakhr, M.; De Grooth, J.; Roesink, H.D.W.; Kemperman, A.J.B. Forward Osmosis: A Critical Review. Processes 2020, 8, 404. [Google Scholar] [CrossRef] [Green Version]
- Ang, W.L.; Wahab Mohammad, A.; Johnson, D.; Hilal, N. Forward osmosis research trends in desalination and wastewater treatment: A review of research trends over the past decade. J. Water Process. Eng. 2019, 31, 100886. [Google Scholar] [CrossRef]
- Lau, W.J.; Lai, G.S.; Li, J.; Gray, S.; Hu, Y.; Misdan, N.; Goh, P.S.; Matsuura, T.; Azelee, I.W.; Ismail, A.F. Development of microporous substrates of polyamide thin film composite membranes for pressure-driven and osmotically-driven membrane processes: A review. J. Ind. Eng. Chem. 2019, 77, 25. [Google Scholar] [CrossRef]
- Akther, N.; Phuntsho, S.; Chen, Y.; Ghaffour, N.; Shon, H.K. Recent advances in nanomaterial-modified polyamide thin-film composite membranes for forward osmosis processes. J. Memb. Sci. 2019, 584, 20. [Google Scholar] [CrossRef]
- Wenten, I.G.; Khoiruddin, K.; Reynard, R.; Lugito, G.; Julian, H. Advancement of forward osmosis (FO) membrane for fruit juice concentration. J. Food Eng. 2021, 290, 110216. [Google Scholar] [CrossRef]
- Aydiner, C.; Topcu, S.; Tortop, C.; Kuvvet, F.; Ekinci, D.; Dizge, N.; Keskinler, B.A. Novel implementation of water recovery from whey: “forward- reverse osmosis” integrated membrane system. Desalin. Water Treat. 2013, 51, 786. [Google Scholar] [CrossRef]
- Blandin, G.; Ferrari, F.; Le-Clech, P.; Marc, H.; Martinez-llad, X. Forward Osmosis as Concentration Process: Review of Opportunities and Challenges. Membranes 2020, 10, 284. [Google Scholar] [CrossRef] [PubMed]
- Lutchmiah, K.; Verliefde, A.R.D.; Roest, K.; Rietveld, L.C.; Cornelissen, E.R. Forward osmosis for application in wastewater treatment: A review. Water Res. 2014, 58, 179. [Google Scholar] [CrossRef]
- Oymaci, P.; Borneman, Z.; Nijmeijer, K. Development of Polydopamine Forward Osmosis Membranes with Low Reverse Salt Flux. Membranes 2020, 10, 94. [Google Scholar] [CrossRef]
- Choi, P.J.; Lim, A.; Shon, H.; An, A.K. Incorporation of negatively charged silver nanoparticles in outer-selective hollow fiber forward osmosis (OSHF-FO) membrane for wastewater dewatering. Desalination 2022, 522, 115402. [Google Scholar] [CrossRef]
- Perreault, F.; Jaramillo, H.; Xie, M.; Ude, M.; Nghiem, L.D.; Elimelech, M. Biofouling Mitigation in Forward Osmosis Using Graphene Oxide Functionalized Thin-Film Composite Membranes. Environ. Sci. Technol. 2016, 50, 5840. [Google Scholar] [CrossRef] [Green Version]
- Lee, W.J.; Goh, P.S.; Lau, W.J.; Ong, C.S.; Ismail, A.F. Antifouling zwitterion embedded forward osmosis thin film composite membrane for highly concentrated oily wastewater treatment. Sep. Purif. Technol. 2019, 214, 40. [Google Scholar] [CrossRef]
- Ibrar, I.; Naji, O.; Sharif, A.; Malekizadeh, A.; Alhawari, A.; Alanezi, A.A.; Altaee, A. A Review of Fouling Mechanisms, Control Strategies and Real-Time Fouling Monitoring Techniques in Forward Osmosis. Water 2019, 11, 695. [Google Scholar] [CrossRef] [Green Version]
- Oymaci, P.; Offeringa, P.E.; Borneman, Z.; Nijmeijer, K. Effect of Osmotic Pressure on Whey Protein Concentration in Forward Osmosis. Membranes 2021, 11, 573. [Google Scholar] [CrossRef]
- Achilli, A.; Cath, T.Y.; Childress, A.E. Selection of inorganic-based draw solutions for forward osmosis applications. J. Memb. Sci. 2010, 364, 233. [Google Scholar] [CrossRef]
- An, X.; Hu, Y.; Wang, N.; Zhou, Z.; Liu, Z. Continuous juice concentration by integrating forward osmosis with membrane distillation using potassium sorbate preservative as a draw solute. J. Memb. Sci. 2019, 573, 192. [Google Scholar] [CrossRef]
- Seker, M.; Buyuksari, E.; Topcu, S.; Babaoglu, D.S.; Celebi, D.; Keskinler, B.; Aydiner, C. Effect of pretreatment and membrane orientation on fluxes for concentration of whey with high foulants by using NH3/CO2 in forward osmosis. Bioresour. Technol. 2017, 243, 237. [Google Scholar] [CrossRef] [PubMed]
- ForwardOsmosisTec. Forward Osmosis Guide; Technical University of Denmark: Lyngby, Denmark, 2016. [Google Scholar]
- Tian, M.; Qiu, C.; Liao, Y.; Chou, S.; Wang, R. Preparation of polyamide thin film composite forward osmosis membranes using electrospun polyvinylidene fluoride (PVDF) nanofibers as substrates. Sep. Purif. Technol. 2013, 118, 727. [Google Scholar] [CrossRef]
- Park, M.J.; Gonzales, R.R.; Abdel-Wahab, A.; Phuntsho, S.; Shon, H.K. Hydrophilic polyvinyl alcohol coating on hydrophobic electrospun nanofiber membrane for high performance thin film composite forward osmosis membrane. Desalination 2018, 426, 50. [Google Scholar] [CrossRef]
- Shokrollahzadeh, S.; Tajik, S. Fabrication of thin film composite forward osmosis membrane using electrospun polysulfone/polyacrylonitrile blend nanofibers as porous substrate. Desalination 2018, 425, 68. [Google Scholar] [CrossRef]
- Ndiaye, I.; Vaudreuil, S.; Bounahmidi, T. Forward osmosis process: State-of-the-art of membranes. Sep. Purif. Rev. 2021, 50, 53. [Google Scholar] [CrossRef]
- Cadotte, J.E.; King, R.S.; Majerle, R.J.; Petersen, R.J. Interfacial Synthesis in the Preparation of Reverse Osmosis Membranes. J. Macromol. Sci. Part. A Pure Appl. Chem. 1981, 15, 727. [Google Scholar] [CrossRef]
- Bui, N.N.; Lind, M.L.; Hoek, E.M.V.; McCutcheon, J.R. Electrospun nanofiber supported thin film composite membranes for engineered osmosis. J. Memb. Sci. 2011, 10, 385–386. [Google Scholar] [CrossRef]
- Hamer, W.J.; Wu, Y.-C. Osmotic Coefficients and Mean Activity Coefficients of Uni-univalent Electrolytes in Water at 25 °C. J. Phys. Chem. Ref. Data 1972, 1047, 1. [Google Scholar] [CrossRef] [Green Version]
- Liang, Y.; Yan, C.; Guo, Q.; Xu, J.; Hu, H. Spectrophotometric determination of ammonia nitrogen in water by flow injection analysis based on NH3-o-phthalaldehyde-Na2SO3 reaction. Anal. Chem. Res. 2016, 10, 1. [Google Scholar] [CrossRef] [Green Version]
- Kim, J.; Blandin, G.; Phuntsho, S.; Verliefde, A.; Le-Clech, P.; Shon, H. Practical considerations for operability of an 8′′ spiral wound forward osmosis module: Hydrodynamics, fouling behaviour and cleaning strategy. Desalination 2017, 404, 249. [Google Scholar] [CrossRef]
- Coday, B.D.; Heil, D.M.; Xu, P.; Cath, T.Y. Effects of Transmembrane Hydraulic Pressure on Performance of Forward Osmosis Membranes. Environ. Sci. Technol. 2013, 47, 2386. [Google Scholar] [CrossRef] [Green Version]
- Fluid Technology Solutions, data sheet OsmoF2O™ FO Industrial Membrane. Available online: http://ftsh2o.com/wp-content/uploads/2018/07/FTS_FO_Industrial-Membrane_FINAL-FTSCTA-02.pdf (accessed on 10 January 2022).
- Álvarez, S.; Riera, F.A.; Álvarez, R.; Coca, J. Concentration of apple juice by reverse osmosis at laboratory and pilot-plant scales. Ind. Eng. Chem. Res. 2002, 41, 6156. [Google Scholar] [CrossRef]
- Masse, L.; Massé, D.I.; Pellerin, Y.; Dubreuila, J. Osmotic pressure and substrate resistance during the concentration of manure nutrients by reverse osmosis membranes. J. Memb. Sci. 2010, 348, 28. [Google Scholar] [CrossRef]
- Goulas, A.; Grandison, A.S. Applications of membrane separation. In Advanced Dairy Science and Technology; Britz, T.J., Robinson, R.K., Eds.; Blackwell Publishing: Oxford, UK, 2008; pp. 35–74. [Google Scholar]
- Zarebska, A.; Nieto, D.R.; Christensen, K.V.; Søtoft, L.F.; Norddahl, B. Ammonium fertilizers production from manure: A critical review. Crit. Rev. Environ. Sci. Technol. 2015, 45, 1469. [Google Scholar] [CrossRef]
- Rubin, J.; Miguel, A.S.; Bommarius, A.S.; Behrens, S.H. Correlating aggregation kinetics and stationary diffusion in protein-sodium salt systems observed with dynamic light scattering. J. Phys. Chem. B 2010, 114, 4383. [Google Scholar] [CrossRef] [PubMed]
- Hyde, A.M.; Zultanski, S.L.; Waldman, J.H.; Zhong, Y.-L.; Shevlin, M.; Peng, F. General principles and strategies for salting-out informed by the Hofmeister series. Org. Process. Res. Dev. 2017, 21, 1355. [Google Scholar] [CrossRef] [Green Version]
- Kyrychuk, I.; Myronchuk, V.; Zmiievskii, Y.; Holiachuk, S. Two-stage whey treatment by nanofiltration and reverse osmosis. Ukr. Food J. 2015, 4, 638. [Google Scholar]
- Wang, Y.-N.; Wang, R.; Li, W.; Tang, C.Y. Whey recovery using forward osmosis—Evaluating the factors limiting the flux performance. J. Memb. Sci. 2017, 533, 179. [Google Scholar] [CrossRef]
- Chou, S.; Shi, L.; Wang, R.; Tang, C.Y.; Qiu, C.; Fane, A.G. Characteristics and potential applications of a novel forward osmosis hollow fiber membrane. Desalination 2010, 261, 365. [Google Scholar] [CrossRef]
- Lutchmiah, K.; Harmsen, D.J.H.; Wols, B.A.; Rietveld, L.C.; Qin, J.; Cornelissen, E.R. Continuous and discontinuous pressure assisted osmosis (PAO). J. Memb. Sci. 2015, 476, 182. [Google Scholar] [CrossRef]


| Parameter | Value |
|---|---|
| Polymer solution | |
| Polymer | PSU |
| Solvent | DMAc |
| Concentration | 22.5 wt.% |
| Viscosity | 2.15 Pa·s |
| Electrospinning parameters | |
| Relative humidity | 25% |
| Temperature | 22.5 °C |
| Wire-to-wire distance | 15 cm |
| Runner speed | 300 mm/s |
| Runner aperture | 0.9 mm |
| Voltage | 40 kV |
| Wire to substrate distance | 25 mm |
| Substrate | |
| Material | Siliconized paper |
| Movement speed | 30 mm/min |
| Parameter | Value |
|---|---|
| Porous PSU support layer | |
| Thickness | 48 ± 12 µm |
| Fiber diameter | 1.18 ± 0.40 µm |
| Porosity | 82.3 ± 5.5% |
| Mean flow pore size | 2.92 ± 0.47 µm |
| Dense selective PA top layer | |
| Top layer thickness | 0.63 µm ± 0.13 µm |
| Osmotic Pressure (Difference) | Apple | Manure | Whey | |||
|---|---|---|---|---|---|---|
| Absolute osmotic pressure | p (bar) | p (bar) | p (bar) | |||
| Osmotic pressure FS | 20 | 15 | 7 | |||
| Osmotic pressure DS 3.6 M | 193 | 193 | 193 | |||
| Osmotic pressure difference DS − FS | Dp (bar) | Time (h) | ||||
| - Start | 172 | 0 | ||||
| - At concentration factor 1.4 | 93 | 22 | ||||
| - After DS refreshment | 165 | 22 | ||||
| - At concentration factor 2.1 | 321 | 27 | ||||
| Osmotic pressure difference DS − FS | Dp (bar) | Time (h) | ||||
| - Start | 177 | 0 | ||||
| - At concentration factor 1.6 | 82 | 23 | ||||
| - After DS refreshment | 168 | 23 | ||||
| - At concentration factor 2.5 | 132 | 43 | ||||
| Osmotic pressure difference DS − FS | Dp (bar) | Time (h) | ||||
| - Start | 185 | 0 | ||||
| - At concentration factor 1.4 | 111 | 29 | ||||
| - After DS refreshment | 180 | 29 | ||||
| - At concentration factor 1.8 | 127 | 63 | ||||
Publisher’s Note: MDPI stays neutral with regard to jurisdictional claims in published maps and institutional affiliations. |
© 2022 by the authors. Licensee MDPI, Basel, Switzerland. This article is an open access article distributed under the terms and conditions of the Creative Commons Attribution (CC BY) license (https://creativecommons.org/licenses/by/4.0/).
Share and Cite
Nijmeijer, K.; Oymaci, P.; Lubach, S.; Borneman, Z. Apple Juice, Manure and Whey Concentration with Forward Osmosis Using Electrospun Supported Thin-Film Composite Membranes. Membranes 2022, 12, 456. https://doi.org/10.3390/membranes12050456
Nijmeijer K, Oymaci P, Lubach S, Borneman Z. Apple Juice, Manure and Whey Concentration with Forward Osmosis Using Electrospun Supported Thin-Film Composite Membranes. Membranes. 2022; 12(5):456. https://doi.org/10.3390/membranes12050456
Chicago/Turabian StyleNijmeijer, Kitty, Pelin Oymaci, Sjoukje Lubach, and Zandrie Borneman. 2022. "Apple Juice, Manure and Whey Concentration with Forward Osmosis Using Electrospun Supported Thin-Film Composite Membranes" Membranes 12, no. 5: 456. https://doi.org/10.3390/membranes12050456
APA StyleNijmeijer, K., Oymaci, P., Lubach, S., & Borneman, Z. (2022). Apple Juice, Manure and Whey Concentration with Forward Osmosis Using Electrospun Supported Thin-Film Composite Membranes. Membranes, 12(5), 456. https://doi.org/10.3390/membranes12050456