3.1. Influence of Influent Flow on Electrodialysis Process
In this test, the influent flow of the concentration and dilution compartment were kept consistent, and the influent flow rates of the dilute and concentration compartment were adjusted to be 100 L/h, 150 L/h, 200 L/h, 250 L/h, and 300 L/h respectively, and the corresponding flow rate on the surface of the ion exchange membrane were 0.408 cm/s, 0.613 cm/s, 0.817 cm/s, 1.021 cm/s, and 1.225 cm/s, respectively. The pilot-scale electrodialysis device was controlled to operate under the condition of electrode compartment flow of 350 L/h and constant voltage of 20 V. When the device operated for 40 min, the transmittance of the device
/
and the total anion transmittance rate with the flow are shown in
Figure 3. The influent flow affects the unit energy consumption (
) of the device and the effect of separation efficiency is shown in
Figure 4.
It can be seen from
Figure 3 that under the experimental conditions, the transmittance of
(
) is significantly higher than the transmittance of
(
), indicating that the device has excellent monovalent selectivity. This phenomenon is due to: (1) the ionic hydration radius of
is larger than
[
25], which makes the resistance of
passing through the ion exchange membrane larger than
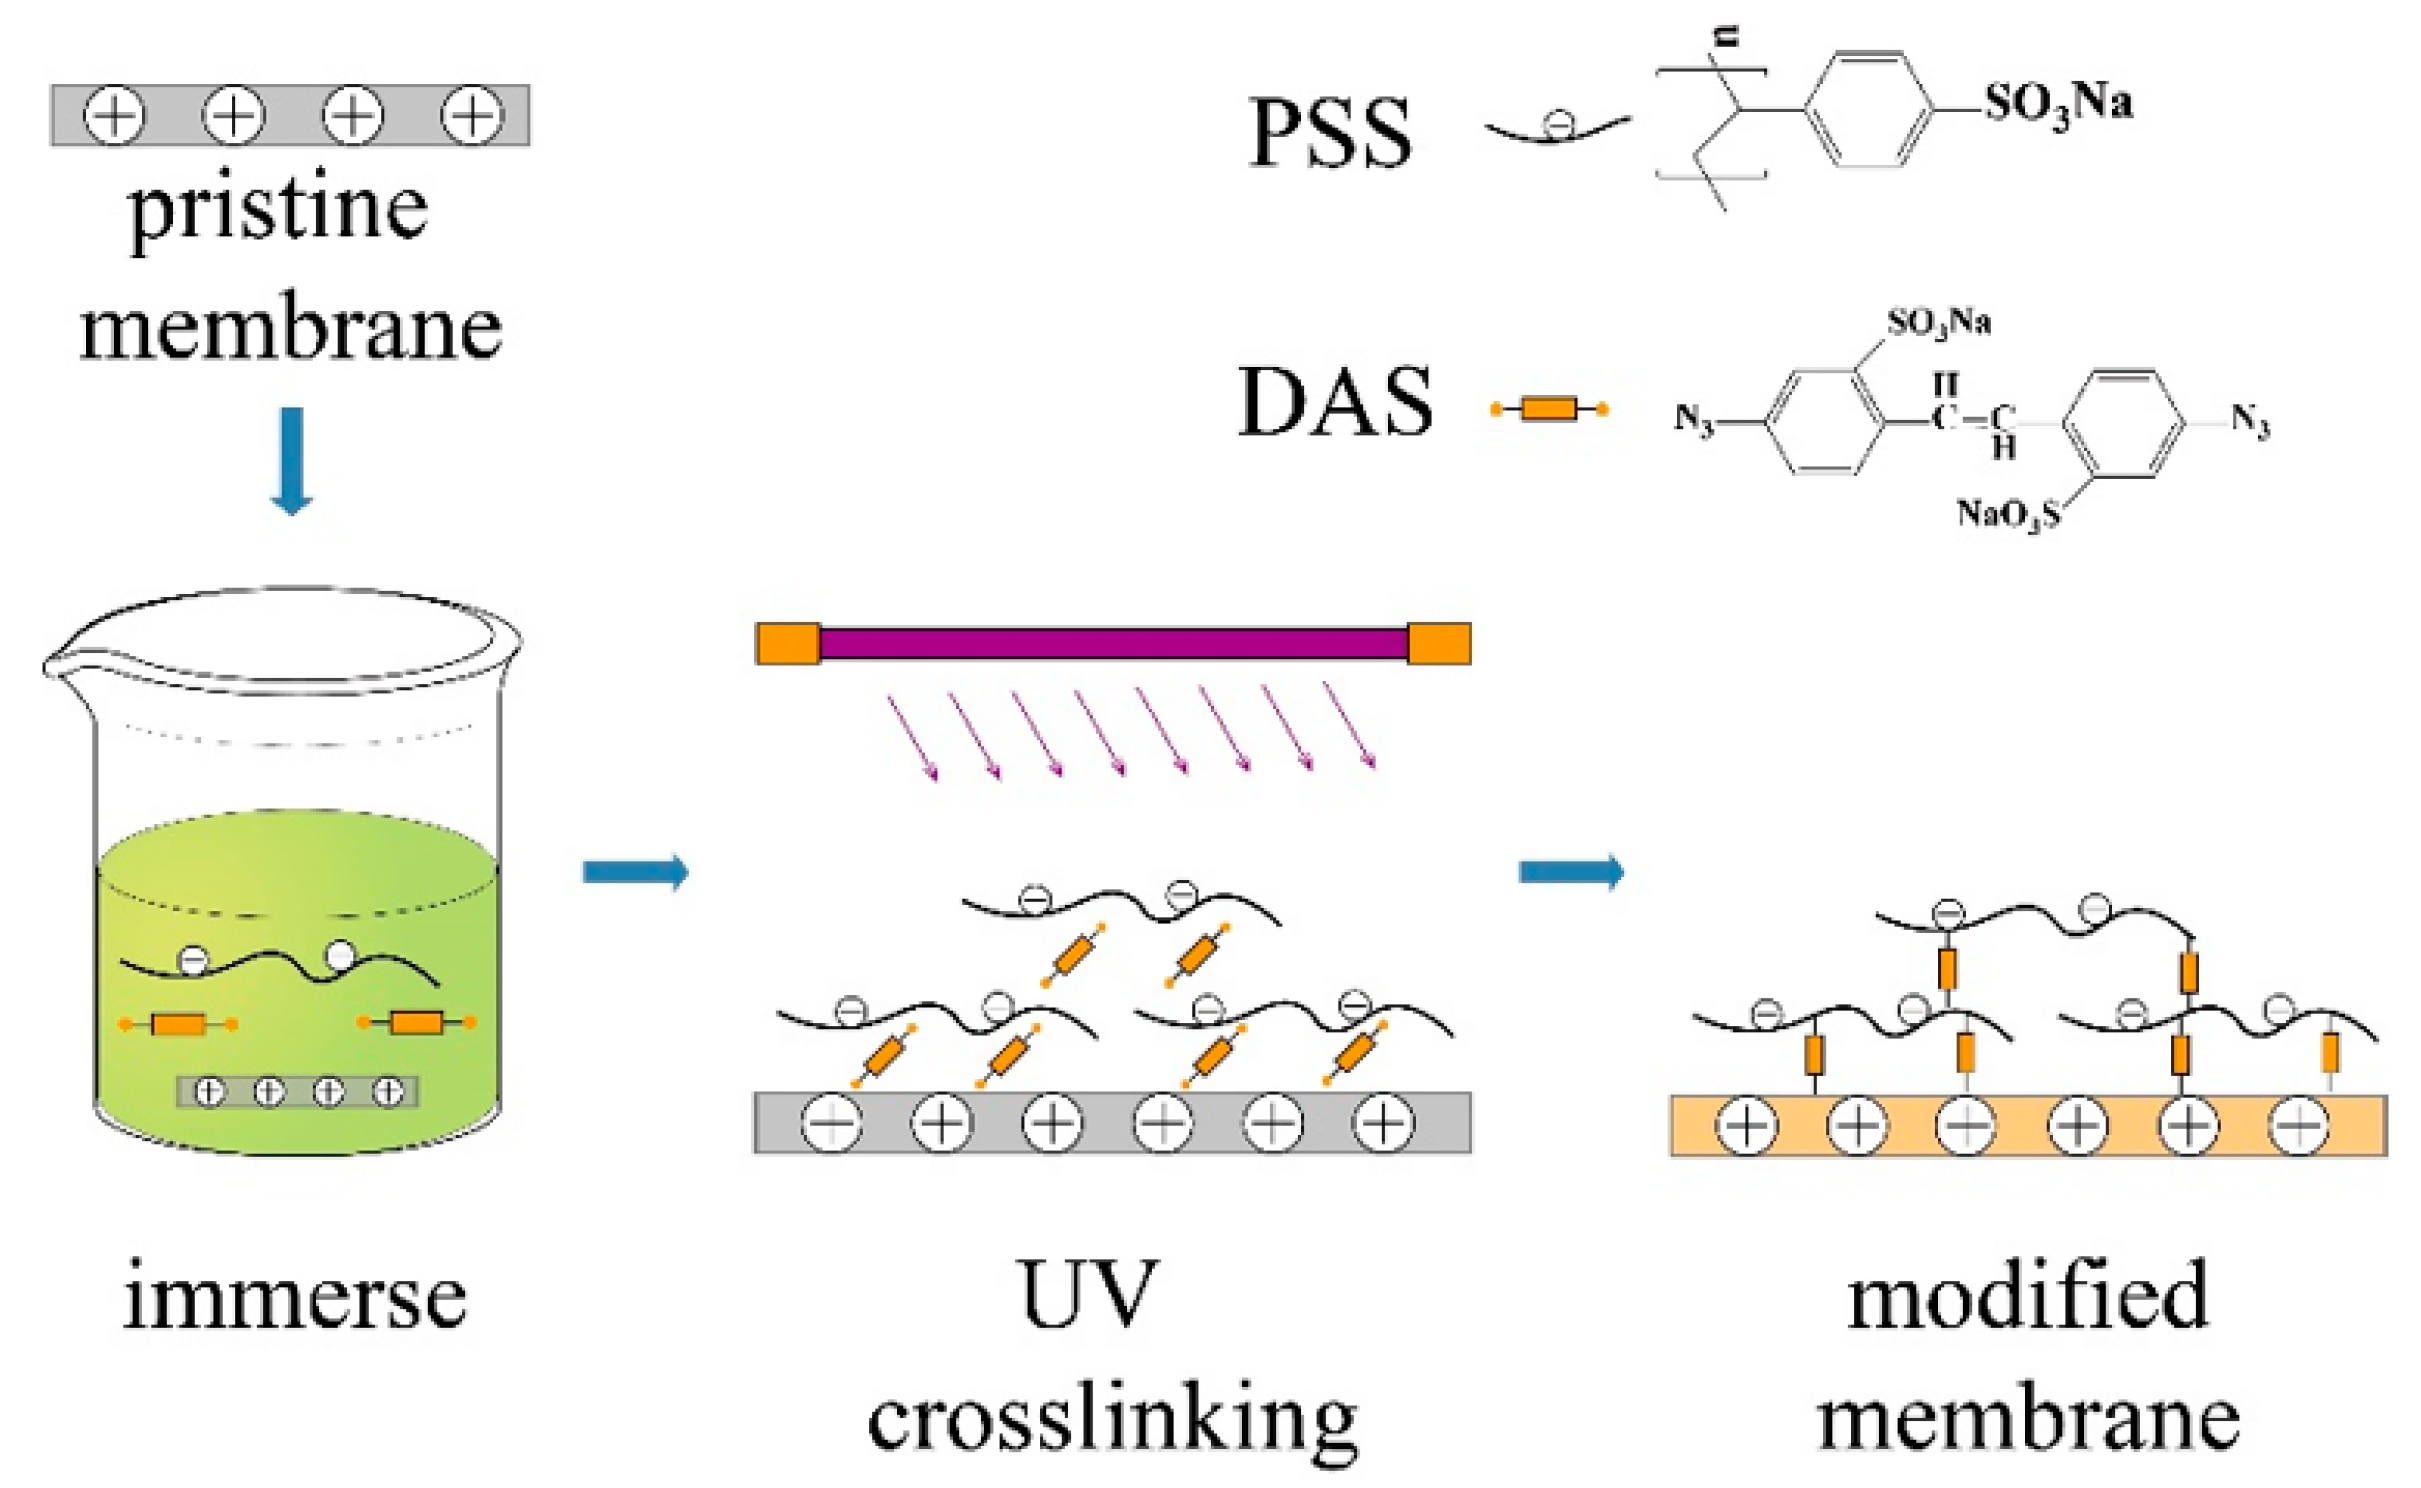
; (2) the DAS-PSS modified layer contains a large number of sulfonic acid groups that can be dissociated at any pH, which makes the DAS-PSS modified layer have a strong negative charge and a stronger electrostatic repulsion to
with a higher ionic valence, further increasing the resistance of
to transit through the ion exchange membrane.
The effect of influent flow rate on the total anion transmission rate (
) and the
and
were basically the same, which showed an overall trend of first increasing and then decreasing. When the influent flow rate was increased from 150 L/h to 200 L/h, the total anion transmission rate remained almost unchanged, while the
increased from 5.00% to 5.99% and the
decreased from 91.48% to 90.53%, indicating that the effect of increasing the influent flow rate on the
was more significant in this flow rate range. The effect of increasing influent flow rate on the
was more obvious in this flow range. The reason for the above phenomenon are: related studies [
34,
35,
36] have shown that (1)
has preferential transport in the electrodialysis module; (2) under the condition that the total anion concentration is the same, an increase in the percentage of
will increase the resistance of the electrodialysis device, indicating that the electrical conductivity of
is lower than
.The hydraulic residence time of the salt solution in the electrodialysis module gradually decreases as the influent flow rate increases. The charged ions are directed to transport within the electrodialysis device by the force of the electric field, with the same operating voltage, the number of ions that have transported gradually increases as the hydraulic residence time of the feed increases in the electrodialysis module, resulting in the electrical conductivity of the feed decreases, which increases the electrical resistance of the electrodialysis device. According to Equations (6) and (7), the output power of the power supply gradually decreases as the resistance of the feed liquid increases, and less energy is used for ion transportation under the same operation time conditions, which reduces the
.
The total anion transmission rate curve in
Figure 3 showed that at an influent flow rate of 100 L/h, the longer hydraulic residence time of the salt solution in the electrodialysis module resulted in a lower operating power of the device and a total anion transmission rate of 44.30%, which was less than the rest of the influent flow rate. In the range of 100~250 L/h, the total anion transmission rate of the device was relatively stable, with a maximum value of 47.50% at 250 L/h. At this time, the
and
were 91.71% and 5.44% respectively, and the device showed excellent monovalent separation. At an influent flow rate of 300 L/h, the
,
and
of the device were significantly decreased, which was due to the fact that the hydraulic residence time of the salt solution in the electrodialysis module was too short and some ions flowed out of the module before transportation, resulting in a decrease in the number of ions completing transportation.
In
Figure 4, the separation efficiency (
) of the device first decreases and then increases, which is related to the formula for the separation efficiency (Equation (3)), which characterizes the relative deviation of the ion transport rate [
37], and an increase in
reduces the value of the separation efficiency for a constant
.
In conjunction with the data in
Figure 3, the
of the device was 44.30% and 46.09% at the influent flow rate of 100 and 300 L/h respectively, with the
at a relatively low level, and the separation efficiency value was larger currently. The
of the device fluctuated within the range of 47.25% to 47.50% at the influent flow rate of 150–250 L/h, which made the separation efficiency value lower than that of the influent flow rate of 100 and 300 L/h. The
and
were 91.71% and 5.44% respectively at a influent flow rate of 250 L/h. The
reached a maximum of 47.50% and the separation efficiency was 88.79%. When the influent flow rate increased to 300 L/h, due to the short hydraulic residence time of the salt solution in the electrodialysis module, the
and
decreased compared with that at 250 L/h, which increased the separation efficiency value.
The reason for the above phenomenon is that due to the synergistic effect of the pore-size sieving effect and the electrostatic repulsion effect of the modified membrane, the transport resistance of is greater than , resulting in the preferential migration of in the electrodialysis module. After the concentration of the salt solution in the electrodialysis module decreases to a certain level, is forced to transport to maintain the operation of the device, resulting in a decrease in the separation efficiency () of the device. Therefore, as the of the device increases, the separation efficiency () gradually decreases. When the influent flow was 100 and 300 L/h, the of the device was less than the rest of the influent flow, showing a higher separation efficiency. In the range of influent flow 150~250 L/h, the of the device was relatively stable. When the influent flow of the device was 150 L/h and 250 L/h, the was over 91%, Energy consumption per unit of NaCl () was at a low level. In practical applications, the treated water volume of 250 L/h is significantly higher than 150 L/h, and the of the device at 250 L/h is at the lowest level. Therefore, the optimal influent flow rate of the pilot-scale electrodialysis device is 250 L/h.
3.2. Influence of Operation Voltage on the Electrodialysis Process
The influent flow of the concentration and dilution compartment of the pilot electrodialysis device was 250 L/h, and the flow rate of water into the electrode compartment was 350 L/h. The external voltage of the device was adjusted in order to make the device operate at a constant voltage of 10 V, 15 V, 20 V, 25 V and 30 V. Measured and calculated the operation time when the
transmission rate was 80%, and the
transmission rate, separation efficiency and Energy consumption per unit of NaCl (
) under the operation time were analyzed.
Figure 5 shows the effects of different voltages on the selected separation performance of the device, and
Figure 6 shows the effects of different voltages on the operation time and
of the device.
When the is the same, the increase of the will cause the decrease of the separation efficiency. The effect of voltage on was more obviously, in the voltage range of 10 V~25 V, the was negatively correlated with the increase of voltage, from 3.67% at 10 V to 2.47% at 25 V, after the voltage increased to 30 V, the increased slightly. The separation efficiency was influenced by and . When the transmittance was a fixed value, the separation efficiency was determined by the , and the trend was exactly opposite to the . The separation efficiencies of the operating voltages of 20 V and 25 V are more satisfactory, 93.85% and 94.01% respectively.
The reason for the above phenomenon is that the voltage rises and the electric field force on the ions increases, which means that the driving force for the directional transport of the ions increases. When the voltage was not more than 15 V, the electric field force on and was relatively stable, and the decreased from 3.67% to 3.54% with the increase of voltage. In the range of voltage from 15 V to 25 V, the voltage increased, and the electric field force increased on , and squeezed the channel of through the ion exchange membrane, which resulted in a significant decrease of . When the voltage has exceeded 25 V, due to the higher negative charge of , the influence of the enhanced electric field force was more obvious, and the electric field force of has overcome the resistance of the ion exchange membrane. Therefore, the increases, while the separation efficiency decreases.
The
with voltage reached 0.344 kWh/kg and 0.415 kWh/kg at operation voltages of 20 V and 25 V respectively. The operation time was shorter under the operation voltage of 25 V. The above phenomenon is caused by the redox reaction shown in Equations (8) and (9) in the electrode area of the electrodialysis module, where water molecules are electrolyzed into
and
, this process consumes energy and the gas produced by the reaction escapes from the device, resulting in energy loss. Higher voltage increases the energy consumption of the device for electrolysis of water and the circuit, which raises
. Therefore, the suitable voltage for the device is 20~25 V, which can be adjusted according to practical requirements. The optimum operation voltage for the unit under the test conditions in this paper is 20 V, which is the lower
.
3.3. Influence of Operation Current on the Electrodialysis Process
The influent flow of the concentration and dilution compartment of the pilot electrodialysis device was 250 L/h, and the flow rate of water into the electrode compartment was 350 L/h. The operation current of the device was adjusted to make the device operate at 3 A, 3.5 A, 4 A, 4.5 A and 5 A, corresponding to a current density of 5.786 mA/cm
2, 6.750 mA/cm
2, 7.715 mA/cm
2, 8.679 mA/cm
2 and 9.643 mA/cm
2 respectively. The unit was operated at constant current, measured and calculated the operation time when the
transmission rate is 80%, and the
transmission rate, separation efficiency and Energy consumption per unit of NaCl (
) under the operation time were analyzed.
Figure 7 shows the effect of current on the separation performance of the device selection,
Figure 8 shows the effect of current on the operation time and
of the device.
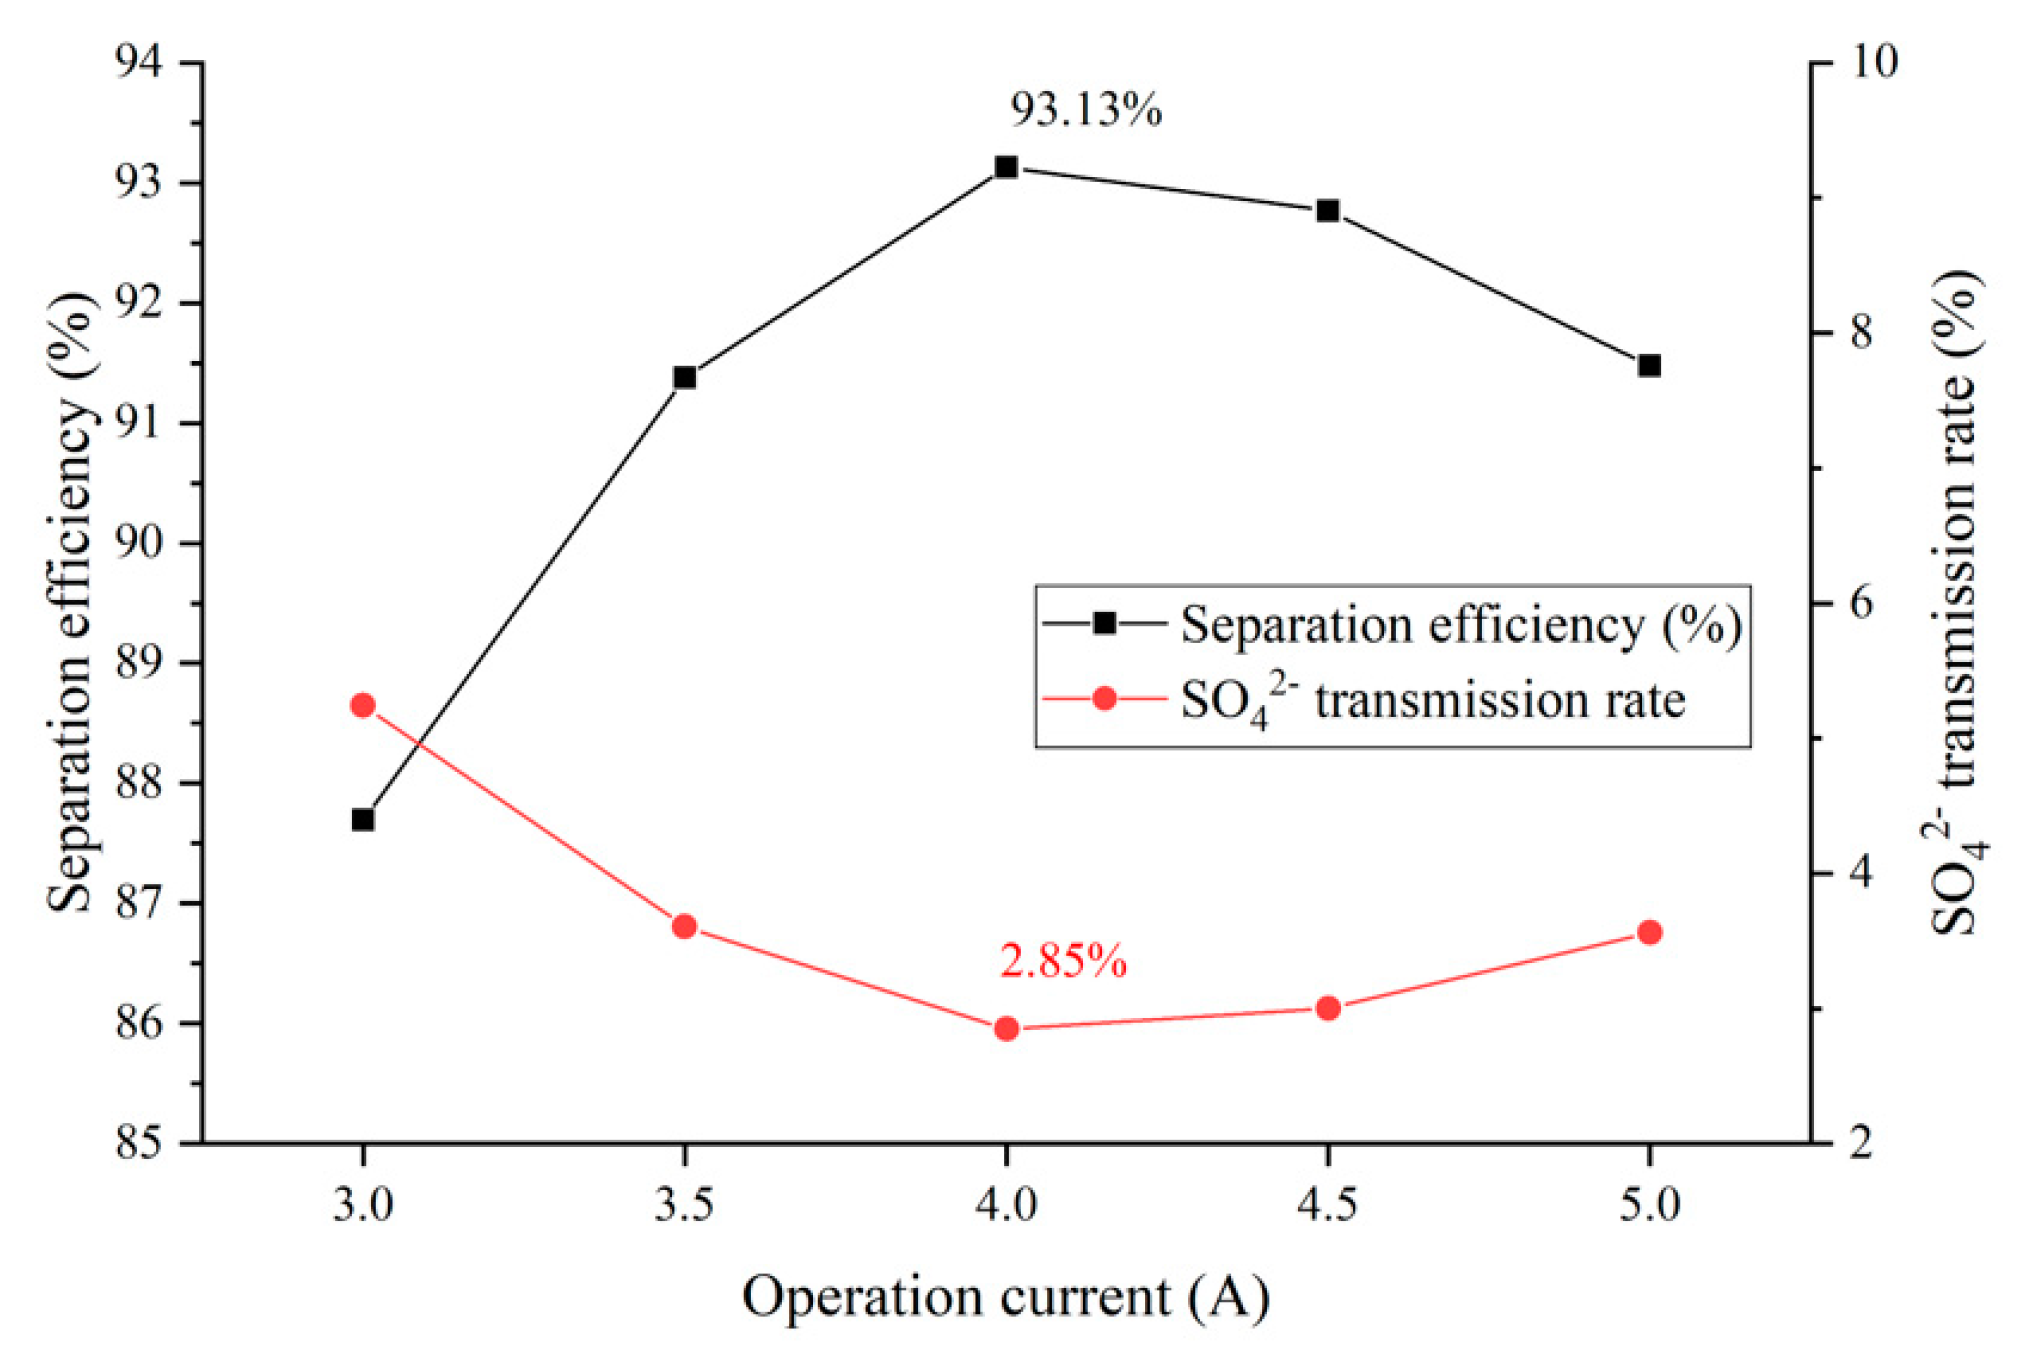
It can be seen from
Figure 7 that the
gradually decreases in the range of operating current 3.0–4.0 A, with a minimum value of 2.85% achieved at operation current 4 A, at which time the separation efficiency is 93.13%. The separation efficiency is influenced by
and
. When the
is a constant value, the separation efficiency is determined by the
, and the change trend is completely opposite to the
. When the operation current is lower than 4 A, increased current can significantly reduce the
, the
gradually decreased from 5.24% at 3 A to 2.85% at 4 A, and the separation efficiency increased from 87.70% to 93.13%; after the operation current is higher than 4 A, the
gradually increased to 3.56% at operation current of 5 A, and the separation efficiency decreased to 91.48%, slightly higher than 91.38% at 3.5 A.
The reason for the above phenomenon is that the electric field force on the ion is enhanced by the higher current, which means that the driving force for the directional transport of the ions is enhanced. When the current is not greater than 4 A, the effect of the enhanced electric field force on is more obviously, squeezes the transmission channel of , which makes the decrease significantly. With operation current above 4 A, the effect of enhanced electric field force is more obvious by the higher negative charge of , which leads to an increase in the .
The trend of the
and operation time were essentially the same as that of constant voltage operation. Because of the increased current, the energy consumption of the circuit and electrodes, two components that are not used for ion transport, which increased the value of
. Combined with the data in
Figure 7, the separation efficiency of the pilot-scale electrodialysis device is highest when operating at a constant current of 4 A and the
is at a low level. Therefore, the optimum operation current for the device is 4 A. Under these operation conditions, the separation efficiency was 93.13%, the
was 0.321 kWh/kg and the operation time was 28.70 min.
3.4. Comparison of Operation Conditions for Electrodialysis Device
Based on the experimental results in
Section 3.2 and
Section 3.3 of this paper, the
and
transmission rates, separation efficiency (
), and energy consumption per unit of NaCl (
) of the device are relatively similar when the device is operated at a constant voltage of 20 V and a constant current of 4 A. To determine the best operation conditions of the device, the power and energy consumption of the above-mentioned two operating conditions are compared.
Figure 9 shows the variation in power during the operation of the electrodialysis device, and
Figure 10 shows a comparison of the energy consumptions of the electrodialysis device under different operation conditions.
From
Figure 9, it can be seen that the power variations of the device at a constant voltage of 20 V and a constant current of 4 A are exactly opposite to each other. This phenomenon was caused by the change in the resistance of the electrodialysis module during operation. The initial conditions for the electrodialysis unit were: high-salinity wastewater for the dilute compartment feed and deionized water for the concentration compartment feed. There were an insufficient number of ions in the concentration compartment and inadequate electrical conductivity when the electrodialysis unit initially started operating, which left the overall resistance of the module at a high level. As the electrodialysis process was performed, the concentration of ions in the concentration compartment increased, causing the overall resistance of the module to decrease. Because of the directional transport of the ions, the ion concentration in the dilute compartment is always reduced during the electrodialysis process, which causes a reduction in the conductivity of the dilute compartment, and when the dilute compartment concentration dropped below a certain level, the resistance of the dilute compartment became the control condition of the electrodialysis module. Therefore, the resistance of the device decreased and then increased during the electrodialysis process. According to Equation (6), the trend of the change in the power curve of the device under constant voltage and constant current operation conditions is consistent with the change in the resistance of the device. In the electrodialysis process, the power range of the device at a constant voltage and constant current is 38 to 94 W and 60.4 to 134 W, respectively. Compared to constant voltage operation, constant current operation at the initial and final stages of the electrodialysis process could cause the device to operate at high power conditions due to the higher resistance, which may cause negative effects on the device.
From
Figure 10, the energy consumption for constant current operation is above that for constant voltage operation during 0 to 15 min and 30.15 to 40 min, and the reverse is true for 15 to 30.15 min. According to Equation (7), combined with the data in
Figure 9, the trend of change in the energy consumption of the device corresponds to the change in the resistance of the device. According to 3.2 and 3.3 of this paper, the
, separation efficiency (
) and
at constant voltage of 20 V and constant current of 4 A were 2.54%, 2.85%; 93.85%, 93.13%; 0.344 kWh/kg, 0.321 kWh/kg respectively for
of 80%. The energy consumption per unit for constant current operation is better than constant voltage, but the
is higher than for constant voltage 20 V operation, which results in lower separation efficiency. Combined with the data in
Figure 9 and
Figure 10, the power of constant current operation is significantly more than constant voltage operation after significant ion transport, which is not conducive to controlling the extent of the reaction and could have a detrimental effect on the device. Therefore, in the test conditions of this paper, the optimum operating conditions for the device are 250 L/h influent flow rate for the concentration and dilution compartment, 350 L/h influent flow rate for the electrode compartment, the constant voltage is 20 V.
3.5. Selective Separation Performance Changes during Electrodialysis
As a result of pore-size sieving and electrostatic repulsion, the modified membrane has a higher resistance to
, which makes the
preferentially transported. The decrease in the concentration of
in the salt solution causes more
to transport, changing the relevant parameter that measures the monovalent selectivity of the device. To determine the applicability and accuracy of each parameter, the monovalent selectivity coefficient (
), separation efficiency (
), and ion transport ratio
/
were compared for different
values. A pilot electrodialysis test was carried out to analyze the process under the operating conditions where the
exceeded 95%. The test conditions are as follows: the influent flow of the concentration and dilution compartments of the pilot electrodialysis device was 250 L/h, and the influent flow of the electrode compartment was 350 L/h at a constant current of 4 A.
Figure 11 shows the variation of the monovalent selectivity coefficient (
), separation efficiency (
), and ion transport ratio
/
during the electrodialysis process.
The ion transport ratio
/
is the most intuitive reflection of the selective separation performance of the device, while the higher values of
/
indicate the stronger monovalent selectivity of the device. However,
/
is difficult to measure under different operation conditions; therefore, the monovalent selectivity coefficient and separation efficiency are often used to analyze the monovalent selectivity of the device. It can be seen from
Figure 11 that
/
tended to decrease—it did so from 80.07 at 50% of
to 10.74 at 95% of
. This was especially true when the
increased from 60% to 65%, at which point
/
showed a dramatic decrease from 65.38 to 45.24; the change in value was significant. The above phenomenon is due to the insufficient amount of
in the desalination chamber liquid after a large amount of
is transported, forcing more
to complete the transport to maintain the operation of the device. Therefore, as the amount of
completing transport increases, more
is transported, which results in a decreasing trend of
/
.
From
Figure 11, the
changed basically the same trend as
/
when the
was not greater than 70%, especially when the
increased from 60% to 65%, the
decreased rapidly from 85.23 to 67.05, accurately reflected the change of device selectivity. When the
was more than 70%, the
began to show an increasing trend and increased rapidly with the improvement of the
. When the
was 95%, the
was 103.52, which phenomenon clearly does not correspond to the variation of the separation performance of the device. The reason for the above phenomenon is that from the Equation of the monovalent selectivity coefficient
(Equation (1)), the concentration of
in real time in the dilute compartment salt solution participates in the calculation as part of the denominator in the formula, and after the
has exceeded 70%, the real-time concentration of
in the light chamber salt solution is lower, which amplifies the
after the formula.
The separation efficiency is not as accurate as the monovalent selectivity factor when the is not greater than 70%, and the change trend when the increases from 60% to 65% is not reflected in its curve, but the change trend of the separation efficiency is basically the same as /, which can reflect the actual situation of the separation performance of the device during the whole electrodialysis process more accurately. Therefore, the separation efficiency is more suitable as a parameter to measure the monovalent separation performance of the device.


