Article

Study of Membranes with Nanotubes to Enhance Osmosis Desalination Efficiency by Using Machine Learning towards Sustainable Water Management

by
Abdelfattah Amari
1,2,*,
Mohammed Hasan Ali
3,
Mustafa Musa Jaber
4,5,
Velibor Spalevic
6 and
Rajko Novicevic
7,*
1
Department of Chemical Engineering, College of Engineering, King Khalid University, Abha 61411, Saudi Arabia
2
Research Laboratory of Processes, Energetics, Environment and Electrical Systems, National School of Engineers of Gabes, Gabes University, Gabes 6072, Tunisia
3
Computer Techniques Engineering Department, Faculty of Information Technology, Imam Ja’afar Al-Sadiq University, Najaf 10070, Iraq
4
Computer Techniques Engineering Department, Dijlah University College, Baghdad 10070, Iraq
5
Computer Techniques Engineering Department, Al-Farahidi University, Baghdad 10070, Iraq
6
Biotechnical Faculty, University of Montenegro, Mihaila Lalica 1, 81000 Podgorica, Montenegro
7
Faculty of Business Economics and Law, Adriatic University, 85000 Bar, Montenegro
*
Authors to whom correspondence should be addressed.
Membranes 2023, 13(1), 31; https://doi.org/10.3390/membranes13010031
Submission received: 22 November 2022 / Revised: 20 December 2022 / Accepted: 22 December 2022 / Published: 26 December 2022

Abstract

:
Water resources management is one of the most important issues nowadays. The necessity of sustainable management of water resources, as well as finding a solution to the water shortage crisis, is a question of our survival on our planet. One of the most important ways to solve this problem is to use water purification systems for wastewater resources, and one of the most necessary reasons for the research of water desalination systems and their development is the problem related to water scarcity and the crisis in the world that has arisen because of it. The present study employs a carbon nanotube-containing nanocomposite to enhance membrane performance. Additionally, the rise in flow brought on by a reduction in the membrane’s clogging surface was investigated. The filtration of brackish water using synthetic polyamide reverse osmosis nanocomposite membrane, which has an electroconductivity of 4000 Ds/cm, helped the study achieve its goal. In order to improve porosity and hydrophilicity, the modified raw, multi-walled carbon nanotube membrane was implanted using the polymerization process. Every 30 min, the rates of water flow and rejection were evaluated. The study’s findings demonstrated that the membranes have soft hydrophilic surfaces, and by varying concentrations of nanocomposite materials in a prescribed way, the water flux increased up to 30.8 L/m2h, which was notable when compared to the water flux of the straightforward polyamide membranes. Our findings revealed that nanocomposite membranes significantly decreased fouling and clogging, and that the rejection rate was greater than 97 percent for all pyrrole-based membranes. Finally, an artificial neural network is utilized to propose a predictive model for predicting flux through membranes. The model benefits hyperparameter tuning, so it has the best performance among all the studied models. The model has a mean absolute error of 1.36% and an R2 of 0.98.

1. Introduction

One of the most necessary reasons for research on water desalination systems and their development is the problem of water shortage and the resulting crises in the world. More than half of the world is considered to be arid and semi-arid areas; therefore, it is not unreasonable to expect a water crisis in it [1,2,3]. Therefore, the need to renew water resources and find a solution to the water shortage crisis is vital. One of the most important ways to mend this problem is to use water purification systems for wasted water resources [4,5,6,7,8]. Among the purification systems with desalination, reverse osmosis has been used for many years due to the reduction in energy consumption and high efficiency. At first, reverse osmosis was used to desalinate sea and salt water [9,10].
The lack of water resources, qualitatively and quantitatively, is considered a serious threat to the world’s population, especially developing countries. 13% of the world’s population still does not have access to safe water sources [11]. However, the common methods of water purification are not the answer to the existing problems. This research tries to solve this problem with nanotechnology methods and compounds. In recent years, nanoparticles have been researched in various areas, including multiphase flows [12,13,14,15] and catalysts [16]. Nanofluids are extensively studied to enhance heat transfer capabilities [17,18]. However, recently, nanoparticles have been developed for water purification worldwide. Water purification is divided into filtration and disinfection, and nanotechnology is used in both parts [19,20]. Nanotechnology provides many nanomaterials for the treatment of surface water, underground water, and wastewater and the removal of toxic metal and organic, inorganic pollution and microorganisms. This research solves the problems in the field of water purification based on various nanomaterials. Using nanofiltration, natural organic substances, microbial and organic pollution, nitrate, and arsenic can be removed from the surface and underground water [21]. Utilizing reverse osmosis, organic and inorganic compounds and microbial contamination can be removed from the water and desalinated [22]. Nanomaterials can eliminate the contamination of toxic metal ions, inorganic and organic compounds, and microorganisms in surface water, underground water, and wastewater [23]. With the help of nano adsorbents, catalysts, and nanomembranes, microbial and chemical pollution of water can be removed [24]. Many research studies are related to the utilization of nanomembranes in reverse osmosis desalination [25,26,27,28,29,30]. A thorough review of the methods is presented in the following.
The increased industrial demands to conserve water, reduce energy consumption, control corrosion, and recycle useful materials from waste streams led to the creation of new and economic applications for these membranes [31,32,33,34,35,36]. In addition, the advancement of biotechnology and pharmaceutical knowledge, along with the development of membrane use, made the method of using membranes a vital step in the separation operation in order to save energy and prevent the heat loss of products, preferably to the distillation method [37]. Scientific research on membrane principles was established by FILMTEC with the production of the FILMTECFT30 membrane in 1963 [38].
With the development of reverse osmosis membrane technology, many changes have been made to optimize membrane performance and energy [39,40]. After the construction of asymmetric membranes, thin-shell composite membranes made significant progress due to the high potential of modification in the structure and optimization of membrane efficiency. Thin shell membranes consist of three layers, including the bottom layer of non-woven fabric, the middle layer of polymers such as polysulfone or polyether sulfone, and the upper layer of thin shell membranes, which are generally made by surface polymerization. The last layer, which is called the polyamide layer, is the most effective layer for salt purification and making a reverse osmosis membrane because it minimizes the holes on the membrane surface to the point where only water molecules can pass through the membrane surface [41,42].
With the development of nanoscience, the water treatment industry has undergone significant changes. Nanoparticles have been used in the absorption of various heavy metals such as lead [43], chromium [44], virus removal from drinking water [45,46], and removal of other pollutants from water. Additionally, in the synthesis of polyamide membranes, nanoparticles have been used to improve the surface. All nanocomposite membranes have had better performance and higher efficiency compared to simple polyamide membranes. Among all the nanocomposites used in membrane synthesis, carbon nanotubes are used in a variety of research [47] because of their special structure and unique features.
In order to optimize the performance of membranes, various materials have been used to modify the nanotubes, and new nanocomposites have been produced, among which silver nanotubes and multiwalled carbon nanotubes can be used to improve the influx by 20% [48]. By using different percentages of HNO3 and H2SO4 acid, Kim et al. [49] created the O-H functional group for more hydrophilicity. Moreover, Barona et al. [50] used single-walled carbon nanotubes along with aluminosilicate for a significant increase in the influx. Additionally, Chan et al. [41] used single-walled carbon nanotubes with zwitterion groups to improve the reverse osmosis polyamide membrane and increase the influx from 12 L m 2 h to 32.8 L m 2 h .
Working for long periods of time, current membranes, and in general, simple polyamide membranes are faced with the clogging phenomenon. This clogging can significantly reduce the membrane influx. Therefore, several methods have been used to prevent the reduction of the influx and the occurrence of concentration polarization on the surface of the membrane [51]. Since the mechanism of reverse osmosis membranes is the diffusion of particles on the membrane surface, the modification of the membrane surface by using materials that can improve the diffusion of water particles and reduce the concentration of fat and salt on the membrane surface has increased. Nanoparticles, especially those with hydrophilic groups on their surface, have been effective in this field. Researchers have shown that membranes with hydrophilic nanocomposites increase the influx and significantly reduce clogging [52].
While using conventional methods to develop the predictive model was common [53,54,55,56,57] in all areas, recently, more research has been devoted to studying the predictive models proposed using machine learning algorithms [58,59,60,61,62,63]. To this end, some studies have been concerned with using artificial neural networks (ANN) [64,65], genetic algorithms, and other machine learning algorithms [66,67,68] in engineering problems. Ruiz-Garcia and Feo-Garcia [69] applied artificial neural networks to a seawater reverse osmosis (SWRO) and estimated the system’s cost. Joy et al. [70] utilized response surface methodology and machine learning algorithms to find the optimized case for the removal of organics from reverse osmosis. The output parameters of their study were the total organic carbon removal and chemical oxygen demand removal. Salgado-Reyna et al. [71] carried out an experiment in a can manufacturing process. They studied the wastewater from this system, and they used the wastewater to desalinate it using reverse osmosis. Through this process, they gathered data to propose models for predicting total dissolved solids and maximum effluent recovery. Their model had a coefficient of determination of more than 0.97.
In this research, a nanocomposite containing carbon nanotubes was made due to the mentioned effects in improving the performance of the membranes with carbon nanotubes. However, because of the increase in the hydrophilicity of the membrane surface, materials with hydrogen bonds were selected. Finally, the use of raw carbon nanotubes coated with pyrrole as a new nanocomposite was investigated to check the performance of the membrane. Additionally, the increase of the influx by these changes, the decrease in the amount of membrane surface clogging in a specific period of time, and the long-term stability of the membrane surface are determined. Finally, using the data of the research, we have proposed predictive models using artificial neural networks to predict the influx of the membrane and the clogging of the membrane.

2. Materials and Methods

Multiwalled carbon nanotubes (with a length of about 10 to 20 μm, an outer diameter of 20 to 30 nm, and an inner diameter of 5 to 10 nm) were purchased from CNT Co., Ltd., (Yeonsu-Gu, Incheon, Republic of Korea). 250 mL of pyrrole was purchased from Sigma Aldrich (St. Louis, MO, USA). The polysulfone grains for making the ultrafiltration layer were obtained from BASF, Ludwigshafen, Germany. Other materials used include methylphenylenediamine (MPD), dimethylformamide (DMF), camphor sulfonic acid, polyvinylpyrrolidone (PVP), Sodium dodecyl sulfate powder, triethylamine (TEA), and an inorganic solvent was provided, which is Hexane from Merck, Darmstadt, Germany. In order to perform the clogging test, 250 g of bovine serum albumin (BSA) was purchased from Merck. Hollytex 3329 non-woven fabric was obtained from Merck, Germany, with a thickness of 170 μm. Other materials used for the synthesis of Multiwalled carbon nanotubes, including toluene sulfonic acid and aluminum persulfate, were also obtained from Merck.

2.1. Membrane Synthesis

To synthesize the membrane in this research, we first made the ultrafiltration support, and then it was stretched on the non-woven fabric. Then, the membrane was placed in three different baths, including the MPD bath (in the synthesis of the nanocomposite membrane, nanotubes are also added to this bath), the TMC bath, and finally the hexane bath to make the top layer.
The reverse osmosis thin-shell membrane was fabricated in two steps. First, the polysulfone support was formed on the non-woven fabric by the phase separation method, and then a selective polyamide layer was made on it by the interfacial polymerization method by the reaction of two monomers. To make the support, polysulfone powder was first poured into the DMF solution, and then it was stirred in a mixer for 24 h at a temperature of 50 degrees Celsius at a constant speed until it dissolved. Finally, the prepared solution was placed in a dark space to reduce the number of bubbles. The polyester substrate was used for membrane strength. Then, the prepared solution was poured on the same substrate, and a layer of it with a thickness of about 170 microns was stretched on the polyester layer by elastic film, and then it was quickly immersed in the anti-solvent water bath until it solidified [72].
The support prepared for the reverse osmosis membrane was placed in two separate baths containing MPD and TMC, and after combining the MPD solution with distilled water for 10 min, it was poured onto the polyether sulfone membrane, and the rest of the MPD was removed from the membrane by a plastic roller tube. After that, the membrane was saturated with MPD for 2 min in the solution containing 0.15% by the weight of TMC and placed in hexane solvent. After performing these steps and the final washing in hexane, in order to produce a dense polyamide layer, the constructed membrane was kept at 70 degrees Celsius for 10 min. Finally, the prepared membrane was kept in distilled water.
In the next step, a raw carbon nanotube coated with polypyrrole was prepared. For this purpose, 95.15 g of ammonium persulfate was mixed with 375 mL water for 10 min. Then, the combination of toluene sulfonic acid, including 37.13 g of acid and 25 mL of water, was added to the previous solution and stirred for 15 min. After performing the mentioned steps, 5 mL of pyrrole was mixed with water, 0.048 g of multiwalled carbon nanotube was added to the solution, and it was ultrasonicated for 10 min. Then, the solution was slowly stirred into the acid solution for 4 h at room temperature. Next, to separate the black solution from the bottom of the container, a centrifuge was used with a maximum speed of 4200 rpm for 8 min. Finally, the obtained black material was placed in a vacuum oven at a temperature of 60 degrees Celsius for 48 h to dry the solution. After making the nanocomposite for the synthesis of nanocomposite membranes, the modified carbon nanotubes powder was placed in the TMC solution in the first stage of surface polymerization, i.e., in the TMC solution, and the ultrafiltration membrane was made like simple polyamide membranes was placed in this solution for 10 min. The rest of the steps were carried out in the same way as the simple polyamide membrane synthesis. The fabricated membranes were evaluated in influx, desalination, and clogging test parameters.

2.2. Membrane Quality Check

To identify the nanoparticles and how they combine and form the polyamide layer on the membrane, SEM analysis was used by the TESCAN measurement device made in the Czech Republic. Based on the identification of surface roughness and the topology on the membrane surface, AFM analysis was used. To calculate the roughness in the membrane analysis, three parameters were used: height difference between the highest edge and the lowest with the S y parameter, the uniformity of the ups and downs with the S q parameter, and the average roughness of the entire membrane surface with S a . The device used to evaluate membrane surface roughness was DualScope C-26, DME Corp. Denmark, and DME/AFM software version 2.1.1.2 was used to calculate the mentioned parameters.
FTIR analysis was used to detect the chemical bonds made after the reaction. In this analysis, new compounds of the manufactured composite material were identified, and the existence of bonds formed after the material was modified or combined with new materials was confirmed [73]. In this research, FTIR analysis was used to modify multiwalled carbon nanotubes and the presence of hydroxide groups on the nanotube surface. All FTIR analyses were performed with an ABB-104 Bomem FTIR spectrometer (MB) (ABB Ltd., Zürich, Switzerland).
Contact angle analysis was used to evaluate the hydrophilicity of the manufactured nanocomposites. If the contact angle of water molecules with the membrane surface is lower, the hydrophilicity of the membrane surface is higher. The contact angle measuring device was G10, Kruss, made in Germany.

2.3. Membrane Analysis and Test

All fabricated membranes were tested in the device. The test device is made of a pump, feed tank, and tube with an effective surface of 36 cm 2 ( 9   cm × 4   cm ) with the lateral flow, the membrane is placed in the tube, and the water passes through the membrane and returns to the tank. Figure 1 shows the details of this study’s reverse osmosis purification system. According to Figure 1, three cells are placed side by side, and water enters the cells from the feed tank through a pump. The pressure gauge is set at the beginning of each cell, which is about 16 bar in the first cell, 15 bar in the second cell, and about 14 bar in the third cell. The average pressure is calculated and assumed constant for all results for influx calculations.
The amount of water passing through the membrane enters the container for measuring water volume through the tube at the end of it, and the water permeability is determined by Equation (1) [74].
J = V p A × t
In this equation, J is the passing flux of water in terms of L / m 2 h , Vp is the volume of water passing through the membrane in liters, A is the effective surface of the membrane in square meters, and t is the time of the passing water in a certain measured volume in hours.
To determine the amount of salt removal, an electrical conductivity meter model TES made in Taiwan was used. The salt ion concentration in the tank and in the purified water, after passing through the membrane, is measured by Equation (2) [74].
R = 1 c p c f × 100
where C p is the concentration of salt in the purified water, and C f is the concentration in the feed solution in terms of microsiemens/cm.
All experiments were carried out under salt pressure in the feed tank equivalent to the electrical conductivity of 4000 microsiemens/cm. It should be noted that all concentrations were calculated based on microsiemens/cm using an electrical conductivity meter and finally included in the mentioned formulas to calculate the influx and the percentage of salt rejection. The water temperature in the feed tank was kept almost constant. Changes were made only in the type of membrane, and different membranes (simple polymer membrane and modified nanoparticle membrane) with different amounts of salt removal and clogging effects were investigated. The membrane clogging resistance test was done by the same device with BSA protein solution filtration. All the membranes were prepared for the clogging test for 24 h after the influx and rejection tests.
In the present study, raw multiwalled carbon nanotubes coated with pyrrole in four different weight percentages (0.001, 0.002, 0.005, and 0.01) were prepared for the test. To check the performance of the membrane, each of these concentrations was brought with the code R-CNT-P(1,2,3,4), which represents raw carbon nanotubes with pyrrole. Additionally, to show simple polyamide membranes in the diagrams, the Bare-PA code was used. Each test consisted of two stages, and the first test was conducted for 90 min of each membrane to evaluate the amount of water passing through the surface of the membrane and to measure its percentage. At this stage, there was only salt-water solution with a concentration of 4000 microsiemens/cm water-salt in the feed tank. In the second stage of the test, 0.4 g of serum albumin fat was added to the water-salt solution with the same specified concentration. Each clogging test lasted for 24 h, and the water flow rate was measured every hour.
For each specific weight percentage with a specific carbon nanotube, six similar membranes with an area of 36 cm 2 were made, although a simple polyamide membrane was made and tested to compare the difference between a simple membrane and a nanocomposite.

3. Results and Discussion

This section may be divided by subheadings. It should provide a concise and precise description of the experimental results, their interpretation, as well as the experimental conclusions that can be drawn.

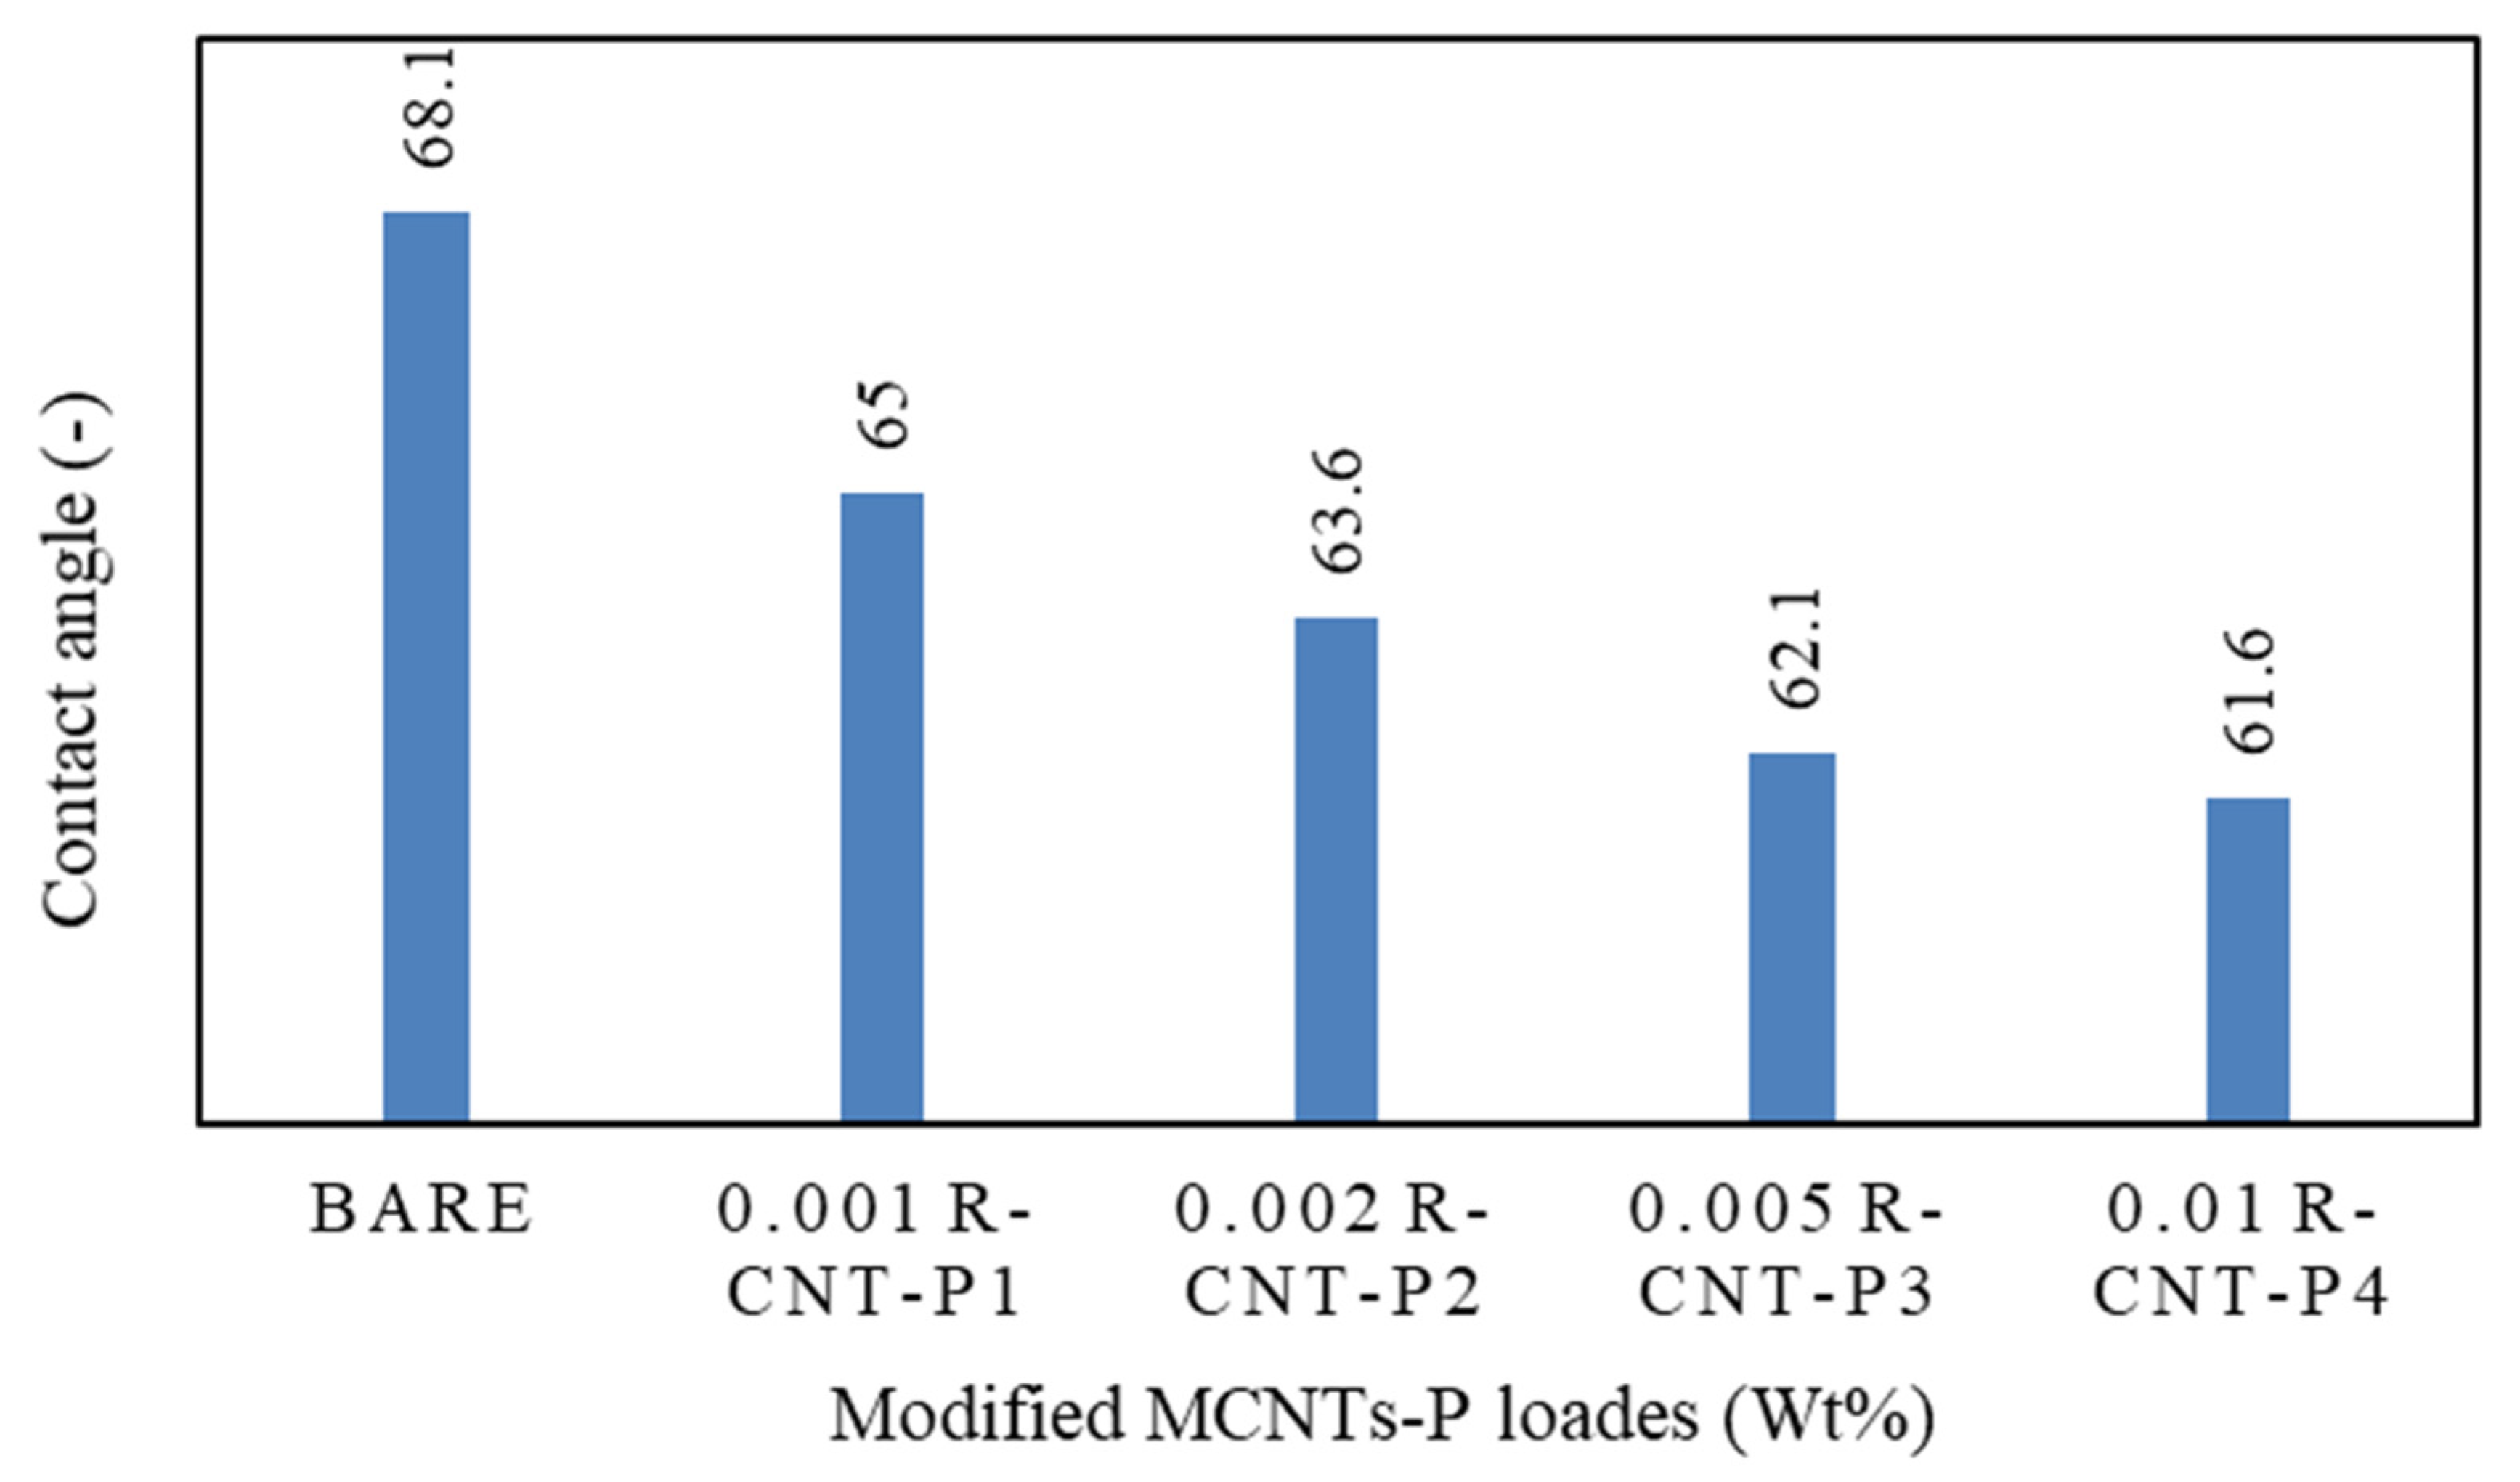
3.1. Investigation of Synthesized Membranes for Reverse Osmosis Process

Figure 2 shows the SEM analysis for raw carbon nanotubes with different concentrations of pyrrole. The amine group on the surface of the pyrrole-containing membranes has made them denser, which can be seen in Figure 2.
In the results of [75], it is mentioned that, in raw carbon nanotubes with pyrrole, the surface of the nanotube is softer than without pyrrole, and this is due to the structure of the bonds created by the pyrrole coating, which has caused a significant increase in influx and improved clogging.
Figure 3 shows the FTIR analysis for raw and pyrrole-coated multiwalled carbon nanotubes. For the modified carbon nanotube, two new peaks related to the hydrogen band with wavelengths of 687 (N-H) and 3300 (C-H) were observed, and the presence of the hydrogen group is proof of the modification of the carbon nanotube. These hydrogenated bonds contribute to the hydrophilicity of the carbon nanotube and improve the passage of water through the membrane. Additionally, the peaks of 1385 and 1540 are created due to the type 2 amine functional group on the surface of the nanotube [76].
Contact angle analysis was used to determine the hydrophilicity of membranes. According to Figure 4, the contact angle of water with the membranes with raw nanotubes coated with pyrrole is significantly lower than the rest of the manufactured membranes, and this means that water droplets are absorbed by the raw nanotubes coated with pyrrole. The absorption of water droplets into raw nanotubes along with pyrrole creates a hydrophilic layer on the surface of the membrane and prevents fat from reaching it, which leads to a reduction in clogging. This increase in the hydrophilic surface in the fabricated nanocomposite is due to the presence of hydrogen bonds on the surface of carbon nanotubes. Therefore, the hydrophilicity of modified carbon nanotubes is higher than other polyamide membranes [77].
AFM analysis was performed to check the surface roughness and prove the clogging performance based on the used nanocomposites. This test was performed for three types of membranes in three repetitions, and finally, the average data obtained are presented in Table 1. The surface roughness parameters were carefully checked by DME/AFM software version (2.1.1.2), and among these parameters, the most important parameter that is considered to check the roughness level is the S a parameter. This parameter considers the average roughness of the entire surface, and according to the results, the best membrane in terms of the lowest roughness is the MACNTs-PPy nanocomposite membrane with a concentration of 0.001%, and it also showed the lowest amount of clogging in the clogging reduction graph.
The roughness in the nanocomposite membranes with pyrrole decreased to a suitable ratio, but with the addition of nanoparticle concentration higher than 0.005, the roughness increased again. This increase may be due to the ionic interaction between the new groups added on the surface of the membrane, which in some areas leads to folding and increasing the roughness. Two reasons can be proposed for the change of membrane surface roughness compared to simple polyamide membranes. First, with the addition of N-H groups, the empty spaces on the membrane surface have been filled and made the membrane smoother, and the second reason can be attributed to the migration of carbon nanotubes on the membrane surface after being dipped with membrane-forming materials and making the surface uniform with its particles [78]. Surface topology analysis, according to Figure 5, showed that the roughness has decreased compared to the plain polyamide membrane, and the surface of the membrane has become smoother. In general, the structure is observed in all simple polyamide membranes and nanocomposite membranes.

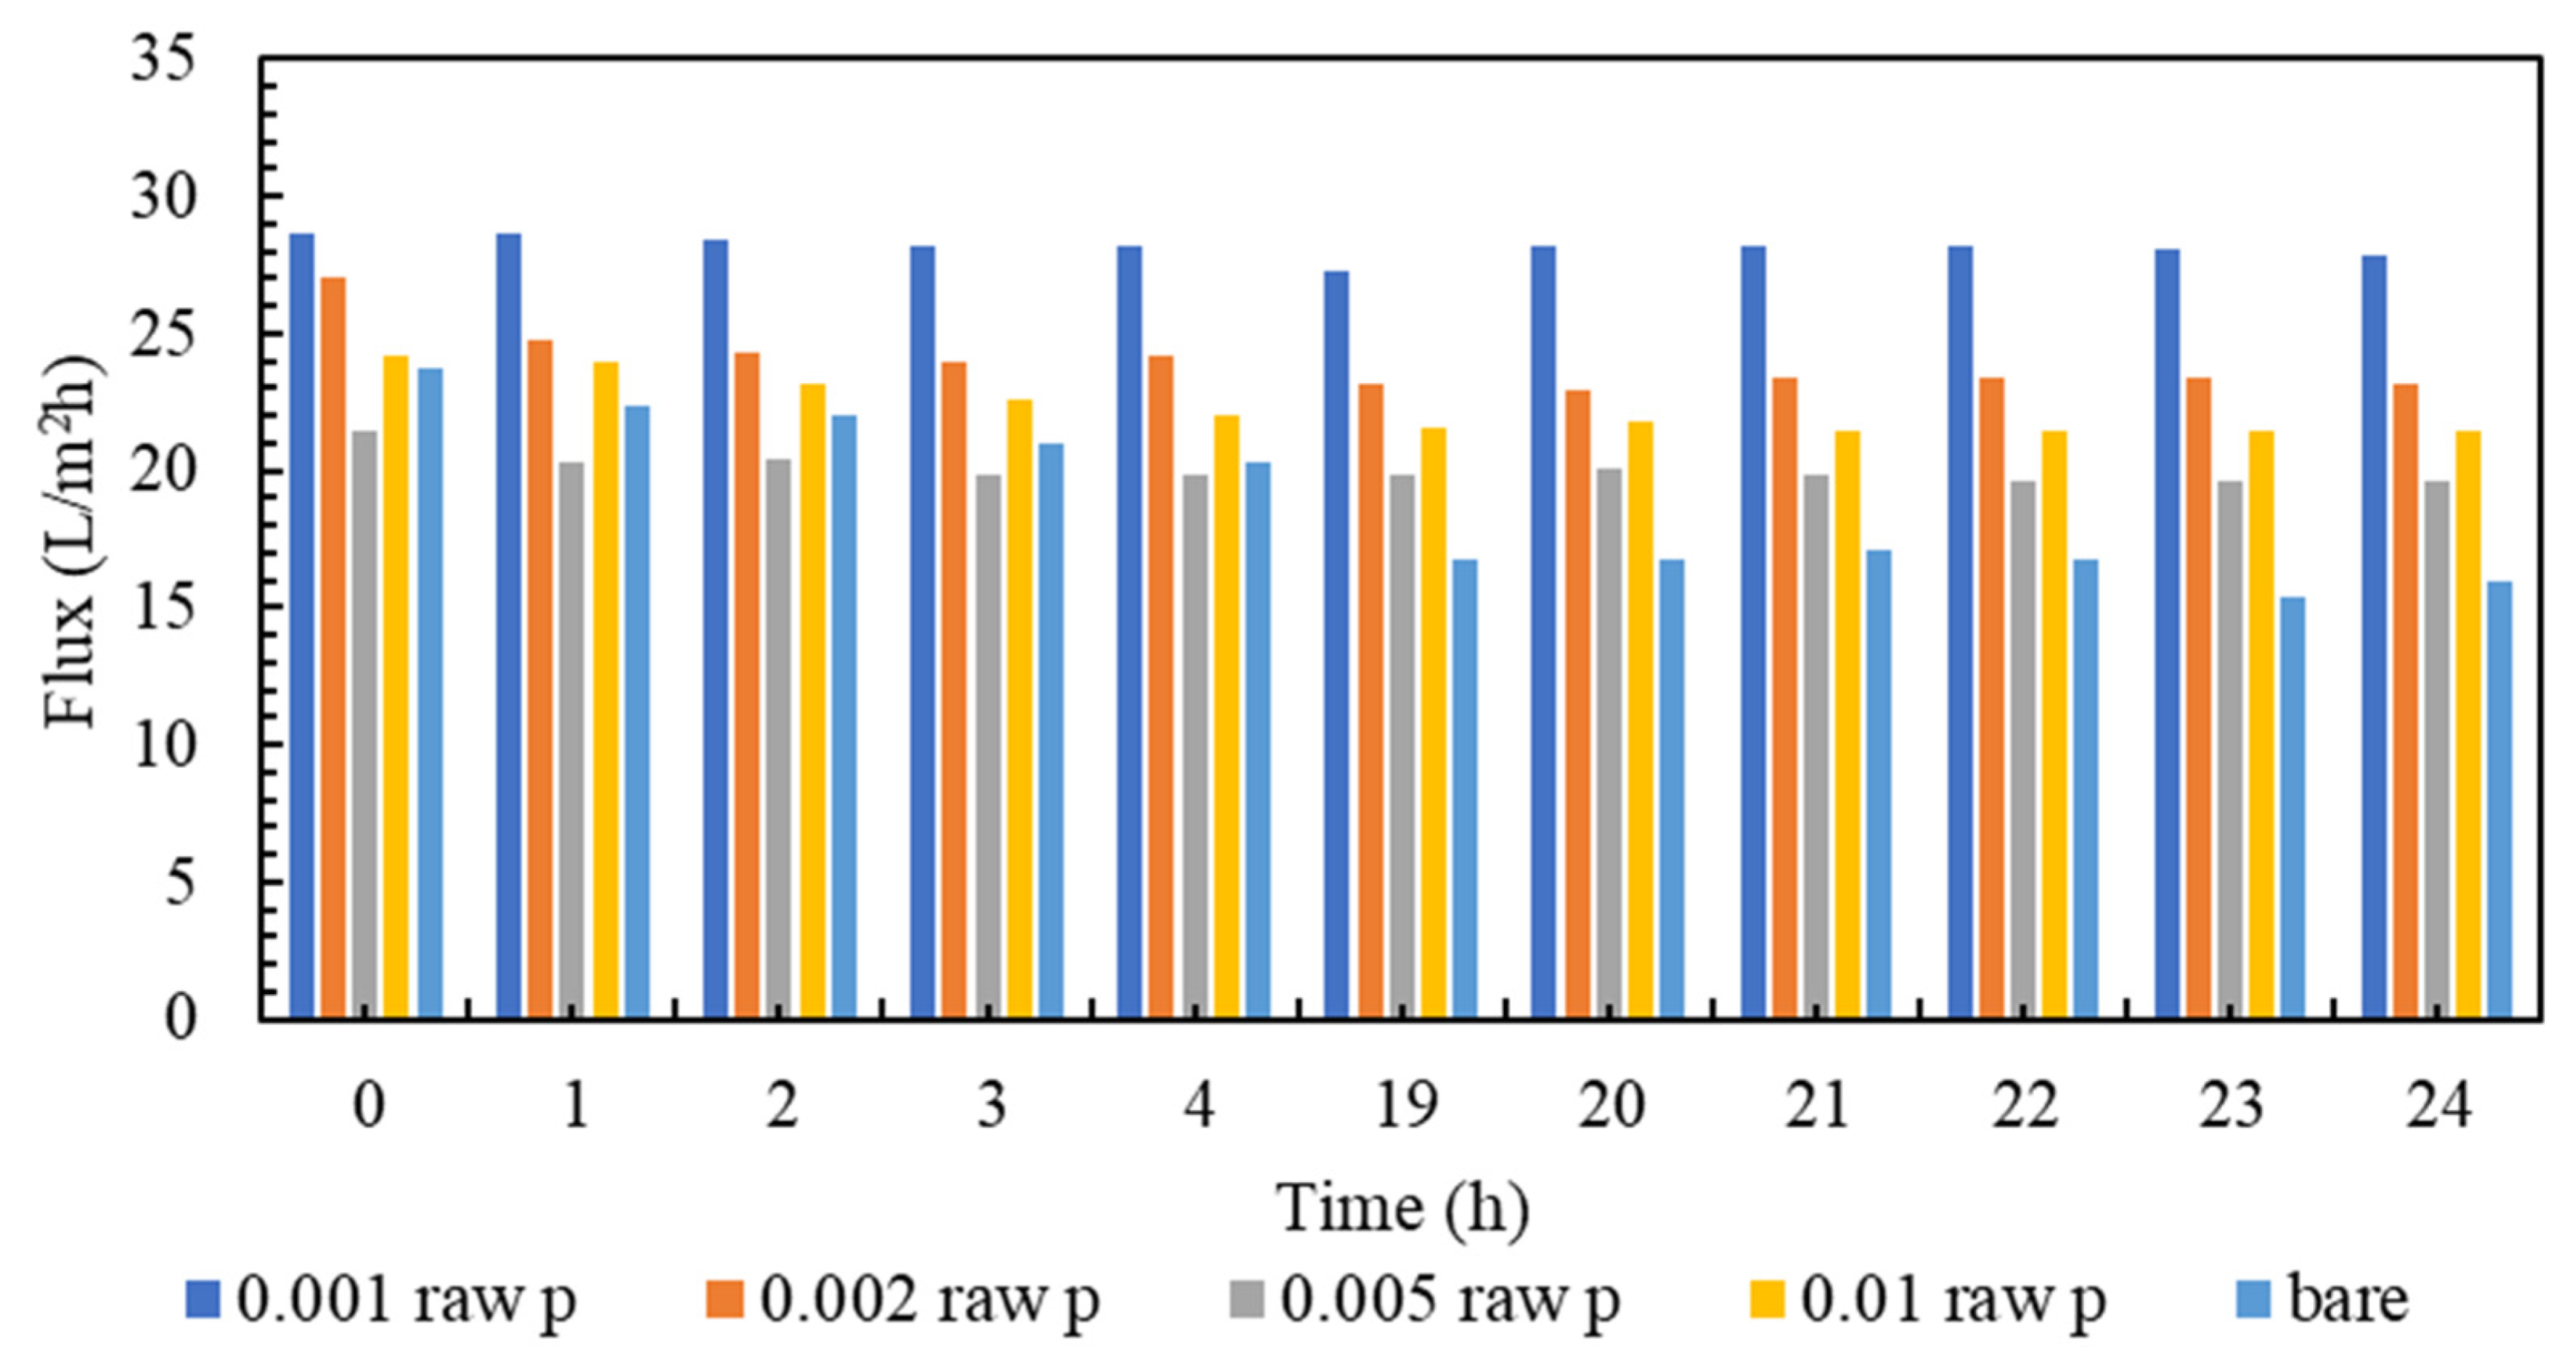
3.2. The Performance of Reverse Osmosis Membrane in Transmittance and Rejection

The transmittance and percentage of salt removal from raw nanotube membranes are given in Figure 6. As can be seen, the water flux passed through the membranes with raw nanotubes higher than the membrane without nanotubes. This phenomenon can be due to the hydrogen bond and the sliding of water molecules from the surface of nanoparticles, as well as the tubular structure of carbon nanotubes and the passage of water through the nanotube channels [79]. As seen in the SEM analysis, the carbon nanotubes made the membrane surface smoother than the membranes without nanoparticles. Therefore, the amount of water passing through these membranes is higher. The amount of water flux increases with the increase in the concentration of nanotubes, so that, at the concentration of 0.001%, the amount of passing water flux is 29.5 L / m 2 h , but at the next concentrations, especially at 0.005%, the flux is 30.8 L / m 2 h . According to Figure 6, the salt rejection in all membranes with pyrrole is higher than the normal membrane, and it is above 95%. According to Figure 6, the highest amount of salt removal is related to raw nanotubes with pyrrole at a concentration of 0.001%, which can be due to the good spread on the surface of the membrane and the way the molecules are placed on it, the functional groups with hydrogen on the surface of the membrane, which has happened well in this membrane [80]. Indeed, other membranes also significantly remove NaCl salt from the feed solution, with a very small difference compared to this membrane. Additionally, compared to the commercially made membranes and according to the method of synthesis of the membrane, it can be said that it has an acceptable performance compared to the materials used.

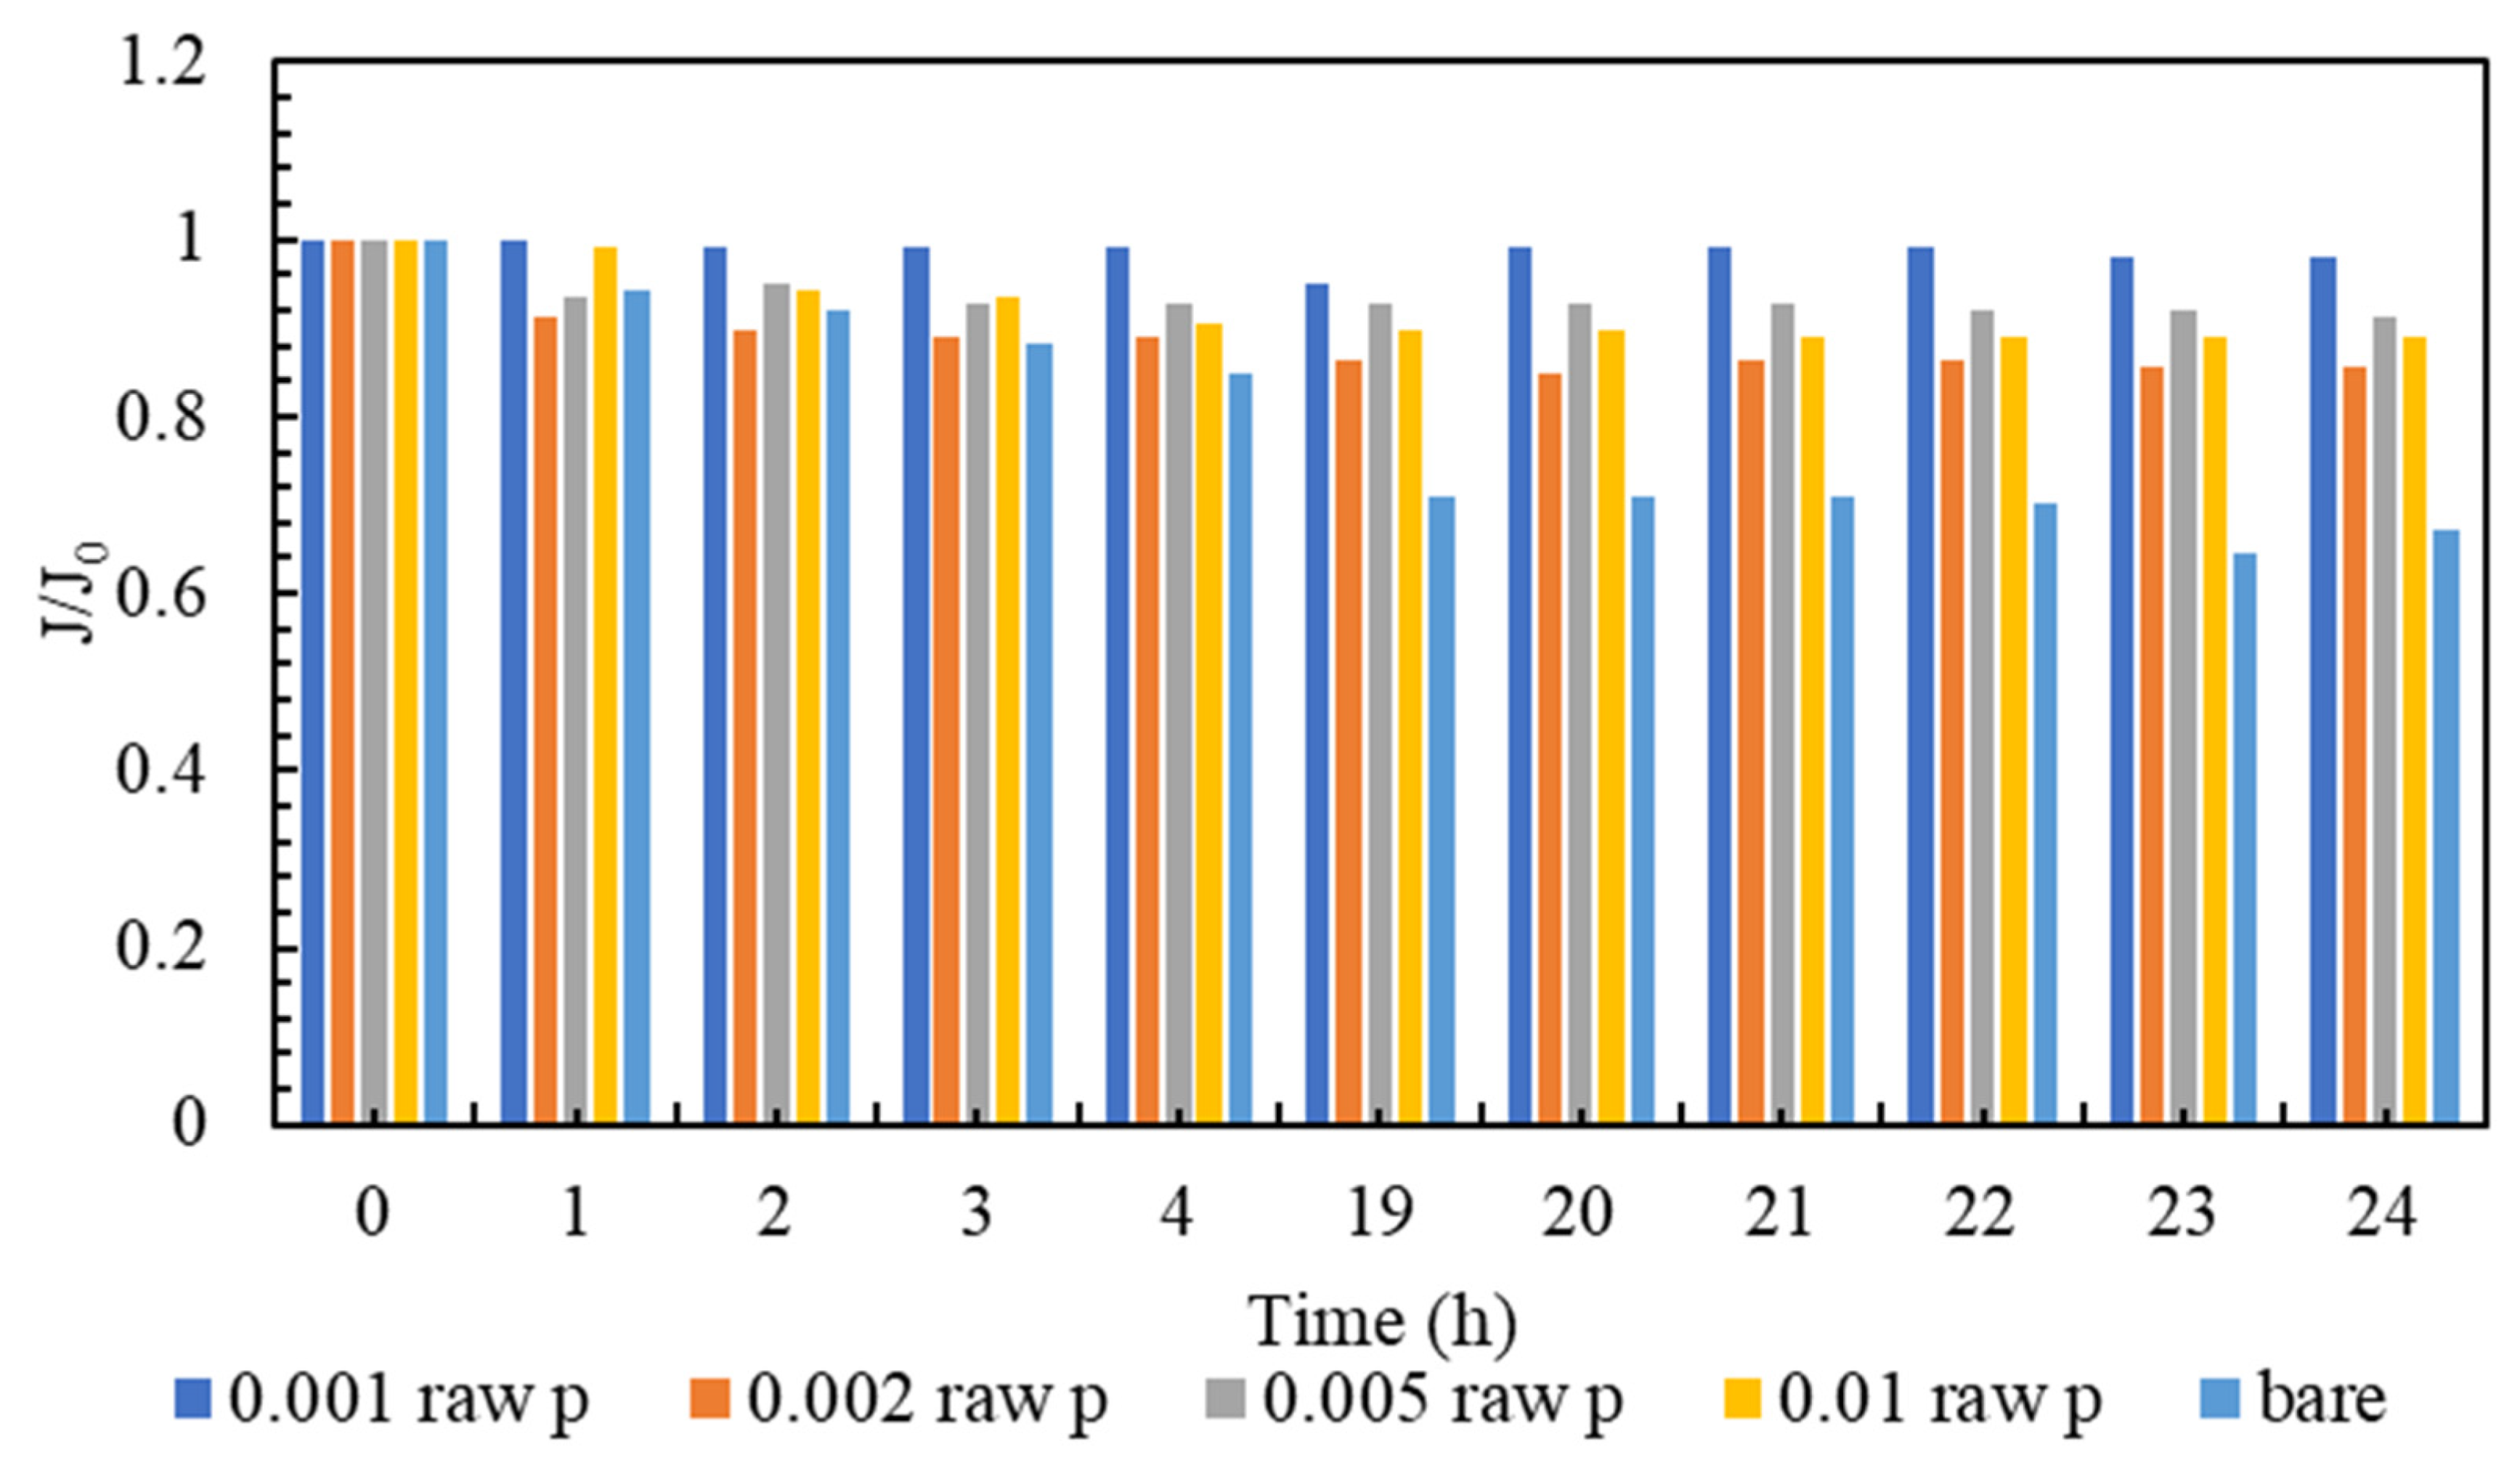
3.3. Membrane Clogging

Membrane clogging is one of the most important parameters of membrane investigation. In general, the lower the clogging, the better the performance of the membrane. Nowadays, various technologies are used to improve membrane performance. The amount of clogging in membranes with nanotechnology has been significantly reduced [81,82]. The clogging of the fabricated nanocomposite membranes and the comparison with the plain membrane are shown in Figure 7. As can be seen in Figure 7, all nanocomposite membranes have a higher flow rate than polyamide membranes within 24 h. It must be mentioned that, in order to gather enough data for the artificial neural networks, the membranes are evaluated every hour, and the data is stored. However, in the following section, the representatives of the mentioned data are presented. Additionally, among all the tested nanocomposite membranes, concentrations of 0.001% and 0.005% have the highest flux even at the end of the 24 h test compared to other membranes. Figure 8 is the normalized graph of all the nanocomposite membranes. According to Figure 8, all the nanocomposite membranes have uniform stability, and during 24 h, they are more stable than the simple polyamide membranes. The most stable membrane in the normalized diagram corresponds to the concentration of 0.001%. Additionally, in the concentration of 0.005%, proper stability and uniform flux were observed for 24 h. This concentration has the highest amount of flux, and it can be said that it has the best performance among all membranes.

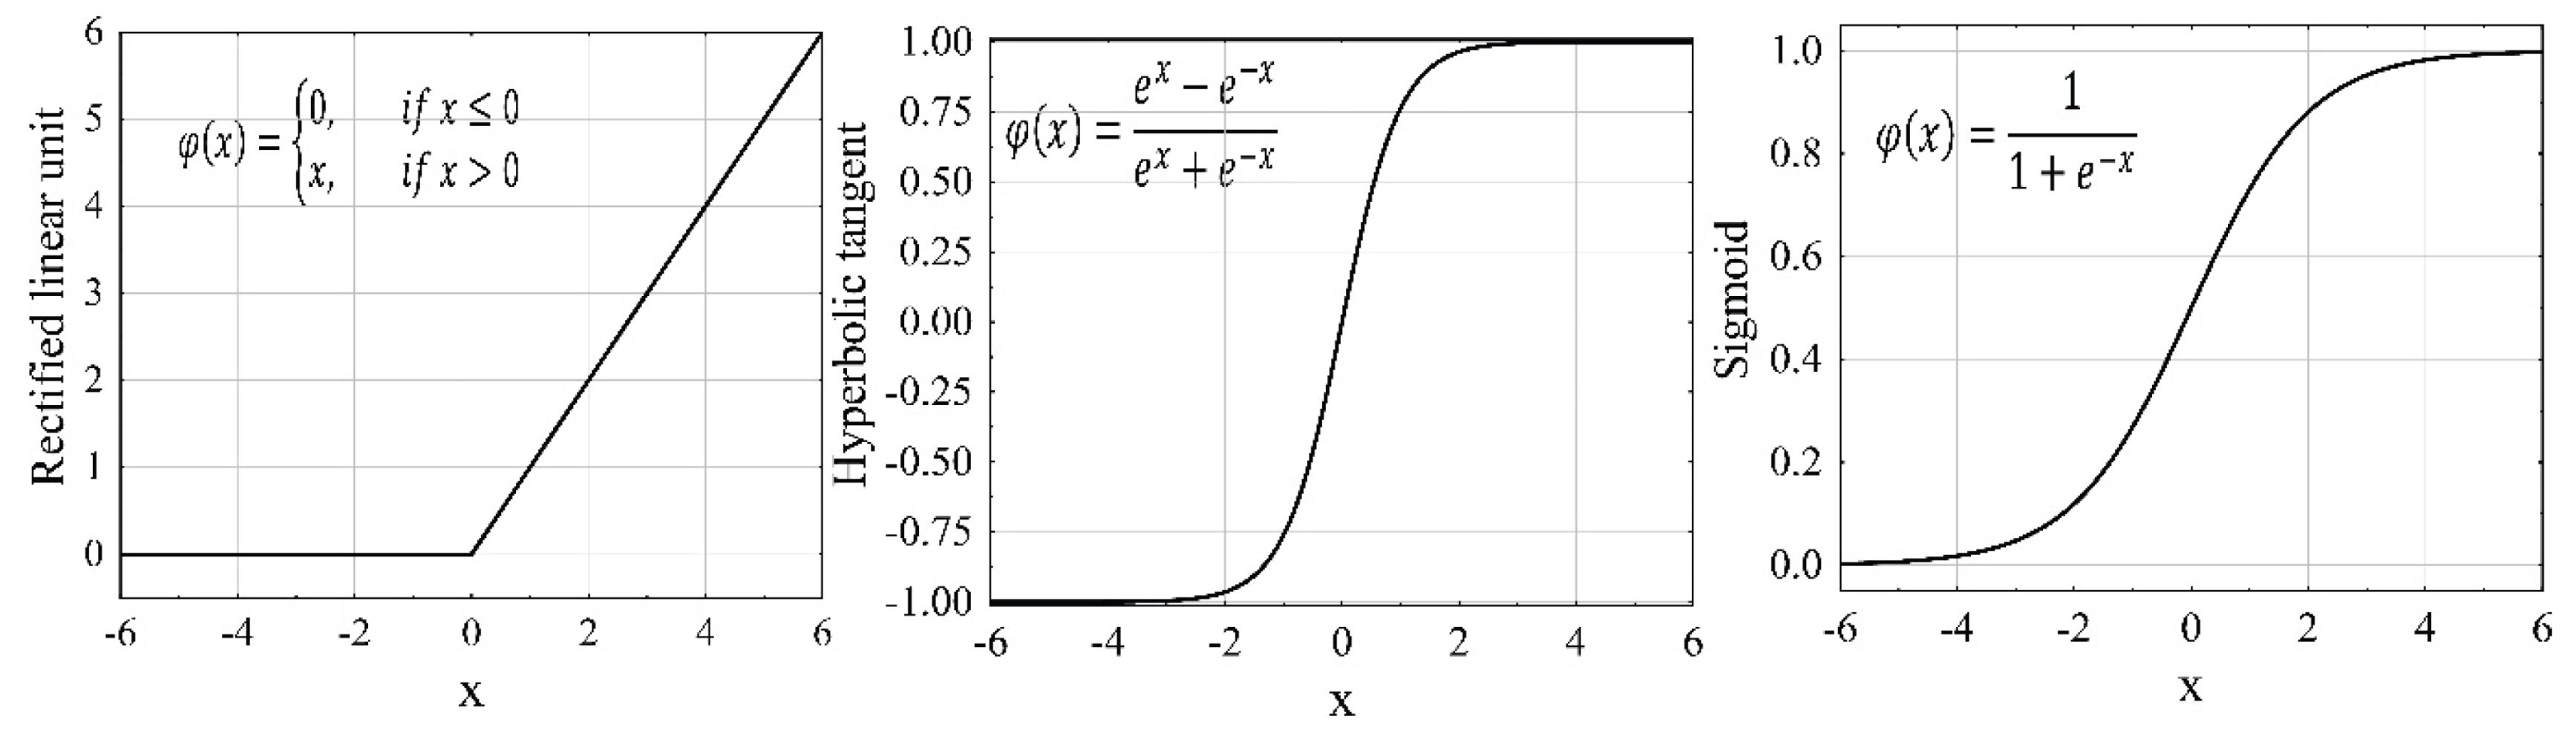
4. Artificial Neural Networks

In order to propose models for the two main parameters of the present study, the data from the experiments are used. We aim to propose a predictive model for water influx of a reverse osmosis desalination system using multiwalled carbon nanotubes by artificial neural networks (ANNs) [83,84]. Therefore, in order to create, more than 125 numerical cases are simulated using the numerical cases with different boundary conditions. Then, we extracted the data from the simulations and divided the independent data into two categories, training and testing, the ratio of which is 70–30%. Next, by using the hyperparameter tuning, we have optimized the prediction capabilities of the presented models. Additionally, the results are evaluated by using the mean absolute error (MAE) and coefficient of determination ( R 2 ). The following sections present the optimization of hyperparameters and the results. Figure 9 shows the widely used activation functions.

4.1. The Hyperparameter Tuning Process

As was already mentioned, selecting the optimal model to forecast an output parameter is a process that has to be done carefully. Therefore, the hyperparameter tuning of the flux is presented.
In the first step of this process, as mentioned in [61,63], the structure of the hidden layers is investigated. We studied whether increasing the number of hidden layers would significantly affect the predictive capabilities of the output parameters. In Table 2, the structures are analyzed. The simplest structure comprises one hidden layer with 32 neurons, but the most complicated one consists of eight layers with different numbers of neurons.
It is clear that the model improves in accuracy as the number of neurons and hidden layers increases; however, when overfitting occurs, this accuracy decreases and the reverse trend is shown. Consequently, the chosen model is (32,64,128,64,32). Table 3 examines the effects of various activation functions for the output layer after choosing the number of hidden layers.
The batch size, or the amount of data points traveling through the feed-forward process before the backpropagation starts, is another model design component. In other words, batch size refers to the number of data points the neural network processes before updating its weights and biases. As shown in Table 4, 32 is the chosen batch size.
Finally, as seen in Table 5, the number of epochs is contrasted. The model with 20,000 epochs is the ideal option.
The deepest ANN or the slowest model is not always the most excellent choice for hyperparameters. Hence, a search for the optimum model architecture should be conducted before model selection. This selection procedure is carried out to determine the ideal model architecture for each research outcome. Table 6 displays the final chosen models for all sizes of interest. Among the examples examined, these models perform the best.
Therefore, in the following sections, the results of the predictive models are presented.
The flux is predicted using the ANN model, and the results are illustrated in Figure 10. This model inherited the hidden layer structure of (32,64,128,64,32). It is run for 40,000 epochs with a batch size of 8. The input parameters are time, surface roughness, MWCNT-P concentration, and contact angle. The best case is the y = x line where the predicted and numerical results are the same. Moreover, 10% error lines are plotted to give a better sense of the model capabilities.
The results have shown great accuracy. As mentioned previously, 70% of the extracted data from the experimental results are used for training the models. Then, the other 30% is utilized for the evaluation and testing of the model. Figure 10 demonstrates the accuracy of the predictive models, and the mean absolute error is used. Additionally, the R 2 is used to measure the model’s ability to predict flux. The mentioned parameters are 1.38% and 0.98, respectively.

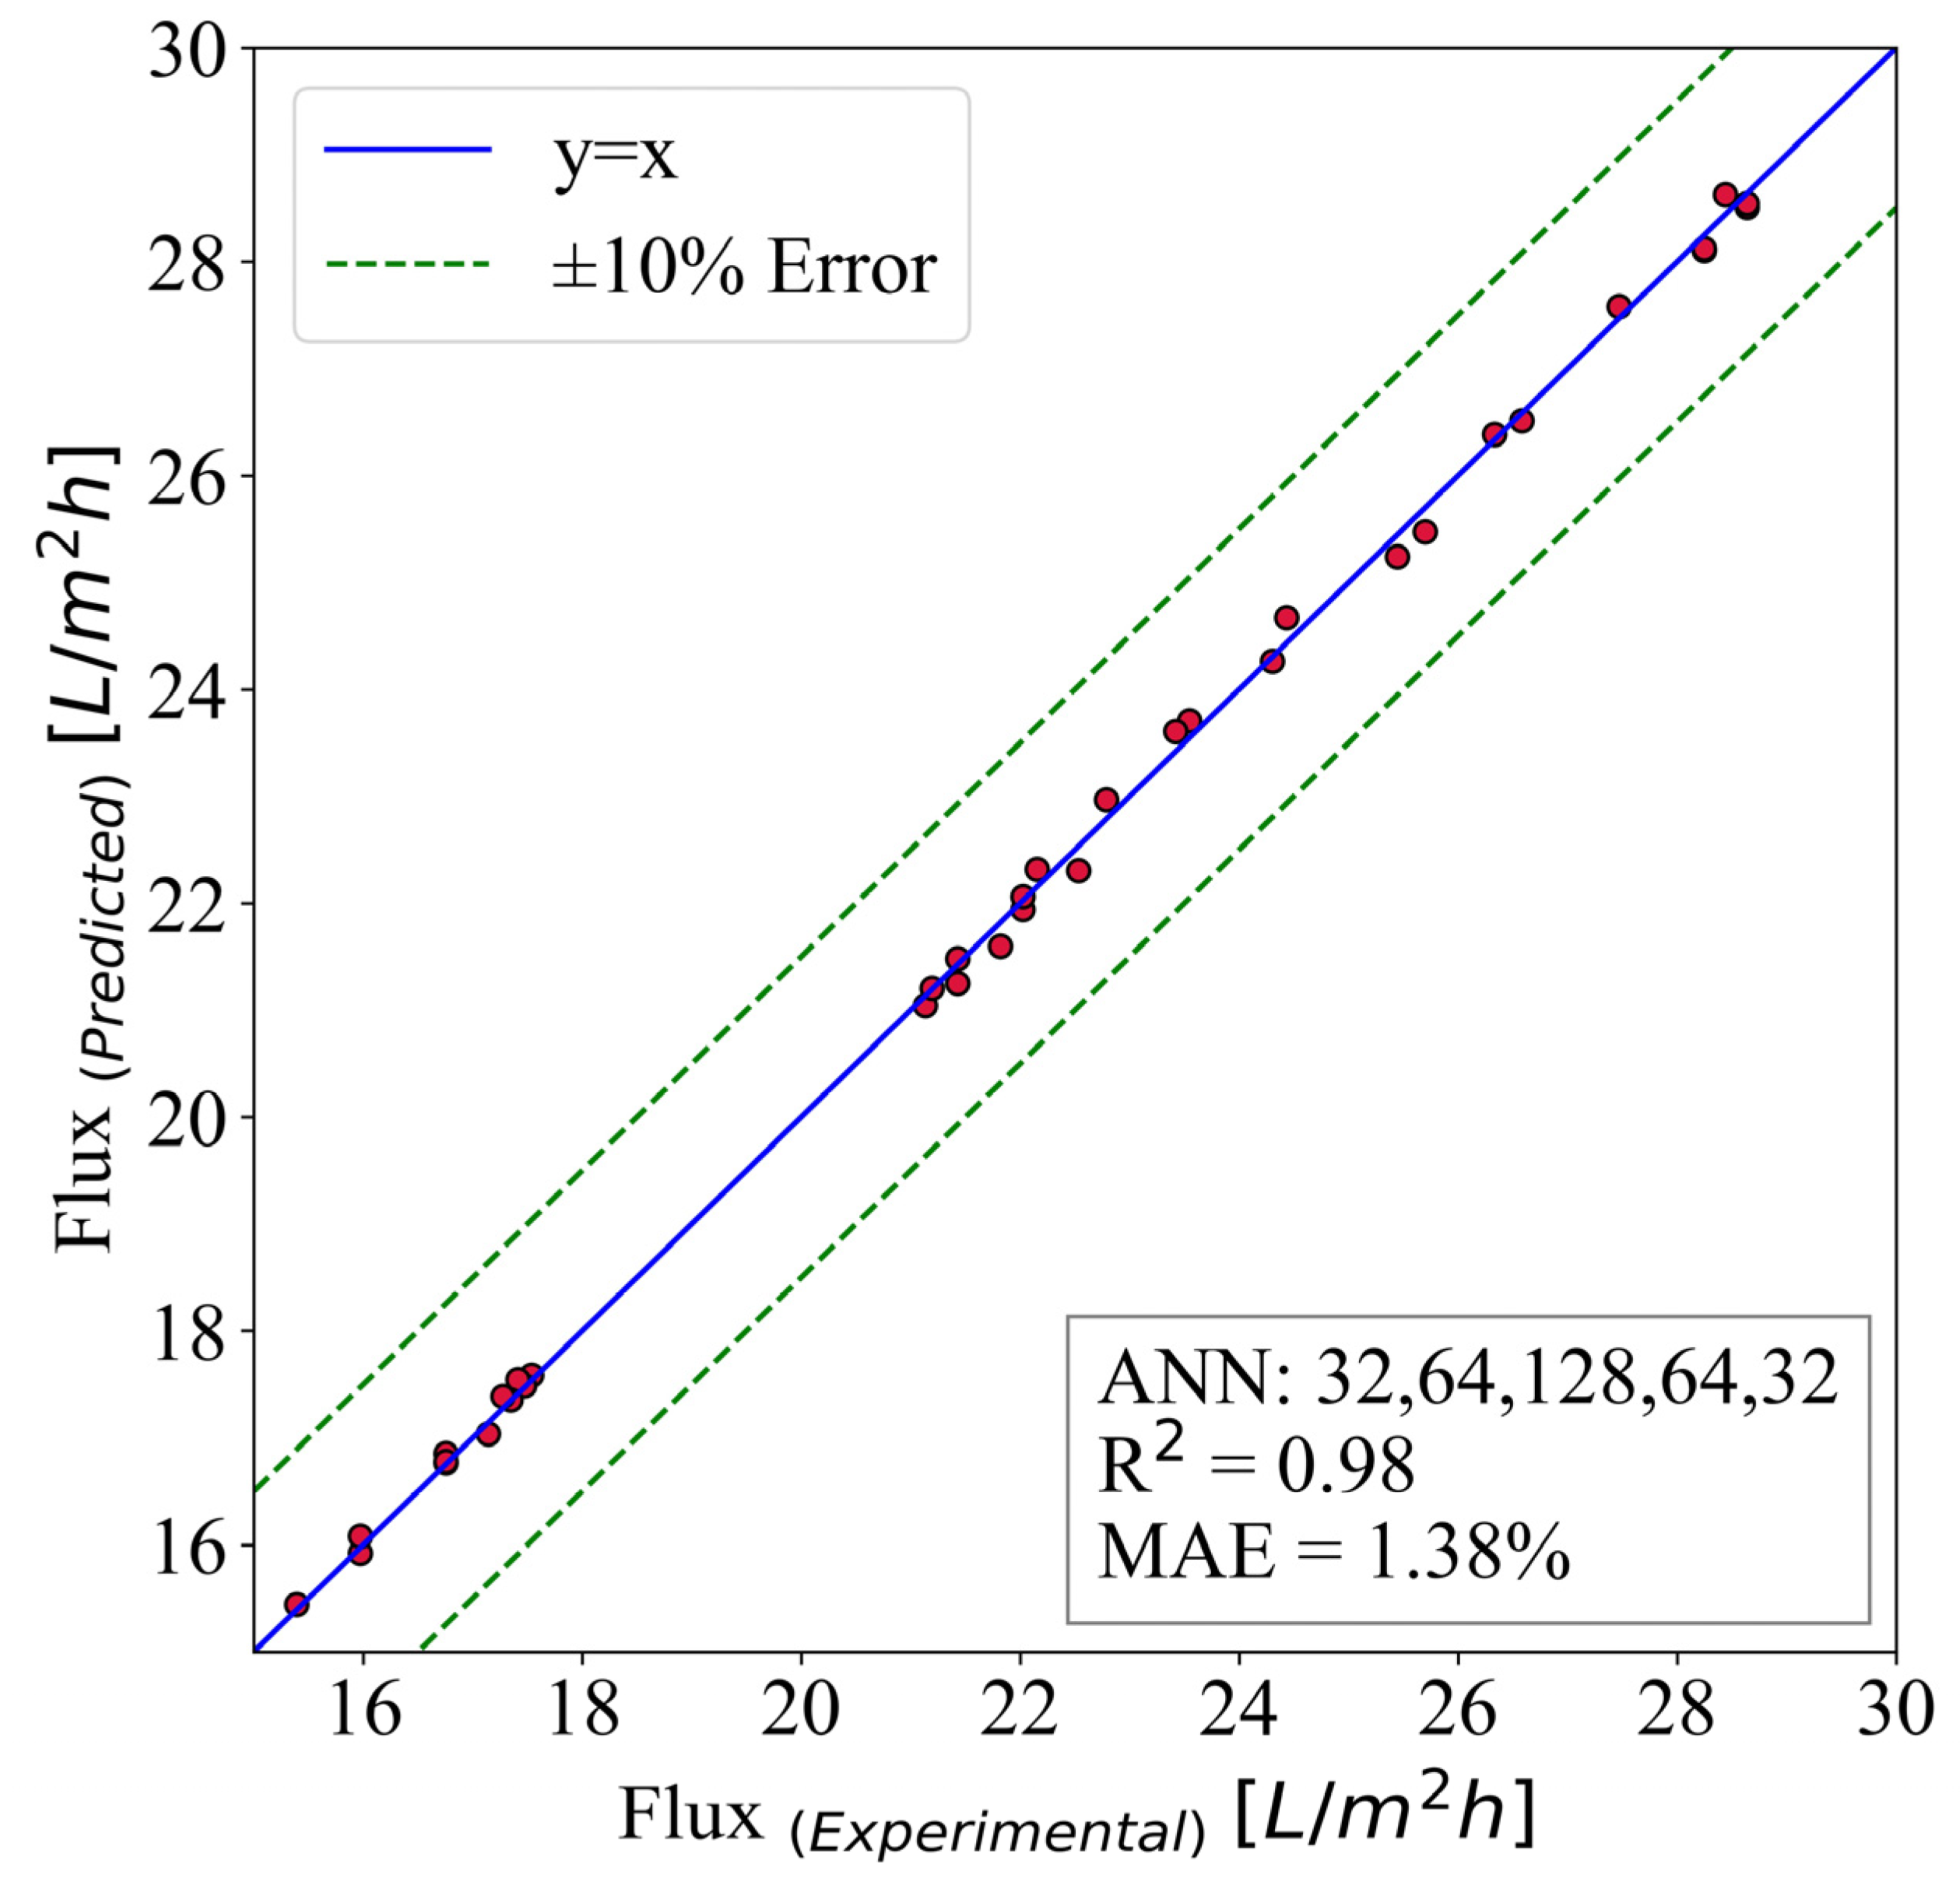
4.2. Predictive Model for Normalized Flux

A similar analysis is done on the normalized flux of the reversed osmosis desalination system. The structure of hidden layers is (64,64,32,32). The batch size is 16, and the model ran for 30,000 epochs. The activation function of the output layer is ReLU.
Figure 11 shows that the model possesses an MAE of 1.02%. Additionally, the R 2 is equal to 0.99. The results prove that the ANN models could be used to replace the experiments in the mentioned range. The reason behind this is two-fold. First, the accuracy of the predictive models are so good that in some cases they are equal to the experimental results. Second, the experimental expenses are way higher than ANN’s. This is also proved to be correct in [19]. In the present study, the simulation time for the ANN models is almost 3% of the experiments. Therefore, it seems logical to use this model for further utilization of the models to design new thermal systems.

5. Conclusions

Synthesized nanocomposites using a modification of carbon nanotubes and an increase in functional groups on the surface of synthesized membranes have shown acceptable performance. Considering the two important factors of the diffusion coefficient and solubility coefficient on the surface of reverse osmosis membranes, materials that can help the hydrophilicity of the membrane surface can increase the flux and salt rejection. In this research, new results were obtained about membrane performance due to the use of new nanocomposites. Among the notable results is the efficiency of more than 97% in salt removal. Additionally, the increase in flux in all nanocomposite membranes with pyrrole was up to 30.8 LMH, which was a 41% improvement compared to plain polyamide membranes. A significant reduction in clogging in nanocomposite membranes containing a pyrrole structure was observed. In relation to the hydrophilicity of the membrane surface due to the presence of hydrogen bonds, the increase in hydrophilicity was associated with an increase in concentration, and also, due to high hydrophilicity, the spread of water particles on the membrane surface increased and caused an increase in flux. According to the SEM analysis, the roughness of the membrane surface due to the increase of N-H groups on the surface of the membrane was reduced compared to plain polyamide membranes. Finally, it can be concluded that the use of nanocomposite membranes with pyrrole, due to the presence of pyrrole monomer on the surface of raw nanotubes, has improved the performance of the membrane, including flux, salt rejection, and clogging, and these membranes can be used as the best nanocomposite membrane. Finally, the proposed model proved to be satisfactorily accurate. Therefore, it could be used to replace further experiments with the mentioned membranes. This would save a lot of time and resources. The proposed model utilizes hyperparameter tuning, which gives the model the advantage of optimized hyperparameters.

Author Contributions

A.A., R.N. and V.S.: Conceptualization, Methodology, Software, Formal analysis, Investigation, Data Curation, Validation, Writing—Original Draft and Reviewing, Visualization. M.H.A.: Conceptualization, Formal analysis, Software, Investigation, Resources, Data Curation, Writing—Review & Editing. M.M.J.: Conceptualization, Methodology, Validation, Writing—Review & Editing, Supervision. All authors have read and agreed to the published version of the manuscript.

Funding

This research was funded by the Deanship of Scientific Research at King Khalid University under grant number RGP.2/57/43.

Institutional Review Board Statement

Not applicable.

Data Availability Statement

The data presented in this study are available on request from the corresponding author.

Acknowledgments

The authors extend their appreciation to the Deanship of Scientific Research at King Khalid University for supporting this research through Large Groups Project under grant number RGP.2/57/43.

Conflicts of Interest

The authors declare that they have no known competing financial interests or personal relationships that could have appeared to influence the work reported in this paper.

References

  1. Wu, R.; Tan, Y.; Meng, F.; Zhang, Y.; Huang, Y.X. PVDF/MAF-4 composite membrane for high flux and scaling-resistant membrane distillation. Desalination 2022, 540, 116013. [Google Scholar] [CrossRef]
  2. Huang, H.; Schwab, K.; Jacangelo, J.G. Pretreatment for low pressure membranes in water treatment: A review. Environ. Sci. Technol. 2009, 43, 3011–3019. [Google Scholar] [CrossRef]
  3. Yin, L.; Wang, L.; Keim, B.D.; Konsoer, K.; Zheng, W. Wavelet analysis of dam injection and discharge in three gorges dam and reservoir with precipitation and river discharge. Water 2022, 14, 567. [Google Scholar] [CrossRef]
  4. Lin, X.; Lu, K.; Hardison, A.K.; Liu, Z.; Xu, X.; Gao, D.; Gong, J.; Gardner, W.S. Membrane inlet mass spectrometry method (REOX/MIMS) to measure 15N-nitrate in isotope-enrichment experiments. Ecol. Indic. 2021, 126, 107639. [Google Scholar] [CrossRef]
  5. Bai, B.; Bai, F.; Li, X.; Nie, Q.; Jia, X.; Wu, H. The remediation efficiency of heavy metal pollutants in water by industrial red mud particle waste. Environ. Technol. Innov. 2022, 28, 102944. [Google Scholar] [CrossRef]
  6. Wu, H.; Tang, B.; Wu, P. Optimization, characterization and nanofiltration properties test of MWNTs/polyester thin film nanocomposite membrane. J. Membr. Sci. 2013, 428, 425–433. [Google Scholar] [CrossRef]
  7. Ge, D.; Yuan, H.; Xiao, J.; Zhu, N. Insight into the enhanced sludge dewaterability by tannic acid conditioning and pH regulation. Sci. Total Environ. 2019, 679, 298–306. [Google Scholar] [CrossRef]
  8. Chen, Z.; Liu, Z.; Yin, L.; Zheng, W. Statistical analysis of regional air temperature characteristics before and after dam construction. Urban Clim. 2022, 41, 101085. [Google Scholar] [CrossRef]
  9. Lee, K.P.; Arnot, T.C.; Mattia, D. A review of reverse osmosis membrane materials for desalination—Development to date and future potential. J. Membr. Sci. 2011, 370, 1–22. [Google Scholar] [CrossRef] [Green Version]
  10. Bai, B.; Rao, D.; Chang, T.; Guo, Z. A nonlinear attachment-detachment model with adsorption hysteresis for suspension-colloidal transport in porous media. J. Hydrol. 2019, 578, 124080. [Google Scholar] [CrossRef]
  11. Liu, W.; Huang, F.; Liao, Y.; Zhang, J.; Ren, G.; Zhuang, Z.; Zhen, J.; Lin, Z.; Wang, C. Treatment of CrVI-Containing Mg(OH)2 Nanowaste. Angew. Chem. 2008, 120, 5701–5704. [Google Scholar] [CrossRef]
  12. Alimoradi, H.; Shams, M.; Ashgriz, N. Bubble behavior and nucleation site density in subcooled flow boiling using a novel method for simulating the microstructure of surface roughness. Korean J. Chem. Eng. 2022, 39, 2945–2958. [Google Scholar] [CrossRef]
  13. Zaboli, S.; Alimoradi, H.; Shams, M. Numerical investigation on improvement in pool boiling heat transfer characteristics using different nanofluid concentrations. J. Therm. Anal. Calorim. 2022, 147, 10659–10676. [Google Scholar] [CrossRef]
  14. Roodbari, M.; Alimoradi, H.; Shams, M.; Aghanajafi, C. An experimental investigation of microstructure surface roughness on pool boiling characteristics of TiO2 nanofluid. J. Therm. Anal. Calorim. 2022, 147, 3283–3298. [Google Scholar] [CrossRef]
  15. Alimoradi, H.; Zaboli, S.; Shams, M. Numerical simulation of surface vibration effects on improvement of pool boiling heat transfer characteristics of nanofluid. Korean J. Chem. Eng. 2022, 39, 69–85. [Google Scholar] [CrossRef]
  16. Wang, M.R.; Deng, L.; Liu, G.C.; Wen, L.; Wang, J.G.; Huang, K.B.; Tang, H.T.; Pan, Y.M. Porous organic polymer-derived nanopalladium catalysts for chemoselective synthesis of antitumor benzofuro [2,3-b] pyrazine from 2-bromophenol and isonitriles. Org. Lett. 2019, 21, 4929–4932. [Google Scholar] [CrossRef]
  17. Alimoradi, H.; Soltani, M.; Shahali, P.; Moradi Kashkooli, F.; Larizadeh, R.; Raahemifar, K.; Adibi, M.; Ghasemi, B. Experimental investigation on improvement of wet cooling tower efficiency with diverse packing compaction using ANN-PSO algorithm. Energies 2020, 14, 167. [Google Scholar] [CrossRef]
  18. Alimoradi, H.; Shams, M.; Ashgriz, N. Enhancement in the Pool Boiling Heat Transfer of Copper Surface by Applying Electrophoretic Deposited Graphene Oxide Coatings. Int. J. Multiph. Flow 2022, 159, 104350. [Google Scholar] [CrossRef]
  19. Shannon, M.A.; Bohn, P.W.; Elimelech, M.; Georgiadis, J.G.; Marinas, B.J.; Mayes, A.M. Science and technology for water purification in the coming decades. Nanosci. Technol. A Collect. Rev. Nat. J. 2010, 452, 337–346. [Google Scholar]
  20. Dai, Z.; Ma, Z.; Zhang, X.; Chen, J.; Ershadnia, R.; Luan, X.; Soltanian, M.R. An integrated experimental design framework for optimizing solute transport monitoring locations in heterogeneous sedimentary media. J. Hydrol. 2022, 614, 128541. [Google Scholar] [CrossRef]
  21. Yang, Y.P.; Weng, H.H. An underground pollution of water purification processing equipment develop. In Advanced Materials Research; Trans Tech Publications Ltd.: Wollerau, Switzerland, 2013; Volume 807, pp. 1372–1375. [Google Scholar]
  22. Qasim, M.; Badrelzaman, M.; Darwish, N.N.; Darwish, N.A.; Hilal, N. Reverse osmosis desalination: A state-of-the-art review. Desalination 2019, 459, 59–104. [Google Scholar] [CrossRef]
  23. Li, D.; Wang, H. Recent developments in reverse osmosis desalination membranes. J. Mater. Chem. 2010, 20, 4551–4566. [Google Scholar] [CrossRef]
  24. Saleem, H.; Zaidi, S.J. Nanoparticles in reverse osmosis membranes for desalination: A state of the art review. Desalination 2020, 475, 114171. [Google Scholar] [CrossRef]
  25. Liu, L.; Xie, X.; Qi, S.; Li, R.; Zhang, X.; Song, X.; Gao, C. Thin film nanocomposite reverse osmosis membrane incorporated with UiO-66 nanoparticles for enhanced boron removal. J. Membr. Sci. 2019, 580, 101–109. [Google Scholar] [CrossRef]
  26. Lee, T.H.; Oh, J.Y.; Hong, S.P.; Lee, J.M.; Roh, S.M.; Kim, S.H.; Park, H.B. ZIF-8 particle size effects on reverse osmosis performance of polyamide thin-film nanocomposite membranes: Importance of particle deposition. J. Membr. Sci. 2019, 570, 23–33. [Google Scholar] [CrossRef]
  27. Ding, W.; Meng, Q.; Dong, G.; Qi, N.; Zhao, H.; Shi, S. Metabolic engineering of threonine catabolism enables Saccharomyces cerevisiae to produce propionate under aerobic conditions. Biotechnol. J. 2022, 17, 2100579. [Google Scholar] [CrossRef]
  28. Zheng, W.; Zhou, Y.; Liu, S.; Tian, J.; Yang, B.; Yin, L. A deep fusion matching network semantic reasoning model. Appl. Sci. 2022, 12, 3416. [Google Scholar] [CrossRef]
  29. Rajakumaran, R.; Boddu, V.; Kumar, M.; Shalaby, M.S.; Abdallah, H.; Chetty, R. Effect of ZnO morphology on GO-ZnO modified polyamide reverse osmosis membranes for desalination. Desalination 2019, 467, 245–256. [Google Scholar] [CrossRef]
  30. Zheng, W.; Tian, X.; Yang, B.; Liu, S.; Ding, Y.; Tian, J.; Yin, L. A few shot classification methods based on multiscale relational networks. Appl. Sci. 2022, 12, 4059. [Google Scholar] [CrossRef]
  31. Al Mayyahi, A. Thin-film composite (TFC) membrane modified by hybrid ZnO-graphene nanoparticles (ZnO-Gr NPs) for water desalination. J. Environ. Chem. Eng. 2018, 6, 1109–1117. [Google Scholar] [CrossRef]
  32. Zou, D.; Lee, Y.M. Design strategy of poly (vinylidene fluoride) membranes for water treatment. Prog. Polym. Sci. 2022, 128, 101535. [Google Scholar] [CrossRef]
  33. Zhang, Z.; Gu, Q.; Ng, T.C.A.; Zhang, J.; Zhang, X.; Zhang, L.; Zhang, X.; Wang, H.; Ng, H.Y.; Wang, J. Hierarchically porous interlayer for highly permeable and fouling-resistant ceramic membranes in water treatment. Sep. Purif. Technol. 2022, 293, 121092. [Google Scholar] [CrossRef]
  34. Pan, D.; Chen, H. Border pollution reduction in China: The role of livestock environmental regulations. China Econ. Rev. 2021, 69, 101681. [Google Scholar] [CrossRef]
  35. Beratto-Ramos, A.; Dagnino-Leone, J.; Martínez-Oyanedel, J.; Aranda, M.; Bórquez, R. Fabrication and filtration performance of aquaporin biomimetic membranes for water treatment. Sep. Purif. Rev. 2022, 51, 340–357. [Google Scholar] [CrossRef]
  36. Mukherjee, D.; Ghosh, S. Ceramic Membranes in Water Treatment: Potential and Challenges for Technology Development. In Sustainable Water Treatment: Advances and Technological Interventions; John Wiley & Sons, Inc.: Hoboken, NJ, USA, 2022; pp. 325–381. [Google Scholar]
  37. Adam, M.R.; Othman, M.H.D.; Kurniawan, T.A.; Puteh, M.H.; Ismail, A.F.; Khongnakorn, W.; Rahman, M.A.; Jaafar, J. Advances in adsorptive membrane technology for water treatment and resource recovery applications: A critical review. J. Environ. Chem. Eng. 2022, 10, 107633. [Google Scholar] [CrossRef]
  38. Petersen, R.J. Composite reverse osmosis and nanofiltration membranes. J. Membr. Sci. 1993, 83, 81–150. [Google Scholar] [CrossRef]
  39. Mamah, S.C.; Goh, P.S.; Ismail, A.F.; Suzaimi, N.D.; Yogarathinam, L.T.; Raji, Y.O.; El-badawy, T.H. Recent development in modification of polysulfone membrane for water treatment application. J. Water Process Eng. 2021, 40, 101835. [Google Scholar]
  40. Tong, X.; Liu, S.; Qu, D.; Gao, H.; Yan, L.; Chen, Y.; Crittenden, J. Tannic acid-metal complex modified MXene membrane for contaminants removal from water. J. Membr. Sci. 2021, 622, 119042. [Google Scholar] [CrossRef]
  41. Chan, W.F.; Chen, H.Y.; Marand, E.; Johnson, J.K. Functionalized carbon nanotube nanocomposite membranes for water desalination: Experimental study. In Proceedings of the 2013 AIChE Annual Meeting, San Francisco, CA, USA, 3–8 November 2013. [Google Scholar]
  42. Shao, Z.; Zhai, Q.; Han, Z.; Guan, X. A linear AC unit commitment formulation: An application of data-driven linear power flow model. Int. J. Electr. Power Energy Syst. 2023, 145, 108673. [Google Scholar] [CrossRef]
  43. Qi, L.; Xu, Z. Lead sorption from aqueous solutions on chitosan nanoparticles. Colloids Surf. A Physicochem. Eng. Asp. 2004, 251, 183–190. [Google Scholar] [CrossRef]
  44. Bhaumik, M.; Agarwal, S.; Gupta, V.K.; Maity, A. Enhanced removal of Cr (VI) from aqueous solutions using polypyrrole wrapped oxidized MWCNTs nanocomposites adsorbent. J. Colloid Interface Sci. 2016, 470, 257–267. [Google Scholar] [CrossRef]
  45. Zheng, X.; Chen, D.; Lei, Y.; Cheng, R. Nano-TiO2 membrane adsorption reactor (MAR) for virus removal in drinking water. Chem. Eng. J. 2013, 230, 180–187. [Google Scholar] [CrossRef]
  46. Yang, R.; Hou, E.; Cheng, W.; Yan, X.; Zhang, T.; Li, S.; Yao, H.; Liu, J.; Guo, Y. Membrane-Targeting Neolignan-Antimicrobial Peptide Mimic Conjugates to Combat Methicillin-Resistant Staphylococcus aureus (MRSA) Infections. J. Med. Chem. 2022, 65, 16879–16892. [Google Scholar] [CrossRef]
  47. Ahn, C.H.; Baek, Y.; Lee, C.; Kim, S.O.; Kim, S.; Lee, S.; Kim, S.H.; Bae, S.S.; Park, J.; Yoon, J. Carbon nanotube-based membranes: Fabrication and application to desalination. J. Ind. Eng. Chem. 2012, 18, 1551–1559. [Google Scholar] [CrossRef]
  48. Kim, E.S.; Hwang, G.; El-Din, M.G.; Liu, Y. Development of nanosilver and multiwalled carbon nanotubes thin-film nanocomposite membrane for enhanced water treatment. J. Membr. Sci. 2012, 394, 37–48. [Google Scholar] [CrossRef]
  49. Kim, H.J.; Choi, K.; Baek, Y.; Kim, D.G.; Shim, J.; Yoon, J.; Lee, J.C. High-performance reverse osmosis CNT/polyamide nanocomposite membrane by controlled interfacial interactions. ACS Appl. Mater. Interfaces 2014, 6, 2819–2829. [Google Scholar] [CrossRef]
  50. Baroña, G.N.B.; Lim, J.; Choi, M.; Jung, B. Interfacial polymerization of polyamide-aluminosilicate SWNT nanocomposite membranes for reverse osmosis. Desalination 2013, 325, 138–147. [Google Scholar] [CrossRef] [Green Version]
  51. Ghosh, A.K.; Bindal, R.; Prabhakar, S.; Tewari, P.K. Composite polyamide reverse osmosis (RO) membranes–recent developments and future directions. Barc Newsl. 2011, 321, 43–51. [Google Scholar]
  52. Dumée, L.; Lee, J.; Sears, K.; Tardy, B.; Duke, M.; Gray, S. Fabrication of thin film composite poly (amide)-carbon-nanotube supported membranes for enhanced performance in osmotically driven desalination systems. J. Membr. Sci. 2013, 427, 422–430. [Google Scholar] [CrossRef] [Green Version]
  53. Zhao, Y.; Wang, Z. Subset simulation with adaptable intermediate failure probability for robust reliability analysis: An unsupervised learning-based approach. Struct. Multidiscip. Optim. 2022, 65, 1–22. [Google Scholar] [CrossRef]
  54. Zhao, Y.; Joseph, A.J.J.M.; Zhang, Z.; Ma, C.; Gul, D.; Schellenberg, A.; Hu, N. Deterministic snap-through buckling and energy trapping in axially-loaded notched strips for compliant building blocks. Smart Mater. Struct. 2020, 29, 02LT03. [Google Scholar] [CrossRef]
  55. Gabelich, C.J.; Williams, M.D.; Rahardianto, A.; Franklin, J.C.; Cohen, Y. High-recovery reverse osmosis desalination using intermediate chemical demineralization. J. Membr. Sci. 2007, 301, 131–141. [Google Scholar] [CrossRef]
  56. Yan, B.; Ma, C.; Zhao, Y.; Hu, N.; Guo, L. Geometrically Enabled Soft Electroactuators via Laser Cutting. Adv. Eng. Mater. 2019, 21, 1900664. [Google Scholar] [CrossRef]
  57. Zhao, Y.; Hu, H.; Bai, L.; Tang, M.; Chen, H.; Su, D. Fragility analyses of bridge structures using the logarithmic piecewise function-based probabilistic seismic demand model. Sustainability 2021, 13, 7814. [Google Scholar] [CrossRef]
  58. Yao, L.; Li, Y.; Cheng, Q.; Chen, Z.; Song, J. Modeling and optimization of metal-organic frameworks membranes for reverse osmosis with artificial neural networks. Desalination 2022, 532, 115729. [Google Scholar] [CrossRef]
  59. Foong, L.K.; Zhao, Y.; Bai, C.; Xu, C. Efficient metaheuristic-retrofitted techniques for concrete slump simulation. Smart Struct. Syst. Int. J. 2021, 27, 745–759. [Google Scholar]
  60. Wu, P.; Liu, A.; Fu, J.; Ye, X.; Zhao, Y. Autonomous surface crack identification of concrete structures based on an improved one-stage object detection algorithm. Eng. Struct. 2022, 272, 114962. [Google Scholar] [CrossRef]
  61. Alimoradi, H.; Eskandari, E.; Pourbagian, M.; Shams, M. A parametric study of subcooled flow boiling of Al2O3/water nanofluid using numerical simulation and artificial neural networks. Nanoscale Microscale Thermophys. Eng. 2022, 26, 129–159. [Google Scholar] [CrossRef]
  62. Farahbakhsh, J.; Delnavaz, M.; Vatanpour, V. Simulation and characterization of novel reverse osmosis membrane prepared by blending polypyrrole coated multiwalled carbon nanotubes for brackish water desalination and antifouling properties using artificial neural networks. J. Membr. Sci. 2019, 581, 123–138. [Google Scholar] [CrossRef]
  63. Eskandari, E.; Alimoradi, H.; Pourbagian, M.; Shams, M. Numerical investigation and deep learning-based prediction of heat transfer characteristics and bubble dynamics of subcooled flow boiling in a vertical tube. Korean J. Chem. Eng. 2022, 39, 3227–3245. [Google Scholar] [CrossRef]
  64. Zhao, Y.; Hu, H.; Song, C.; Wang, Z. Predicting compressive strength of manufactured-sand concrete using conventional and metaheuristic-tuned artificial neural network. Measurement 2022, 194, 110993. [Google Scholar] [CrossRef]
  65. Zhao, Y.; Yan, Q.; Yang, Z.; Yu, X.; Jia, B. A novel artificial bee colony algorithm for structural damage detection. Adv. Civ. Eng. 2020, 2020, 3743089. [Google Scholar] [CrossRef] [Green Version]
  66. Yeo, C.S.H.; Xie, Q.; Wang, X.; Zhang, S. Understanding and optimization of thin film nanocomposite membranes for reverse osmosis with machine learning. J. Membr. Sci. 2020, 606, 118135. [Google Scholar] [CrossRef]
  67. Zhao, Y.; Foong, L.K. Predicting Electrical Power Output of Combined Cycle Power Plants Using a Novel Artificial Neural Network Optimized by Electrostatic Discharge Algorithm. Measurement 2022, 198, 111405. [Google Scholar] [CrossRef]
  68. Zhao, Y.; Zhong, X.; Foong, L.K. Predicting the splitting tensile strength of concrete using an equilibrium optimization model. Steel Compos. Struct. Int. J. 2021, 39, 81–93. [Google Scholar]
  69. Ruiz-García, A.; Feo-García, J. Operating and maintenance cost in seawater reverse osmosis desalination plants. Artificial neural network based model. Desalination Water Treat. 2017, 73, 73–79. [Google Scholar] [CrossRef]
  70. Joy, V.M.; Feroz, S.; Dutta, S. Artificial intelligence-based multiobjective optimization of reverse osmosis desalination pretreatment using a hybrid ZnO-immobilized/photo-Fenton process. J. Chemom. 2022, 36, e3434. [Google Scholar] [CrossRef]
  71. Salgado-Reyna, A.; Soto-Regalado, E.; Gómez-González, R.; Cerino-Córdova, F.J.; García-Reyes, R.B.; Garza-González, M.T.; Alcalá-Rodríguez, M.M. Artificial neural networks for modeling the reverse osmosis unit in a wastewater pilot treatment plant. Desalination Water Treat. 2015, 53, 1177–1187. [Google Scholar] [CrossRef]
  72. Zarrabi, H.; Yekavalangi, M.E.; Vatanpour, V.; Shockravi, A.; Safarpour, M. Improvement in desalination performance of thin film nanocomposite nanofiltration membrane using amine-functionalized multiwalled carbon nanotube. Desalination 2016, 394, 83–90. [Google Scholar] [CrossRef]
  73. Hollas, J.M. Modern Spectroscopy; John Wiley & Sons: Hoboken, NJ, USA, 2004. [Google Scholar]
  74. Nunes, S.P.; Peinemann, K.V. Membrane Technology; Wiley-VCH: Hoboken, NJ, USA, 2001. [Google Scholar]
  75. Vatanpour, V.; Madaeni, S.S.; Moradian, R.; Zinadini, S.; Astinchap, B. Novel antibifouling nanofiltration polyethersulfone membrane fabricated from embedding TiO2 coated multiwalled carbon nanotubes. Sep. Purif. Technol. 2012, 90, 69–82. [Google Scholar] [CrossRef]
  76. Pavia, D.L.; Lampman, G.M.; Kriz, G.S.; Vyvyan, J.A. Introduction to Spectroscopy; Cengage Learning: Boston, MA, USA, 2014. [Google Scholar]
  77. Werder, T.; Walther, J.H.; Jaffe, R.L.; Halicioglu, T.; Noca, F.; Koumoutsakos, P. Molecular dynamics simulation of contact angles of water droplets in carbon nanotubes. Nano Lett. 2001, 1, 697–702. [Google Scholar] [CrossRef]
  78. Vatanpour, V.; Esmaeili, M.; Farahani, M.H.D.A. Fouling reduction and retention increment of polyethersulfone nanofiltration membranes embedded by amine-functionalized multiwalled carbon nanotubes. J. Membr. Sci. 2014, 466, 70–81. [Google Scholar] [CrossRef]
  79. Son, M.; Choi, H.G.; Liu, L.; Celik, E.; Park, H.; Choi, H. Efficacy of carbon nanotube positioning in the polyethersulfone support layer on the performance of thin-film composite membrane for desalination. Chem. Eng. J. 2015, 266, 376–384. [Google Scholar] [CrossRef]
  80. Zhang, L.; Shi, G.Z.; Qiu, S.; Cheng, L.H.; Chen, H.L. Preparation of high-flux thin film nanocomposite reverse osmosis membranes by incorporating functionalized multiwalled carbon nanotubes. Desalination Water Treat. 2011, 34, 19–24. [Google Scholar] [CrossRef]
  81. Zhao, H.; Qiu, S.; Wu, L.; Zhang, L.; Chen, H.; Gao, C. Improving the performance of polyamide reverse osmosis membrane by incorporation of modified multiwalled carbon nanotubes. J. Membr. Sci. 2014, 450, 249–256. [Google Scholar] [CrossRef]
  82. Vatanpour, V.; Zoqi, N. Surface modification of commercial seawater reverse osmosis membranes by grafting of hydrophilic monomer blended with carboxylated multiwalled carbon nanotubes. Appl. Surf. Sci. 2017, 396, 1478–1489. [Google Scholar] [CrossRef] [Green Version]
  83. Zhao, Y.; Moayedi, H.; Bahiraei, M.; Foong, L.K. Employing TLBO and SCE for optimal prediction of the compressive strength of concrete. Smart Struct. Syst. 2020, 26, 753–763. [Google Scholar]
  84. Lejarazu-Larrañaga, A.; Landaburu-Aguirre, J.; Senán-Salinas, J.; Ortiz, J.M.; Molina, S. Thin Film Composite Polyamide Reverse Osmosis Membrane Technology towards a Circular Economy. Membranes 2022, 12, 864. [Google Scholar] [CrossRef]
Figure 1. The reverse osmosis model.
Membranes 13 00031 g001
Figure 2. SEM images of the membranes with different loadings of pyrrol (a) 0.001%, (b) 0.002%, (c) 0.005%, and (d) 0.01%.
Membranes 13 00031 g002
Figure 3. FTIR spectra for determination of compounds on multiwalled carbon nanotubes.
Membranes 13 00031 g003
Figure 4. Contact angle analysis of different membranes.
Membranes 13 00031 g004
Figure 5. AFM analysis for modified membranes for (a) 0.001, (b) 0.002, (c) 0.005, and (d) 0.01.
Membranes 13 00031 g005
Figure 6. Flux and percent salt rejection for raw membranes.
Membranes 13 00031 g006
Figure 7. A comparison of Fouling flux of the modified membranes to the bare one.
Membranes 13 00031 g007
Figure 8. A comparison of Normalized flux (J/J0) of the modified membranes to the bare one.
Membranes 13 00031 g008
Figure 9. The most well-known activation functions.
Membranes 13 00031 g009
Figure 10. The ANN predictive model for flux.
Membranes 13 00031 g010
Figure 11. The predictive model for normalized flux.
Membranes 13 00031 g011
Table 1. The roughness analysis of the surface by DME/APM.
MembraneRoughness Parameter
S a (nm) S q S v
Bare PA RO54.668.8431
0.001 R-CNT-P116.3916.39206.8
0.002 R-CNT-P232.1142304.2
0.005 R-CNT-P354.667.5449.4
0.01 R-CNT-P428.7134.98210.1
Table 2. The study of hidden layers formation on the predictions.
NumberInput Hidden LayersMAE (%) R 2
1 P ,   G ,   q ,   x i n ,   φ (32)3.98%0.95
2 (32,64)2.67%0.96
3 (32,64,32)2.61%0.95
4 (32,64,64,32)2.48%0.96
5 * (32,64,128,64,32)2.06%0.98
6 (32,64,128,128,64,32)2.39%0.98
7 (32,64,128,256,128,64,32)2.30%0.97
8 (32,64,128,256,256,128,64,32)2.41%0.97
9 (32,64,128,256,512,256,128,64,32)2.40%0.97
* Finally selected model.
Table 3. Investigation of output layers activation function.
NumberHidden LayersOutput Activation FunctionMAE (%) R 2
1(32,64,128,64,32)Linear1.48%0.98
2 ReLU2.06%0.98
3 * Sigmoid1.45%0.99
* Finally selected model.
Table 4. The effect of batch size on the results.
NumberHidden LayersBatch SizeMAE (%) R 2
1(32,64,128,64,32)2 1.84%0.97
2 41.46%0.97
3 81.45%0.97
4 161.45%0.98
5 * 321.39%0.98
6 642.47%0.96
* Finally selected model.
Table 5. Study of epochs and their effect on results.
NumberHidden LayersEpochsMAE (%) R 2
1(32,64,128,64,32)1000 3.81%0.94
2 20002.67%0.96
3 50002.01%0.97
4 10,0001.95%0.98
5 * 20,0001.36%0.98
6 30,0001.39%0.98
7 40,0001.38%0.98
8 50,0001.38%0.98
* Finally selected model.
Table 6. The proposed models for the output parameters.
Objective FunctionInputsHidden LayersEpochsBatch SizeActivation Function
Flux t ,   S a ,   M W C N T P ,   φ   (32,64,128,64,32)20,00032Sigmoid
Normalized flux (J/J0) t ,   S a ,   M W C N T P ,   φ (64,64,32,32)30,00016ReLU
Disclaimer/Publisher’s Note: The statements, opinions and data contained in all publications are solely those of the individual author(s) and contributor(s) and not of MDPI and/or the editor(s). MDPI and/or the editor(s) disclaim responsibility for any injury to people or property resulting from any ideas, methods, instructions or products referred to in the content.

