
Feasibility of Forward Osmosis to Recover Textile Dyes Using Single Salts and Multicomponent Draw Solutions
 , , ,
, , ,  ,
, 
Abstract
:
1. Introduction
2. Materials and Methods
2.1. Draw and Feed Solutions
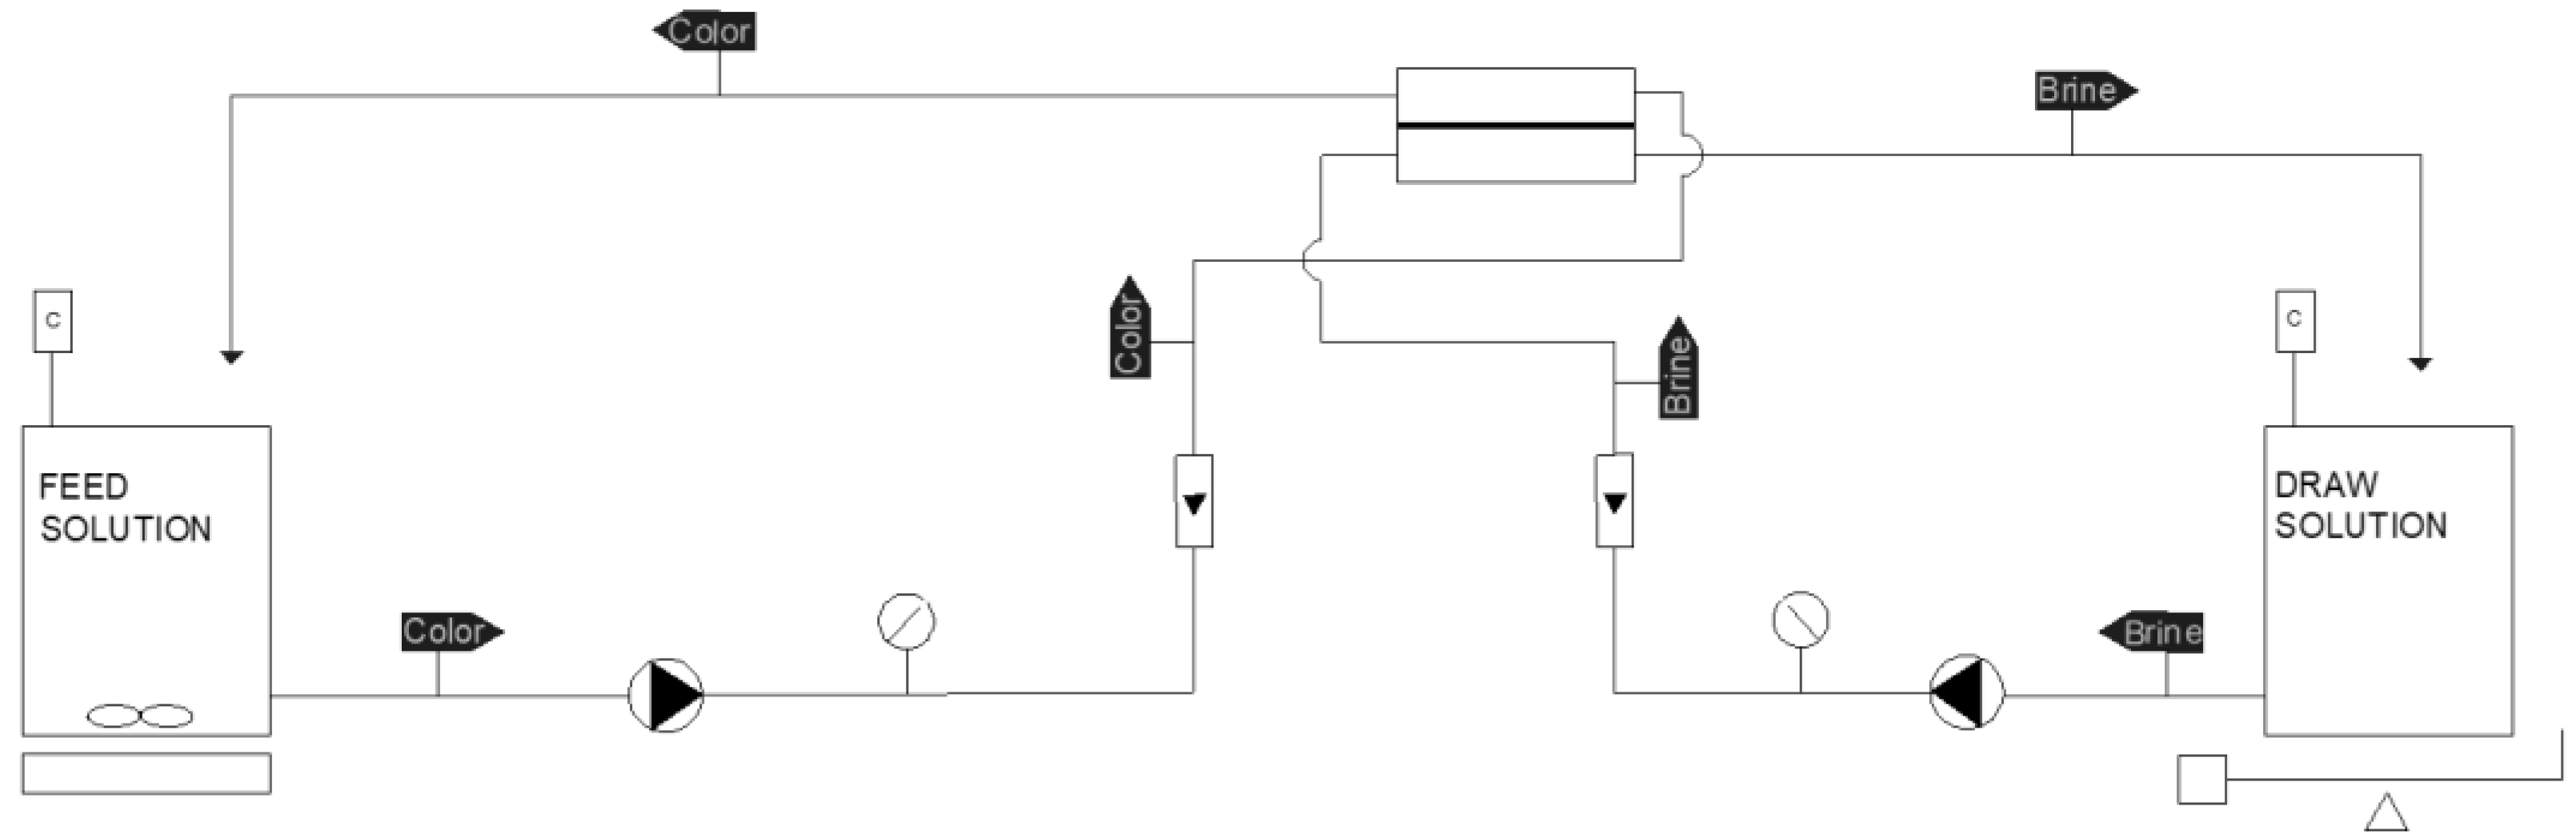
2.2. Forward Osmosis Laboratory-Scale Plant
2.3. Water Flux Variation over Time
2.4. Methodology
2.5. Cleaning Procedure
2.6. Analytical Methods
3. Results
3.1. Membrane Characterization
3.2. Dye Concentration Tests
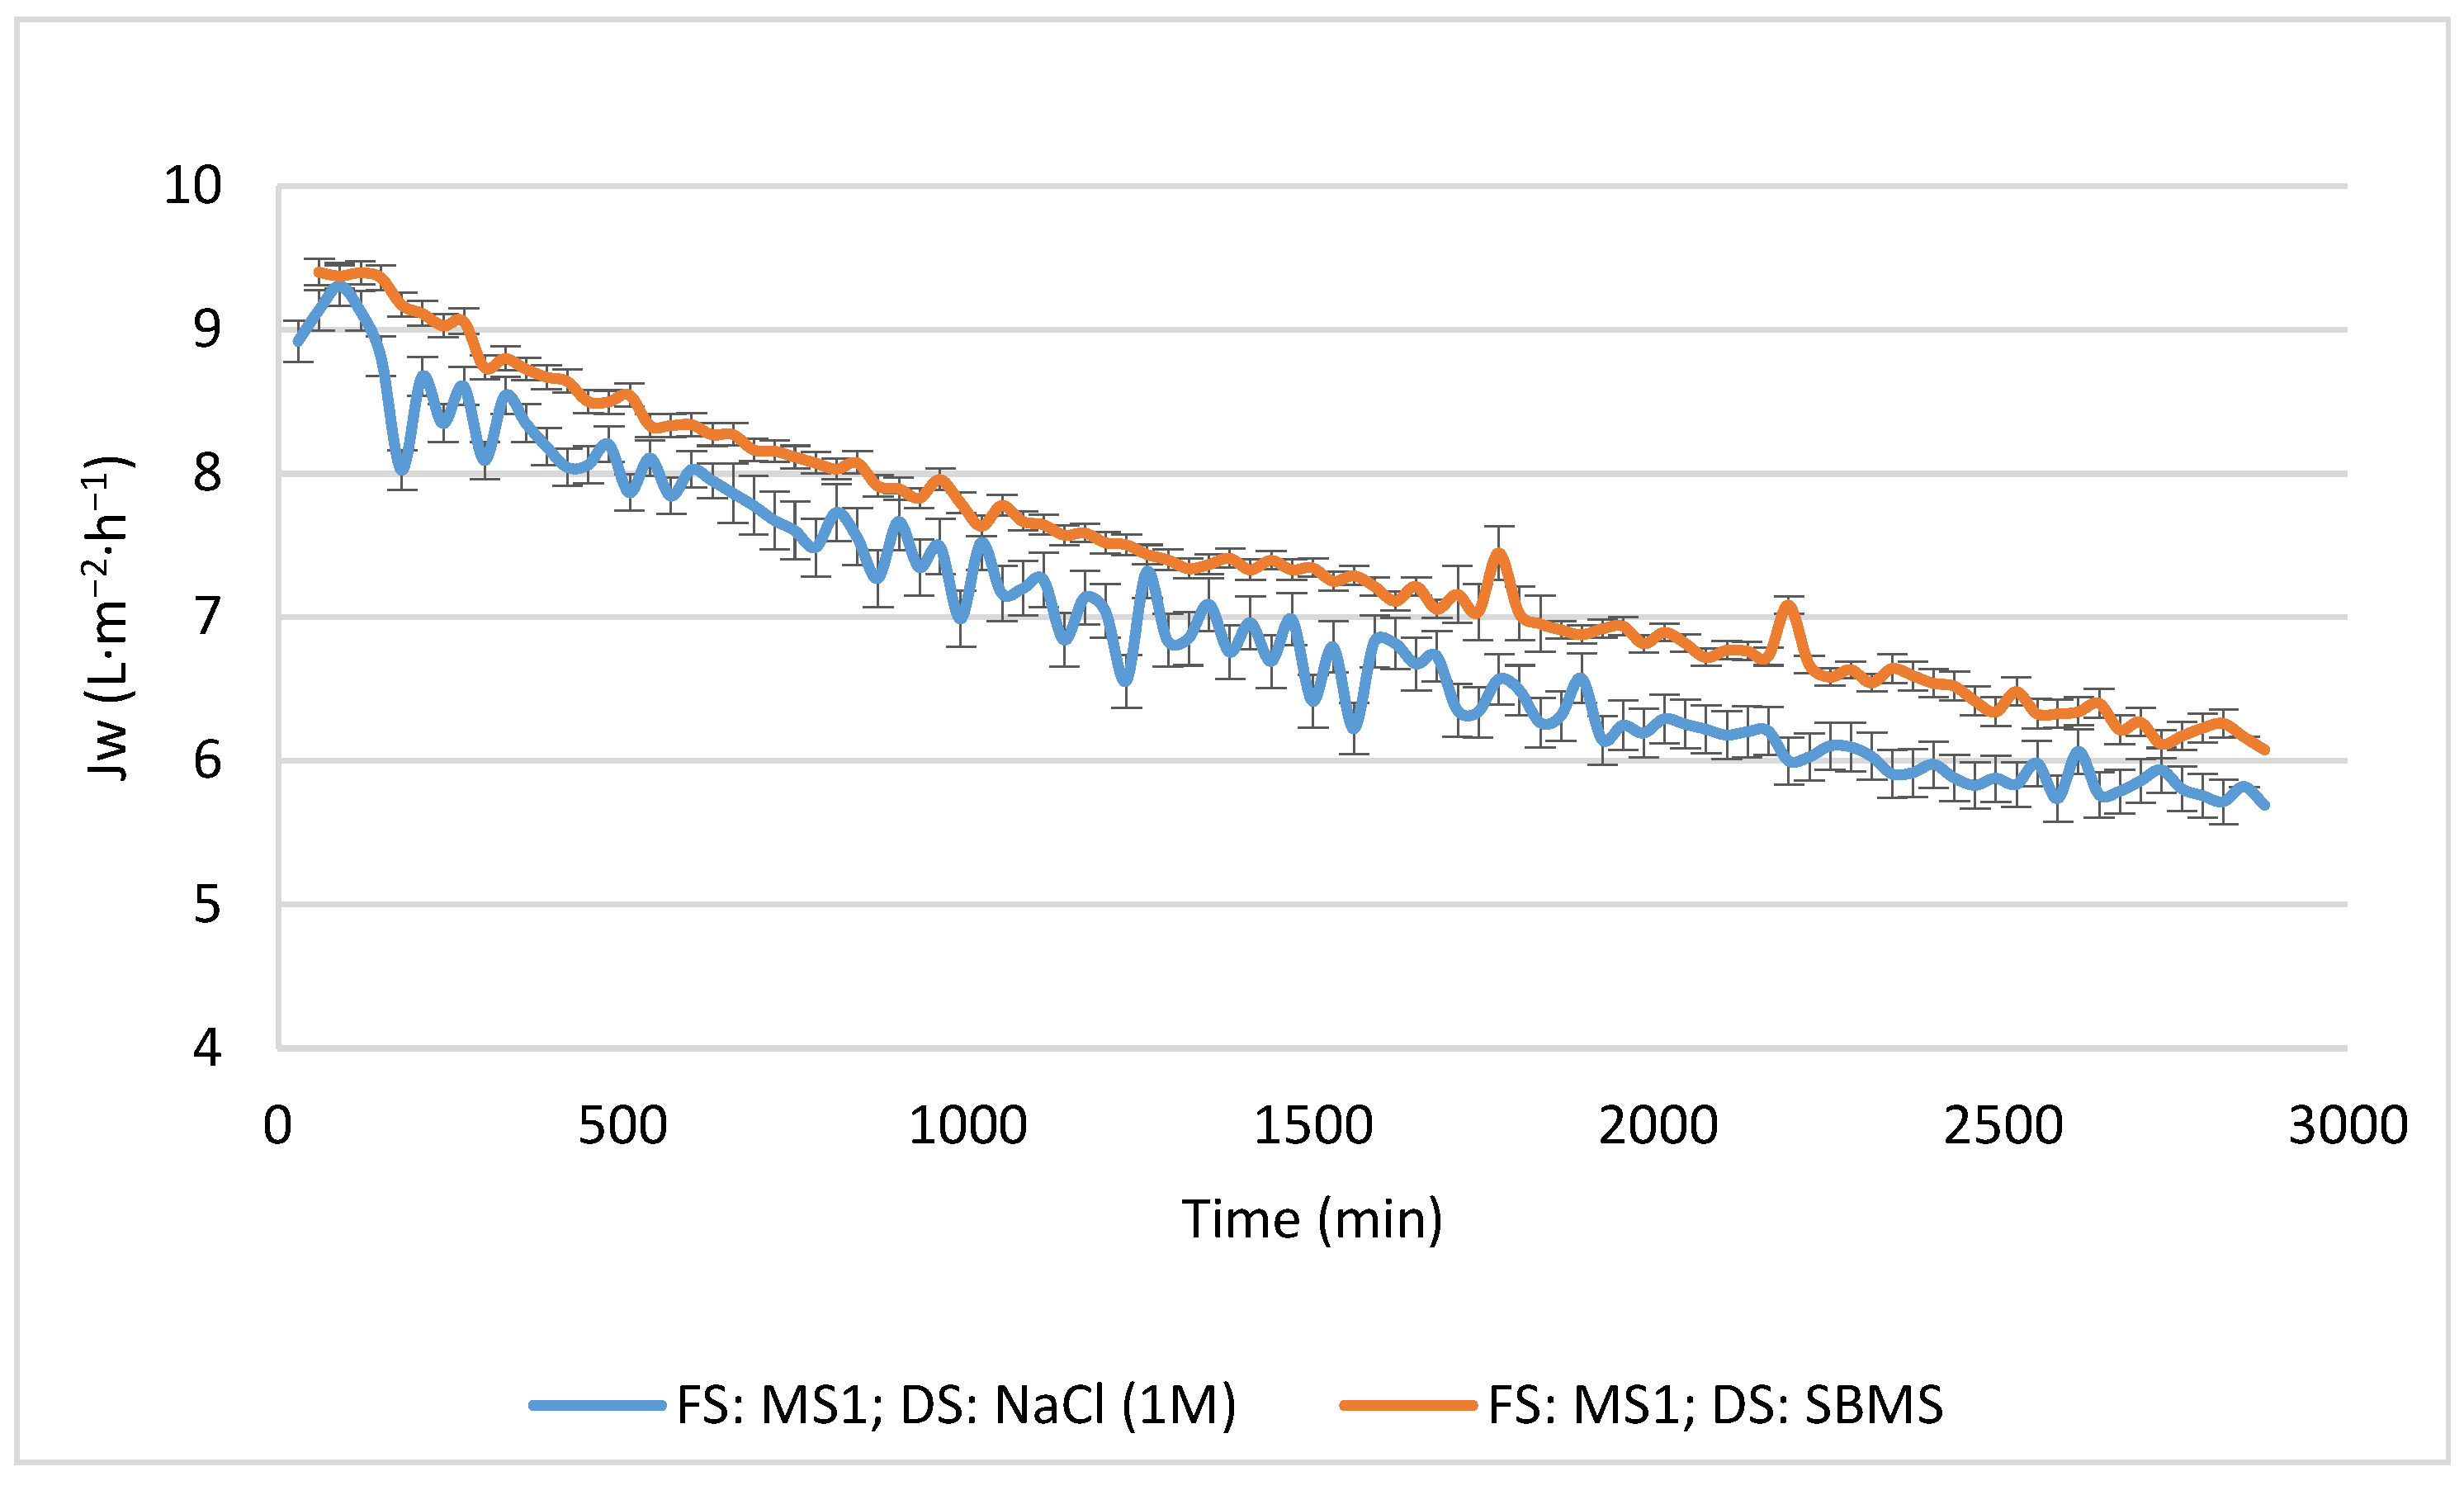
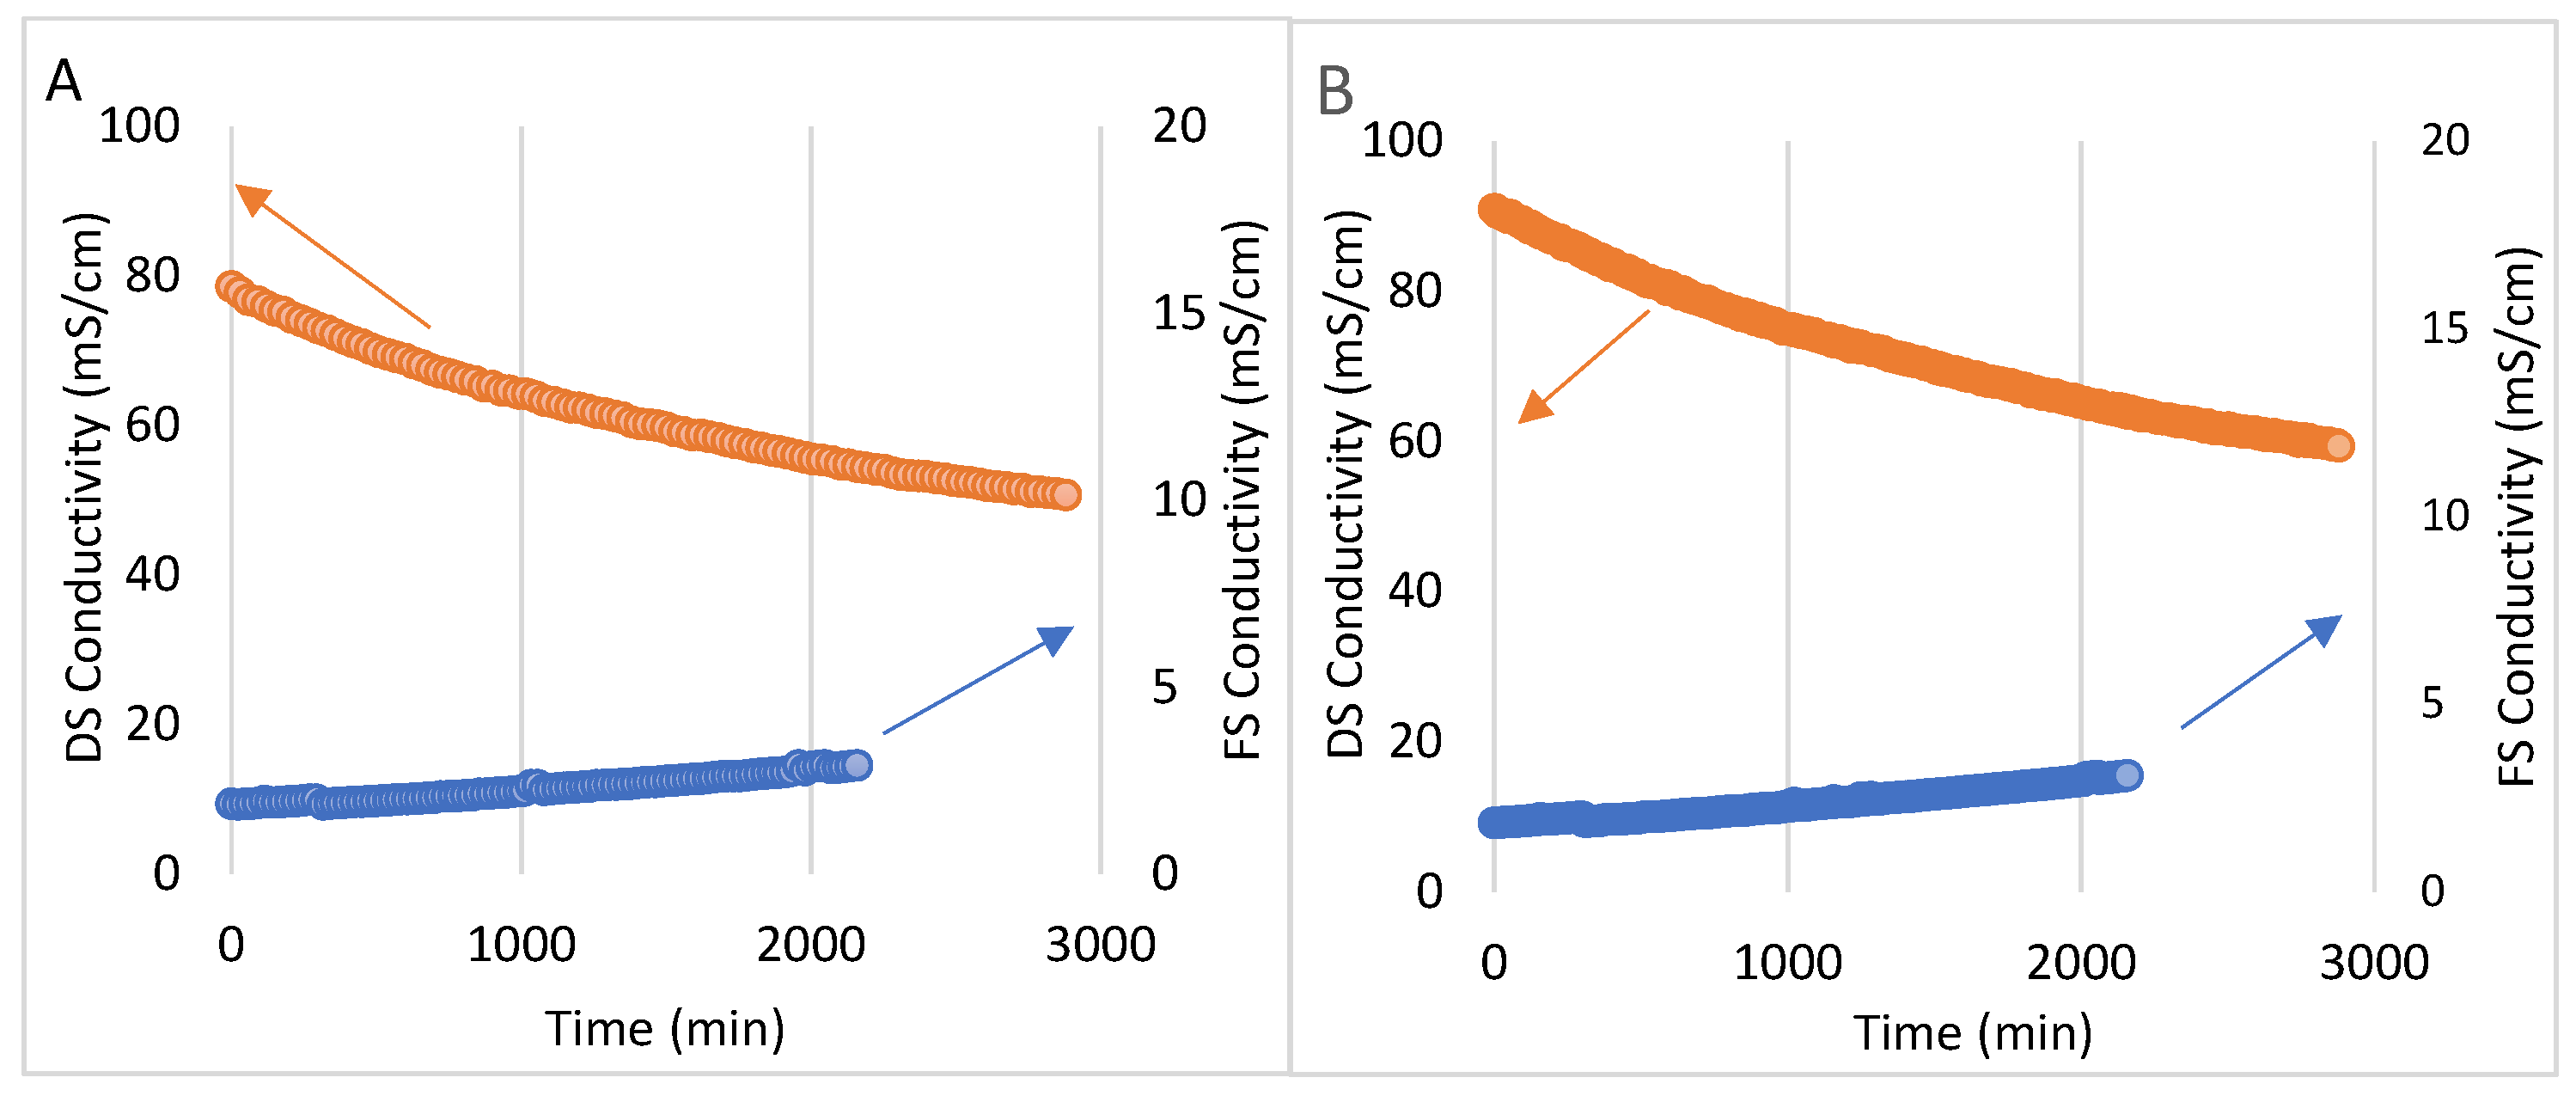
3.2.1. Influence of the Type of DS on the Concentration Efficiency
3.2.2. Influence of the Type of Dye on the Concentration Efficiency
4. Conclusions
Supplementary Materials
Author Contributions
Funding
Institutional Review Board Statement
Data Availability Statement
Conflicts of Interest
References
- Musie, W.; Gonfa, G. Fresh Water Resource, Scarcity, Water Salinity Challenges and Possible Remedies: A Review. Heliyon 2023, 9, e18685. [Google Scholar] [CrossRef] [PubMed]
- Manikandan, S.; Subbaiya, R.; Saravanan, M.; Ponraj, M.; Selvam, M.; Pugazhendhi, A. A Critical Review of Advanced Nanotechnology and Hybrid Membrane Based Water Recycling, Reuse, and Wastewater Treatment Processes. Chemosphere 2022, 289, 132867. [Google Scholar] [CrossRef] [PubMed]
- Huang, H.; Liu, J.; Liu, H.; Evrendilek, F.; Zhang, G.; He, Y. Turning the Co-Combustion Synergy of Textile Dyeing Sludge and Waste Biochar into Emission-to-Bottom Slag Pollution Controls toward a Circular Economy. Renew Energy 2022, 194, 760–777. [Google Scholar] [CrossRef]
- Tavangar, T.; Jalali, K.; Alaei Shahmirzadi, M.A.; Karimi, M. Toward Real Textile Wastewater Treatment: Membrane Fouling Control and Effective Fractionation of Dyes/Inorganic Salts Using a Hybrid Electrocoagulation–Nanofiltration Process. Sep. Purif. Technol. 2019, 216, 115–125. [Google Scholar] [CrossRef]
- Yasmeen, M.; Nawaz, M.S.; Khan, S.J.; Ghaffour, N.; Khan, M.Z. Recovering and Reuse of Textile Dyes from Dyebath Effluent Using Surfactant Driven Forward Osmosis to Achieve Zero Hazardous Chemical Discharge. Water Res. 2023, 230, 119524. [Google Scholar] [CrossRef] [PubMed]
- Farhan Hanafi, M.; Sapawe, N. A Review on the Water Problem Associate with Organic Pollutants Derived from Phenol, Methyl Orange, and Remazol Brilliant Blue Dyes. Mater. Today Proc. 2020, 31, A141–A150. [Google Scholar] [CrossRef]
- Jamil, T.; Yasin, S.; Ramzan, N.; Aslam, H.M.Z.; Ikhlaq, A.; Zafar, A.M.; Aly Hassan, A. Bentonite-Clay/CNT-Based Nano Adsorbent for Textile Wastewater Treatment: Optimization of Process Parameters. Water 2023, 15, 3197. [Google Scholar] [CrossRef]
- López-Rodríguez, D.; Micó-Vicent, B.; Jordán-Núñez, J.; Moncho-Santonja, M.; Bou-Belda, E. Printing with Hydrotalcite Hybrid Nanoclays and Dispersed, Reactive, Direct Dyes. Dye. Pigment. 2023, 210, 111022. [Google Scholar] [CrossRef]
- Yang, X.; López-Grimau, V.; Vilaseca, M.; Crespi, M. Treatment of Textile Wastewater by CAS, MBR, and MBBR: A Comparative Study from Technical, Economic, and Environmental Perspectives Xuefei. Water 2020, 12, 1306. [Google Scholar] [CrossRef]
- Christian, D.; Gaekwad, A.; Dani, H.; Shabiimam, M.A.; Kandya, A. Recent Techniques of Textile Industrial Wastewater Treatment: A Review. Mater. Today Proc. 2023, 77, 277–285. [Google Scholar] [CrossRef]
- Yang, G.; Zhang, J.; Peng, M.; Du, E.; Wang, Y.; Shan, G.; Ling, L.; Ding, H.; Gray, S.; Xie, Z. A Mini Review on Antiwetting Studies in Membrane Distillation for Textile Wastewater Treatment. Processes 2021, 9, 243. [Google Scholar] [CrossRef]
- Jegatheesan, V.; Pramanik, B.K.; Chen, J.; Navaratna, D.; Chang, C.Y.; Shu, L. Treatment of Textile Wastewater with Membrane Bioreactor: A Critical Review. Bioresour. Technol. 2016, 204, 202–212. [Google Scholar] [CrossRef] [PubMed]
- Ikram, M.; Naeem, M.; Zahoor, M.; Hanafiah, M.M.; Oyekanmi, A.A.; Ullah, R.; Farraj, D.A.A.; Elshikh, M.S.; Zekker, I.; Gulfam, N. Biological Degradation of the Azo Dye Basic Orange 2 by Escherichia coli: A Sustainable and Ecofriendly Approach for the Treatment of Textile Wastewater. Water 2022, 14, 2063. [Google Scholar] [CrossRef]
- Khan, A.U.; Rehman, M.U.; Zahoor, M.; Shah, A.B.; Zekker, I. Biodegradation of Brown 706 Dye by Bacterial Strain Pseudomonas aeruginosa. Water 2021, 13, 2959. [Google Scholar] [CrossRef]
- Goh, P.S.; Wong, K.C.; Ismail, A.F. Membrane Technology: A Versatile Tool for Saline Wastewater Treatment and Resource Recovery. Desalination 2022, 521, 115377. [Google Scholar] [CrossRef]
- Keskin, B.; Ersahin, M.E.; Ozgun, H.; Koyuncu, I. Pilot and Full-Scale Applications of Membrane Processes for Textile Wastewater Treatment: A Critical Review. J. Water Process Eng. 2021, 42, 102172. [Google Scholar] [CrossRef]
- Juang, Y.; Nurhayati, E.; Huang, C.; Pan, J.R.; Huang, S. A Hybrid Electrochemical Advanced Oxidation/Microfiltration System Using BDD/Ti Anode for Acid Yellow 36 Dye Wastewater Treatment. Sep. Purif. Technol. 2013, 120, 289–295. [Google Scholar] [CrossRef]
- Barredo-Damas, S.; Alcaina-Miranda, M.I.; Bes-Piá, A.; Iborra-Clar, M.I.; Iborra-Clar, A.; Mendoza-Roca, J.A. Ceramic Membrane Behavior in Textile Wastewater Ultrafiltration. Desalination 2010, 250, 623–628. [Google Scholar] [CrossRef]
- Buscio, V.; Marín, M.J.; Crespi, M.; Gutiérrez-Bouzán, C. Reuse of Textile Wastewater after Homogenization-Decantation Treatment Coupled to PVDF Ultrafiltration Membranes. Chem. Eng. J. 2015, 265, 122–128. [Google Scholar] [CrossRef]
- Barredo-Damas, S.; Alcaina-Miranda, M.I.; Iborra-Clar, M.I.; Mendoza-Roca, J.A. Application of Tubular Ceramic Ultrafiltration Membranes for the Treatment of Integrated Textile Wastewaters. Chem. Eng. J. 2012, 192, 211–218. [Google Scholar] [CrossRef]
- Alcaina-Miranda, M.I.; Barredo-Damas, S.; Bes-Piá, A.; Iborra-Clar, M.I.; Iborra-Clar, A.; Mendoza-Roca, J.A. Nanofiltration as a Final Step towards Textile Wastewater Reclamation. Desalination 2009, 240, 290–297. [Google Scholar] [CrossRef]
- Bes-Piá, A.; Iborra-Clar, A.; García-Figueruelo, C.; Barredo-Damas, S.; Alcaina-Miranda, M.I.; Mendoza-Roca, J.A.; Iborra-Clar, M.I. Comparison of Three NF Membranes for the Reuse of Secondary Textile Effluents. Desalination 2009, 241, 1–7. [Google Scholar] [CrossRef]
- Mamun Kabir, S.M.; Mahmud, H.; Schöenberger, H. Recovery of Dyes and Salts from Highly Concentrated (Dye and Salt) Mixed Water Using Nano-Filtration Ceramic Membranes. Heliyon 2022, 8, e11543. [Google Scholar] [CrossRef] [PubMed]
- Kurt, E.; Koseoglu-Imer, D.Y.; Dizge, N.; Chellam, S.; Koyuncu, I. Pilot-Scale Evaluation of Nanofiltration and Reverse Osmosis for Process Reuse of Segregated Textile Dyewash Wastewater. Desalination 2012, 302, 24–32. [Google Scholar] [CrossRef]
- Nadeem, K.; Guyer, G.T.; Keskinler, B.; Dizge, N. Investigation of Segregated Wastewater Streams Reusability with Membrane Process for Textile Industry. J. Clean. Prod. 2019, 228, 1437–1445. [Google Scholar] [CrossRef]
- Li, K.; Li, M.; Zhang, W.; Xue, Y.; Wang, Z.; Zhang, X. A Staged Forward Osmosis Process for Simultaneous Desalination and Concentration of Textile Wastewaters. ACS EST Water 2023, 3, 1817–1825. [Google Scholar] [CrossRef]
- Han, G.; Liang, C.Z.; Chung, T.S.; Weber, M.; Staudt, C.; Maletzko, C. Combination of Forward Osmosis (FO) Process with Coagulation/Flocculation (CF) for Potential Treatment of Textile Wastewater. Water Res. 2016, 91, 361–370. [Google Scholar] [CrossRef] [PubMed]
- Anis, S.F.; Hashaikeh, R.; Hilal, N. Functional Materials in Desalination: A Review. Desalination 2019, 468, 114077. [Google Scholar] [CrossRef]
- Lin, S.; Zhao, H.; Zhu, L.; He, T.; Chen, S.; Gao, C.; Zhang, L. Seawater Desalination Technology and Engineering in China: A Review. Desalination 2021, 498, 114728. [Google Scholar] [CrossRef]
- Sahu, P. A Comprehensive Review of Saline Effluent Disposal and Treatment: Conventional Practices, Emerging Technologies, and Future Potential. J. Water Reuse Desalin. 2021, 11, 33–65. [Google Scholar] [CrossRef]
- Dutta, S.; Nath, K. Feasibility of Forward Osmosis Using Ultra Low Pressure RO Membrane and Glauber Salt as Draw Solute for Wastewater Treatment. J. Environ. Chem. Eng. 2018, 6, 5635–5644. [Google Scholar] [CrossRef]
- Aouni, A.; Fersi, C.; Cuartas-Uribe, B.; Bes-Pía, A.; Alcaina-Miranda, M.I.; Dhahbi, M. Reactive Dyes Rejection and Textile Effluent Treatment Study Using Ultrafiltration and Nanofiltration Processes. Desalination 2012, 297, 87–96. [Google Scholar] [CrossRef]
- Keskinkan, O.; Lugal Göksu, M.Z. Assessment of the dye removal capability of submersed aquatic plants in a laboratory-scale wetland system using anova. Braz. J. Chem. Eng. 2007, 24, 193–202. [Google Scholar] [CrossRef]
- Khalida, M.; Azmi, A.; Mohd, R.S.; Zaharah, I.; Adibah, Y.; van Loosdrecht, M.C.M.; Azlan, A.; Mohd, Z.N. Development of granular sludge for textile wastewater treatment. Water Res. 2010, 44, 4341–4350. [Google Scholar] [CrossRef]
- Yaseen, D.A.; Scholz, M. Textile dye wastewater characteristics and constituents of synthetic effluents: A critical review. Int. J. Environ. Sci. Technol. 2019, 16, 1193–1226. [Google Scholar] [CrossRef]
- Khanafer, D.; Yadav, S.; Ganbat, N.; Altaee, A.; Zhou, J.; Hawari, A.H. Performance of the Pressure Assisted Forward Osmosis-Msf Hybrid Desalination Plant. Water 2021, 13, 1245. [Google Scholar] [CrossRef]
- Kim, S.; Kook, S.; O’Rourke, B.E.; Lee, J.; Hwang, M.; Kobayashi, Y.; Suzuki, R.; Kim, I.S. Characterization of pore size distribution (PSD) in cellulose triacetate (CTA) and polyamide (PA) thin active layers by positron annihilation lifetime spectroscopy (PALS) and fractional rejection (FR) method. J. Memb. Sci. 2017, 527, 143–151. [Google Scholar] [CrossRef]
- Dutta, S.; Dave, P.; Nath, K. Performance of Low Pressure Nanofiltration Membrane in Forward Osmosis Using Magnesium Chloride as Draw Solute. J. Water Process Eng. 2020, 33, 101092. [Google Scholar] [CrossRef]
- Wu, L.; Li, Q.; Ma, C.; Li, M.; Yu, Y. A Novel Conductive Carbon-Based Forward Osmosis Membrane for Dye Wastewater Treatment. Chemosphere 2022, 308, 136367. [Google Scholar] [CrossRef]
- Yuan, H.; Hao, R.; Sun, H.; Zeng, W.; Lin, J.; Lu, S.; Yu, M.; Lin, S.; Li, J.; Chen, L. Engineered Janus cellulose membrane with the asymmetric-pore structure for the superhigh-water flux desalination. Carbohydr. Polym. 2022, 291, 119601. [Google Scholar] [CrossRef]
- Döpkens, E.; Jonas, R.; Jung, T.; Krull, R. Rückführung von Abwasserteilströmen Der Textilveredlung in Den Produktionsprozess. In Prepr. Colloq. Produktionsintegrieter Wasser Abwasserechnik, “Nachhaltige Prod. der Textilveredlung” und “Membrantechnik”; GVC: Bremen, Germany, 2001; pp. B143–B157. [Google Scholar]
- Camilleri-Rumbau, M.S.; Soler-Cabezas, J.L.; Christensen, K.V.; Norddahl, B.; Mendoza-Roca, J.A.; Vincent-Vela, M.C. Application of Aquaporin-Based Forward Osmosis Membranes for Processing of Digestate Liquid Fractions. Chem. Eng. J. 2019, 371, 583–592. [Google Scholar] [CrossRef]
- Cifuentes-Cabezas, M.; Álvarez-Blanco, S.; Mendoza-Roca, J.A.; Vincent-Vela, M.C.; Gozálvez-Zafrilla, J.M. Theoretical Model for the Prediction of Water Flux during the Concentration of an Olive Mill Wastewater Model Solution by Means of Forward Osmosis. Membranes 2023, 13, 745. [Google Scholar] [CrossRef] [PubMed]
- Lutchmiah, K.; Verliefde, A.R.D.; Roest, K.; Rietveld, L.C.; Cornelissen, E.R. Forward Osmosis for Application in Wastewater Treatment: A Review. Water Res. 2014, 58, 179–197. [Google Scholar] [CrossRef] [PubMed]
- Zhang, X.; Ning, Z.; Wang, D.K.; Diniz da Costa, J.C. Processing Municipal Wastewaters by Forward Osmosis Using CTA Membrane. J. Memb. Sci. 2014, 468, 269–275. [Google Scholar] [CrossRef]
- Cifuentes-Cabezas, M.; Pavani, A.; Vincent-Vela, M.C.; Mendoza-Roca, J.A.; Álvarez-Blanco, S. Concentration of Phenolic Compounds from Olive Washing Wastewater by Forward Osmosis Using Table Olive Fermentation Brine as Draw Solution. Environ. Technol. Innov. 2023, 30, 103054. [Google Scholar] [CrossRef]
- Sanahuja-Embuena, V.; Khensir, G.; Yusuf, M.; Andersen, M.F.; Nguyen, X.T.; Trzaskus, K.; Pinelo, M.; Helix-Nielsen, C. Role of Operating Conditions in a Pilot Scale Investigation of Hollow Fiber Forward Osmosis Membrane Modules. Membranes 2019, 9, 66. [Google Scholar] [CrossRef] [PubMed]
- McCutcheon, J.R.; Elimelech, M. Modeling Water Flux in Forward Osmosis: Implications for Improved Membrane Design. AIChE J. 2007, 53, 1736–1744. [Google Scholar] [CrossRef]
- Boo, C.; Lee, S.; Elimelech, M.; Meng, Z.; Hong, S. Colloidal Fouling in Forward Osmosis: Role of Reverse Salt Diffusion. J. Memb. Sci. 2012, 390–391, 277–284. [Google Scholar] [CrossRef]
- Hamdan, M.; Sharif, A.O.; Derwish, G.; Al-Aibi, S.; Altaee, A. Draw Solutions for Forward Osmosis Process: Osmotic Pressure of Binary and Ternary Aqueous Solutions of Magnesium Chloride, Sodium Chloride, Sucrose and Maltose. J. Food Eng. 2015, 155, 10–15. [Google Scholar] [CrossRef]
- Ibrar, I.; Yadav, S.; Altaee, A.; Hawari, A.; Nguyen, V.; Zhou, J. A Novel Empirical Method for Predicting Concentration Polarization in Forward Osmosis for Single and Multicomponent Draw Solutions. Desalination 2020, 494, 114668. [Google Scholar] [CrossRef]
- Holloway, R.W.; Maltos, R.; Vanneste, J.; Cath, T.Y. Mixed Draw Solutions for Improved Forward Osmosis Performance. J. Memb. Sci. 2015, 491, 121–131. [Google Scholar] [CrossRef]
- Chia, W.Y.; Chia, S.R.; Khoo, K.S.; Chew, K.W.; Show, P.L. Sustainable Membrane Technology for Resource Recovery from Wastewater: Forward Osmosis and Pressure Retarded Osmosis. J. Water Process Eng. 2021, 39, 101758. [Google Scholar] [CrossRef]
- Salih, H.H.; Dastgheib, S.A. Treatment of a Hypersaline Brine, Extracted from a Potential CO2 Sequestration Site, and an Industrial Wastewater by Membrane Distillation and Forward Osmosis. Chem. Eng. J. 2017, 325, 415–423. [Google Scholar] [CrossRef]
- Haupt, A.; Lerch, A. Forward Osmosis Application in Manufacturing Industries: A Short Review. Membranes 2018, 8, 47. [Google Scholar] [CrossRef] [PubMed]
- Benkhaya, S.; El Harfi, S.; El Harfi, A. Classifications, Properties and Applications of Textile Dyes: A Review. Appl. J. Environ. Eng. Sci. 2017, 3, 311–320. [Google Scholar] [CrossRef]
- Benkhaya, S.; M’rabet, S.; El Harfi, A. A Review on Classifications, Recent Synthesis and Applications of Textile Dyes. Inorg. Chem. Commun. 2020, 115, 107891. [Google Scholar] [CrossRef]
- Zaharia, C.; Suteo, D. Textile Organic Dyes–Characteristics, Polluting Effects and Separation/Elimination Procedures from Industrial Effluents—A Critical Overview. In Organic Pollutants Ten Years After the Stockholm Convention—Environmental and Analytical Update; InTech: London, UK, 2012. [Google Scholar] [CrossRef]
- Makki, H.F.; Abdul Wahab, M.; Said, R.R. Forward Osmosis Process for the Treatment Wastewater from Textile Industries. J. Eng. 2013, 19, 1557–1565. [Google Scholar] [CrossRef]
- Ammar, A.; Dofan, I.; Jegatheesan, V.; Muthukumaran, S.; Shu, L. Comparison between Nanofiltration and Forward Osmosis in the Treatment of Dye Solutions. Desalin. Water Treat. 2015, 54, 853–861. [Google Scholar] [CrossRef]
- De Jesus da Silveira Neta, J.; Costa Moreira, G.; da Silva, C.J.; Reis, C.; Reis, E.L. Use of Polyurethane Foams for the Removal of the Direct Red 80 and Reactive Blue 21 Dyes in Aqueous Medium. Desalination 2011, 281, 55–60. [Google Scholar] [CrossRef]
- Ardhan, N.; Ruttithiwapanich, T.; Songkasiri, W.; Phalakornkule, C. Comparison of Performance of Continuous-Flow and Batch Electrocoagulators: A Case Study for Eliminating Reactive Blue 21 Using Iron Electrodes. Sep. Purif. Technol. 2015, 146, 75–84. [Google Scholar] [CrossRef]
- Abdullah, R.H.; Oda, A.M.; Omran, A.R.; Mottaleb, A.S.; Mubarakah, T.M. Study of Adsorption Characteristics a Low-Cost Sawdust for the Removal of Direct Blue 85 Dye from Aqueous Solutions. Indones. J. Chem. 2018, 18, 724–732. [Google Scholar] [CrossRef]
- Darwish, N.B.; Alkhudhiri, A.; AlAlawi, A.; AlRomaih, H.; Hilal, N. Experimental Investigation of Forward Osmosis Process for Boron Removal from Water. J. Water Process Eng. 2020, 38, 101570. [Google Scholar] [CrossRef]
- Liu, S.; Tong, X.; Liu, S.; An, D.; Yan, J.; Chen, Y.; Crittenden, J. Multi-Functional Tannic Acid (TA)-Ferric Complex Coating for Forward Osmosis Membrane with Enhanced Micropollutant Removal and Antifouling Property. J. Memb. Sci. 2021, 626, 119171. [Google Scholar] [CrossRef]
- Szczygiełda, M.; Krajewska, M.; Zheng, L.; Nghiem, L.D.; Prochaska, K. Implementation of Forward Osmosis to Concentrate Alpha-Ketoglutaric Acid from Fermentation Broth: Performance and Fouling Analysis. J. Memb. Sci. 2021, 637, 119593. [Google Scholar] [CrossRef]
- Khattab, T.A.; Abdelrahman, M.S.; Rehan, M. Textile Dyeing Industry: Environmental Impacts and Remediation. Environ. Sci. Pollut. Res. 2020, 27, 3803–3818. [Google Scholar] [CrossRef]
- Affat, S.S. Classifications, Advantages, Disadvantages, Toxicity Effects of Natural and Synthetic Dyes: A Review. Univ. Thi-Qar J. Sci. 2021, 8, 130–135. [Google Scholar]


| Dye | Type | Chemical Structure | MW (g/mol) |
|---|---|---|---|
| Remazol turquoise blue G 133% | Reactive | 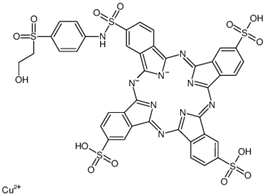 | 1079.55 |
| Sirius Blue K-CFN | Direct |  | 1098.93 |
| Test No. | Nomenclature FS | Composition of FS | Nomenclature DS | Composition of DS |
|---|---|---|---|---|
| 1 | MS1 | 0.05 g·L−1 Remazol turquoise blue G 133% + 0.5 g·L−1Na2SO4 + 0.5 g·L−1 NaCl | ---- | 1 M NaCl |
| 2 | MS1 | 0.05 g·L−1 Remazol turquoise blue G 133% + 0.5 g·L−1Na2SO4 + 0.5 g·L−1 NaCl | SBMS | 1M NaCl (58.44 g·L−1) + 8.50 g·L−1 Na2SO4 + 25.76 g·L−1 MgCl2·6H2O |
| 3 | MS2 | 0.05 g·L−1 Sirius Blue K-CFN + 0.5 g·L−1 Na2SO4 + 0.5 g·L−1 NaCl | SBMS | 1M NaCl (58.44 g·L−1) + 8.50 g·L−1 Na2SO4 + 25.76 g·L−1 MgCl2·6H2O |
| DS | FS | ||||
|---|---|---|---|---|---|
| Test No. | Parameter | Initial | Final | Initial | Final |
| 1 | SO42− (g/L) | - | - | 0.46 ± 0.07 | 0.58 ± 0.10 |
| Na+ (g/L) | 30.90 ± 1.14 | 14.2 ± 0.24 | 0.28 ± 0.03 | 0.51 ± 0.07 | |
| Cl− (g/L) | 37.75 ± 0.35 | 20.75 ± 1.35 | 0.37 ± 0.01 | 0.66 ± 0.02 | |
| Mg2+ (g/L) | 0.61 ± 0.01 | 0.27 ± 0.24 | 0.01 ± 0.01 | 0.02 ± 0.02 | |
| Fz | - | - | 0.67 ± 0.02 | 1.03 ± 0.04 | |
| pH | 6.46 ± 0.1 | 6.42 ± 0.1 | 6.61 ± 0.1 | 6.72 ± 0.1 | |
| 2 | SO42− (g/L) | 5.95 ± 0.07 | 3.50 ± 0.12 | 0.43 ± 0.01 | 0.62 ± 0.03 |
| Na+ (g/L) | 32.65 ± 0.21 | 16.60 ± 0.43 | 0.30 ± 0.14 | 0.53 ± 0.07 | |
| Cl− (g/L) | 40.00 ± 2.70 | 27.50 ± 1.03 | 0.38 ± 0.02 | 0.71 ± 0.02 | |
| Mg2+ (g/L) | 2.95± 0.70 | 1.44 ± 0.20 | 0.01 ± 0.00 | 0.03 ± 0.00 | |
| Fz | - | - | 0.69 ± 0.03 | 1.07 ± 0.07 | |
| pH | 6.18 ± 0.1 | 6.28 ± 0.1 | 6.65 ± 0.1 | 6.62 ± 0.1 | |
| DS | FS | ||||
|---|---|---|---|---|---|
| Test No. | Parameter | Initial | Final | Initial | Final |
| 3 | Conductivity (mS/cm) | 92.30 | 59.10 | 2.13 | 3.20 |
| Fz | - | - | 0.838 | 1.275 | |
Disclaimer/Publisher’s Note: The statements, opinions and data contained in all publications are solely those of the individual author(s) and contributor(s) and not of MDPI and/or the editor(s). MDPI and/or the editor(s) disclaim responsibility for any injury to people or property resulting from any ideas, methods, instructions or products referred to in the content. |
© 2023 by the authors. Licensee MDPI, Basel, Switzerland. This article is an open access article distributed under the terms and conditions of the Creative Commons Attribution (CC BY) license (https://creativecommons.org/licenses/by/4.0/).
Share and Cite
Cifuentes-Cabezas, M.; García-Suarez, L.; Soler-Cabezas, J.L.; Cuartas-Uribe, B.; Álvarez-Blanco, S.; Mendoza-Roca, J.A.; Vincent-Vela, M.-C. Feasibility of Forward Osmosis to Recover Textile Dyes Using Single Salts and Multicomponent Draw Solutions. Membranes 2023, 13, 911. https://doi.org/10.3390/membranes13120911
Cifuentes-Cabezas M, García-Suarez L, Soler-Cabezas JL, Cuartas-Uribe B, Álvarez-Blanco S, Mendoza-Roca JA, Vincent-Vela M-C. Feasibility of Forward Osmosis to Recover Textile Dyes Using Single Salts and Multicomponent Draw Solutions. Membranes. 2023; 13(12):911. https://doi.org/10.3390/membranes13120911
Chicago/Turabian StyleCifuentes-Cabezas, Magdalena, Laura García-Suarez, José Luis Soler-Cabezas, Beatriz Cuartas-Uribe, Silvia Álvarez-Blanco, José Antonio Mendoza-Roca, and María-Cinta Vincent-Vela. 2023. "Feasibility of Forward Osmosis to Recover Textile Dyes Using Single Salts and Multicomponent Draw Solutions" Membranes 13, no. 12: 911. https://doi.org/10.3390/membranes13120911