Abstract
The focus of this paper is to define anchorage management model for concession planning purposes to provide quality support to experts in spatial planning when developing maritime spatial plans. The research aim is to develop an anchorage management model that includes decision and concession support concept. Decision support concept is defined in order to support the processes of identifying potential anchorage locations, their evaluation and comparison, and finally, the priority ranking and selection of locations for their construction. The final step is modelling the concession support concept that includes financial analysis to concession parameters definition. The problem of decision making and concession of the anchorage location selection is complex and ill-structured because of the unsystematic and ad-hoc decisions by all included stakeholders. Additionally, the involvement of several stakeholders’ groups with different preferences and background knowledge, a large amount of conflicting and seemingly incomparable information and data, and numerous conflicting goals and criteria impact final decisions. The proposed concepts overcome the above obstacles in order to enable the construction of anchorages in a way of optimal use of maritime space. The model is tested on the island of Brač, Croatia. The methods used to solve the task are SWARA (The Stepwise Weight Assessment Ratio Analysis) for defining the criteria weights and ELECTRE (Elimination and Choice Expressing Reality) for ranking anchorage locations.
1. Introduction
Croatia has a 5790-km long coastline, of which 4012 km is island line, with a total of 66 inhabited and 652 uninhabited islands, 78 reefs, and 389 cliffs [1]. In Croatia, nautical tourism has great economic and tourist potential and is important as an activity with a very high tendency of growth and expansion in the future [2]. It is estimated that nautical tourism will continue to grow in the next period given that Croatia has great potential as a leading country in nautical tourism in the Mediterranean. The system of concessions in the Republic of Croatia is regulated by the Law of Concessions [3], in use since 2012. The Concessions Act is a basic regulation that regulates all issues related to concessions at the general level. The provisions of Articles 17 and 18 of the Law on Maritime Domain and Seaports [4] stipulate that a concession for the economic use of a maritime property is granted on the basis of public bidding and that the decision on public bidding is made by the concession grantor. The Law on Maritime Property and Seaports must contain the criteria on the basis of which the most favourable bid will be selected.
Systemic understanding of ocean and coastal environment needs the integration of a large amount of various spatial and non-spatial data. The goals of ocean and coastal management should be accomplished with the use of appropriate data collection from various sources, which include environmental, social, cultural, and economic data, acquired in compliance with the EU regulations [5]. Result should be from a knowledge database able to effectively inform ecosystem-based management actions, such as maritime spatial planning [6]. Due to the number of various data and the multi-sectoral and multi-level stakeholders and their different needs and uses of marine area, MSP (maritime spatial planning) is organized as a spatial explicit decision-making process to establish rational coordination between various objectives, with a high emphasis on sustainable use of marine resources [7]. It is still common that the decision-making process on marine resource management is based on the experience and limited knowledge of only a narrow circle of stakeholders who are most often functionally involved in it. Experts in the field of research and their specific professional and scientific knowledge are most often not recognized as a key link in the decision-making process [8]. The aim of this research is to propose a decision support and a concession support concept that will be based on multi-criteria analysis despite conflicting criteria of different natures and while respecting the attitudes, knowledge, and preferences of several stakeholder groups.
1.1. Research Focus
According to spatial and market analysis, the number of anchorages in the Split-Dalmatia County is in deficit. Given the above, it is necessary to explore in detail the possibilities of planning the construction and management of anchorages. Special attention should be paid to compliance with all spatial requirements for the realization of full functional and socio-economic potential as well as the fulfillment of conditions related to environmental protection and cultural assets. Nautical tourism development planning as well as planning and management of its infrastructure is one of the important topics in MSP [9].
The planning process involves an analysis of the existing situation, identification of potential anchorage locations and its relevant characteristics, the establishment of priority relation between them, and in the end, the development an anchorage management model for concession planning purposes. Priority ranking of anchorages is a necessity because of the impossibility and also the lack of need for the realization of all anchors at the same time. The aim of the research is to model a decision support and a concession support concept that will provide quality support to experts in spatial planning when developing maritime spatial plans. The main scientific contributions relate to identification of relevant stakeholder groups involved in decision-making processes, their contribution to defining the relevant criteria and their weights, comparison of anchorage locations according to selected criteria, and their priority ranking. Based on the obtained results and the best-ranked anchorage location, a financial analysis was made (study of the economic adequacy for granting the concession) from which the investment plan is derived. The final results refer to definition of the parameters for concession of other anchorage locations. In addition to plans related to the development of anchorage capacities, with a certain modification, the approach can be used in the development of other infrastructural elements related to the development of nautical tourism. The research is aimed at supporting the processes of identifying potential anchorage locations, their evaluation and comparison, and finally, the priority ranking and selection of locations for their construction. The last step is modelling concession support concept. The concept provides financial analysis from which the investment plan (the structure and value of total investment in construction and use of special-purpose port-anchorage) and the formation and distribution of total income-expenditure emerge. The results of the financial analysis are based on a study of the economic adequacy for granting the concession. The main goal of the study is to define whether it is justified to approach the construction of anchorages at the analyzed site and what should be the minimum fixed and variable part of the concession fee. Based on the investment plan, the parameters for concession of other anchorage locations are defined.
The research problem is complex and ill-structured. The reasons for this are the involvement of several stakeholder groups with different preferences and background knowledge, a large amount of conflicting and seemingly incomparable information, and data and numerous conflicting goals and criteria. The proposed concept overcomes the above obstacles in order to take into account the opinions of all stakeholders involved in the decision-making process and reduce the relevant criteria to a level that allows their comparison. The concept enables the construction of anchorages in a way that enables the use of maritime space by maximizing positive social and techno-economic impacts on the local community while protecting natural and cultural assets.
The results of ranked anchorage locations are analyzed, and the most favorable location for concession is determined. The financial analysis of the best-ranked location is carried out in the form of the study of economic adequacy for granting a concession and estimation of the value of the concession for economic use of anchorages [1]. The legal background of this analysis lies in the Law on Concessions [3] and the Decree on the Procedure for Granting Concessions on Maritime Property [10]. With the results obtained using the methods of ELECTRE (Elimination and Choice Expressing Reality) and SWARA (The Stepwise Weight Assessment Ratio Analysis) and financial analysis of the most favorable location for anchoring in concession, the parameters related to the assessment of the value of concessions of all other potential locations are defined.
Qualitative processing of the research topic requires the definition of terms related to the nautical tourism and anchorages. The legal definition of nautical tourism is defined by the Act on the Provision of Tourism Services [11] as follows: “Nautical tourism are navigation and docks for tourists—boaters, as well as ports for rest and recreation”. As one of the more comprehensive definitions, which best illuminates the essence of a thing, determines its content, and clarifies the meaning of a word, the following can be pointed out [12]: “Nautical tourism is defined as the totality of multifunctional activities and relationships caused by the stay of nautical tourists in or outside nautical tourism ports and the use of vessels as well as other facilities related to nautical tourism for recreation, sports, leisure and other needs”.
According to the Regulation of Classification and Categorization of Nautical Tourism Ports [13], the anchorage is defined as a part of the water space equipped with equipment for vessels mooring in a bay protected from the storm. From the marine point of view, protected and unprotected (open) anchorages differ. In protected anchors, the ship can be swept away from stormy weather. Unprotected anchors are suitable for anchoring at good weather or wind from a land that does not develop waves, if the bottom is well maintained by an anchored ship. Unprotected anchorages are considered temporary because ships are anchored here, if weather conditions are favorable, while waiting for free land traffic or clearance entry to port. With regard to the type and size of vessels that are anchored on the appropriate water surface, it can be distinguished as follows: (1) Large vessels: passenger and cargo ships—mainly located in front of passenger and cargo-industrial ports and can also be considered as part of the port; and (2) anchors for smaller vessels: nautical boats, excursion boats, fisher-boats, etc. The latter are in the focus of the research presented in this paper. Anchors for smaller vessels have been considered in detail as acceptable locations for boat residence, primarily along the coastal zone of the Central Dalmatian islands (the island part of the Split-Dalmatia County), which are in the spatial scope of the survey.
1.2. Literature Review
Kyvelou and Ierapetritis [14] presented data and information on the fisheries sector in Greece and explored the options of their survival and sustainability, combining fisheries and tourism as a small-scale and soft multi-use in the marine space. De Grunt and Calado [15] explored how an increased involvement of the Regional Sea Conventions (RSCs) in regional cooperation affects maritime spatial planning, analysing the results of a survey under European maritime spatial planning experts. Bieda, Adamczyk, and Parzych [16] evaluated maritime spatial planning system based on the research material that includes provisions of the international and of the national laws. The approach is used to define the directions of development of maritime spatial planning in Poland based on the current conditions of the spatial planning procedure for these areas as well as the future phenomena. Jean et al. [17] explored MSP Challenge 2050, a serious game to be used as a new maritime planning support system. The game was tested on the three case studies held in Newfoundland, Venice, and Copenhagen, while Kejiser et al. [18] applied it on the competent MSP authorities in Scotland and Belgium. Ciołek et al. [19] presented the results of a face-to-face survey of Polish fishermen’s attitudes towards maritime spatial planning. Da luz Fernandez, Quintela, and Alves [20] developed a new approach to select high-priority areas facing less anthropogenic impact in the Portuguese mainland subdivision. The aim was to support the maritime spatial planning process with ecological meaningful information. Fernandes et al. [21], in their research, focused on a particular stage of the work developed within the Strategic Environmental Assessment of PSOEM (Plano de Situação do Ordenamento do Espaço Marítimo), which is the first-line instrument in maritime spatial planning, regarding the assessment of the activities that may significantly affect Natura 2000 marine network within the mainland subdivision. Abramić, Mendoza, and Haroun [22] proposed an approach for integrating Offshore Wind Energy facilities into sea space, determining the most suitable locations with regard to the five clusters: oceanographic potential, environmental sensibility, restrictions related to marine conservation, land–sea interactions, and avoiding potential conflict with current maritime and coastal activities. Pınarbaşı, Galparsoro, and Borja [23] used decision support tools to add value to current knowledge by capturing end-user opinions on their applications in maritime spatial planning processes. Bonnevie, Sten Hansen, and Schrøder [24] examined the potential for exploring use-use interactions with decision support tools that are used as part of maritime spatial planning processes to support co-location. The focus is on use-use’s synergies and conflicts that come from the spatial-temporal proximity of co-located marine-based uses. Liversage et al. [25] used modelling, meta-analyses, and the impact assessment tool to determine the locations most vulnerable to spread of non-indigenous species and the relative effect-sizes and area impact expected in these locations. Hassler et al. [26], in their research, analysed challenges from the combination of broad boundaries and called for more transnational coordination in the Maritime Spatial Planning Directive and discussed how they have been handled by the member states and ways to improve integration and long-term sustainability in Baltic Sea marine spatial planning. Furlan et al. [27] proposed a framework of GIS-based Bayesian network to simulate and evaluate potential climate change scenarios and different management options responding to regulatory and marine strategies requirements, including the achievement of predefined objectives envisioned for the Adriatic Sea. Papageorgiou [28] proposed a five-step strategy for considering Underwater Cultural Heritage (UCH) in maritime spatial planning, where first sites and objects of UCH were evaluated, then ways to upgrade the economic value of UCH sites were identified. Furthermore, the most appropriate type of protection zoning was selected, and regulations and restrictions for activities within the UCH protection zone were provided. Finally, integration and cohesion of adopted UCH zones with the spatial/sea-use planning in the wider marine area were ensured. Zaucha and Kreiner [29] made a comparison of the engagement of stakeholders in the maritime spatial planning in Namibia and countries of Baltic Sea region. Elliott et al. [30] proposed an approach based on hypothetical example and Best Expert Judgement methodology for maintaining the environmental quality of seas and at the same time maximising economic potential of maritime states, requiring adequate science, governance, and management measures. Psuty, Kulikowski, and Szymanek [31] presented extensive research in the form of interviews using maps to determine significant fishing grounds and their relative importance. The stakeholders were integrated into the maritime spatial planning to achieve successful planning outcomes. The research was conducted on the Polish fishing fleet. Abramic et al. [32], in their study, analysed how the implementation of INSPIRE data model can support data management processes needed for setting up maritime spatial planning. Weig and Schultz-Zehden [33] developed a Spatial Economic Benefit Analysis tool to analyse, beside the ecological and jurisdictional, the economic effects of decisions in maritime spatial planning. Quero García, García Sanabria, and Chica Ruiz [34] presented an evaluation of the influence of maritime spatial planning processes on the blue energy advances within the framework of the European Union for the countries such as Germany, the Netherlands, and the United Kingdom. Zaucha [35] presented and discussed the methodology of maritime spatial planning and the lessons learned through its practical implementation in Poland.
Furthermore, decision-making processes have been applied in MSP in studies dealing with the protection of environment, ecology, biodiversity, coastal, and seabed habitat features [36,37,38,39,40,41,42,43]; marine traffic [44,45,46,47,48,49,50,51,52,53]; planning strategy of anchorage [54]; and site identification and selection [55,56,57,58]. Most of the studies that have had applied decision making for different activities in MSP deal with ecological issues and regulation of traffic within maritime industrial ports, but none of them made a development of the spatial plans related to the construction and economical aspects of anchorages.
2. Materials and Methods
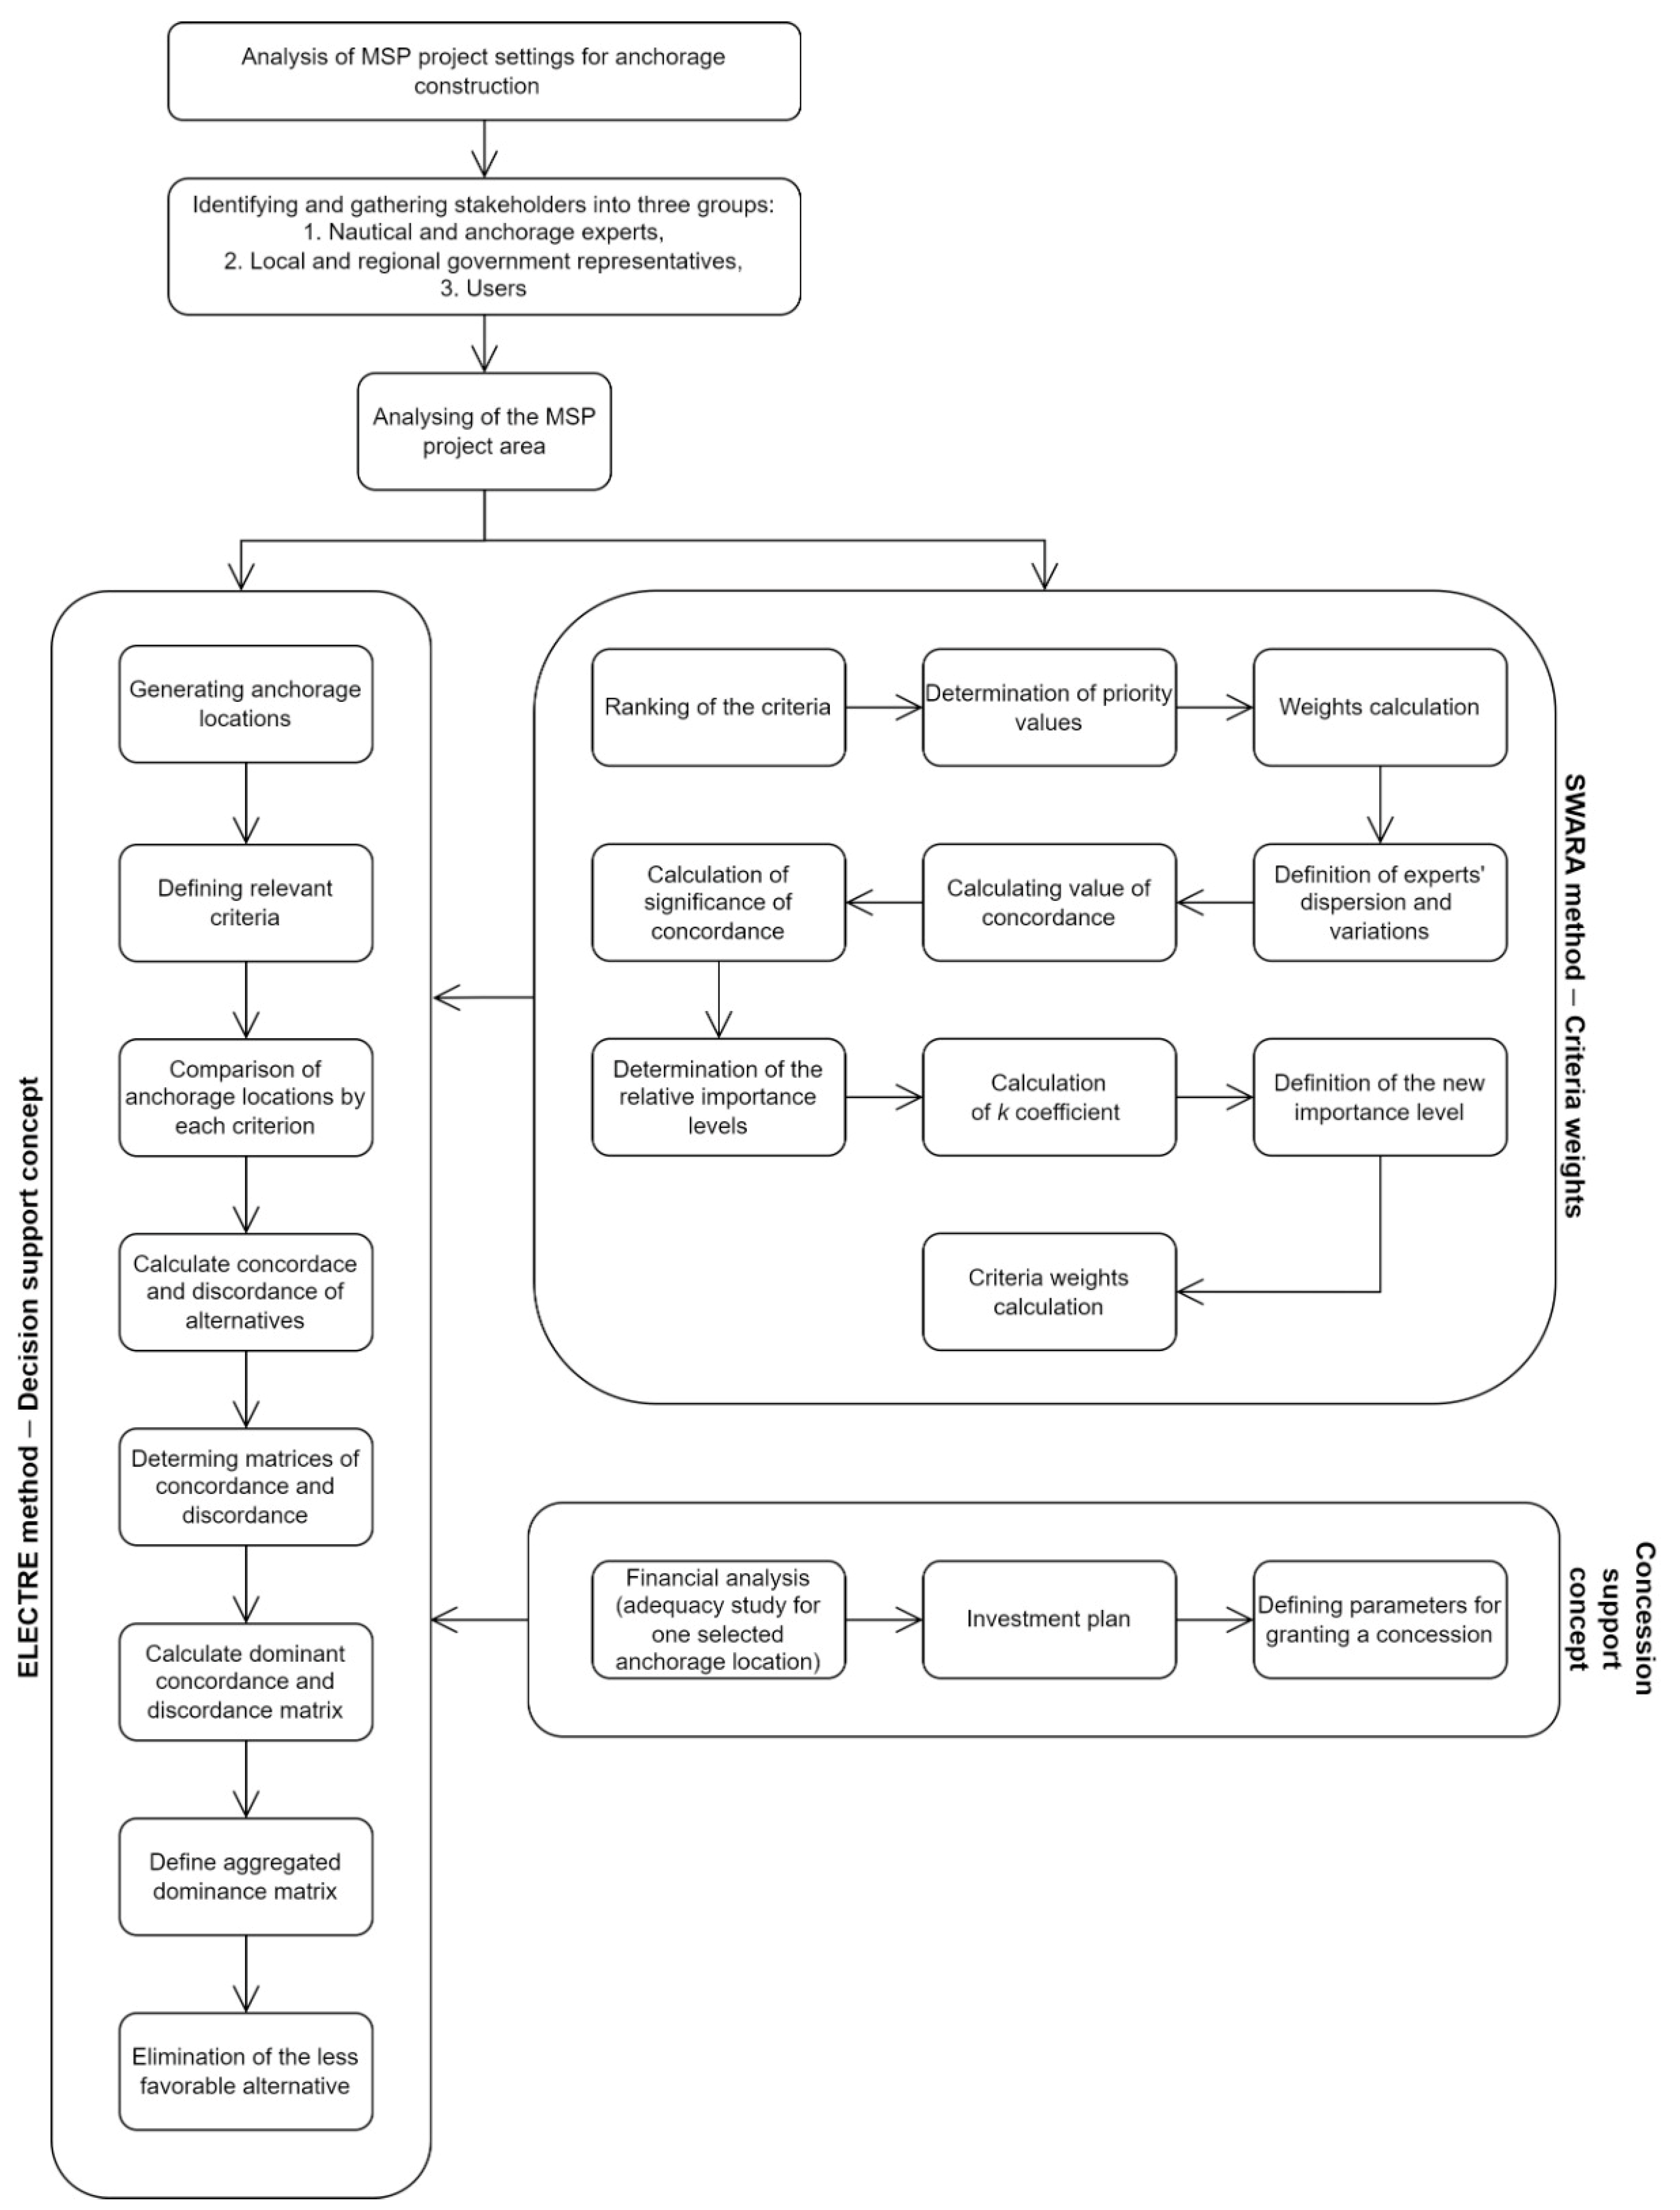
For the purposes of valorisation, this paper proposes a model that ensures the inclusion of all important aspects of maritime domain management for the implementation of anchoring activities as well as the involvement of relevant stakeholders for the implementation of such a procedure. The expressed model is shown graphically in the Figure 1 below. As already mentioned, the model proposed in this paper is a logical continuation of the research work of the authors, which proposed a decision support concept (DSC) in planning the construction of anchorages on the island of Šolta [9]. This paper, along with the modification of the methodology in the method selection, the selected comparison criteria and the methods of stakeholder involvement represents a financial analysis for the purpose of making study of economic adequacy for anchorages concession.
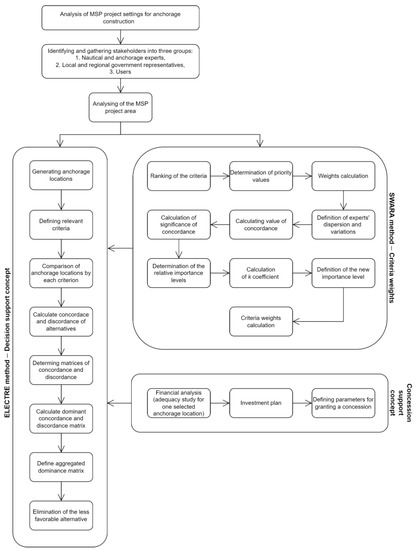
Figure 1.
Anchorage management model for concession planning purposes.
The model begins with an analysis of MSP project settings. It is necessary to analyse the current state of the research area. Analyses are conducted for the area of anchorage construction, for all relevant action plans, strategies, laws, and regulations in Croatia but also in the European Union and for the current state of nautical tourism and relevant impacts related to its growth. In the next step, all relevant stakeholders are identified and divided into groups according to preferences and background knowledge of the problem. Involvement of all relevant stakeholders in the decision-making process is important to increase the transparency of the whole process, while their division into groups is important to optimize communication.
In order to optimize communication between stakeholders, each group chooses its representative. Three groups of stakeholders have been defined:
- Experts in nautical and anchorage (their expert knowledge covers all defined issues related to nautical anchoring as an element of infrastructure. The research questions are related to construction, economic, cultural, and environmental parameters). Five researchers from the University of Split were included;
- Representatives of local and regional government. Four government representatives are involved (three from the Split-Dalmatia County and one from the local self-government unit of the municipality of Brač);
- User representatives. Five representatives are included (two representatives of the representative body in the municipality of Brač—one ruling and one opposition—and three representatives of the concessionaire).
The next step is analysis of MSP project area. The knowledge gathered on the basis of this analysis was used by stakeholders as a basis for choosing the methodology in the research, which includes the choice of calculation methods, the choice of attributes/criteria for comparing anchorage locations, and how to put them in relation to each other.
The first steps in analysing the research area involves defining a set of alternative anchorage locations and defining relevant criteria for their comparison. The area of the island of Brač was selected for the validation of the proposed model. The actions below are divided into three parts according to the methods they use as well as the target solutions they should result in. The first part refers to the priority ranking of anchorage locations, which is performed using the ELECTRE multicriteria analysis method. Since the implementation of this part of the diagram requires the definition of the criteria weights, the second part refers to the application of the SWARA method in order to define their numerical values. The last part of the diagram refers to the financial analysis of the best-ranked anchorage and the definition of parameters for the analysis of all other defined locations.
2.1. Decision Support Concept
The first two steps are the preparation of data necessary for the implementation of multicriteria analysis related to the generation of alternative solutions, i.e., anchorage locations as well as all relevant criteria required for their comparison.
2.1.1. Generating Anchorage Locations
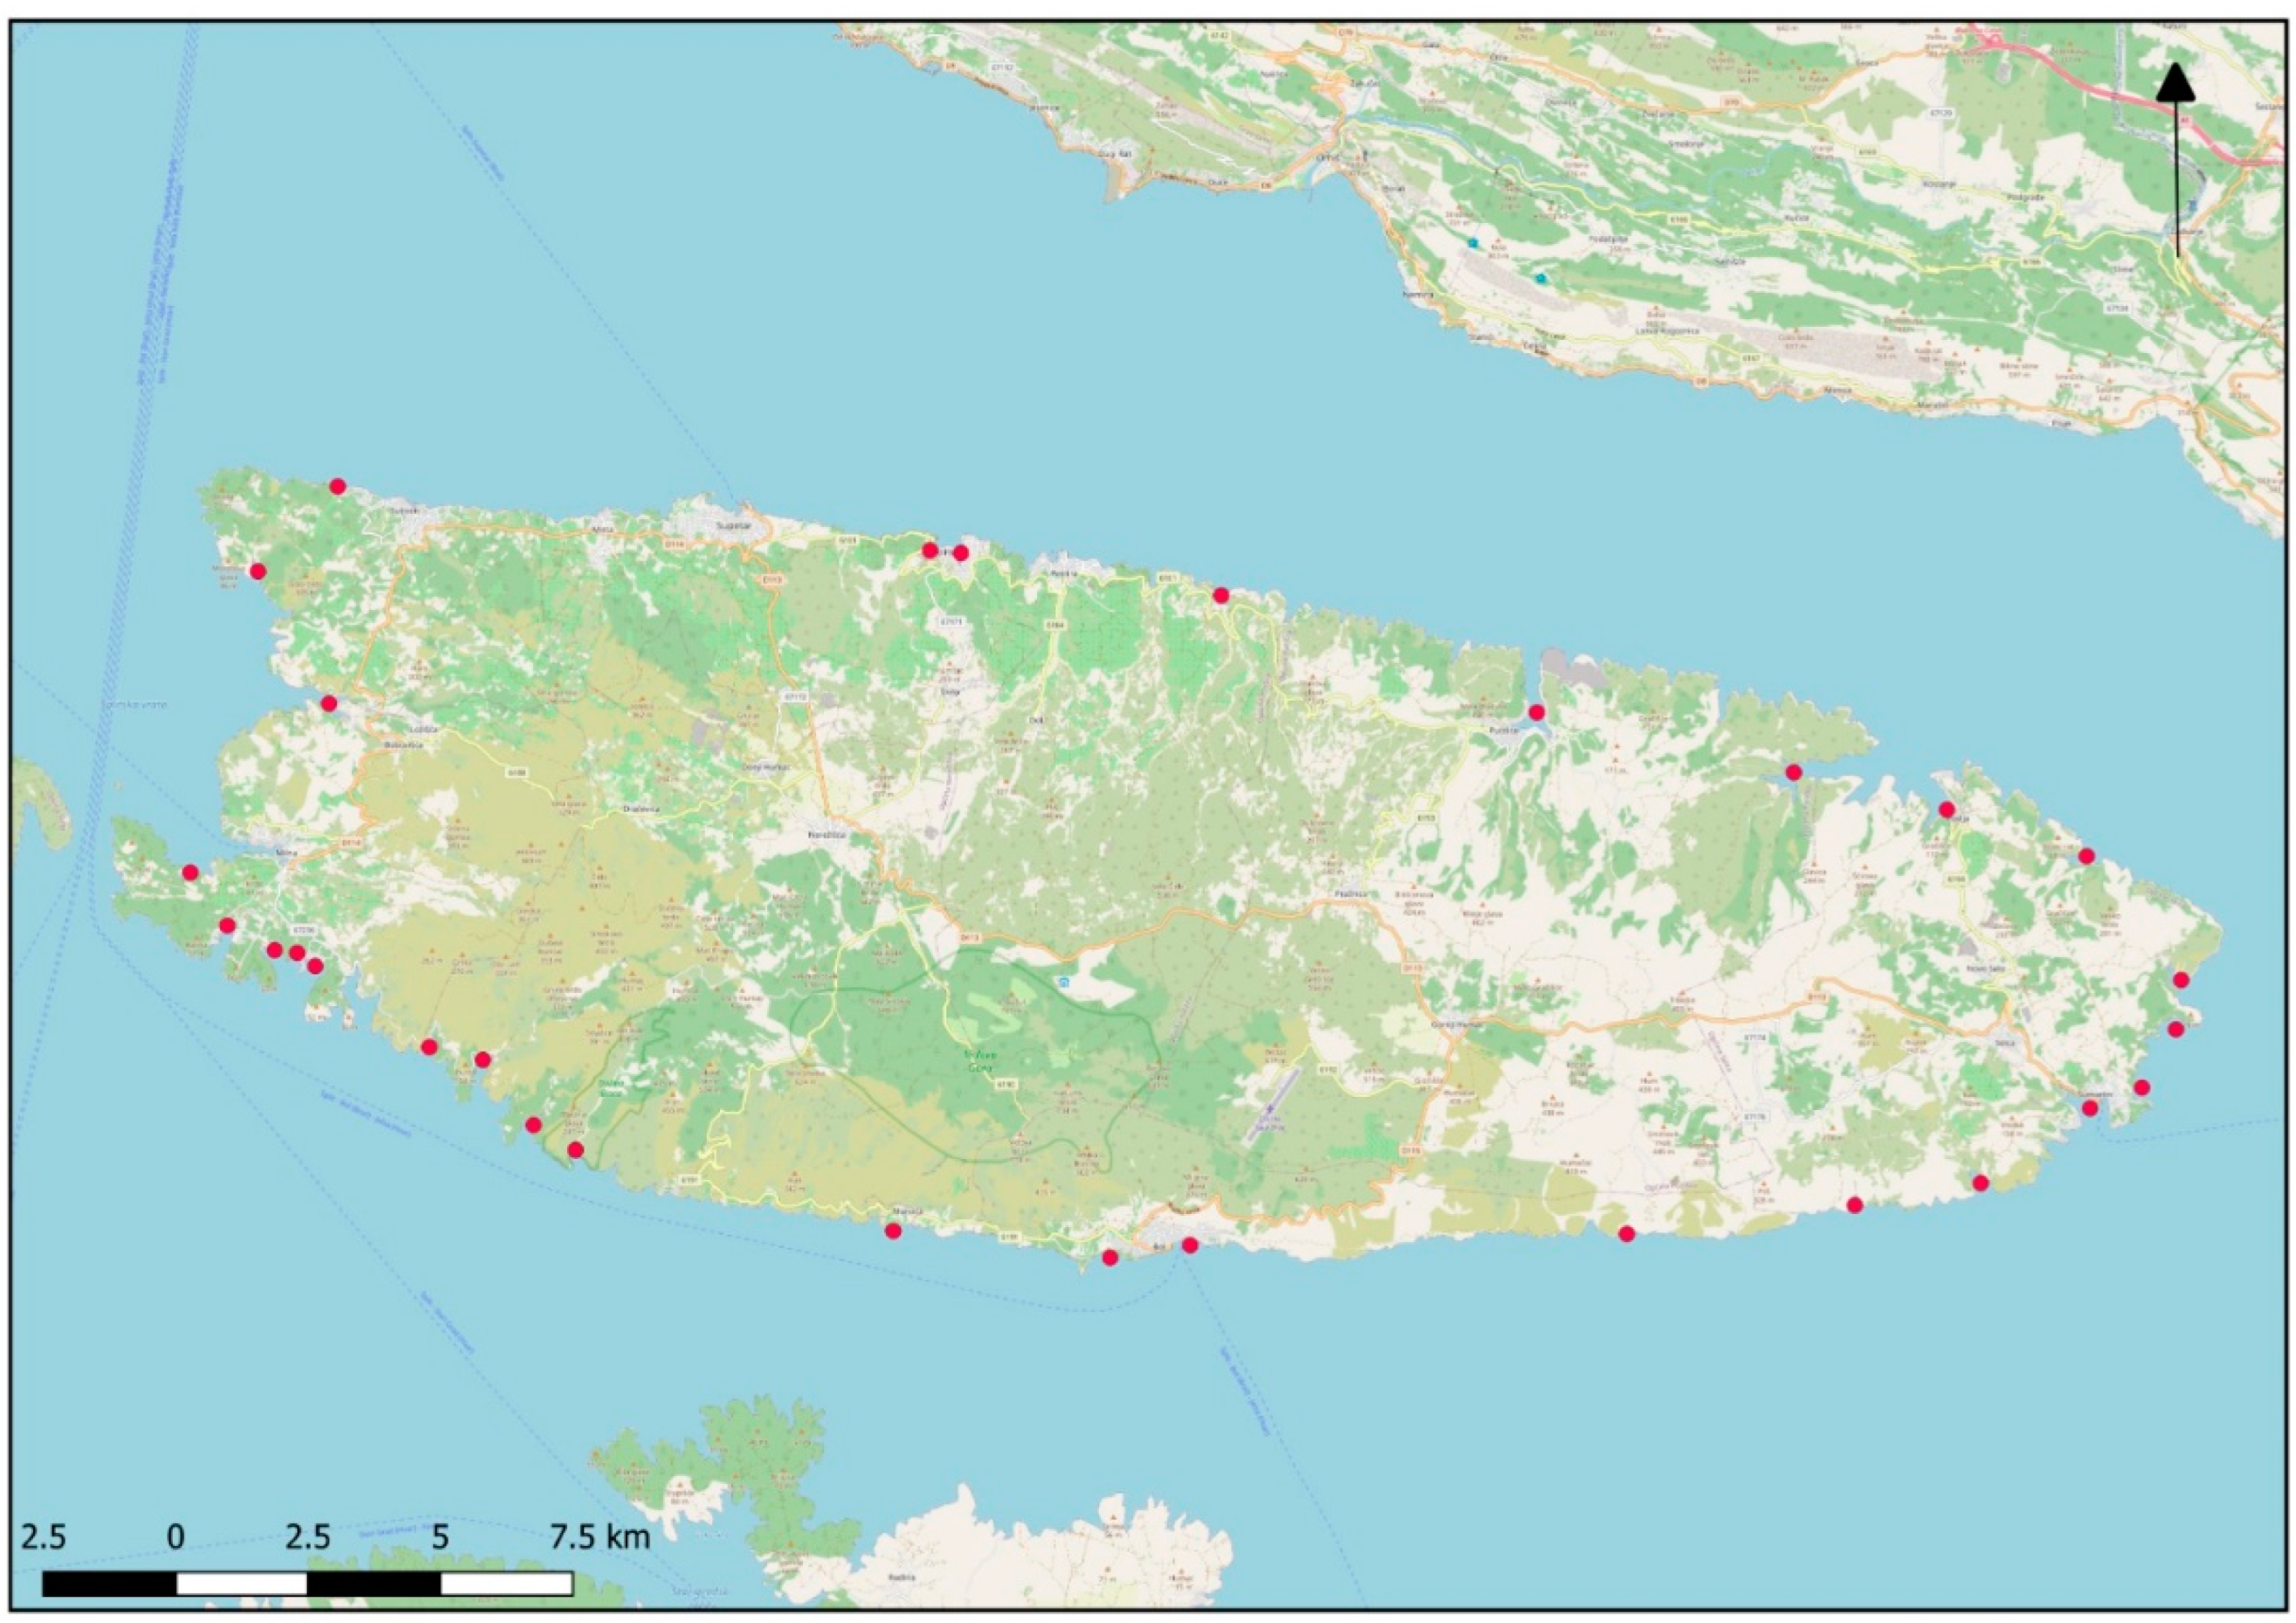
Brac is the largest central Dalmatian island, with an area of 395 km2, and it is the third largest island in the Adriatic Sea. It is about 40-km long and 12-km wide on average. It is separated from the mainland by the Brač Channel. It has the greatest opportunities for development in the tourism industry, which is currently the most important industry on the island. There are a large number of bays with beautiful pebble beaches and interesting coastal places, but nautical tourism is not sufficiently developed mainly due to lack of nautical infrastructure. However, in the future, with further development, the island of Brač should become a nautical destination like Hvar and Vis and thus contribute to the tourism of the island.
For the purposes of this research, all available studies on anchorages were analysed, and in a conversation with experts, potential locations for anchorages on the island of Brač were identified. There are 30 defined bays. The Vela Maslinova bay was not included in the further process because is not suitable as an anchorage due to the fish farm located in the bay. Table 1 gives the list of the analysed anchorage locations on the island of Brač. Figure 2 shows all the locations from Table 1, in red dots, without the location of Vela Maslinova.

Table 1.
Anchorage locations on the island of Brač.

Figure 2.
Anchorage locations on the island of Brač.
2.1.2. Defining Relevant Criteria
All relevant stakeholders were invited and gathered together to discuss the problem and defined relevant criteria that are used for the evaluation of anchorages. A total of fifteen experts participated in the process of criteria definition and anchorages’ evaluation. In Table 2, the criteria are presented with their label and description. This description is used for the evolution of anchorages by each criterion.
Table 2.
Criteria and their description for the evaluation.
After generating anchorage locations and all relevant criteria for their comparison, a decision matrix was formed. The other steps in the first part of the diagram are related to the implementation of the ELECTRE method and are accordingly explained in the next subsection.
2.1.3. ELECTRE Method
Elimination and Choice Expressing Reality (ELECTRE), developed by Benayoun, Roy and Sussman [59], is multicriteria decision-making method based on the outranking concept and is used to compare alternatives by relevant criteria. The concept of ELECTRE is based on the reduction of the number of each alternative evaluated by defined criteria, with a set of alternatives that are not dominant, to find the best alternative [60]. The method is described in the following steps:
- Step 1.
- Forming a decision-making matrix (DMM)
The under-mentioned DMM of preferences () for m alternatives (rows) rated on n criteria (columns):
- Step 2.
- Make a paired comparison for matrix normalization (r) and find the weighted normalized matrix
The ELECTRE method starts with formation of a paired comparison of each alternative by each criterion (). Normalization of the matrix is defined as follows:
where
is a normalized decision matrix, states the number of alternatives, states the number of criteria, and is the measurement of the alternative related to the criterion.
- Step 3.
- Calculate the concordance and discordance.
The concordant set of alternatives is defined as follows:
The discordant set of alternatives is defined as follows:
- Step 4.
- Determining matrices of concordance and discordance.
Concordance matrix is defined by adding the weights included in the concordance set:
Definition of the discordance matrix is obtained by division of the maximum difference in criteria included in the discordance set with the maximum difference in values of criteria as follows:
- Step 5.
- Calculation of dominant concordance and discordance matrix.
The dominant matrix of concordance is defined using threshold value, which is determined by comparisons of each element of the concordance matrix with the threshold value as follows:
where is a threshold value: .
Each element of the dominant concordance matrix F is defined as:
The dominant matrix of discordance is defined using threshold, value which is determined by comparisons of each element of the discordance matrix with the threshold value as follows:
where is a threshold value: .
Each element of the dominant discordance matrix G is defined as:
- Step 6.
- Calculating aggregated dominance matrix.
The aggregated dominance matrix is determing by multipying elemtnets of matrix with elements of matrix , and it is expressed as follows:
- Step 7.
- Elimination of the less favourable alternative.
The matrix presents the selection order of alternatives, meaning that if , then alternative is more preferred. Thus, the rows in matrix that have the least value of can be eliminated.
2.1.4. SWARA Method
SWARA, proposed by Keršulienė, Zavadskas, and Turskis [57], is the multicriteria decision-making method used for determine the weights of criteria and their ranking according to importance. Criteria are ranked by decision makers from most important to least important, and unimportant criteria are removed from decision process. The remaining criteria are then reordered from important to unimportant, where the most important criterion is defined with a value of 1.00. The relative importance of weight is obtained since all criteria are evaluated according to the first criterion [61]. Hashemkhani, Yazdani, and Zavadskas [62] extended SWARA with the testing reliability of decision makers and to improve multicriteria decision-making process quality by integrating the reliability evaluation of decision makers’ opinions. The following are steps for the extended version of the method:
- Step 1.
- Ranking of the criteria.
The criteria are ranked from the most to the least important. The importance of each criterion is determined using experts’ judgment methodology according to Zavadskas et al. [63].
- Step 2.
- Determination of the values of priority .
The values are obtained through discussion with decision makers according to their preferences, and the priority vales for each criterion are calculated as follows:
where is the ranking of criterion by decision maker , and represent the number of decision makers.
- Step 3.
- Weights calculation .
The criteria weights are calculated by following expression:
where represents the number of criteria.
- Step 4.
- Definition of experts’ dispersion and variations
- Step 5.
- Calculating the value of concordancewhere is the total square deviation of rankings for each criterion, and represents the index of iterated ranks. is determined as follows:
- Step 6.
- Calculation of value
The significance of concordance values is calculated as presented below:
If the value of is larger than the tabular vale of for the predefined value, then the hypothesis about the concensus of decision makers’ judgements is accepted.
- Step 7.
- Determination of the levels of relative importance.
The relative importance levels are defined for each criterion starting from the second criterion. The criterion is compared with the previous one, . Then, is denoted as comparative significance of the mean value.
- Step 8.
- Calculation of the coefficient .
Then, each criterion coefficient is defined by following expression:
- Step 9.
- Definition of new importance levels
New importance levels of each criterion are defined as follows:
- Step 10.
- Criteria weights calculation
Criteria weights are calculated as shown:
2.2. Concession Support Concept
For the purposes of this paper, in accordance with the Law on Concessions [3], a study of economic adequacy for anchorages concession should be prepared. Article 11 of the Law provides that the grantor of the concession in preparing the adequacy study of the concession takes into account the public interest, environmental impact, protection of nature and cultural property, financial effects of the concession on the state budget, i.e., the budget of local and regional self-government units and compliance with economic development plans and concession grantor plans”. Based on the data and findings in this study of economic adequacy for granting a concession [1] for the using of special-purpose ports-anchorages, it can be concluded:
- The construction of a special purpose port-anchorage should provide a nautical tourism facility that will serve the development of nautical tourism as well as the overall tourist offer of the island of Brač. Sailors should also be provided with a safe and organized anchorage during the nautical season. Bearing in mind that the anchorage is organized and supervised by the concessionaire, it can be concluded that it will be easier and simpler to take care of the protection of the environment.
- This investment should increase the capacity of berths in the water area of the island of Brač as well as ensure safety for all bathers and participants in maritime traffic.
- For the mentioned project, it must be assessed whether the market is insured. According to the analysis made congruently to the statistical data of nautical tourism in the Republic of Croatia and also due to the increase in the demand of sailors for safe berths, the mentioned should be ensured.
- Having in mind the stated and planned results that the activity envisaged by the concession will achieve, it should be concluded that the approval of the concession is completely economically justified from the point of view of the user and grantor as well as the general interests.
The study of economic adequacy is, along with other documentation, a mandatory attachment to the bid for the concession assignment and forms the basic document for the evaluation and the selection of the most favourable bid. The study proves the economic adequacy, i.e., the cost-effectiveness and profitability of the economic use of the maritime domain, which determines the amount of the permanent and variable part of the concession fee for the economic use of the maritime domain. In addition, it determines the amount of total investment, within which the investment in environmental protection is according to the estimated degree of environmental threat and which represent significant criteria for evaluating and valorising bids. The study of economic adequacy must be prepared in accordance with the rules of the profession in a way that allows objective and correct development and assessment of methodological rules and principles of indicators, which represent a realistic presentation of project development possibilities, structure of technical-technological elements, and accompanying documentation of real results and planned investments.
The most important items for this paper in the financial analysis (study of economic adequacy for concession for one selected alternative/anchorage) are the investment plan, i.e., the structure and value of total investment in construction (installation) and use of special-purpose port-anchorage and the formation and distribution of total income-expenditure. The mentioned items are elaborated in more detail below.
The results of the financial analysis based on the study of economic adequacy for granting a concession will determine whether it is justified to approach the construction of the anchorage (meaning the positive value of the difference between investment and operating costs and anchorage income) at the analysed location and what should be the minimum fixed and variable part of the concession fee. Based on these data, the definition of parameters for concession of other analysed anchorages will be approached in the section Results.
3. Results
The validation of the proposed decision and concession support concept in planning the establishment of MSP for anchorages is shown below. Given the diagram presented in the previous chapter, after generating alternative solutions and criteria for their comparison, it is necessary to define criteria weights and evaluate each individual anchorage location according to defined criteria.
After the definition of relevant criteria, fifteen experts gave a priority order of each criterion as presented in Table 3. Furthermore, these orders are summarized and divided by the number of experts; this way, the average value of each criterion is calculated, and it defined the criteria ranking. Criteria weights are then calculated by dividing average value of each criterion with the number of criteria. Experts’ dispersion and variations are determined. After that, the total square ranking deviation is defined and the concordance coefficient . Since the value W is stochastic, the significance of the concordance coefficient needs to be defined [59]. When , distribution with the freedom degrees needs to be considered by experts [64]. The significance of the coefficient of concordance is calculated, and then, the rank of table concordance is defined when the importance is 1%. Finally, the compatibility of expert’s judgement is provided, and is obtained. In Table 3, the ranking of criteria and concordance coefficient with its significance is presented, and the final weights of defined criteria are given in Table 4.
Table 3.
Process of criteria prioritization for the definition of weights.
Table 4.
Criteria weights.
Evaluations of all criteria were performed by direct assessment or measurement except in the case of criterion C8. The data for the calculation and the final result for criterion C8 (Expected anchor billing revenue) are given in Table 5. The result is obtained by multiplying the individual parameters, i.e., the anchorage capacity (number of berths), the estimated number of working days of the anchorage, the expected average seasonal occupancy per day, and the price of anchoring.
Table 5.
Data for criterion C8—Expected anchor billing revenue.
The decision matrix in Table 6 shows the evaluation of all anchorage locations according to 12 defined criteria. The rows represent the evaluation results of each anchorage according to all criteria, while the columns represent the evaluation results of all anchorages according to one criterion.
Table 6.
Decision matrix for analysed problem of anchorage location of the island of Brač.
The following weighted normalized decision matrix is given. The results in Table 7 were obtained by multiplying the elements of the normalized matrix of each column by the weight of that criterion.
Table 7.
Weighted normalized matrix.
Table 8 shows the concordance matrix. This matrix is a square matrix, m × m, where m is the number of alternatives that compares the alternatives among themselves. Rows and columns refer to anchorage locations, while elements on the diagonal are equal to zero since there is no need to compare an alternative with itself.
Table 8.
Concordance interval matrix.
The concordance-dominant matrix is most often determined on the basis of the value of the so-called thresholds of the concordance matrix, defined as the average concordance index c. Its calculated value is 0.6341. The concordance-dominant matrix is given in Table 9.
Table 9.
Concordance-dominant matrix.
Analogous to the calculation of the concordance interval matrix, a discordance interval matrix is formed and shown in Table 10. As in the concordance matrix, the elements of the diagonal in the discordance matrix are empty.
Table 10.
Discordance interval matrix.
The discordance-dominant matrix, given in Table 11, is formed equally to the concordance-dominant matrix. The value of average discordance index d is 0.6341.
Table 11.
Discordance-dominant matrix.
The elements of the aggregated dominance matrix are equal to the product of the elements in the appropriate position in the concordance- and the discordance-dominant matrices. The matrix is given in the Table 12.
Table 12.
Aggregated dominance matrix.
Final ranking of the anchorage locations is given in the Table 13. Considering the results obtained by the ELECTRE and the SWARA methods, Lučice Cove is the best-ranked location and the most favorable for concession. Lučice Cove is one of the most protected coves on the island of Brač, and due to its protection, natural beauty, proximity to attraction centers, and waterways, it is a favorite anchorage for boaters. It is listed in the nautical charts as an anchorage.
Table 13.
Final ranking of anchorage locations.
In this research, the estimated area of the working area for concession is 36,000 m2, and it is planned to place 40 buoys there for ships. For the purpose of this paper, a ship 15-m long was taken into account.
It is assumed that the area is given in concession for 10 years, and for that period, a further budget will be implemented.
3.1. Investment Plan
For the analysis of the market in this study, it should be pointed out that the Republic of Croatia has extremely valuable resources for nautical tourism. This statement is based on the ecologically preserved and clean Adriatic Sea, the natural beauties that the Republic of Croatia abounds in, and the favorable meteorological conditions. Consequently, it is enough to point out that the Adriatic coast consists of 718 islands, 389 cliffs, and 78 reefs, of which 60 islands are permanently inhabited, with many natural piers, bays, beaches, and marinas (over 7000 dry berths) [1]. The next important fact is that nautical tourism is the most elite part of the tourism business, with the prospect of more dynamic growth and development than other tourist offerings in the coming period. Compared to 2010, the number of nautical tourism ports increased by 31% and the number of berths by 12%.
Hereby, the structure and value of the total investment in construction (installation) and use of the special-purpose port-anchorage Lučice, island of Brač, is given. For the purposes of this research, the presentation of the investment structure was made with the help of existing examples of study of economic adequacy for anchorages concession and in consultation with designers and contractors who have experience in developing such projects. The data for the structure of the planned investment in the anchorage Lučice were collected from Metličić [65]. The presentation of the structure and dynamics of investment was made and given in the Table 14.
Table 14.
The structure of the planned investment in the anchorage of Lučice.
It is planned to build the anchorage at a given location during the nautical season and to make it operational for the next tourist season. Within the total planned investments in the construction of anchorages, EUR 173,200.00 would be invested.
For the purposes of this research, it is assumed that the sources of financing of this investment will be equally distributed between the investor, i.e., his own funds and bank loans. Table 15 describes the structure of the investment.
Table 15.
Sources of investment financing.
The preparation of the study of economic adequacy for anchorages concession assesses the justification of investment in a particular project, in this case, in the construction and equipping of a special-purpose port-anchorage at the location of the cove Lučice. When planning incomes and expenditures, the investor will have in mind the capacity of moored ships and the expected duration of the anchoring season. Total revenues from activities were formed with regard to the number of berths, the number of working days of anchorages, the average seasonal occupancy, and the price of berths. When forming the income from the activity of boat-mooring services in the cove Lučice, the prices of daily anchoring will be used (for the purposes of this research, the ship of 15-m long is taken into account). The total income is EUR 168,000.00 per year. The total revenues of the anchorage Lučica Bay are given in Table 16.
Table 16.
Total revenues of the anchorage Lučica Bay.
In the Table 17, the assumption of annual expenditure amounts is calculated with the help of existing examples of the study of economic adequacy [1] and in consultation with existing concessionaires who have experience in performing anchoring activities. The table shows the existing annual expenditures, and in the structure, it can be seen that the largest share of costs is the salaries of workers and anchor managers at 48.33%, then amortization at 21.09%, and it is important to mention environmental protection, which amounts to approximately 7% of expenditures anchorages per year.
Table 17.
Total costs of the anchorage Lučice without concession fee.
Considering that cove Lučice is the best-ranked location, this assumes the largest share of the concession fee for it. The difference between total income and expenditure is taken as the basis for calculating the fixed part of the concession fee because it was concluded in discussions with stakeholders that this is the best way to assess the minimum bids of future bidders in tenders. Table 18 shows the calculation of the basis for calculating the fixed part of the concession fee.
Table 18.
Calculation of the basis for the calculation of the fixed part of the concession fee.
The previous table shows the basis for calculating the fixed part of the concession fee, so we can deduct the total costs from the total revenues for 10 years (investment costs and expenses for a period of 10 years), and it amounts to EUR 1,162,640.00. A share of 50 percent of the base will be taken to calculate the fixed part of the concession fee. The total fixed part of the concession fee for cove Lučice is EUR 581,320.00, i.e., EUR 58,132.00 per year. From the stated assumptions of the account of income and expenditure for the use of the concession, it is evident that there is an economic justification for granting a maritime with good concession for the purpose of anchorage in the cove Lučice, island of Brač.
3.2. Defining Parameters for Granting a Concession
In comparison with the best-ranked location cove Lučice and with the comparison results using the ELECTRE method, the fixed part expressed in EUR and the variable part expressed as a percentage of annual incomes will be calculated. Table 19 shows the calculation of the basis for calculating the fixed part of the concession fee for all identified locations, as was done for the cove Lučice. It can be noticed that not all locations have a positive difference between total incomes and expenditures for a period of 10 years, i.e., the basis for calculating the fixed part of the concession fee. Locations Krušćica, Hrvatska, Grška, Vošcica, Rasotica, Sv. Rok, Žukovik, Studena, and Zvirje should not be taken into further consideration because they are unprofitable; i.e., they have higher costs than incomes given the budget implemented by this research. They should be considered separately and some changes made in the structure; however, this is not addressed in this paper.
Table 19.
Calculation of the basis for calculating the fixed part of the concession fee for all anchorage locations.
The calculation of the fixed part of the concession fee for each of the locations is presented below, and it is explained how the coefficients were obtained. The share of the fixed part of the concession fee is shown, based on the calculated amounts of these fees, which are expressed in EUR. The results of the comparison using the ELECTRE method, which refer to the ranking of anchorage locations, were used for the calculation. Table 20 gives calculation of the fixed part of the concession fee for all anchorage locations.
Table 20.
Calculation of the fixed part of the concession fee for all anchorage locations.
Anchor locations are ranked according to the amount of T coefficient seen in the third column of the table. The fourth column shows the difference in the T coefficient for each of the locations. The total difference in the T coefficient was calculated as the difference between T coefficients of the best- and worst-ranked anchorage location and is shown in the fifth column as a percentage of the total difference in the T coefficient. For the location of Lučice, the coefficient of the fixed part of the base in the amount of 50% was taken, and it represents the starting value for the calculation of other locations with regard to the difference in their Ts. The coefficients were calculated in the sixth column for all other locations. The last column shows the total fixed amount of the concession fee for a period of 10 years shown in EUR. The location of Lučice has the largest amount of the fixed part of the concession fee and Stipanska the smallest. The total sum of all fixed parts of concession fees for a period of 10 years is EUR 1,767,825.50.
Given the data from the previous table and the assumption that the lowest ranked location will be the minimum percentage of the variable part of the concession fee of 2%, the amount of the variable part of the concession fee will be calculated for each location individually, as shown in Table 21.
Table 21.
Calculation of the variable part of the concession fee for all anchorage locations.
Considering the calculated coefficients of the variable part of the concession fee and the knowledge of the total incomes for anchorages at all locations, the amount of the variable part of the concession fee was calculated individually for each location. In the last column of Table 21, the amounts of the variable part in EUR are shown. Lučice cove has the largest amount of the variable part of the concession fee, while Likva cove has the smallest. The total sum of all variable parts of the concession fee for a period of 10 years is EUR 278,341.40.
4. Conclusions
The paper presents unique concepts for decision support and concession support that provide a systematic approach in the planning and management of maritime assets, i.e., complex construction projects regarding it, such as the construction of anchorages. The decision support concept is based on multicriteria analysis and DSS logic, while the concession support concept provides a unique approach to the financial analysis of the economic adequacy for granting a concession. The result of the research is an anchorage management model for concession planning purposes. The model was validated on a real example, on the island of Brač. The coverage of a wider area, in this case of an island, is an important aspect of such management problems because many of its determinants derive from it, such as the spatial position and size of anchorages in individual locations, wind and wave climate, ship sizes and related anchoring system characteristics, estimated construction and management investment costs, infrastructural coverage, tourist potential, protection of natural and cultural heritage, etc. The model is adaptable character and allows modification for the purpose of application in other areas or other infrastructural elements related to nautical tourism. The modification is related to the inclusion of a group of stakeholders and the choice of parameters to describe the research problem. The paper proposes three groups of stakeholders: experts in the field of research, representatives of local and regional self-government, and users—island residents and concessionaires. The selection of stakeholder groups as well as the manner of their involvement is a process subject to modification, but the emphasis is placed on their greater involvement in order to create a final joint decision. The involvement of scientists and experts in the field of re-search is extremely important, and with their knowledge, they greatly contribute to the correct and detailed analysis of all elements in a specific research problem. Namely, their inclusion already in the planning phase creates better preconditions for accepting the implementation of such significant construction projects. The final choice of criteria is also the result of joint arbitration, but given the different background knowledge of stakeholder groups, each is in charge of proposing criteria related to their own area of research. The involvement of criteria in the goal tree is the final decision of all stakeholder groups. By applying the proposed methodology to the same or similar research problem, it is possible to modify the goal tree as well as the method of their evaluation, but certainly their final set should give the most accurate description of a specific problem. The application of the SWARA method in defining the weights of the criteria and the ELECTRE method in the priority ranking of anchorages ensured transparency and equal involvement of all stakeholders in the planning and modeling processes and final decision making. The result is a priority list of anchorages for concession, and first, the best solution serves as a basis for financial analysis based on the study of economic adequacy for granting a concession resulting in an investment plan.
The final set of alternative solutions on the island of Brač included 29 potential locations where it is possible to build an anchorage and achieve a positive commercial activity while respecting the highest standards of environmental protection and nature and cultural heritage. Based on the obtained priority list of anchorage locations, the costs of their construction were calculated. As an important result, the minimum amounts of fixed and variable parts of concession fees have been determined. Based on the minimum amounts, all individual and total amounts of fixed and variable parts of concession fees have been determined, taking into account all construction investment and management costs for the observed ten-year period. The proposed approach enables the simulation of the concession fees and the selection of a favorable final plan of future revenues. The whole concept is adaptable and allows easy modification of the share of fixed and variable part in the base. This opens up new research questions in the direction of developing a simulation model for the management of complex construction projects related to the maritime construction of anchorages.
Author Contributions
Conceptualization, J.K.P., K.R. and N.J.; methodology, J.K.P., K.R. and N.J.; software, J.K.P., K.R. and N.J.; validation, J.K.P., K.R. and N.J.; formal analysis, J.K.P., K.R. and N.J.; investigation, J.K.P., K.R. and N.J.; resources, J.K.P., K.R. and N.J.; data curation, J.K.P., K.R. and N.J.; writing—original draft preparation, J.K.P., K.R. and N.J.; writing—review and editing, J.K.P., K.R. and N.J.; visualization, J.K.P., K.R. and N.J.; supervision, J.K.P., K.R. and N.J.; project administration, J.K.P., K.R. and N.J.; funding acquisition, J.K.P., K.R. and N.J. All authors have read and agreed to the published version of the manuscript.
Funding
This research received no external funding.
Institutional Review Board Statement
Not applicable.
Informed Consent Statement
Not applicable.
Data Availability Statement
Data available on request due to restrictions e.g., privacy or ethical. The data presented in this study are available on request from the corresponding author. The data are not publicly available due to further research to be published.
Acknowledgments
This research is partially supported through project KK.01.1.1.02.0027, a project co-financed by the Croatian Government and the European Union through the European Regional Development Fund—the Competitiveness and Cohesion Operational Programme.
Conflicts of Interest
The authors declare no conflict of interest.
References
- Development Agency of Zadar County. Study of Economic Adequacy for for Granting a Concession and Estimation of the Value of the Concession for Economic Use of Anchorages; Development Agency of Zadar County: Zadar, Croatia, 2010.
- Gračan, D. Strategic thinking in developing nautical tourism in Croatia. Tour. Hosp. Manag. 2006, 12, 111–117. [Google Scholar] [CrossRef]
- Official Gazette 69/17. Law on Concessions, Republic of Croatia. 2017. Available online: https://www.zakon.hr/z/157/Zakon-o-koncesijama (accessed on 20 September 2021).
- Official Gazette 158/03, 100/04, 141/06, 38/09, 123/11, 56/16, 98/19. Law on Maritime Domain and Seaports, Republic of Croatia. 2019. Available online: https://www.zakon.hr/z/505/Zakon-o-pomorskom-dobru-i-morskim-lukama (accessed on 20 September 2021).
- Kocur-Bera, K.; Dudzinska, M. Information and database range used for maritime spatial planning and for integrated management of the coastal zone—Case study in Poland, Baltic Sea. Acta Adriat. 2014, 55, 179–194. [Google Scholar]
- Meiner, A. Spatial data management priorities for assessment of Europe’s coasts and seas. J. Coast. Conserv. 2013, 17, 271–277. [Google Scholar] [CrossRef]
- Gissi, E.; Suarez de Vivero, J.L. Exploring marine spatial planning education: Challenges in structuring transdisciplinarity. Mar. Policy 2016, 74, 43–57. [Google Scholar] [CrossRef] [Green Version]
- Cvitanovic, C.; Fulton, C.J.; Wilson, S.K.; van Kerkhoff, L.; Cripps, I.L.; Muthiga, N. Utility of primar scientific literature to environmental managers: An international case study on coral-dominated marine protected areas. Ocean Coast. Manag. 2014, 102, 72–78. [Google Scholar] [CrossRef] [Green Version]
- Jajac, N.; Kilić, J.; Rogulj, K. An Integral Approach to Sustainable Decision-Making within Maritime Spatial Planning—A DSC for the Planning of Anchorages on the Island of Šolta, Croatia. Sustainability 2019, 11, 104. [Google Scholar] [CrossRef] [Green Version]
- Official Gazette 23/04, 101/04, 39/06, 63/08, 125/10, 102/11, 83/12, 10/17. Regulation on the Procedure for Granting the Concession Agreement on the Maritime Domain, Republic of Croatia. 2017. Available online: https://narodne-novine.nn.hr/clanci/sluzbeni/2004_02_23_665.html (accessed on 20 September 2021).
- Official Gazette 130/17, 25/19, 98/19, 42/20, 70/21. Act on the Provision of Tourism Services, Republic of Croatia. 2021. Available online: https://www.zakon.hr/z/343/Zakon-o-pru%C5%BEanju-usluga-u-turizmu (accessed on 20 September 2021).
- Luković, T. Theory and Practice of Nautical Tourism Market in Croatia and in the European Medierranean Area; Hydrographic Institute of the Republic of Croatia: Split, Croatia, 2007. [Google Scholar]
- Official Gazette 20/19. Regulation of Classification and Categorization of Nautical Tourism Ports. Republic of Croatia. 2019. Available online: https://narodne-novine.nn.hr/clanci/sluzbeni/2019_12_120_2374.html (accessed on 20 September 2021).
- Kyvelou, S.S.I.; Ierapetritis, D.G. Fisheries Sustainability through Soft Multi-Use Maritime Spatial Planning and Local Development Co-Management: Potentials and Challenges in Greece. Sustainability 2020, 12, 2026. [Google Scholar] [CrossRef] [Green Version]
- de Grunt, L.S.; Ng, K.; Calado, H. Towards sustainable implementation of maritime spatial planning in Europe: A peek into the potential of the Regional Sea Conventions playing a stronger role. Mar. Policy 2019, 95, 102–110. [Google Scholar] [CrossRef]
- Bieda, A.; Adamczyk, T.; Parzych, P. Maritime Spatial Planning in the European Union on the Example of the Polish Part of the Baltic Sea. Water 2019, 11, 555. [Google Scholar] [CrossRef] [Green Version]
- Jean, S.; Gilbert, L.; Medema, W.; Keijser, X.; Mayer, I.; Inam, A.; Adamowski, J. Serious Games as Planning Support Systems: Learning from Playing Maritime Spatial Planning Challenge 2050. Water 2018, 10, 1786. [Google Scholar] [CrossRef] [Green Version]
- Keijser, X.; Ripken, M.; Mayer, I.; Warmelink, H.; Abspoel, L.; Fairgrieve, R.; Paris, C. Stakeholder Engagement in Maritime Spatial Planning: The Efficacy of a Serious Game Approach. Water 2018, 10, 724. [Google Scholar] [CrossRef] [Green Version]
- Ciołek, D.; Matczak, M.; Piwowarczyk, J.; Rakowski, M.; Szefler, K.; Zaucha, J. The perspective of Polish fishermen on maritime spatial planning. Ocean Coast. Manag. 2018, 166, 113–124. [Google Scholar] [CrossRef]
- da Luz Fernandes, M.; Quintela, A.; Alves, F.L. Identifying conservation priority areas to inform maritime spatial planning: A new approach. Sci. Total Environ. 2018, 639, 1088–1098. [Google Scholar] [CrossRef] [PubMed]
- Luz Fernandes, M.; Sousa, L.P.; Quintela, A.; Marques, M.; Reis, J.; Simão, A.P.; Castro, A.T.; Marques, J.M.; Alves, F.L. Mapping the future: Pressures and impacts in the Portuguese maritime spatial planning. Sci. Total Environ. 2020, 715, 136863. [Google Scholar] [CrossRef] [PubMed]
- Abramic, A.; García Mendoza, A.; Haroun, R. Introducing offshore wind energy in the sea space: Canary Islands case study developed under Maritime Spatial Planning principles. Renew. Sustain. Energy Rev. 2021, 145, 111119. [Google Scholar] [CrossRef]
- Pınarbaşı, K.; Galparsoro, I.; Borja, Á. End users’ perspective on decision support tools in marine spatial planning. Mar. Policy 2019, 108, 103658. [Google Scholar] [CrossRef]
- Bonnevie, I.M.; Sten Hansen, H.; Schrøder, L. Assessing use-use interactions at sea: A theoretical framework for spatial decision support tools facilitating co-location in maritime spatial planning. Mar. Policy 2019, 106, 103533. [Google Scholar] [CrossRef]
- Liversage, K.; Kotta, J.; Aps, R.; Fetissov, M.; Nurkse, K.; Orav-Kotta, H.; Rätsep, M.; Forsström, T.; Fowler, A.; Lehtiniemi, M.; et al. Knowledge to decision in dynamic seas: Methods to incorporate non-indigenous species into cumulative impact assessments for maritime spatial planning. Sci. Total Environ. 2019, 658, 1452–1464. [Google Scholar] [CrossRef]
- Hassler, B.; Blažauskas, N.; Gee, K.; Luttmann, A.; Morf, A.; Piwowarczyk, J.; Saunders, F.; Stalmokaitė, I.; Strand, H.; Zaucha, J. New generation EU directives, sustainability, and the role of transnational coordination in Baltic Sea maritime spatial planning. Ocean Coast. Manag. 2019, 169, 254–263. [Google Scholar] [CrossRef]
- Furlan, E.; Slanzi, D.; Torresan, S.; Critto, A.; Marcomini, A. Multi-scenario analysis in the Adriatic Sea: A GIS-based Bayesian network to support maritime spatial planning. Sci. Total Environ. 2020, 703, 134972. [Google Scholar] [CrossRef]
- Papageorgiou, M. Underwater cultural heritage facing maritime spatial planning: Legislative and technical issues. Ocean Coast. Manag. 2018, 165, 195–202. [Google Scholar] [CrossRef]
- Zaucha, J.; Kreiner, A. Engagement of stakeholders in the marine/maritime spatial planning process. Mar. Policy 2021, 132, 103394. [Google Scholar] [CrossRef]
- Elliott, M.; Boyes, S.J.; Barnard, S.; Borja, A. Using best expert judgement to harmonise marine environmental status assessment and maritime spatial planning. Mar. Pollut. Bull. 2018, 133, 367–377. [Google Scholar] [CrossRef] [PubMed]
- Psuty, I.; Kulikowski, T.; Szymanek, L. Integrating small-scale fisheries into Polish maritime spatial planning. Mar. Policy 2020, 120, 104116. [Google Scholar] [CrossRef]
- Abramic, A.; Bigagli, E.; Barale, V.; Assouline, M.; Lorenzo-Alonso, A.; Norton, C. Maritime spatial planning supported by infrastructure for spatial information in Europe (INSPIRE). Ocean Coast. Manag. 2018, 152, 23–36. [Google Scholar] [CrossRef] [Green Version]
- Weig, B.; Schultz-Zehden, A. Spatial Economic Benefit Analysis: Facing integration challenges in maritime spatial planning. Ocean Coast. Manag. 2019, 173, 65–76. [Google Scholar] [CrossRef]
- Quero García, P.; García Sanabria, J.; Chica Ruiz, J.A. The role of maritime spatial planning on the advance of blue energy in the European Union. Mar. Policy 2019, 99, 123–131. [Google Scholar] [CrossRef]
- Zaucha, J. Methodology of maritime spatial planning in Poland. J. Environ. Prot. Ecol. 2018, 19, 713–720. [Google Scholar]
- Cartwright, J.; Caldwell, C.; Nebiker, S.; Knight, R. Putting Flow–Ecology Relationships into Practice: A Decision-Support System to Assess Fish Community Response to Water-Management Scenarios. Water 2017, 9, 196. [Google Scholar] [CrossRef]
- Sutrisno, D.; Gill, S.N.; Suseno, S. The development of spatial decision support system tool for marine spatial planning. Int. J. Digit. Earth 2017, 11, 863–879. [Google Scholar] [CrossRef]
- Wu, K.K.; Zhang, L.P. Application of environmental risk assessment for strategic decision-making in coastal areas: Case studies in China. J. Environ. Plan. Manag. 2016, 59, 826–842. [Google Scholar] [CrossRef]
- Lonsdale, J.A.; Weston, K.; Barnard, S.; Boyes, S.J.; Elliott, M. Integrating management tools and concepts to develop an estuarine planning support system: A case study of the Humber Estuary, Eastern England. Mar. Pollut. Bull. 2015, 100, 393–405. [Google Scholar] [CrossRef]
- Davies, A.J.; Hope, M.J. Bayesian inference-based environmental decision support systems for oil spill response strategy selection. Mar. Pollut. Bull. 2015, 96, 87–102. [Google Scholar] [CrossRef] [PubMed]
- Mercantini, J.M. Building a Domain Ontology to Design a Decision Support Software to Plan Fight Actions Against Marine Pollutions. Risk Cogn. 2015, 80, 197–227. [Google Scholar] [CrossRef]
- Huang, W.; Corbett, J.J.; Jin, D. Regional economic and environmental analysis as a decision support for marine spatial planning in Xiamen. Mar. Policy 2015, 51, 555–562. [Google Scholar] [CrossRef]
- Valentini, E.; Filipponi, F.; Nguyen Xuan, A.; Passarelli, F.M.; Taramelli, A. Earth Observation for Maritime Spatial Planning: Measuring, Observing and Modeling Marine Environment to Assess Potential Aquaculture Sites. Sustainability 2016, 8, 519. [Google Scholar] [CrossRef] [Green Version]
- John, A.; Yang, Z.; Riahi, R.; Wang, J. A Decision Support System for the Assessment of Seaports’ Security Under Fuzzy Environment. Maritime Transportation. Intell. Syst. Ref. Libr. 2017, 131, 145–177. [Google Scholar] [CrossRef]
- Pietrzykowski, Z.; Wołejsza, P.; Borkowski, P. Decision Support in Collision Situations at Sea. J. Navig. 2017, 70, 447–464. [Google Scholar] [CrossRef]
- Lazarowska, A. A new deterministic approach in a decision support system for ship’s trajectory planning. Expert Syst. Appl. 2017, 71, 469–478. [Google Scholar] [CrossRef]
- Sinesi, S.; Altieri, M.G.; Marinelli, M.; Dell’Orco, M. A multivariate logic decision support system for optimization of the maritime routes. In Proceedings of the 5th IEEE International Conference on Models and Technologies for Intelligent Transportation Systems (MT-ITS), Naples, Italy, 26–28 June 2017. [Google Scholar] [CrossRef]
- Kapetanis, G.N.; Psaraftis, H.N.; Spyrou, D. A simple synchro—Modal decision support tool for the Piraeus container terminal. Transp. Res. Arena 2016, 14, 2860–2869. [Google Scholar] [CrossRef] [Green Version]
- Pratap, S.; Nayak, A.; Kumar, A.; Cheikhrouhou, N.; Tiwari, M.K. An Integrated Decision Support System for Berth and Ship Unloader Allocation in Bulk Material Handling port. Comput. Ind. Eng. 2016, 106, 386–399. [Google Scholar] [CrossRef]
- Pratap, S.; Nayak, A.; Cheikhrouhou, N.; Tiwari, M.K. Decision Support System for Discrete Robust Berth Allocation. IFAC-Pap. Online 2015, 48, 875–880. [Google Scholar] [CrossRef]
- Stojakovic, M.; Twrdy, E. A decision support tool for container terminal optimization within the berth subsystem. Transport 2015, 31, 29–40. [Google Scholar] [CrossRef] [Green Version]
- Ursavas, E. Priority control of berth allocation problem in container terminals. Ann. Oper. Res. 2015, 31, 29–40. [Google Scholar] [CrossRef] [Green Version]
- Wang, F.; Lim, A. A stochastic beam search for the berth allocation problem. Decis. Support Syst. 2007, 42, 2186–2196. [Google Scholar] [CrossRef]
- Oz, D.; Aksakalli, V.; Alkaya, A.F.; Aydogdu, V. An anchorage planning strategy with safety and utilization considerations. Comput. Oper. Res. 2015, 62, 12–22. [Google Scholar] [CrossRef]
- Stelzenmüller, V.; Gimpel, A.; Gopnik, M.; Gee, K. Aquaculture Site-Selection and Marine Spatial Planning: The Roles of GIS-Based Tools and Models. In Aquaculture Perspective of Multi-Use Sites in the Open Ocean; Springer: Cham, Switzerland, 2017; pp. 131–148. [Google Scholar] [CrossRef] [Green Version]
- Yuan, L.; Changqing, L.; Yuebin, W.; Xiaoping, G.; Tao, X.; Reti, H.; Xiaohui, W.; Xiaowei, Z. Multi-criteria evaluation method for site selection of industrial wastewater discharge in coastal regions. J. Clean. Prod. 2017, 161, 1143–1152. [Google Scholar] [CrossRef]
- Keršulienė, V.; Zavadskas, E.K.; Turskis, Z. Selection of rational dispute resolution method by applying new step-wise weight assessment ratio analysis (SWARA). J. Bus. Econ. Manag. 2010, 11, 243–258. [Google Scholar] [CrossRef]
- Keršuliene, V.; Turskis, Z. Integrated fuzzy multiple criteria decision making model for architect selection. Technol. Econ. Dev. Econ. 2011, 17, 645–666. [Google Scholar] [CrossRef]
- Benayoun, R.; Roy, B.; Sussman, B. ELECTRE: Une méthode pour guider le choix en présence de points de vue multiples. Note Trav. 1966, 49. [Google Scholar]
- Ayyildiz, E.; Yildiz, A.; Taskin Gumus, A.; Ozkan, C. An Integrated Methodology Using Extended Swara and Dea for the Performance Analysis of Wastewater Treatment Plants: Turkey Case. Environ. Manag. 2020, 67, 449–467. [Google Scholar] [CrossRef]
- Mesran, G.; Ginting, S.; Rahim, R. Implementation of Elimination and Choice Expressing Reality (ELECTRE) Method in Selecting the Best Lecturer (Case Study STMIK BUDI DARMA). Int. J. Eng. Res. Technol. 2017, 6, 141–144. [Google Scholar]
- Hashemkhani Zolfani, S.; Yazdani, M.; Zavadskas, K.E. An extended stepwise weight assessment ratio analysis (SWARA) method for improving criteria prioritization process. Soft Comput. 2018, 22, 7399–7405. [Google Scholar] [CrossRef]
- Zavadskas, E.K.; Ustinovichius, L.; Turskis, Z.; Shevchenko, G. Application of verbal methods to multi-attribute comparative analysis of investments risk alternatives in construction. Comput. Model. New Technol. 2007, 12, 30–37. [Google Scholar]
- Kendall, M.G. Rank Correlation Methods, 4th ed.; Griffin: London, UK, 1970. [Google Scholar]
- Metličić, I. Design Concept for Decision Support in the Planning of the Project Construction and Managing Anchorages on the Island Trough Concession—The Case Study of Brač Island. Master’s Thesis, Faculty of Civil Engineering, Architecture and Godesy, University of Split, Split, Croatia, 2017. [Google Scholar]
Publisher’s Note: MDPI stays neutral with regard to jurisdictional claims in published maps and institutional affiliations. |
© 2021 by the authors. Licensee MDPI, Basel, Switzerland. This article is an open access article distributed under the terms and conditions of the Creative Commons Attribution (CC BY) license (https://creativecommons.org/licenses/by/4.0/).