Article

The Spatial Variation of Acoustic Water Column Data and Its Relationship with Reef-Associated Fish Recorded by Baited Remote Underwater Stereo-Videos off the Western Australia Coast

by
Marcela Montserrat Landero Figueroa
1,*,
Miles J. G. Parsons
2,
Benjamin J. Saunders
3 and
Iain M. Parnum
1
1
Centre for Marine Science and Technology (CMST), Curtin University, Perth 6102, Australia
2
Australian Institute of Marine Science, Nedlands 6009, Australia
3
School of Molecular and Life Science, Curtin University, Perth 6102, Australia
*
Author to whom correspondence should be addressed.
J. Mar. Sci. Eng. 2022, 10(1), 52; https://doi.org/10.3390/jmse10010052
Submission received: 4 November 2021 / Revised: 17 December 2021 / Accepted: 28 December 2021 / Published: 4 January 2022

Abstract

:
Spatially explicit information on coral fish species abundance and distribution is required for effective management. Nonextractive techniques, including echosounders and video census, can be particularly useful in marine reserves where the use of extractive methods is restricted. This study aimed to investigate the possibility of combining echosounders and baited remote underwater stereo-videos (stereo-BRUVs) in providing more holistic information on the distribution of demersal and semidemersal reef-associated fish. The spatial distribution of fish biomass was assessed using both methods in two small areas, one in Cockburn Sound (CS), a temperate body of water, and the other in the tropical waters of the Ningaloo Marine Park (NMP). The results showed high correlations between the acoustic and stereo-BRUV data in CS, suggesting the potential use of both for a better estimation of biomass in the area. The results for the NMP showed weaker correlations between the two datasets and highlighted the high variability of the system. Further studies are required, but our initial findings suggest a potential benefit of combining both techniques in the reef-associated fish distribution assessment.

1. Introduction

Coral reefs are the most biodiverse ecosystems in the ocean, providers of a variety of environmental services, and home to a diverse number of species of fish [1,2,3]. Coral reef fishes are a critical source of protein for the world’s tropical coast and support important commercial and artisanal fisheries [3]. However, coral reefs and their codependent species are increasingly threatened by anthropogenic impacts at both a local (e.g., overfishing) and global scale (e.g., global warming) [4]. Traditional management strategies for coral-reef fisheries, including catch quotas, size restrictions, or seasonal closures, have had variable levels of success. This has resulted in the implementation of marine protected areas (MPAs) as the leading tool for coral reef fish diversity conservation [5]. It is expected that MPAs would reduce the pressure from direct anthropogenic impacts, in the hope that this will allow the community within the MPA to better adapt to global warming-related stressors and natural disturbances [6]. However, sustainable management of coral reef fishes requires spatially explicit information on their abundance and distribution at scales relevant for MPA monitoring [7]. Nonextractive methods are required to collect reef fish data on MPAs. Some of the methods commonly used are scuba diving census, video-based techniques, and more recently active acoustics. However, each of these methods presents limitations and bias [8,9,10]. Two fishery-independent and nonextractive methods are the focus of this study: baited remote underwater stereo-videos (stereo-BRUVs) [9] and active acoustics, specifically, singlebeam echosounders (SBES) [10].
Cameras have been used in the study of fishes since the 1900s [11]. Technological advances in the last two decades have allowed scientists to use high-resolution video cameras that can be deployed to a wider depth range compared with visual census [12]. The addition of bait in front of the cameras encourages fish to approach, allowing species identification and length measurements with high levels of accuracy [13]. Stereo-BRUVs have been used successfully to estimate the effect of MPAs on species richness and relative abundance of demersal fish inside and outside the protected areas [9]. The main disadvantage of the stereo-BRUVs is the complexity of converting the biomass estimated into density, which requires the area of influence of the bait plume to be estimated. This area of influence is highly variable and can be dependent on the bottom current speed, soak time, and swimming speed of the organisms [13,14]. Therefore, the biomass estimated with stereo-BRUVs should be reported as relative biomass.
Active acoustic systems, such as echosounders, are another nonextractive technique that has become the standard method to monitor populations of some of the most commercially important fisheries of the world [15,16]. The use of active acoustics has shown particular benefit for assessing large single-species schools of fish, and has the advantage of being able to sample large areas in a relatively short time [17]. Echosounders have the potential to be used in an ecosystem-based management approach, as different components of the water column can be sampled at the same time (e.g., zooplankton, fish; [18,19]). During an acoustic survey, an echosounder is used to transmit acoustic energy into the water and record the echoes produced by targets present in the water. The amount of energy reflected (“backscatter”) by the water column can be used as an approximation of the biomass present in the water column [17]. The main disadvantage of acoustic techniques is the need of ground-truth information to convert the acoustic energy into species-specific biomass. In temperate regions, direct sampling is the usual validation method. Low diversity of species present assists in simplifying the conversion from backscatter to species-specific biomass. This process becomes increasingly complex with increasing species richness and school heterogeneity. As a result, confidence in the biomass estimates may be reduced. However, the use of underwater acoustics in coral reef environments is increasing, with visual techniques providing the complementary source of validation data [20,21,22].
This study aimed to investigate the possibility of combining stereo-BRUVs and echosounder data in providing more holistic information of the distribution of demersal and semidemersal fish with a general hypothesis: The spatial distribution of biomass captured by stereo-BRUVs is highly correlated with the spatial distribution of the acoustic biomass estimated based on the echosounder. Specifically, three objectives were addressed: (i) evaluate the spatial distribution of demersal and semidemersal fish using SBES in an area within Cockburn Sound (CS) and in an area of the Ningaloo Marine Park (NMP, Figure 1), (ii) evaluate the spatial distribution of demersal and semidemersal fish using stereo-BRUVs in the CS area and in an area of the NMP, and (iii) compare the spatial distribution of demersal and semidemersal fish estimated by the two methods in both areas.
A successful combination of the two methods could improve our ability to monitor the fish distribution and abundance at the MPA scale, which is necessary for conservation and management.

2. Materials and Methods

2.1. Study Area

2.1.1. Cockburn Sound

The first experiment was conducted in CS, an embayment off the southwest coast of Perth, Western Australia (Figure 1a,b,d). CS is a large low-gradient basin with a maximum depth of 22 m. CS comprises a range of marine habitats, including seagrass meadows, unvegetated sediments, and isolated parches of hard rock and coral, which support considerable abundance of commercially important fish and invertebrate species and nontarget species [23]. The small area (1.9 × 0.75 km) selected for this study is located in the northern section of the embayment with depths between of 8 and 17 m. The benthic habitats present in this area are primarily unvegetated fine sediments and small patches of pavement reef and vegetated areas, including Posidonia, Halophila, and mixed seagrass and reef [24]. CS provides an accessible site with known habitats and a fish assemblage that has been previously studied, from which hypotheses could be tested.

2.1.2. Ningaloo Marine Park

The second area of study is located in the NMP, in a tropical area of Western Australia. The NMP (Figure 1a,c,e) is recognized as a highly diverse ecosystem and is considered an emblematic area of Western Australia [25]. The Ningaloo Reef complex includes a narrow reef crest that creates a discontinuous barrier dividing the reef lagoon from the outer reef slopes. Our study site is located in the outside part, in a general use zone of the NMP in an area of 0.75 × 2 km and at depths between 60 and 90 m. The NMP presents patchiness in the benthic habitat distribution with large areas of bare sand/silt substrate [26]. Areas between 50 and 70 m have a prevalence of soft coral and sponges with some macroalgal species and an increased number of filters feeding invertebrates, including sponges and large gorgonian fans and other soft corals beyond 80 m [26]. As part of a previous study in the NMP, an acoustic survey was conducted using a singlebeam echosounder, which was used to produce a seafloor classification. The tail of the first echo (E1) returning from the seafloor can be used to estimate the acoustic “roughness”, while the second echo (E2) is related to the acoustic “hardness” [27]. Two classes were detected using the E1 metric (smooth and rough) [28]. These classes, as they occurred within the NMP area, were used to select the sites for the deployment of the stereo-BRUVs (Figure 1e).

2.2. Data Acquisition

2.2.1. Singlebeam Echosounder

For the two areas, both the acoustic and stereo-BRUVs surveys were conducted between 9:00 a.m. and 4:00 p.m. to avoid differential behavior of fish between daytime and nighttime and the diel migration at dusk time [29].
Three BioSonics singlebeam transducers (38, 120, and 420 kHz) were mounted on a small pontoon, which was towed alongside a vessel (Figures S1a,b and S2). The 120 kHz transducer was at the front of the pontoon, followed by the 38 kHz transducer (0.33 cm of separation) with the GPS antenna attached and the 420 kHz transducer at the end (0.26 cm of separation). The settings of the echosounder are shown in Table 1. Calibration was conducted posteriori in CS; each transducer was calibrated following the recommendations of Foote [30].

2.2.2. Baited Remote Underwater Stereo-Video Cameras

The stereo-BRUV systems consist of two paired Sony HC15 digital camcorders within waterproof housings mounted in a metallic frame that holds them at an inward convergence of 8°, so both cameras have a common area of view (Figure S1c). In the center of the frame, an arm suspends a bait bag between cameras. Each video camera is equipped with an SD card with enough memory to record for at least 2 h. The stereo-BRUV technique used in this study was conducted following the same process reported by Harvey et al. [31].

2.2.3. Data Collection in Cockburn Sound

Two small vessels were used during the survey, one collecting acoustic data at an average speed of 4 knots and another vessel deploying and retrieving the stereo-BRUVs. The acoustic survey was conducted following transects perpendicular to the coast, with successive transects separated by approximately 50 m (Figure 1d). Ten stereo-BRUVs were deployed in two main benthic habitats, five in sand and five in “reefs” areas, which included pavement reef, cobble reef, and mixed seagrass and reef (Figure 1d). A minimum separation of 250 m between each stereo-BRUV deployment was used to minimize the possibility of mixing bait plumes and reduce the likelihood of fish moving between sites within the sampling period [32]. The acoustic survey was conducted either before the stereo-BRUVs were deployed or at least 1 h after their removal. The benthic habitat classification was used to compare the acoustic variables and stereo-BRUV biomass and relative abundance between benthic classes.

2.2.4. Data Collection in Ningaloo Marine Park

A 7.9 m vessel was used to conduct the acoustic survey and the deployment of 14 stereo-BRUVs (Figure 1e). The acoustic survey and deployment/recovery of the stereo-BRUVs were not logistically possible in 1 day as a second vessel would be required. Therefore, the acoustic survey was carried out on 5 October 2016, while the deployment and recovery of the stereo-BRUVs were conducted the next day within the same moon and tidal phase. During the acoustic survey, the BioSonics echosounder was towed on the side of the vessel in the same arrangement used in CS. Transects 2 km long and 50 m apart from each other were followed to cover an area of 800 m width and 2 km length at an average speed of 7 knots.
The selection of the stereo-BRUV deployment locations was based on differences in the seafloor backscatter (E1) such that at least two areas with different levels of seafloor backscatter were included (Figure 1e). A minimum distance of 250 m between stereo-BRUVs was applied. After the analysis of the stereo-BRUVs, the acoustic classification of the seafloor was compared with the benthic habitats (“reef” and “sand”) observed in the videos for verification. Both classifications of the seafloor (acoustic and visual) were used to compare the acoustic variables and stereo-BRUV biomass and relative abundance between benthic classes.

2.3. Data Analysis

2.3.1. Postprocessing of the Singlebeam Echosounder Data

The software Echoview (ver. 8.0; Echoview Software Pty. Ltd.) was used for the postprocessing of the acoustic data. The offsets between the physical location of the GPS antenna and the 120 and 430 kHz transducers were added to the Echoview transducer configuration to correct the spatial information of the acoustic data. In Echoview, two types of echograms are created for each frequency register by the echosounder: the TS echogram, in which each data point represents a target strength measured in decibels referenced to 1 m2, and the Sv echogram, in which each point represents the volume backscattering coefficient in decibels referred to 1 m2/m3. Acoustic analysis was carried out using the 38 kHz frequency, and the 120 kHz data were used only for classification purposes.
A bottom detection algorithm was applied to detect the bottom line (best candidate) in the 38 kHz Sv echogram. Two meters from the surface was excluded from the analysis to avoid the transducer near field, where the acoustic data were unreliable. Additionally, an area of 0.5 m above the seafloor was excluded to avoid integrating parts of the seafloor or reef as targets. A visual inspection of the echograms was conducted to correct for incorrect detections of the bottom and to mark areas of noise as bad data, which were excluded from the analysis.
Different types of unwanted signal “noise” can be found in acoustic data. Background noise is a combination of attenuation of the signal caused by transmission loss and other noise sources, including vessel noise [33]. Impulse noise is generally caused by interference with other unsynchronized acoustic instruments operating simultaneously [34]. Two noise filters were applied in both the 38 and 120 kHz Sv echograms to reduce the effect of unwanted signals in the data: an impulse noise removal filter [34] and a background noise filter [33]. The “dB difference” method [35] was used to separate backscatter from fish with a swim bladder from that of zooplankton and fluidlike organisms within the 38 and 120 kHz echograms. Therefore, the two frequencies were synchronized.

Nautical Area Scattering Coefficient

For a pixel to be classified as fish, the sum of 120 and 38 kHz Sv echograms has to be higher than −122 dB, and the difference between 120 and 38 kHz Sv has to be less than 3 dB. A threshold of −60 dB was applied to remove no-fish targets [36]. Then a filter was applied using a 3 × 3 convolution matrix (1,2,1;2,1,2;1,2,1). The resulting echogram was gridded, and the integrated “depth-stratified NASC” (m2/nmi2) exported in cells 50 m long and 5 m deep. A second estimation of the depth-stratified NASC was also exported, in which the schools of fish were excluded. The SHAPES algorithm [37] implemented in Echoview was used to detect the schools with detection parameters set to a minimum total school length of 2 m, a minimum school height of 1 m, a minimum candidate length of 2 m, a minimum candidate height of 1 m, a vertical linking distance of 1 m, a maximum horizontal gap distance of 1 m, and a minimum volume backscattering coefficient (Sv) of −60 dB [22]. The schools’ areas were used to create a mask, which was applied to the clean Sv echogram. The “depth-stratified NASC no schools” were then exported using the same vertical and horizontal grid of 5 × 50 m. The results for both the depth-stratified NASC and the depth-stratified NASC no schools were exported into R [38] for further analysis.

2.3.2. Postprocessing of the Stereo-BRUV Data

The two video recordings (left and right cameras from each deployment) were synchronized and analyzed using the “EventMeasure Stereo” [39] software. An hour of the recording time was analyzed, starting from the moment the stereo-BRUV reached the seafloor. The reviewing process involved identifying the fish present in the videos and selecting the frame with a higher abundance of each particular species to count and measure the individuals. The selection of only one frame prevents recounting. This approach is known as “MaxN” and is considered a conservative measure of abundance [31].
The fork length of the fish counted in the MaxN frame visible in both cameras was measured. For the majority of the sampling points, the lengths of all the fish considered in MaxN were measured. However, in some instances, the measurement of all fish was not possible (e.g., overlapping in the view of the cameras). In those cases, the mean length of the measured fish was used to estimate the length of the unmeasured ones. The length–weight relationship per species was used to convert the length measurements to biomass using FishBase data [40]. When a species length–weight relationship was not available, the parameters of a species within the same genus were used. The weight of an individual fish was summed to estimate the “relative biomass” for each sampling point.

2.3.3. Singlebeam Echosounder vs. Stereo-BRUVs

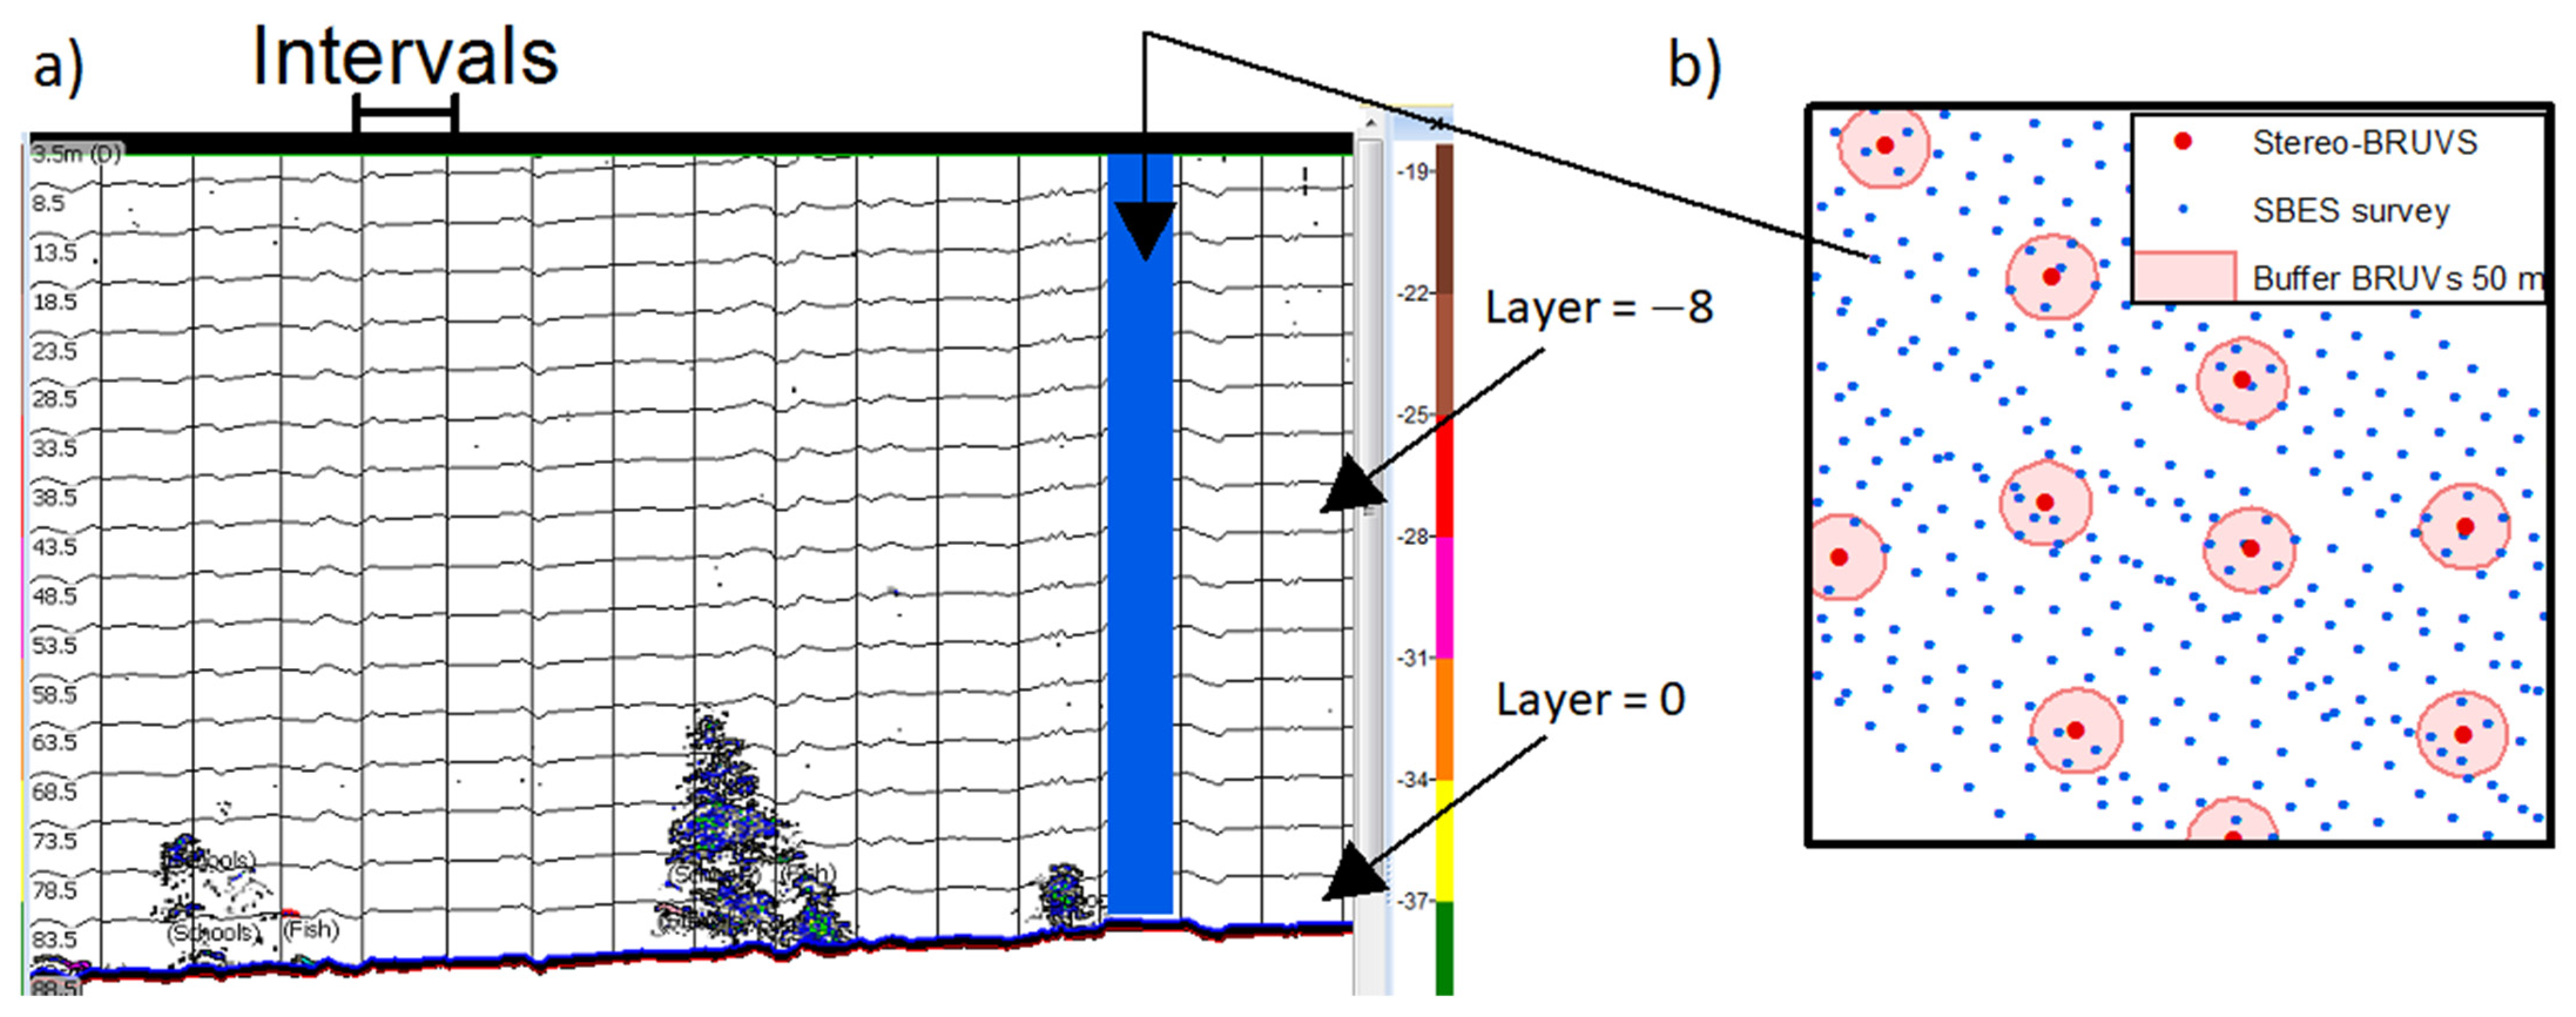
Correlations between acoustic variables and stereo-BRUV variables were explored. The location of the stereo-BRUV deployments was used to extract the acoustic data in the surrounding areas. Different radii of search were tested from 50 m and increasing in 50 m steps to 1500 m (Figure 2). The mean of the acoustic data among the sampling points in the corresponding radius of search was then calculated. Demersal and semidemersal species were anticipated to be present in the stereo-BRUVs. However, the area of influence of the bait plume in the water column was not clearly defined. For this reason, the different layers of the water column as exported from Echoview were included, one by one, starting from Layer 0, which corresponds to 0.5 to 5.5 m above the seafloor (Figure 2). This was particularly important in the NMP experiment in which there was a significant change in depth across the sampling area, compared with CS, where only two layers were sampled. The possible correlation between the water column acoustic data with the stereo-BRUVs was also tested by summing the acoustic layers starting from the top, and adding layers until the one above the seafloor.
A Wilcoxon rank sum test was used to compare the mean relative biomass, MaxN, NASCBRUV-mean, and NASCBRUV-mean no schools between benthic habitats (sand/reef).

3. Results

3.1. Cockburn Sound

3.1.1. Spatial Distribution of Acoustic Backscatter from Singlebeam Echosounder

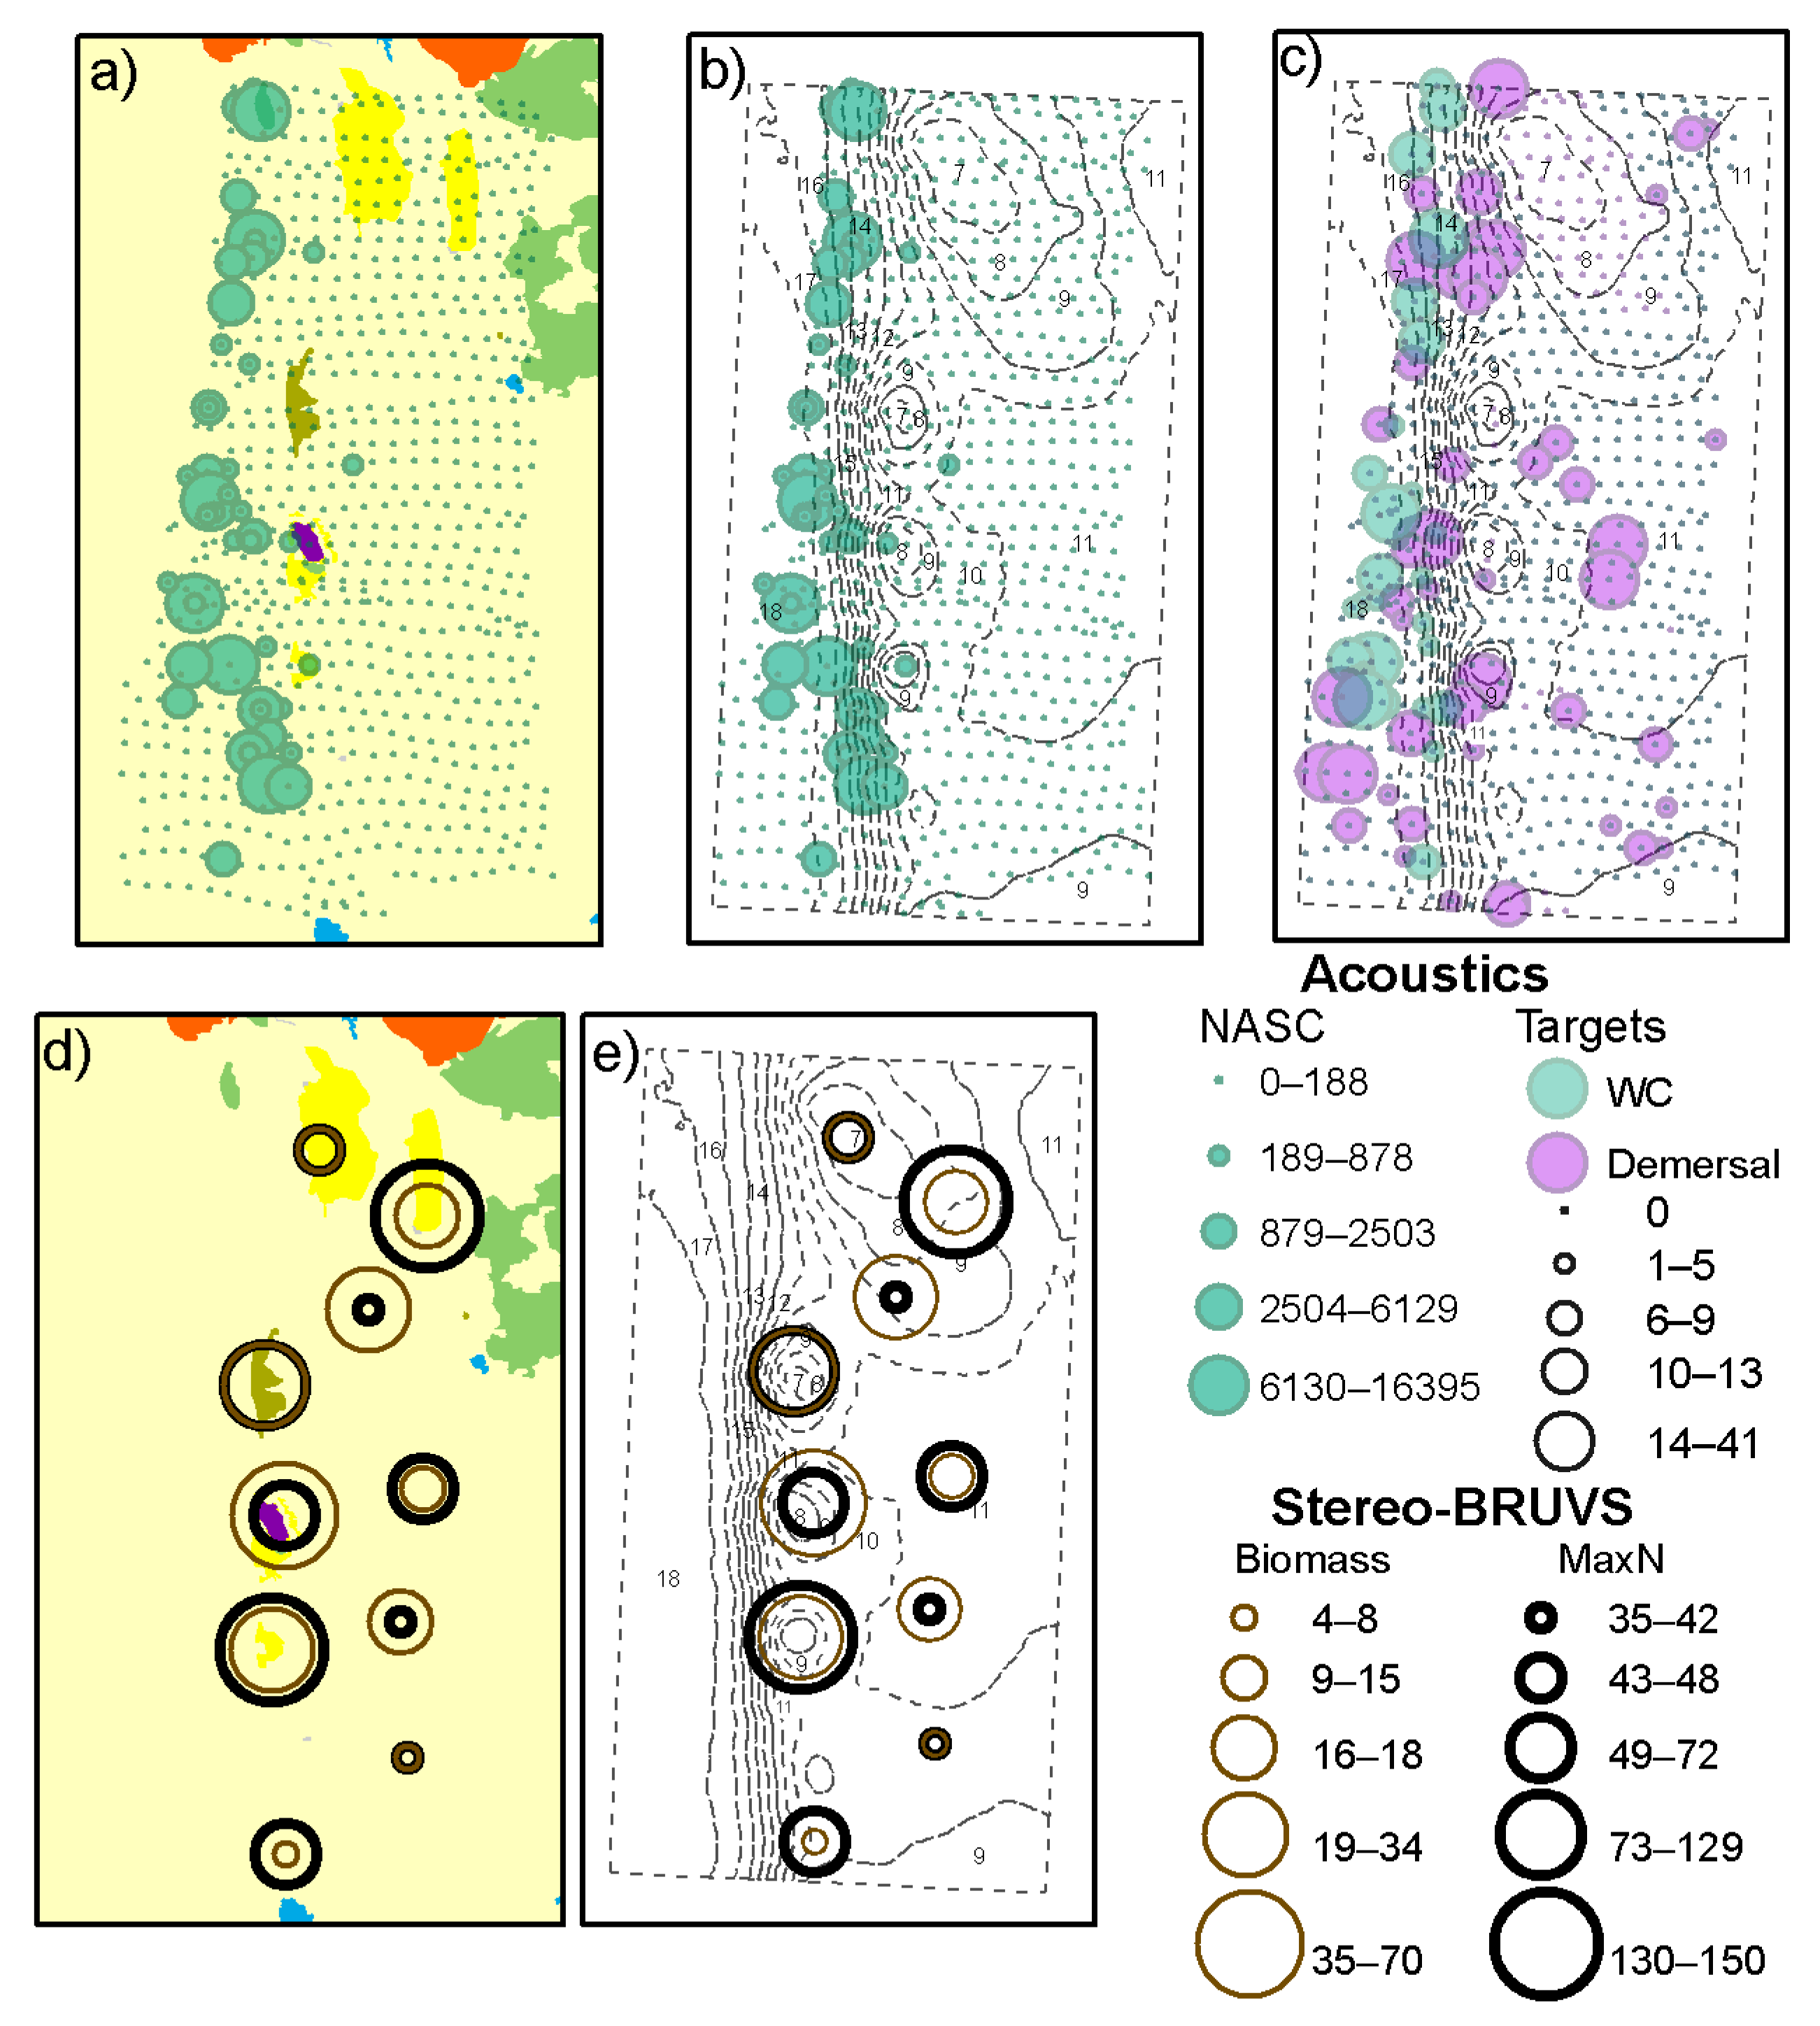
Higher values of acoustic backscatter, in the order of thousands NASC, were found on the west side of the study site, where there is a greater variety of benthic habitats and also a change in depth (Figure 3a,b). Lower levels of backscatter (less than 200 NASC) were observed in the eastern part of the study area. A similar pattern was observed for the number of acoustic targets in the water column, while for the demersal layer, higher values between 14 and 41 acoustic targets were also found in the central part of the study site (Figure 3c).

3.1.2. Spatial Distribution of Relative Biomass from Stereo-BRUVs

Higher levels of relative biomass (35–70 kg) were observed in the pavement reef and cobble reef areas (Figure 3d, Table 2). The sampling points located in the sandy bottoms had, in general, lower levels of relative biomass with few exceptions in which rays were observed, increasing the biomass for those sampling points. The total abundance (MaxN < 70) was also lower in areas with benthic habitats defined as sand.

3.1.3. Singlebeam Echosounder vs. Stereo-BRUVs

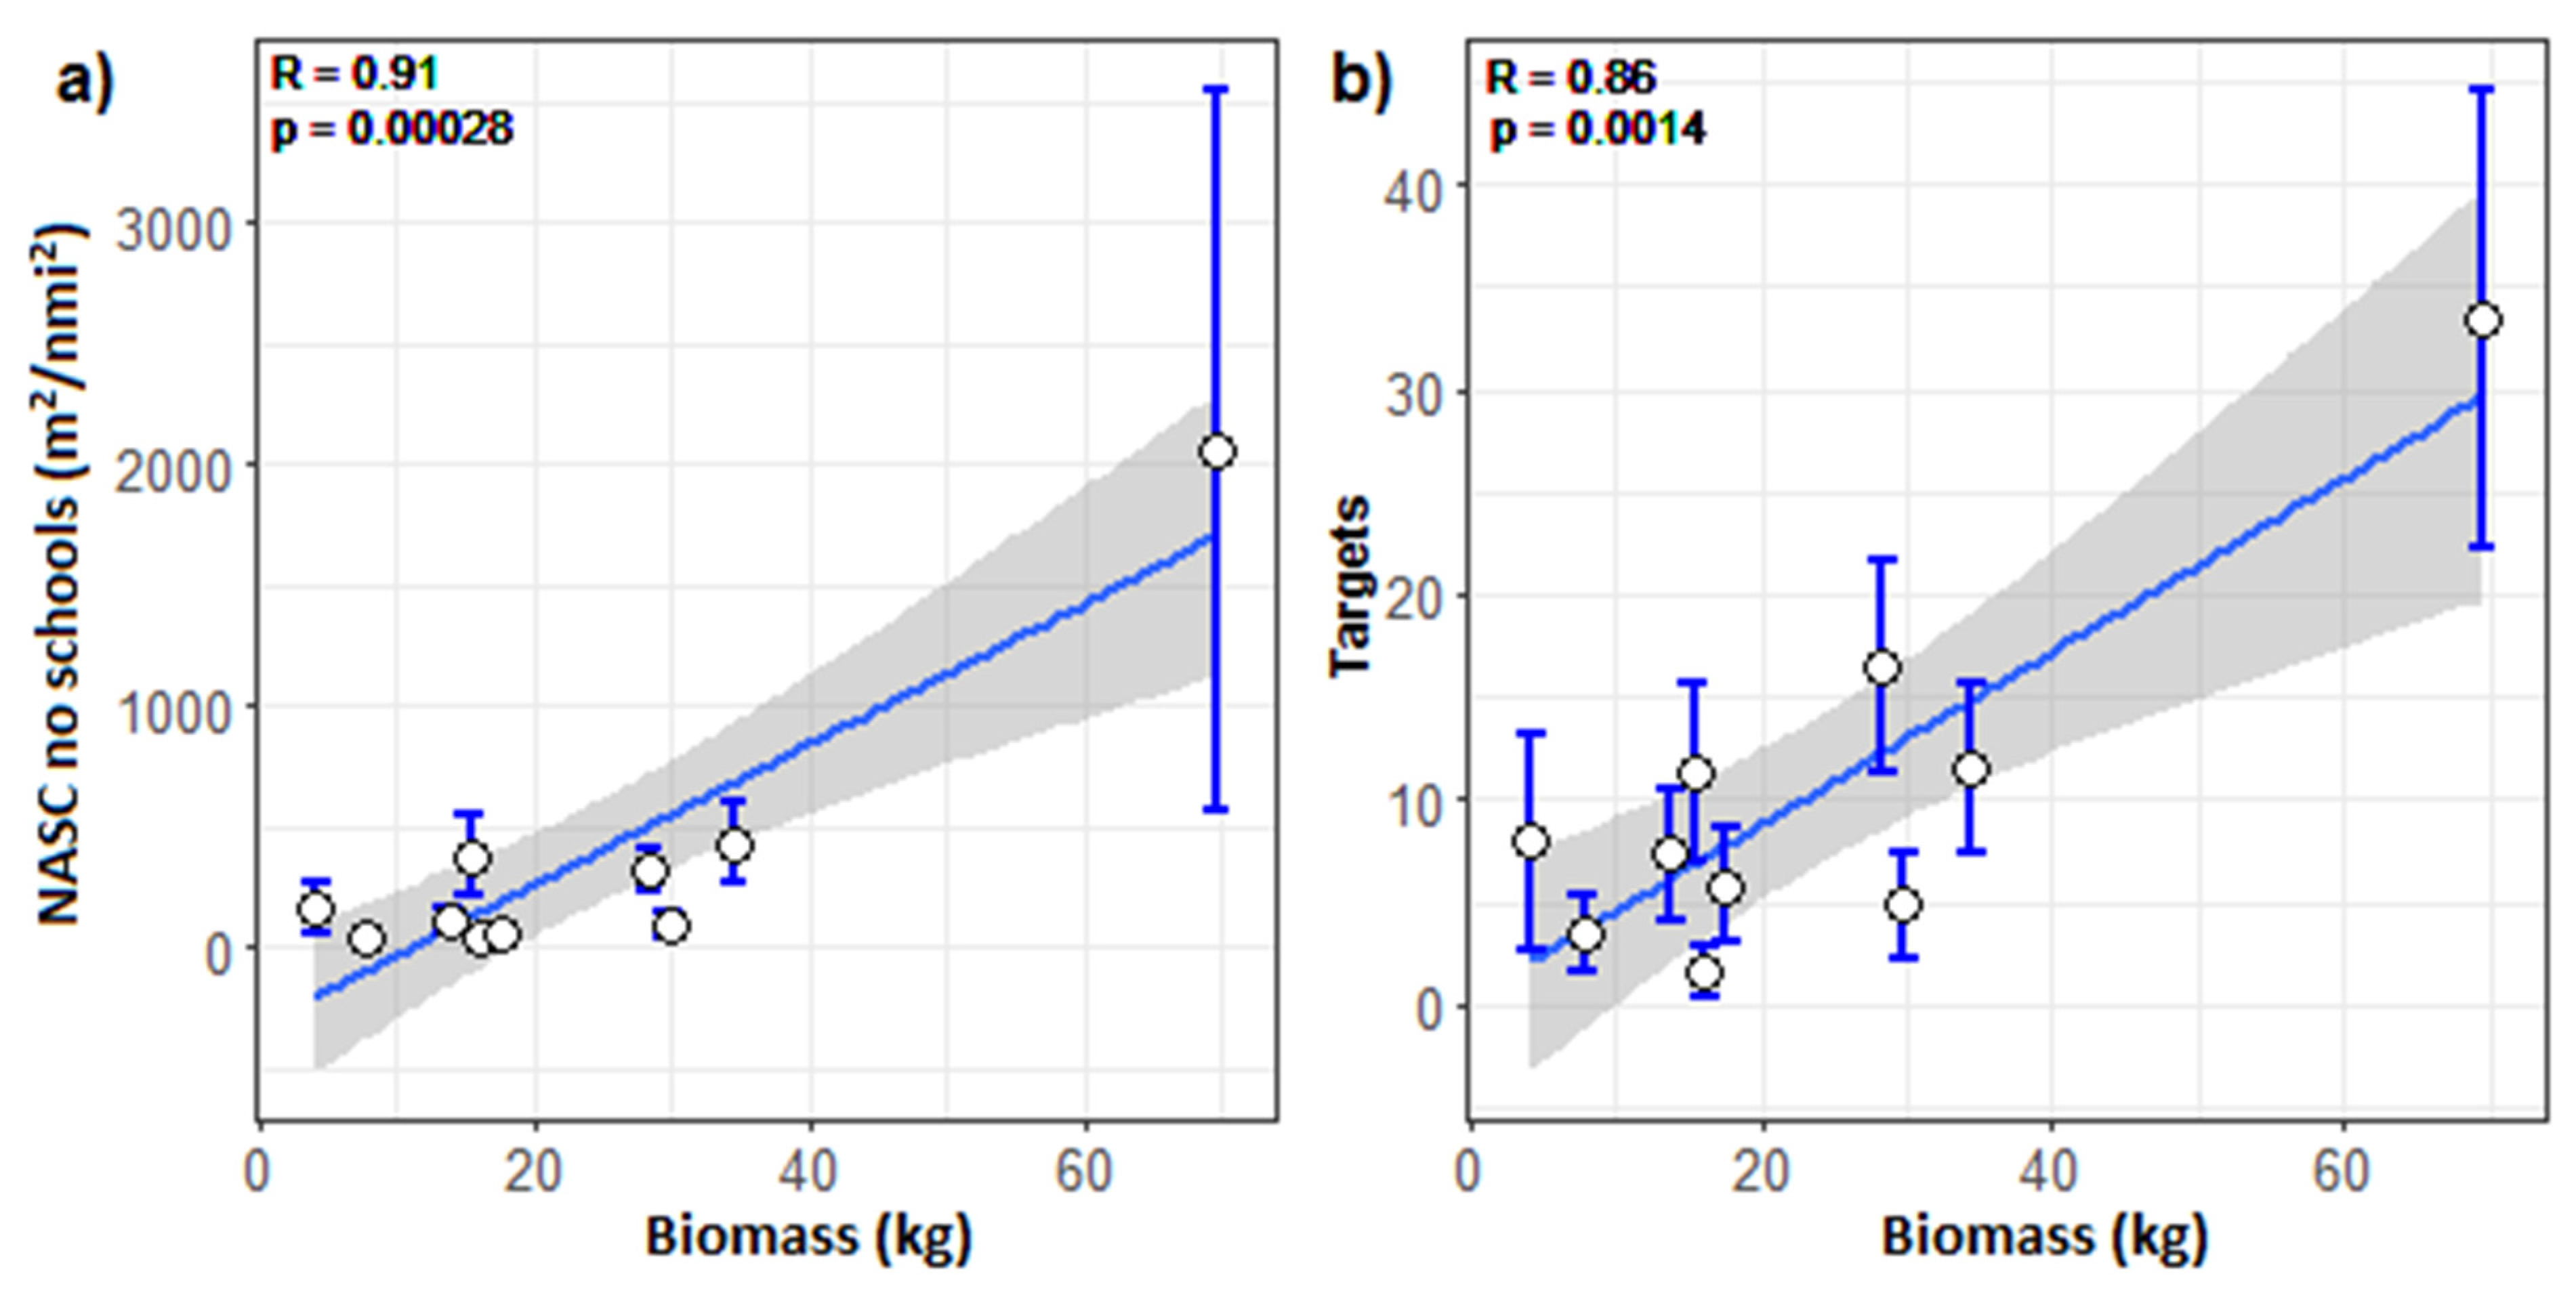
The best correlation between the acoustic and stereo-BRUV data was for the relative biomass from the stereo-BRUVs and the NASCBRUV-mean no schools using a radius of 300 m around the stereo-BRUVs and summing three layers (0.5 to 15.5 m) above the seafloor (r = 0.91, p = 0.0002; R2 = 0.82, p < 0.0001, Figure 4a). The high correlation between the NASCBRUV-mean and the relative biomass was only observed when the schools were excluded (Figure S3a,b).
The correlation between the number of acoustic targets and relative biomass from the stereo-BRUVs was also highly significant with the same 300 m radius of search but including only two layers (0.5–10.5 m) above the seafloor (r = 0.86, p = 0.0014, R2 = 0.73, p < 0.001, Figure 4b). No difference was observed in the levels of Pearson’s correlation when the integration started from the bottom or surface (p > 0.05).
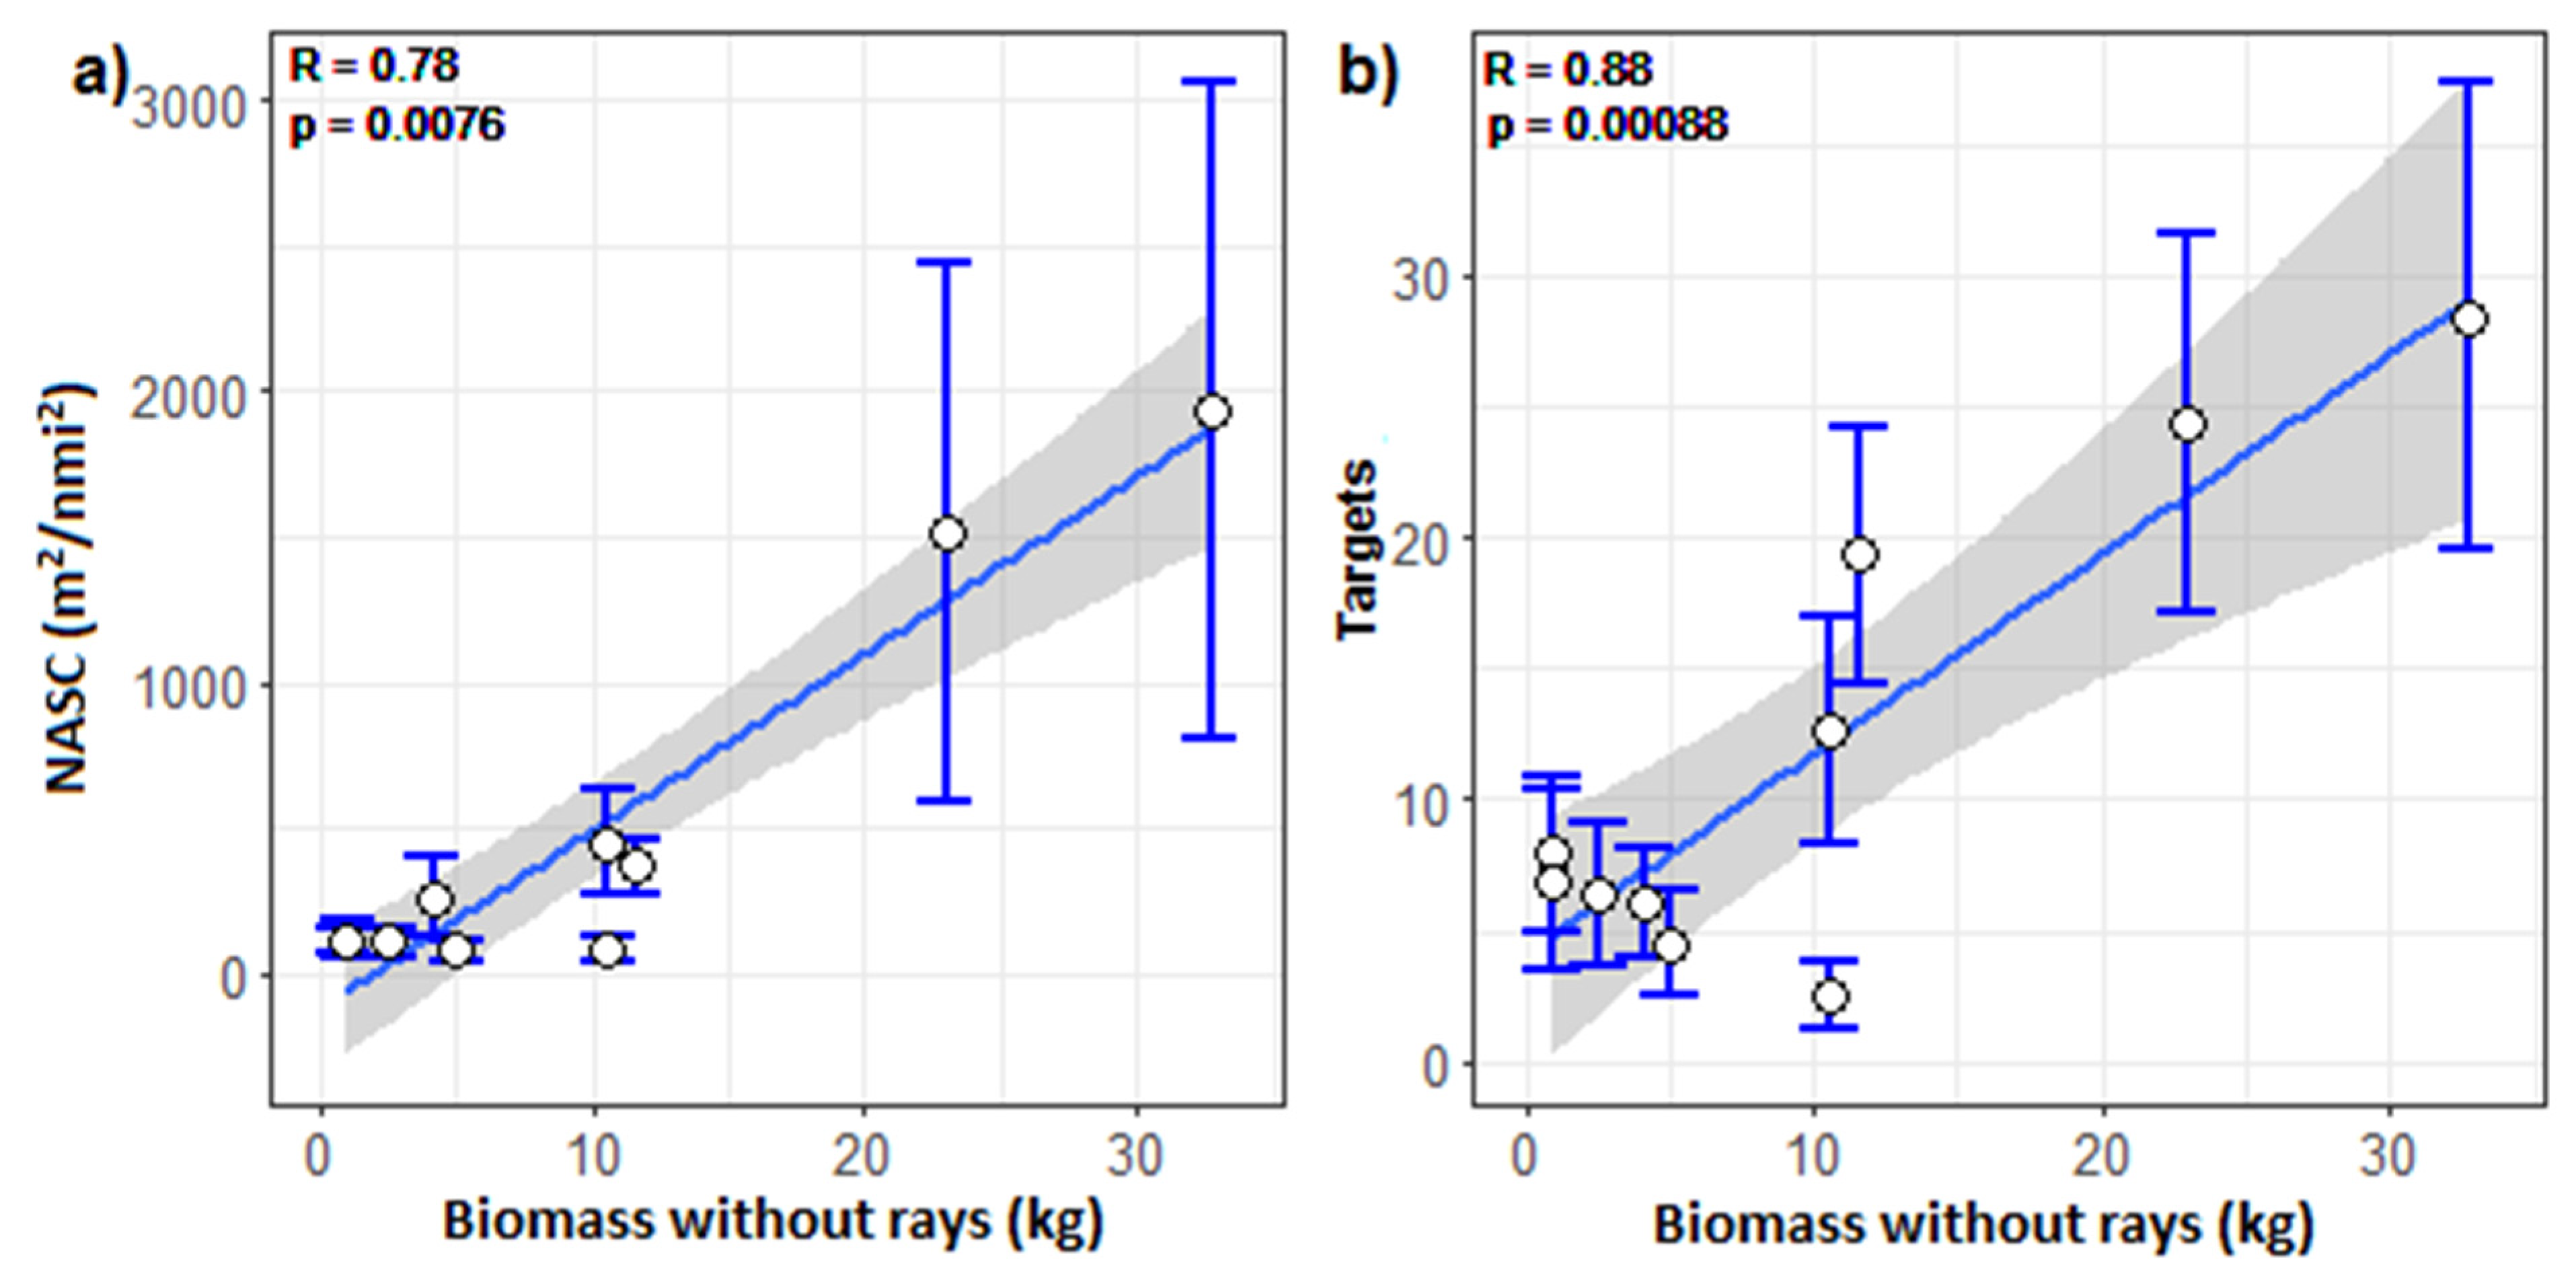
The correlation between acoustic variables and the biomass of the stereo-BRUVs with rays removed was also explored. These organisms are usually very close to the bottom [41] and are unlikely to be resolved by the echosounder. When excluding rays, the best Pearson’s correlation was found between the number of acoustic targets and the relative biomass (r = 0.78, p = 0.0076; Figure 5a). A strong and significant correlation was also found between the NASCBRUV-mean excluding schools and the relative biomass of the stereo-BRUVs excluding the rays (r = 0.88, p = 0.0008; Figure 5b).

Benthic Habitats

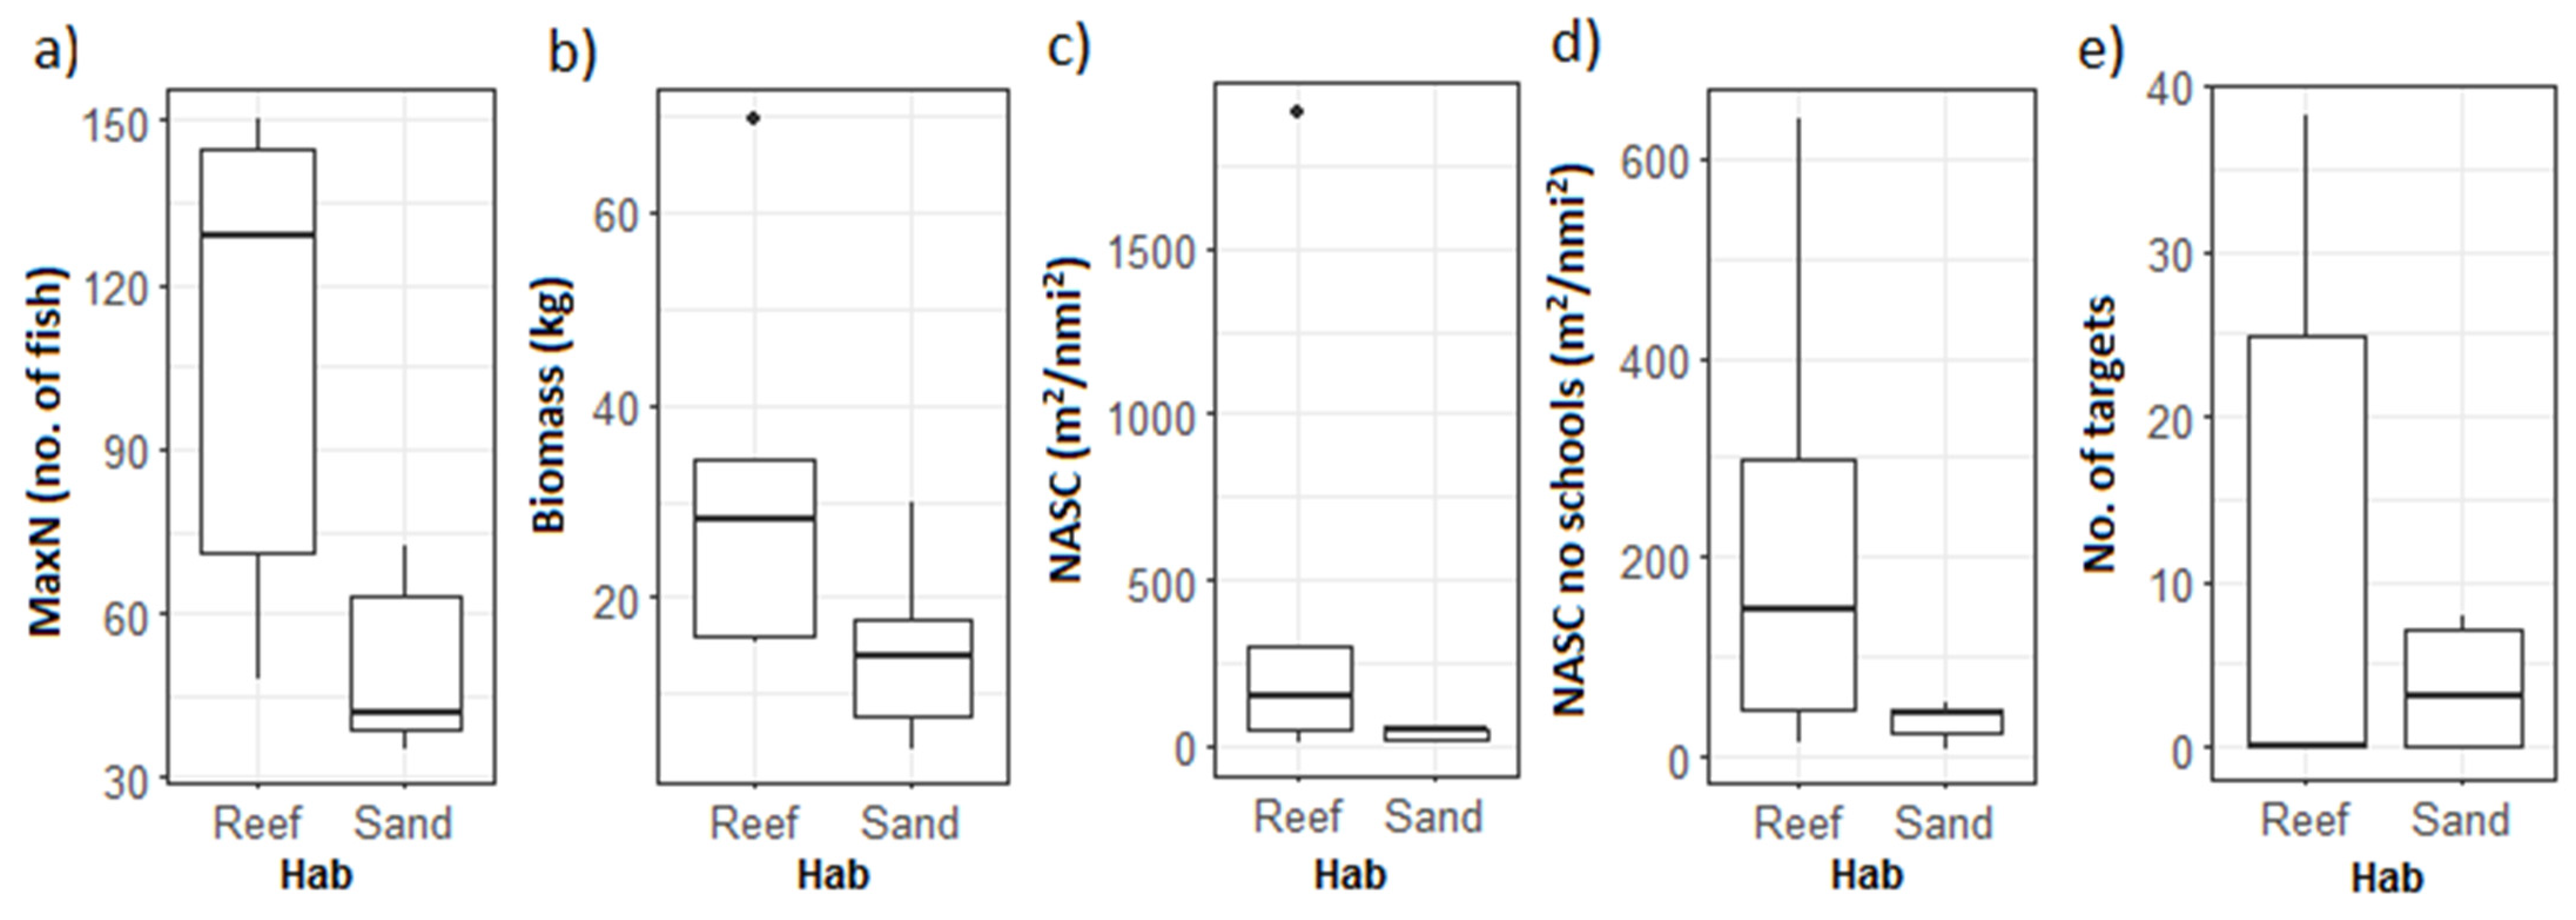
The classification of benthic habitats into two classes (reef and sand) showed a consistent pattern of higher mean values of relative MaxN and biomass, 130 and 28 km, respectively, in the areas with reef habitats compared with 40 and 15 kg in the sandy areas (Figure 6a,b). This was also reflected in the NASCBRUV-mean and number of acoustic targets (Figure 6c–e). However, the Wilcox test showed no significant differences between benthic classes for NASCBRUV-mean and the number of acoustic targets (α < 0.05) and was only indicative for MaxN (W = 3, p = 0.05, power = 0.52).

3.2. Ningaloo Marine Park

3.2.1. Spatial Distribution of Acoustic Backscatter from Singlebeam Echosounder

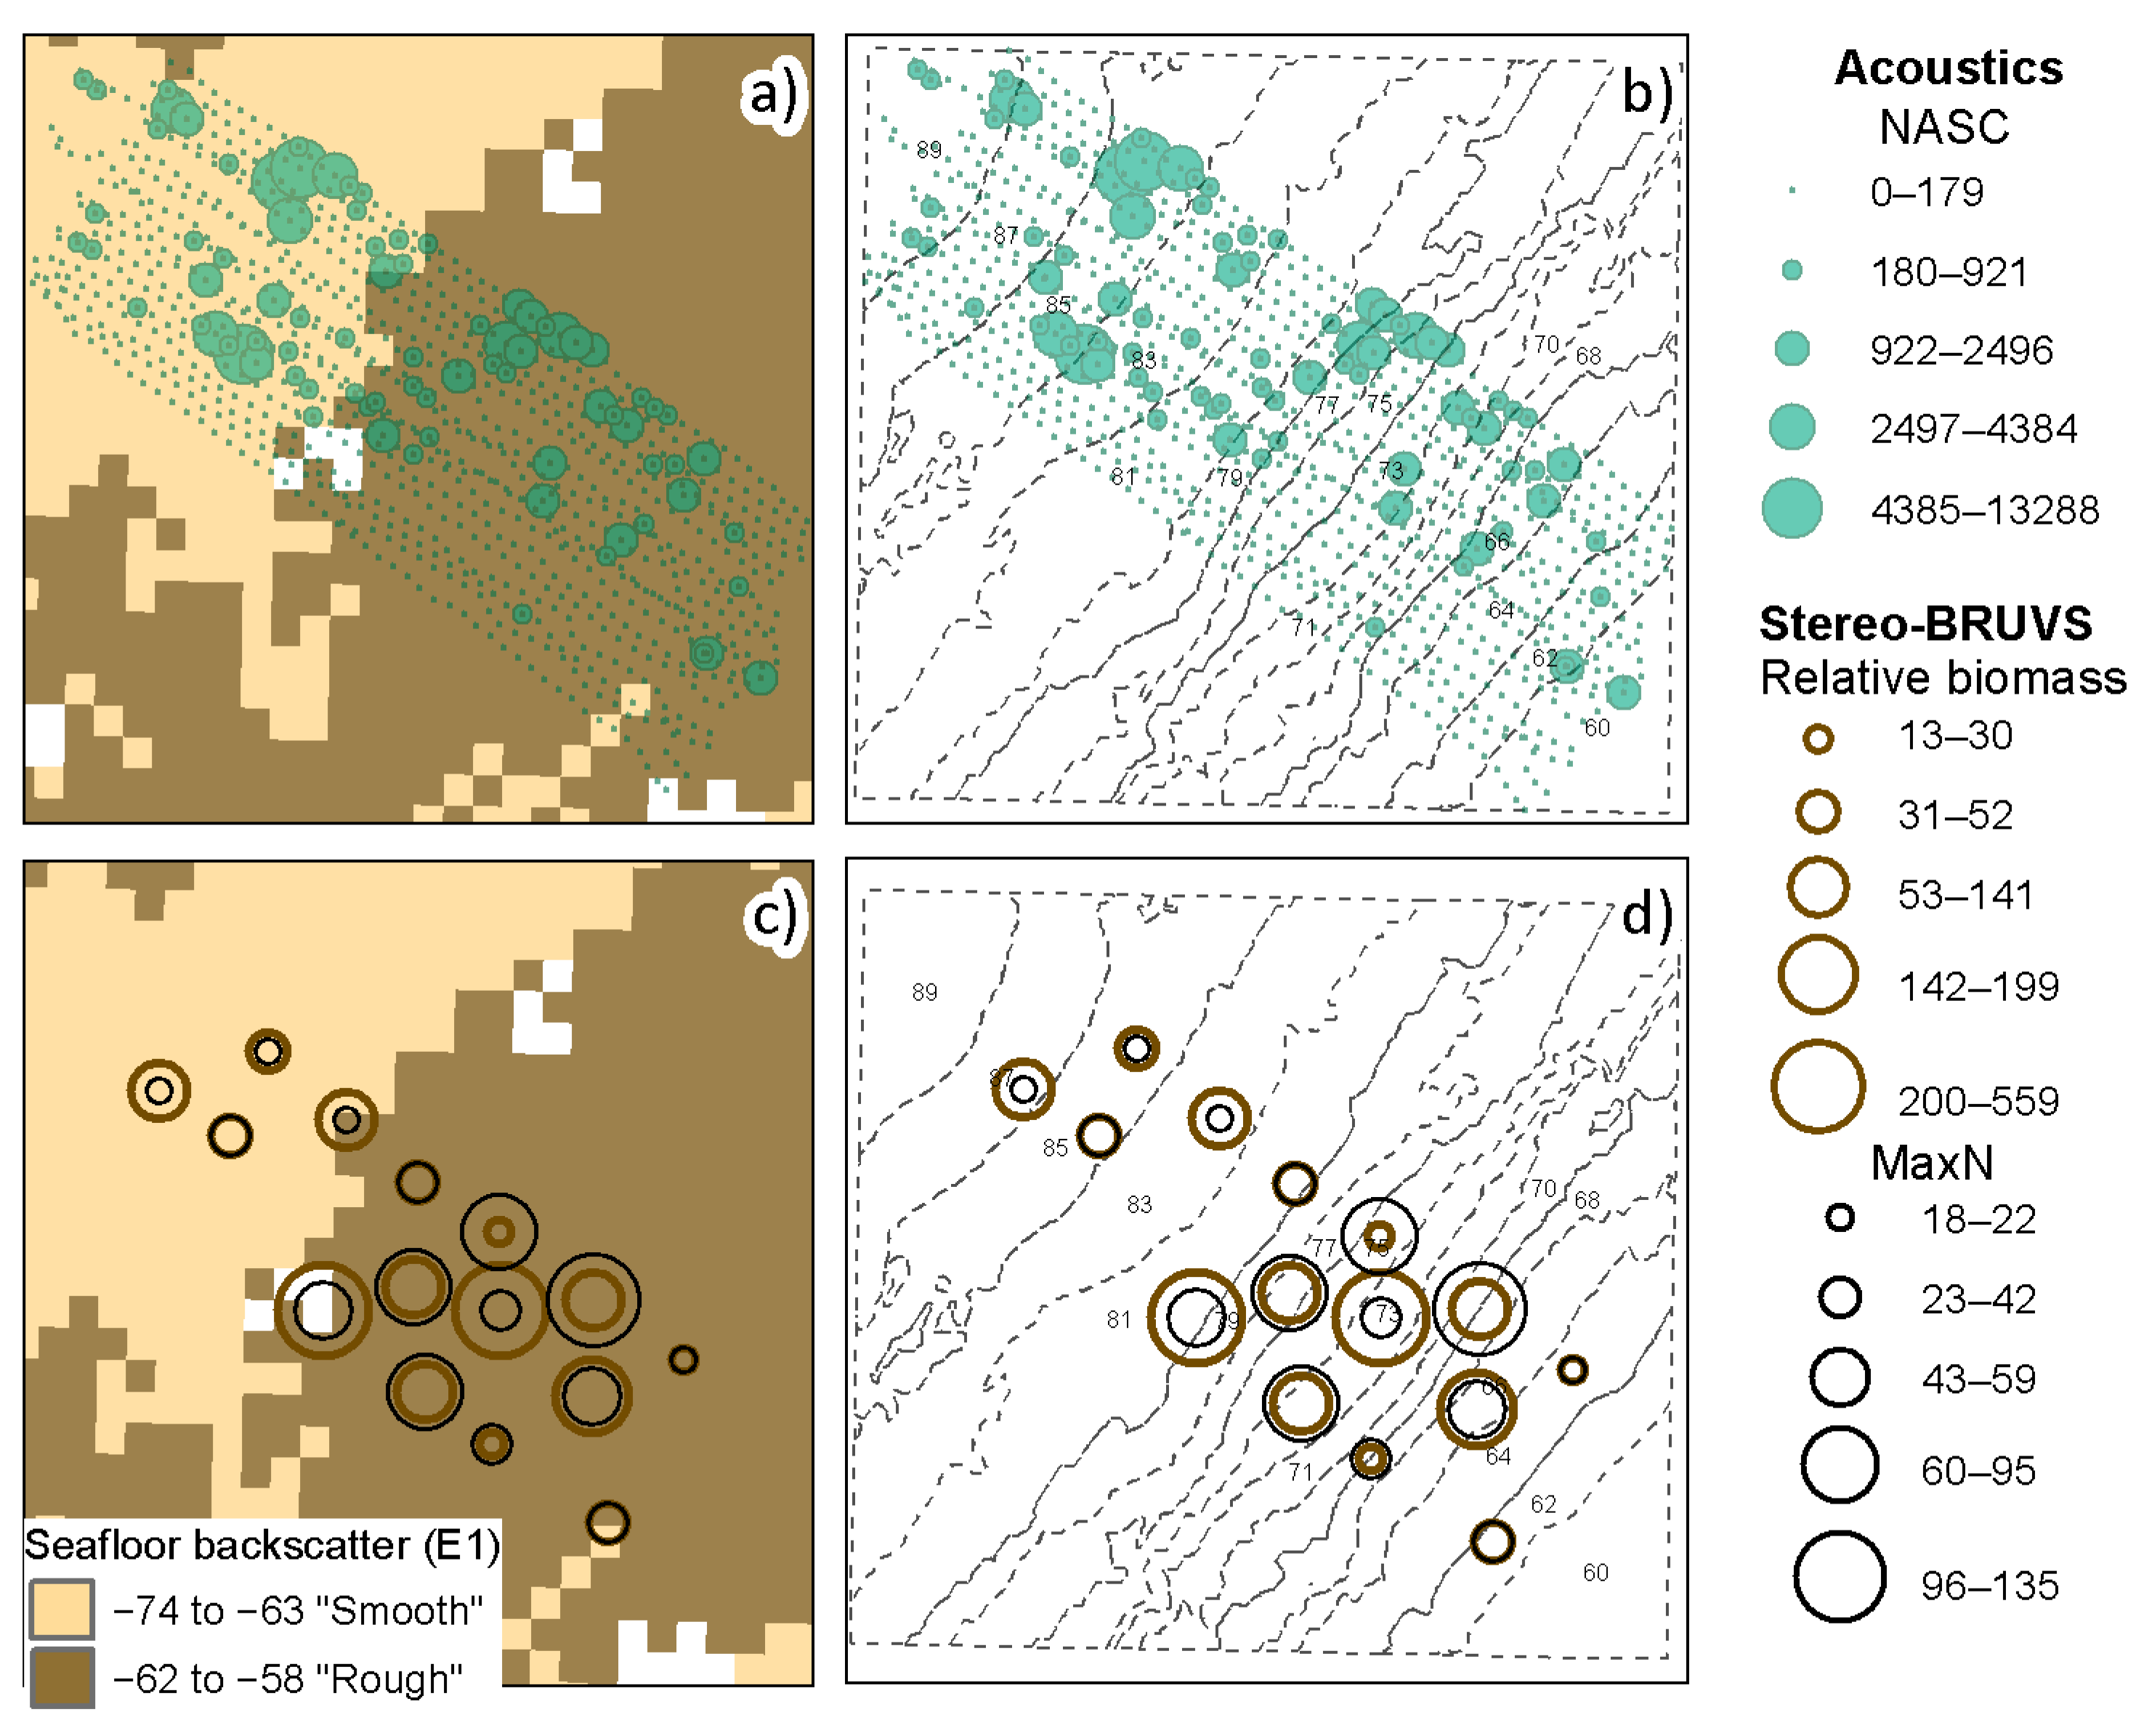
Areas of high acoustic biomass (>1000 NASC) were observed at the northeastern edge of the sampled area and in some particular areas in the central portion of the study site (Figure 7a,b). No apparent difference was observed between the depth-stratified NASC with and without schools of fish; therefore, only the total depth-stratified NASC is shown.

3.2.2. Spatial Distribution of Relative Biomass from Stereo-BRUVs

A spatial pattern of higher levels of abundance (MaxN > 60) was observed in the central-south section of the study area characterized by “hard” acoustic seafloor and shallower depths (Figure 7c,d). A similar pattern was observed to a lesser extent in the relative biomass >50 kg (Figure 7c,d and Table 3).

3.2.3. Singlebeam Echosounder vs. Stereo-BRUVs

Low Pearson’s correlations were found between the relative biomass (kg) from the stereo-BRUVs and the NASCBRUV-mean (r < 0.40, p > 0.05; Figure S4a), the removal of the schools did not change the correlation between them, and the curve had an almost identical shape; therefore, only the NASCBRUV-mean is shown. Low correlations were also found between MaxN and NASCBRUV-mean (Figure S4b), and only the 50 m radius around the stereo-BRUVs produced a correlation of r = 0.6, but it was not significant (at α = 0.05).
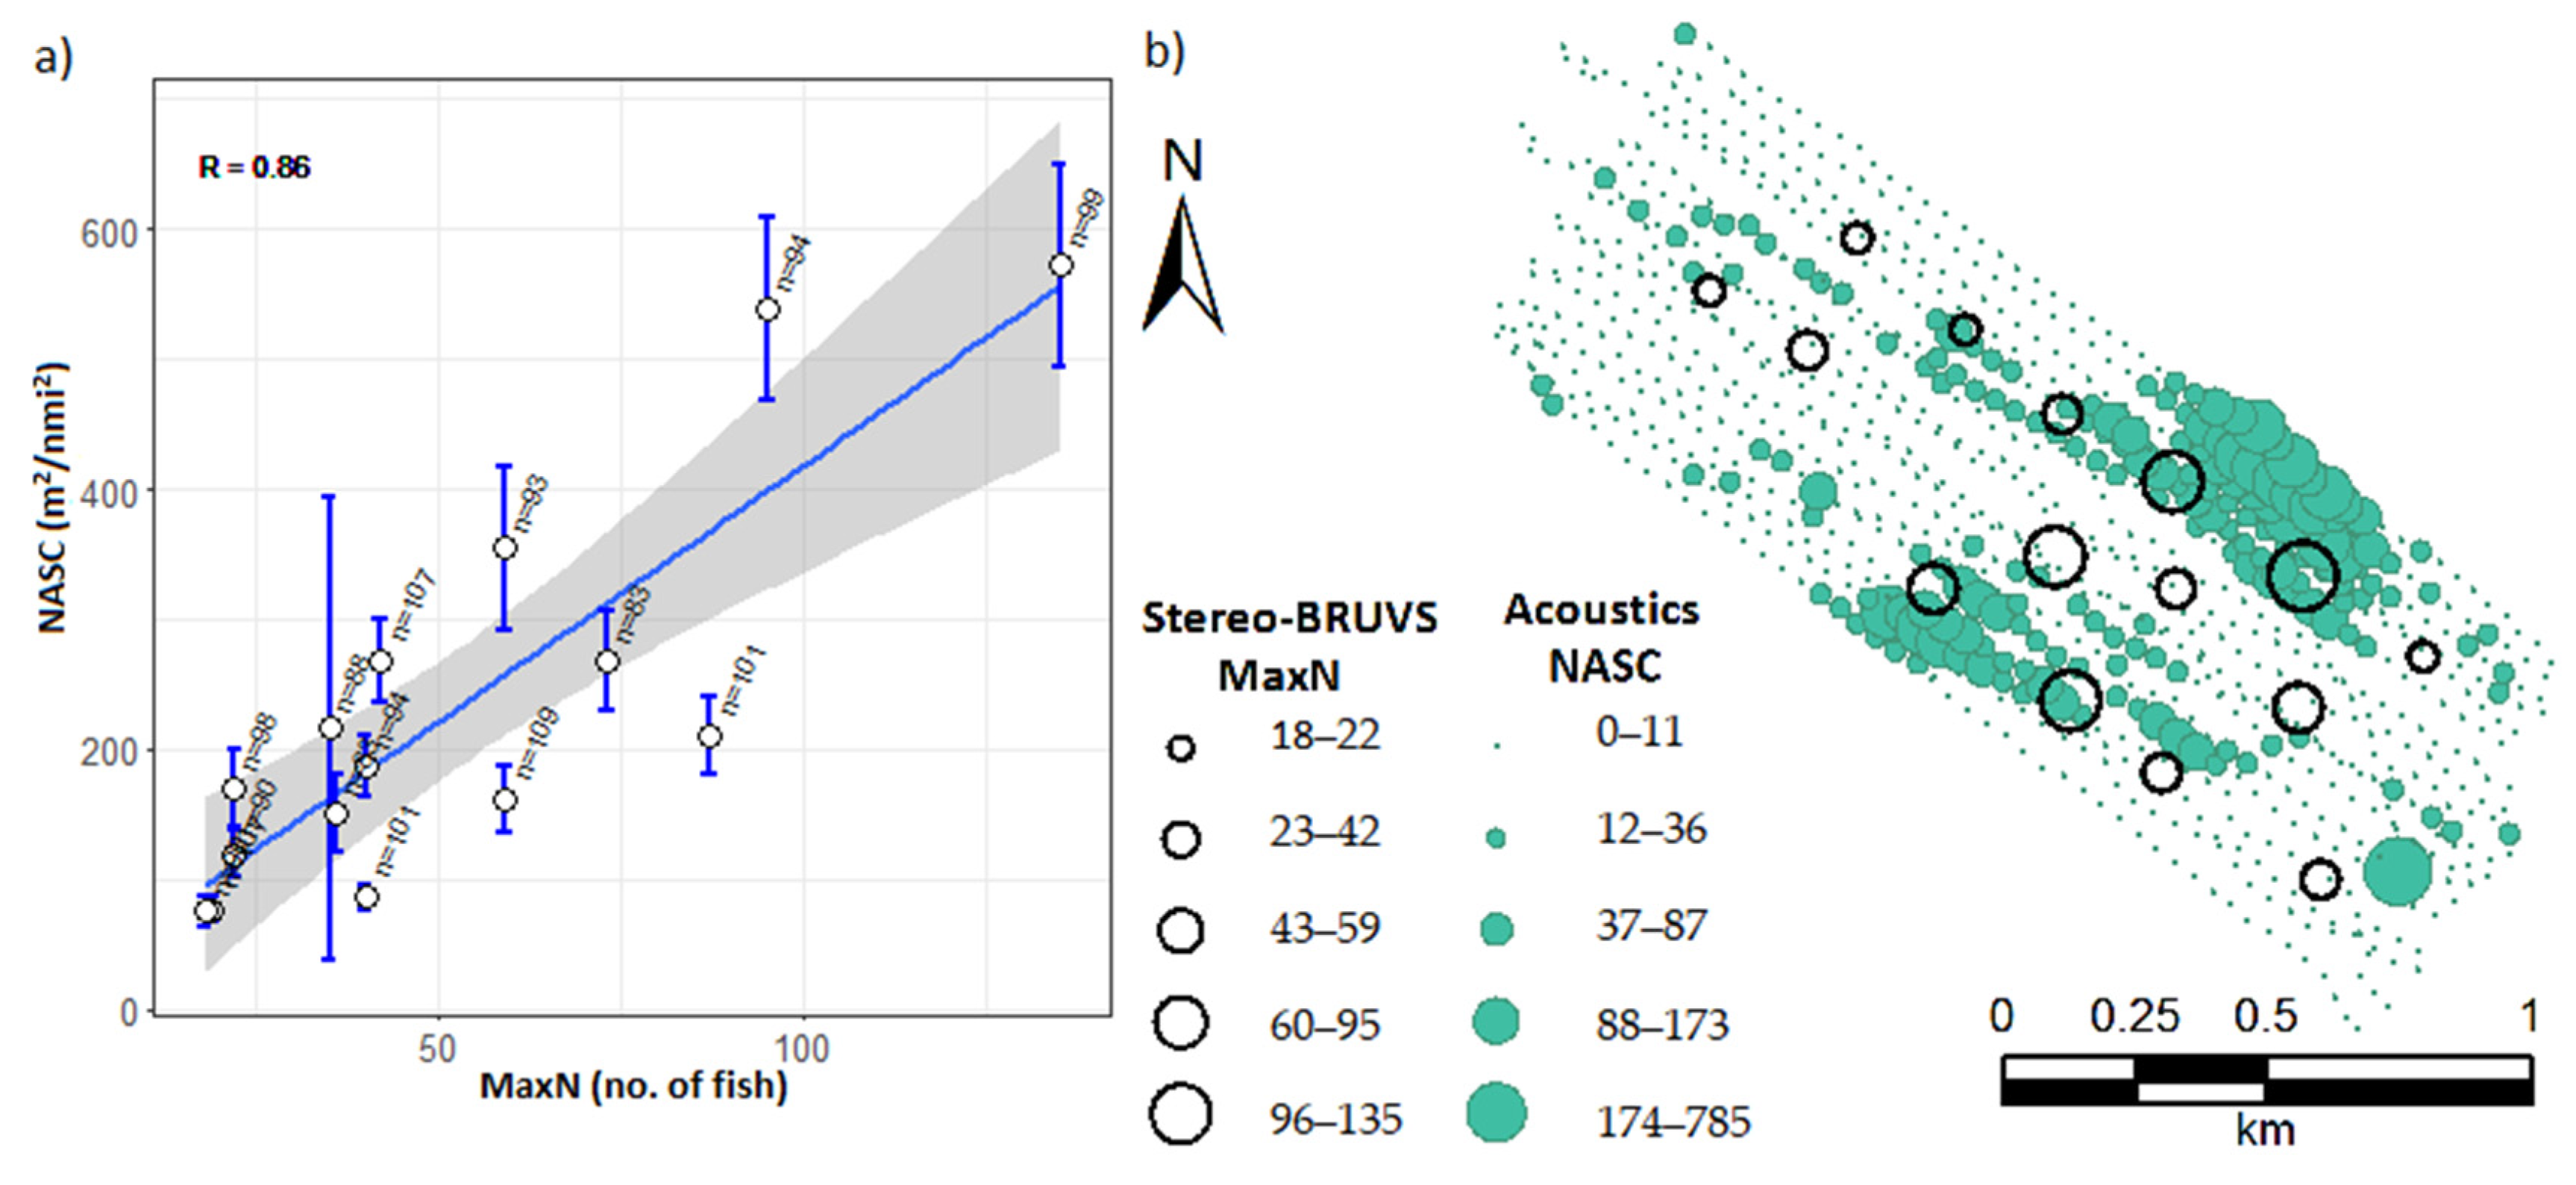
When the layers were integrated starting from the surface (Figure S5), a strong correlation was found between MaxN from the stereo-BRUVs and NASCBRUV-mean (r = 0.855, p < 0.001, R2 = 0.71, p < 0.001) if only 35 m closest to the surface was included (Figure 8a). This high correlation can also be observed in the spatial distribution of the depth-stratified NASC and MaxN of the stereo-BRUVs with higher values in the eastern edge of the sampling areas and also at the western edge (Figure 8b).
In some of the stations, the presence of one shark can increase the biomass by hundreds of kilograms, while it is unlikely that the narrow beam of the echosounder would have insonified it. Hence, the correlation between the acoustic variables and the relative biomass without sharks and rays was also tested. However, the exclusion of the sharks did not improve the correlation between the acoustic NASCBRUV-mean and the relative biomass from the stereo-BRUVs. Both the bottom-to-top and top-to-bottom summing layer approaches were tested, but no improvement was observed in either case (Figure S6).

Benthic Habitats

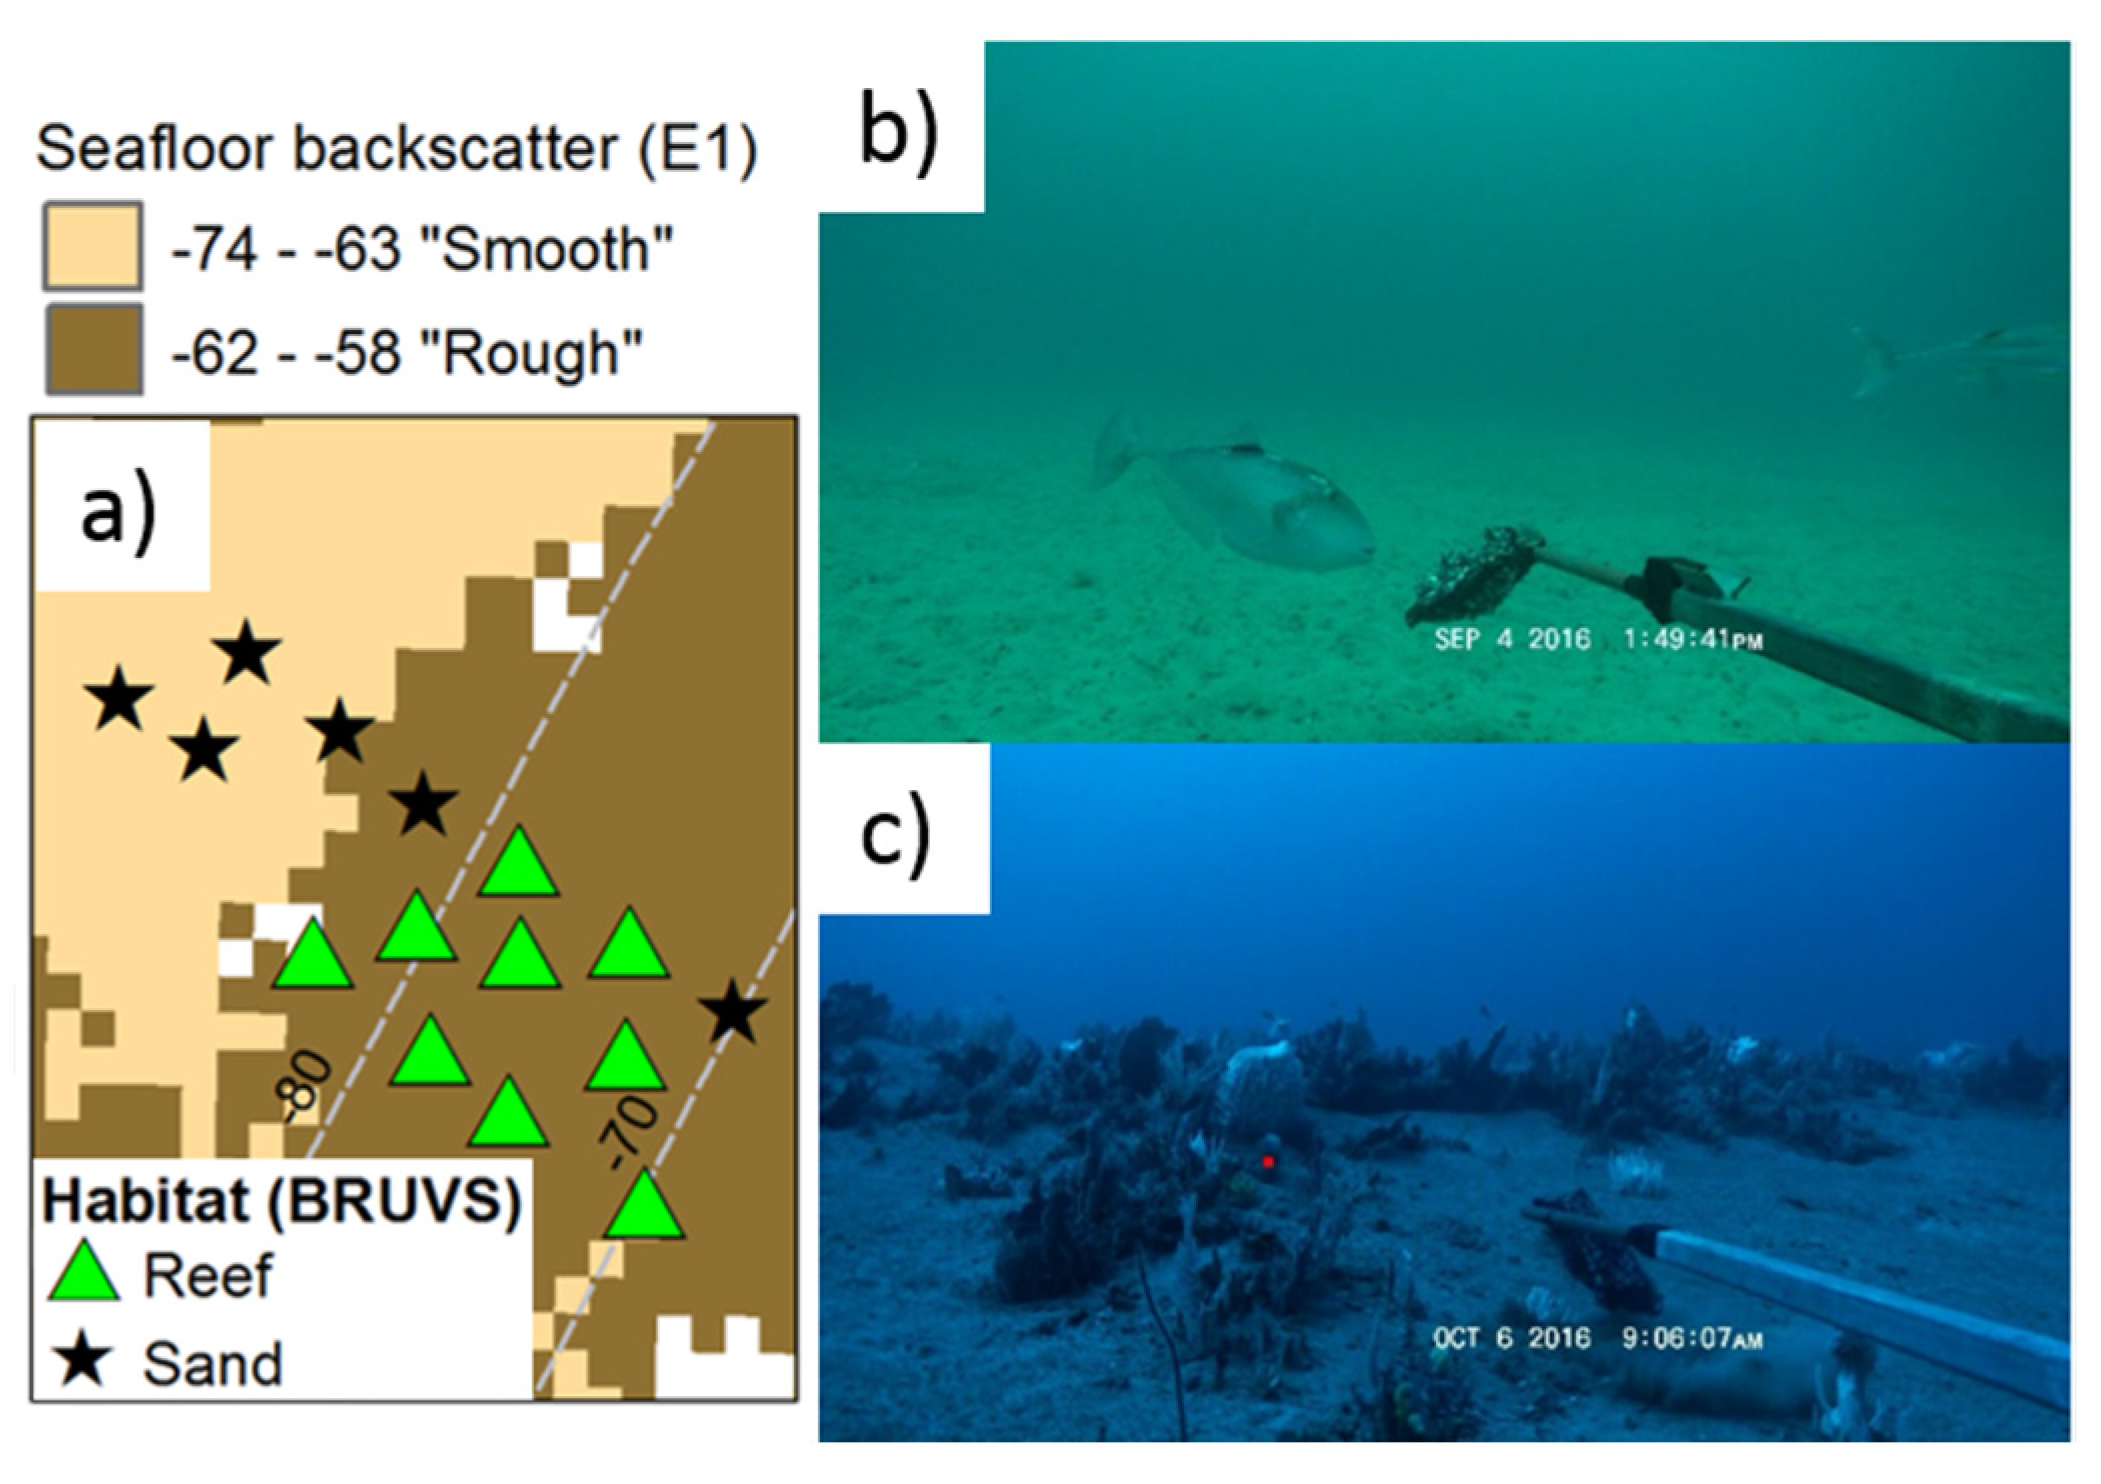
The seafloor classification based on acoustic roughness (E1) was useful to differentiate between sandy bottoms and areas with the presences of sponges and soft corals (Figure 9). Out of the 15 sampling points, only 2 were misclassified by using the E1 parameter. In all cases, “reef” bottoms were classified as “rough” bottoms using E1.
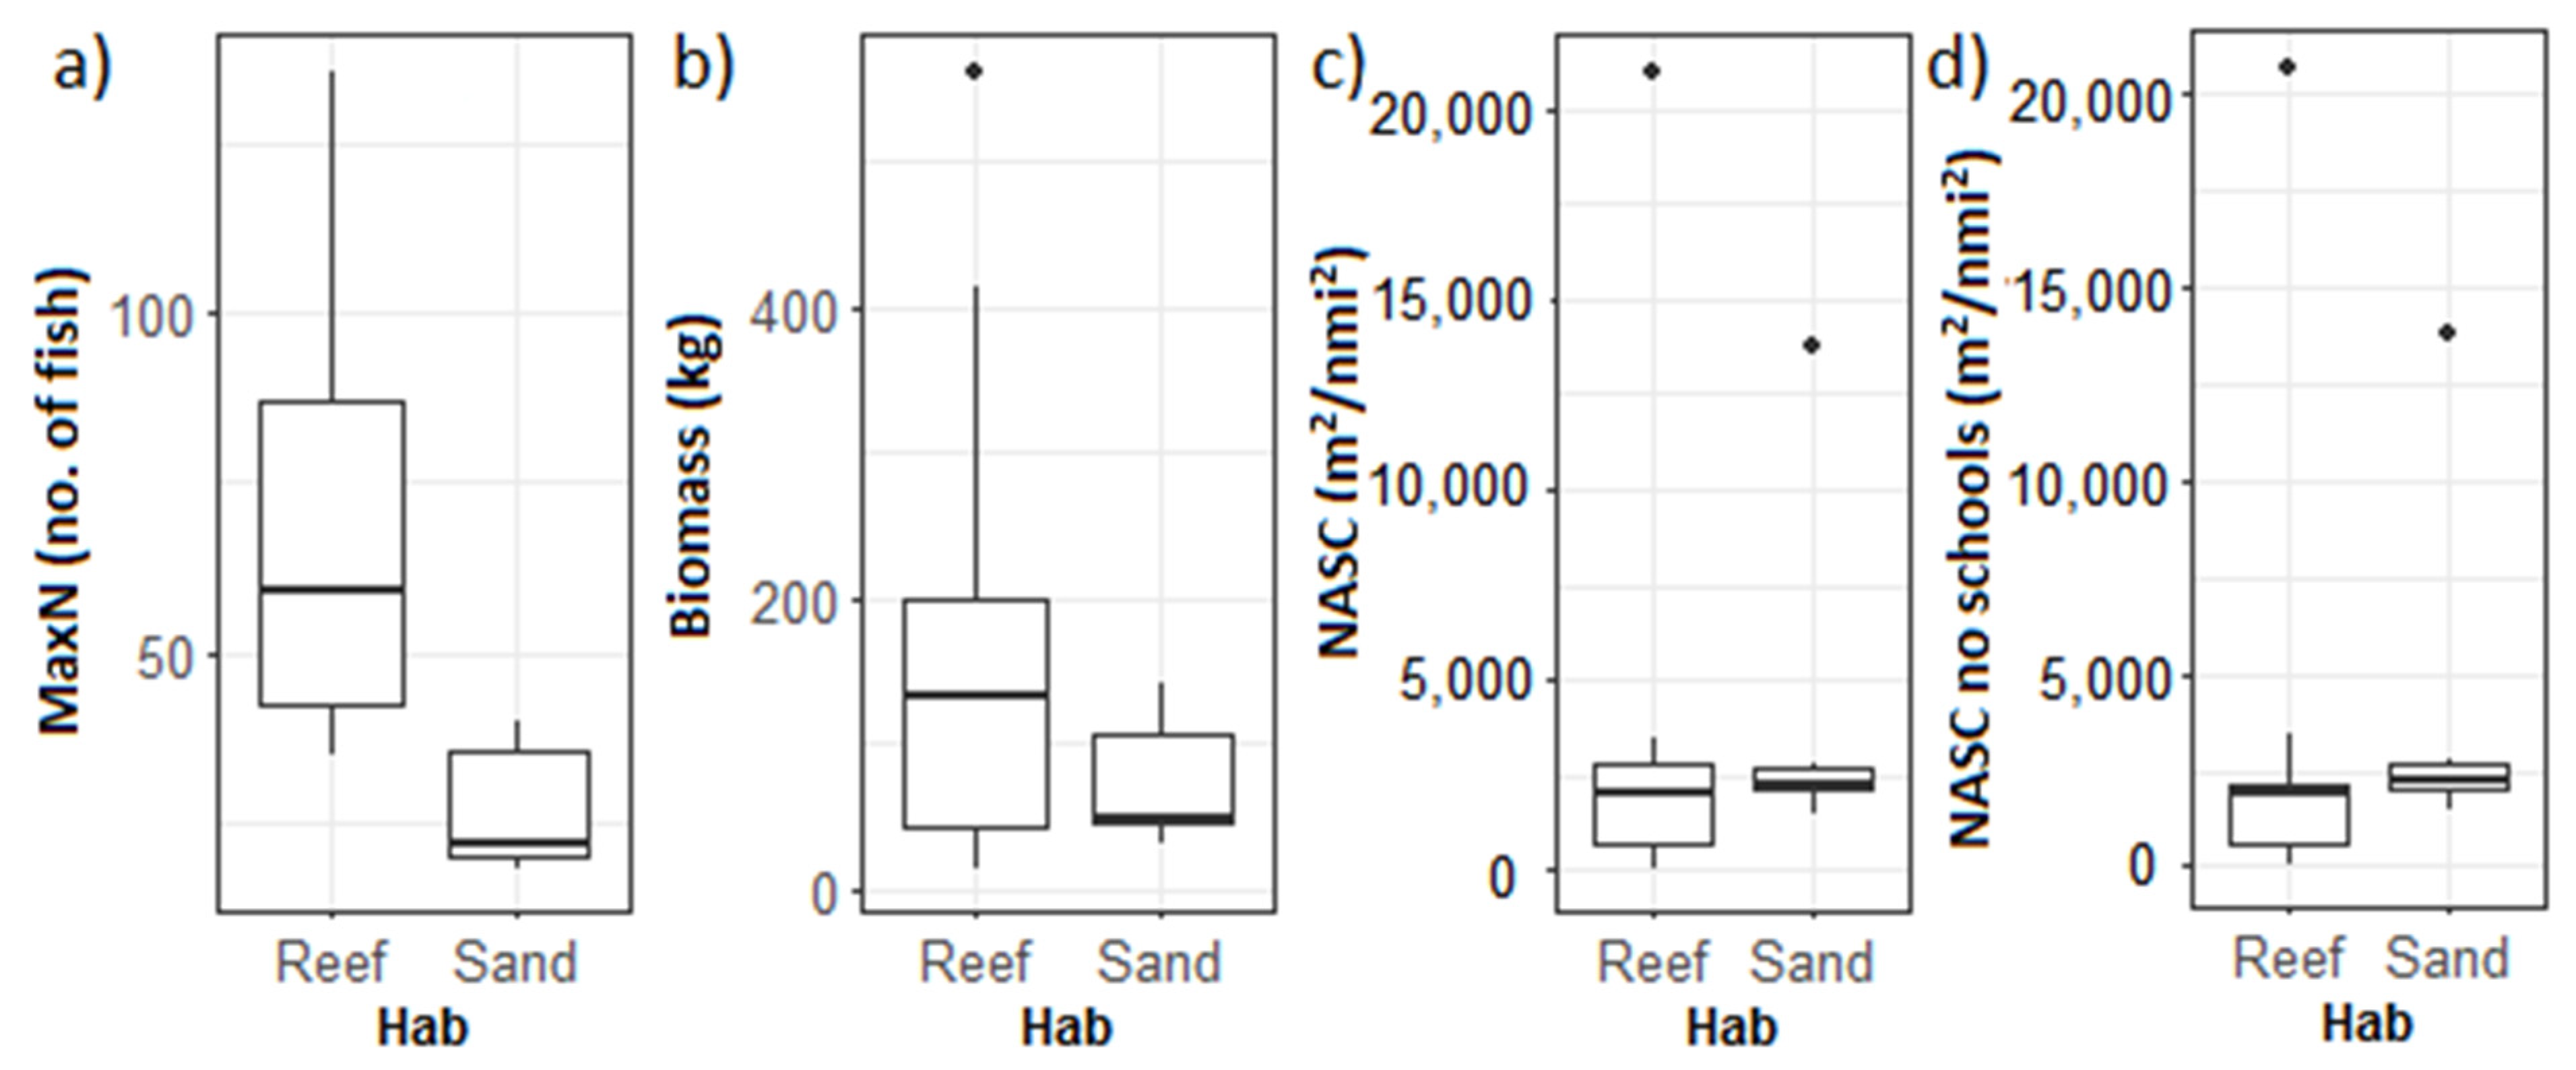
The Wilcox test showed a significant difference between MaxN in sampling points with “rough” and “smooth” bottom classified using the seafloor backscatter (W = 4, p = 0.022, power = 0.57; Table 3). A much stronger difference was found between the sand and reef areas classified using the visual assessment from the stereo-BRUVs (W = 4, p = 0.007, power = 0.81; Figure 10a). No differences were observed between the NASCBRUV-mean with and without schools between the benthic habitats for the full water column in a 150 m radius around the stereo-BRUVs (Table 3, Figure 10). An apparent pattern of higher values of depth-stratified NASC both with and without schools was observed in the reef areas when only the water column above 40.5 m was included. However, the differences were not significant (W = 20, p = 0.45, power = 0.21; Figure 11).

4. Discussion

Two study sites off the coast of WA were used to explore the possibility of combining stereo-BRUVs and echosounder data in the assessment of demersal fish in reef areas. The results in the CS area showed a strong correlation between the spatial distribution of acoustic biomass and the relative biomass recorded by the stereo-BRUVs, in particular when the pelagic schools were excluded from the analysis. For the NMP, on the other hand, significant but not strong correlations were found between the demersal acoustic biomass and the stereo-BRUVs. The higher variability of the NMP system was evident, highlighting the importance of collecting the acoustic and stereo-BRUV data as close in time as possible.

4.1. Cockburn Sound

Areas of higher relative abundance (MaxN) from the stereo-BRUVs were associated with reef benthic habitats. A similar pattern was observed in the number of acoustic targets and NASCBRUV-mean to a lesser extent. Although these differences were not statistically significant, the power analysis showed the low sample size was the main reason for this indicative, but not significant, relationship.
The highest values of the depth-stratified NASC were associated with pelagic schools located in the western edge of the study site where there is a rapid change in depth. The exclusion of the depth-stratified NASC from the schools had the effect of increasing the correlation between the acoustic and stereo-BRUV data. Although stereo-BRUVs can sample demersal, semidemersal, and pelagic species [13], recent studies using pelagic stereo-BRUVs in a tropical area showed significant differences between the assemblages of species at two different depths in the water column [42]. The differences were mainly driven by species, which were only recorded either in the deeper or close to the surface deployments, including some schooling pelagic species recorded only close to the surface [42]. It is possible that the schooling species recorded by the echosounder in the CS area were not observed with the demersal stereo-BRUVs; therefore, the removal of the schools in the acoustic data increased the correlation with the stereo-BRUVs data.
An almost linear relationship between the NASCBRUV-mean without schools and the biomass from the stereo-BRUVs suggests that the acoustic biomass of the nonschooling targets was a good indicator of the relative biomass as observed by the stereo-BRUVs. The exclusion of rays, which spend most of the time very close to the bottom [41] and are probably not detected by the echosounder, reduced the correlation, but the relationship was still strong, which supports the idea that the depth-stratified NASC is a good indicator of the relative biomass from the stereo-BRUVs in this study site.
An increase in the number of acoustic targets was related to an increase in relative biomass from the stereo-BRUVs, which indicates low variability in the size of the fish. This was supported by the stereo-BRUV results, which showed less variability in the relative biomass distribution on the fish recorded in CS with respect to the NMP area. The relationship was stronger when the rays were excluded from the biomass of the stereo-BRUVs. These results suggest that a potential combination of the echosounder and stereo-BRUVs can improve the estimations of spatial distribution of demersal fish biomass in CS.

4.2. Ningaloo Marine Park

The benthic classification based on the E1 acoustic metric was able to discriminate the sandy bottoms from the sand with sponges and corals, with two exceptions. The E1 metric is more influenced by the “roughness” of the seafloor, which can explain the misclassification of the two sandy areas with sand waves and sand ripples being considered soft rough [28].
A combination of benthic habitats and depth was the possible cause of higher MaxN record by the stereo-BRUVs in shallow areas of reef, although the relative biomass was also high in some areas of the sandy deeper bottom. The presence of sharks and bigger fish in the deeper areas created this pattern of low abundance but high biomass. A previous study conducted in the NMP reported less abundance and richness of species in deeper areas but larger individuals, related to ontogenic habitat changes for many species [43]. These results are in accordance with previous studies suggesting that the distribution of coral reef fishes is not homogenous and can be influenced by specific characteristics of the seafloor [44]. For example, some species have a preference for deeper waters, while others concentrate in areas close to the slope [45,46], and some others have a strong preference for hard or soft bottoms [47].
Low correlations were found between the NASCBRUV-mean with and without schools and the acoustic data when the layers were summed from bottom to top. The exclusion of sharks and rays from the estimation of relative biomass from the stereo-BRUVs did not increase its relationship with the acoustic biomass. Unlike observations from CS, the exclusion of the schools of fish did not affect the relationship between the acoustics and the stereo-BRUVs data, as the depth-stratified NASC concentrated in the schools was low.
An unexpected result was the strong correlation (the highest) between MaxN of the stereo-BRUVs and the NASCBRUV-mean in the water column when 40 m closer to the bottom was excluded. Although the presence of pelagic species in the recordings of the stereo-BRUVs is not unusual [13], the field of view in the demersal stereo-BRUVs will not sample waters more than a few meters above the seafloor. Therefore, one of the possible explanations for this correlation would be that the high productivity in the surface might be related to schools of midwater fishes such as Sphyraena obtusata and pelagic species such as Sarda orientalis, which were observed on the stereo-BRUV videos. However, it is also possible that the observed correlations between acoustic variables and BRUV-derived data could have been anomalies. Further experiments are required to determine whether this is a real effect or not.
In CS, higher levels of acoustic biomass were mostly concentrated in pelagic schools located in the slope of the study area. In the NMP, on the other hand, hotspots of biomass were found in different areas of the study site with smaller schools occurring at different levels of the water column. These results are in accordance with the literature, which suggests that temperate reef fishes are more likely to form dense schools than tropical ones [48]. Higher levels of diversity are normally observed in tropical areas compared with temperate ones, as was observed by the higher richness of species observed in NMP, but also a wider range of lengths in the species recorded [49]. Considering the wider range of species dominated by larger-bodied fishes in the NMP, the movement in some individuals between days might have a disproportionate effect in reducing the correlation between the acoustics and the stereo-BRUVs; therefore, it is recommended that acoustic and video recording be conducted as close as possible in time.

4.3. Limitations of the Study

4.3.1. Cockburn Sound

A point of concern in the results of the CS experiment was the timing between the acoustic survey and the deployment of the stereo-BRUVs. Due to an unexpected delay in the sampling, the deployment of half of the stereo-BRUVs was conducted before the acoustic survey. In the rest of the sampling stations in CS and the totality of the NMP area, the acoustic survey was conducted before the deployment of the stereo-BRUVs. The response of fish to baited equipment can be species specific and affected by a number of factors, including individual response time, feeding behaviors, local currents, schooling behavior, and propagation of the bait plume [50,51]; thus soak time is a factor in the numbers of fishes present at any given time. Similarly, after the stereo-BRUVs have been retrieved, there may be a period where species abundance is affected by the prior presence of the bait and the remaining bait plume. As a result, when the acoustic transects were conducted post-stereo-BRUV deployment, a minimum time of 1 h was allowed before the transect commenced to minimize any bias. However, the persistence of the bait attraction effect in the water column has not been well studied. A separate experiment needs to be considered to investigate the effect of the bait in the water column, which might last longer than an hour, increasing the correlation with the acoustic data in those sampling points.

4.3.2. Ningaloo Marine Park

Higher sea states during sampling at the NMP meant that the echograms presented high levels of noise, and in addition, a long pulse length was used for the deeper areas. The use of long pulse lengths can help to increase the signal-to-noise ratio (SNR; Godlewska [52]), and the probability of detection targets, at the cost of losing vertical resolution [17]. Therefore, the use of long pulse lengths can lead to underestimations of single targets, and for that reason, only depth-stratified NASC, which is less affected by long pulse lengths [52], was used for the NMP study site.
Considering the results from the experiment conducted in CS, it was expected that 8 stereo-BRUVs in each benthic habitat would be sufficient to detect differences in the MaxN, and 15 for NASC with a 0.8 power. However, the higher variability in relative biomass and abundance observed in the NMP indicated that a larger sample was needed to achieve similar levels of power. This variability may be one explanation for the low correlations observed between the acoustics and the stereo-BRUVs.

4.3.3. Singlebeam Echosounder vs. Stereo-BRUVs

The two different methods used in the present study have their own limitations and bias in the portion of the fish they can sample [31,53]. For instance, the stereo-BRUVs are located on the seafloor with a field of view limited to a few meters above the bottom [54]. The presence of pelagic species is not uncommon, but schooling pelagic species are not usually observed in the stereo-BRUVs [13]. The echosounders, on the other hand, cannot get reliable measurements in an area closer to the surface (near field), so a couple of meters have to be excluded. Additionally, the geometry of the beam of the echosounder produces a blind area closer to the bottom known as the acoustic dead zone (ADZ). The size of the ADZ will variate depending on the depth, pulse length (increasing as the pulse length increases), and speed of sound in water [55]. Therefore, the area closer to the bottom might not be available to be sampled by the echosounder, while the stereo-BRUVs are very efficient in sampling that area. The algorithm used to separate fish from zooplankton, and fluidlike organisms in the acoustic data [35], excludes species that do not have a swim bladder, while the stereo-BRUVs can efficiently be used to measure all the species in the field of view of both cameras. Splitting the species by morphology is an option that was not explored in the present study, but it could improve the relationship between the two data sets in particular for the NMP, as in the CS area, almost all the recorded species had a swim bladder.

5. Conclusions

The results of this study showed a significant correlation between the acoustic data and the relative biomass recorded by the stereo-BRUVs, in particular, with the number of acoustic targets and biomass in the CS area when the acoustic data are considered “without schools”. This suggests that, for rocky reef temperate areas, combining both methods to estimate spatial patterns of demersal fish biomass improves our understanding of the community distribution, supporting the original hypothesis of this study. However, this strong relationship was not observed in the NMP, where the correlations between the demersal layers of the acoustic data and the stereo-BRUVs were weak. Although the results showed significant relationships between the acoustic biomass in superficial layers of the water column and the stereo-BRUVs, our results suggest that the ecosystem is highly variable, and we recommend reducing the time gap in the collection of the two data sets. Future directions for this research include: (1) increasing the area covered with the echosounder and the number of sampling points for the stereo-BRUVs to increase the power of hypothesis testing and (2) using pelagic stereo-BRUVs to test whether they elucidate the species present in the water column that are not recorded by the demersal stereo-BRUVs.

Supplementary Materials

The following are available online at https://www.mdpi.com/article/10.3390/jmse10010052/s1: Figure S1. (a) Three echosounders were mounted in a pontoon, (b) pontoon being towed on the side of the vessel. (c) One of the Stereo-BRUVS used in the experiments. Figure S2. The three echosounders mounted in the pontoon and the GPS antenna in the center, towed by the vessel. Figure S3. (a) Correlations between the NASCBRUV-mean and relative biomass recorded by the stereo-BRUVS, and (b) NASCBRUV-mean without schools and relative biomass at different radii of search around the stereo-BRUVS and depth layers. Figure S4. Correlations between the NASCBRUV-mean and the relative biomass (left) and MaxN (right) from the stereo-BRUVS using different radii of search around the stereo-BRUV and including different layers of the water column. Layer 0 represents the interval 0.5–5.5 m above the seafloor. Figure S5. Correlations between the abundance (MaxN) from the stereo-BRUVS and the NASCBRUV-mean using different radii of search around the stereo-BRUVS and including different layers of the water column starting from the surface (left). Layer 0 represents the interval 0.5–5.5 m above the seafloor. Figure S6. Correlation between the NASCBRUV-mean and the relative biomass from the stereo-BRUVS excluding the sharks and rays using different radii of search around the stereo-BRUV and including different layers of the water column starting from the bottom (left) and top (right).

Author Contributions

Conceptualization, M.M.L.F., M.J.G.P., B.J.S. and I.M.P.; methodology, M.M.L.F., M.J.G.P., B.J.S. and I.M.P.; software, M.M.L.F., M.J.G.P. and B.J.S.; validation, M.M.L.F., M.J.G.P., B.J.S. and I.M.P.; formal analysis, M.M.L.F., B.J.S. and I.M.P.; investigation, M.M.L.F., M.J.G.P., B.J.S. and I.M.P.; resources, M.J.G.P., B.J.S. and I.M.P.; writing—original draft preparation, M.M.L.F.; writing—review and editing, M.M.L.F., M.J.G.P., B.J.S. and I.M.P.; visualization, M.M.L.F. and I.M.P.; supervision, M.J.G.P., B.J.S. and I.M.P.; project administration, M.M.L.F., M.J.G.P., B.J.S. and I.M.P.; funding acquisition, M.M.L.F., M.J.G.P., B.J.S. and I.M.P. All authors have read and agreed to the published version of the manuscript.

Funding

This project was partially funded by the Australian Acoustical Society Education Grant 2015.

Institutional Review Board Statement

The research study received animal ethics approval from the Curtin University Animal Ethics Committee, sonar monitoring of marine animals from a vessel: AEC2013_26, and baited remote underwater stereo-video: AEC_2014_09.

Informed Consent Statement

Not applicable.

Data Availability Statement

The data presented in this study will be openly available in a repository.

Conflicts of Interest

The authors declare no conflict of interest.

References

  1. Goldman, B.; Talbot, F.H.; Jones, O.; Endean, R. Aspects of the ecology of coral reef fishes. Biol. Geol. Coral Reefs 1976, 3, 125–154. [Google Scholar]
  2. Cole, A.J.; Pratchett, M.S.; Jones, G.P. Diversity and functional importance of coral-feeding fishes on tropical coral reefs. Fish Fish. 2008, 9, 286–307. [Google Scholar] [CrossRef]
  3. Reaka-Kudla, M.L. The global biodiversity of coral reefs: A comparison with rain forests. Biodivers. II Unders. Prot. our Biol. Resour. 1997, 2, 551. [Google Scholar]
  4. Veron, J.E.N.; Hoegh-Guldberg, O.; Lenton, T.M.; Lough, J.M.; Obura, D.O.; Pearce-Kelly, P.; Sheppard, C.R.C.; Spalding, M.; Stafford-Smith, M.G.; Rogers, A.D. The coral reef crisis: The critical importance of. Mar. Pollut. Bull. 2009, 58, 1428–1436. [Google Scholar] [CrossRef] [PubMed]
  5. Friedlander, A.M.; Brown, E.K.; Jokiel, P.L.; Smith, W.R.; Rodgers, K.S. Effects of habitat, wave exposure, and marine protected area status on coral reef fish assemblages in the Hawaiian archipelago. Coral Reefs 2003, 22, 291–305. [Google Scholar] [CrossRef]
  6. Mora, C.; Andrèfouët, S.; Costello, M.J.; Kranenburg, C.; Rollo, A.; Veron, J.; Gaston, K.J.; Myers, R.A. Coral Reefs and the Global Network of Marine Protected Areas. Science 2006, 312, 1750–1751. [Google Scholar] [CrossRef] [PubMed]
  7. McClanahan, T.R.; Marnane, M.J.; Cinner, J.E.; Kiene, W.E. A Comparison of Marine Protected Areas and Alternative Approaches to Coral-Reef Management. Curr. Biol. 2006, 16, 1408–1413. [Google Scholar] [CrossRef] [Green Version]
  8. Logan, J.M.; Young, M.A.; Harvey, E.S.; Schimel, A.C.G.; Ierodiaconou, D. Combining underwater video methods improves effectiveness of demersal fish assemblage surveys across habitats. Mar. Ecol. Prog. Ser. 2017, 582, 181–200. [Google Scholar] [CrossRef]
  9. Cappo, M.; Harvey, E.; Malcolm, H.; Speare, P. Potential of video techniques to monitor diversity, abundance and size of fish in studies of marine protected areas. Aquat. Prot. Areas What Works Best How Do We Know 2003, 1, 455–464. [Google Scholar]
  10. Zenone, A.M.; Burkepile, D.E.; Boswell, K.M. A comparison of diver vs. acoustic methodologies for surveying fishes in a shallow water coral reef ecosystem. Fish. Res. 2017, 189, 62–66. [Google Scholar] [CrossRef]
  11. Reighard, J. The Photography of Aquatic Animals in Their Natural Environment; US Government Printing Office: Michigan, MI, USA, 1908.
  12. Pelletier, D.; Leleu, K.; Mou-Tham, G.; Guillemot, N.; Chabanet, P. Comparison of visual census and high definition video transects for monitoring coral reef fish assemblages. Fish. Res. 2011, 107, 84–93. [Google Scholar] [CrossRef] [Green Version]
  13. Cappo, M.; Speare, P.; De’ath, G. Comparison of baited remote underwater video stations (BRUVS) and prawn (shrimp) trawls for assessments of fish biodiversity in inter-reefal areas of the Great Barrier Reef Marine Park. J. Exp. Mar. Biol. Ecol. 2004, 302, 123–152. [Google Scholar] [CrossRef]
  14. Ellis, D.M.; Demartini, E.E. Evaluation of a video camera technique for indexing abundances of juvenile pink snapper, Pristimomoides filamentosus, and other Hawaiian insular shelf fishes. Fish. Bull. 1995, 93, 67–77. [Google Scholar]
  15. Davison, P.C.; Koslow, J.A.; Kloser, R.J. Acoustic biomass estimation of mesopelagic fish: Backscattering from individuals, populations, and communities. ICES J. Mar. Sci. 2015, 72, 1413–1424. [Google Scholar] [CrossRef] [Green Version]
  16. Kloser, R.J.; Ryan, T.E.; Tuck, G.N.; Geen, G. Influence on management advice of fishers acoustics-10 year review of blue grenadier monitoring. Fish. Res. 2016, 178, 82–92. [Google Scholar] [CrossRef]
  17. Simmonds, J.; MacLennan, D.N. Fisheries Acoustics: Theory and Practice; Blackwell Science: Oxford, UK, 2008. [Google Scholar]
  18. Koslow, J.A. The role of acoustics in ecosystem-based fishery management. ICES J. Mar. Sci. 2009, 66, 966–973. [Google Scholar] [CrossRef]
  19. Godø, O.R. Technology Answers to the Requirements Set by the Ecosystem Approach; Springer: Dordrecht, The Netherlands, 2009; Volume 31, pp. 373–403. [Google Scholar]
  20. Boswell, K.M.; Wells, R.J.D.; Cowan, J.H., Jr.; Wilson, C.A. Biomass, density, and size distribution of fishes associated with a large-scale artificial reef complex in the Gulf of Mexico. Bull. Mar. Sci. 2010, 86, 879–889. [Google Scholar] [CrossRef] [Green Version]
  21. Costa, B.; Taylor, J.C.; Kracker, L.; Battista, T.; Pittman, S. Mapping Reef Fish and the Seascape: Using Acoustics and Spatial Modeling to Guide Coastal Management. PLoS ONE 2014, 9, e85555. [Google Scholar] [CrossRef] [Green Version]
  22. Campanella, F.; Taylor, J.C. Investigating acoustic diversity of fish aggregations in coral reef ecosystems from multifrequency fishery sonar surveys. Fish. Res. 2016, 181, 63–76. [Google Scholar] [CrossRef]
  23. Vanderklift, M.; Jacoby, C. Patterns in fish assemblages 25 years after major seagrass loss. Mar. Ecol. Prog. Ser. 2003, 247, 225–235. [Google Scholar] [CrossRef]
  24. Cockburn Sound Management Council. Benthic Habitat mapping of the Eastern Shelf of Cockburn Sound.; Cockburn Sound Management Council: Perth, Australia, 2004. [Google Scholar]
  25. Waples, K.; Hollander, E. Ningaloo Research Progress Report: Discovering Ningaloo–Latest Findings and Their Implications for Management; Ningaloo Research Coordinating Committee. Department of Environment and Conservation: Perth, Australia, 2008; p. 114. [Google Scholar]
  26. Rees, M.; Heyward, A.; Cappo, M.; Speare, P.; Smith, L. Ningaloo Marine Park-Initial Survey of Seabed Biodiversity in Intermediate and Deeper Waters (04); Australian Government, Australian Institute of Marine Science and Natural Heritage Trust: Townsville, Australia, 2004. [Google Scholar]
  27. Foster-Smith, R.L.; Sotheran, I.S. Mapping marine benthic biotopes using acoustic ground discrimination systems. Int. J. Remote Sens. 2003, 24, 2761–2784. [Google Scholar] [CrossRef]
  28. Siwabessy, P.J.W. An Investigation of the Relationship between Seabed Type and Benthic and Bentho-Pelagic Biota Using Acoustic Techniques. Ph.D. Thesis, Curtin University, Singapore, 2001. [Google Scholar]
  29. Harvey, E.S.; Butler, J.J.; McLean, D.L.; Shand, J. Contrasting habitat use of diurnal and nocturnal fish assemblages in temperate Western Australia. J. Exp. Mar. Biol. Ecol. 2012, 426, 78–86. [Google Scholar] [CrossRef]
  30. Foote, K.G. Fish target strengths for use in echo integrator surveys. J. Acous. Soc. Am. 1987, 82, 981–987. [Google Scholar] [CrossRef] [Green Version]
  31. Harvey, E.S.; Cappo, M.; Butler, J.J.; Hall, N.; Kendrick, G.A. Bait attraction affects the performance of remote underwater video stations in assessment of demersal fish community structure. Mar. Ecol. Prog. Ser. 2007, 350, 245–254. [Google Scholar] [CrossRef] [Green Version]
  32. Watson, D.L.; Harvey, E.S.; Kendrick, G.A.; Nardi, K.; Anderson, M.J. Protection from fishing alters the species composition of fish assemblages in a temperate-tropical transition zone. Mar. Biol. 2007, 152, 1197–1206. [Google Scholar] [CrossRef]
  33. De Robertis, A.; Higginbottom, I. A post-processing technique to estimate the signal-to-noise ratio and remove echosounder background noise. ICES J. Mar. Sci. 2007, 64, 1282–1291. [Google Scholar] [CrossRef] [Green Version]
  34. Ryan, T.E.; Downie, R.A.; Kloser, R.J.; Keith, G. Reducing bias due to noise and attenuation in open-ocean echo integration data. ICES J. Mar. Sci. 2015, 72, 2482–2493. [Google Scholar] [CrossRef] [Green Version]
  35. Ballon, M.; Bertrand, A.; Lebourges-Dhaussy, A.; Gutierrez, M.; Ayon, P.; Grados, D.; Gerlotto, F. Is there enough zooplankton to feed forage fish populations off Peru? An acoustic (positive) answer. Prog. Oceanog. 2011, 91, 360–381. [Google Scholar] [CrossRef]
  36. Parker-Stetter, S.L. Standard Operating Procedures for Fisheries Acoustic Surveys in the Great Lakes. 2009. Available online: https://www.semanticscholar.org/paper/STANDARD-OPERATING-PROCEDURES-FOR-FISHERIES-SURVEYS-Parker-Stetter-Rudstam/b6d36eab972e5456cf3720a18d310c1f3128f669 (accessed on 3 November 2021).
  37. Coetzee, J. Use of a shoal analysis and patch estimation system (SHAPES) to characterise sardine schools. Aquat. Living Resour. 2000, 13, 1–10. [Google Scholar] [CrossRef]
  38. R Development Core Team, R. A Language and Environment for Statistical Computing; R Foundation for Statistical Computing: Vienna, Austria, 2017. [Google Scholar]
  39. SeaGIS. EventMeasure-Event Logging & 3D Measurement; SeaGIS, Pty. LTd.: Victoria, Australia, 2011. [Google Scholar]
  40. Froese, R.; Pauly, D. FishBase World Wide Web Electronic Publication. Available online: http://www.fishbase.org (accessed on 8 August 2021).
  41. Thrush, S.; Pridmore, R.; Hewitt, J.; Cummings, V. Impact of ray feeding disturbances on sandflat macrobenthos: Do communities dominated by polychaetes or shellfish respond differently? Mar. Ecol. Prog. Ser. Oldend. 1991, 69, 245–252. [Google Scholar] [CrossRef]
  42. Santana-Garcon, J.; Newman, S.J.; Harvey, E.S. Development and validation of a mid-water baited stereo-video technique for investigating pelagic fish assemblages. J. Exp. Mar. Biol. Ecol. 2014, 452, 82–90. [Google Scholar] [CrossRef]
  43. Fitzpatrick, B.M.; Harvey, E.S.; Heyward, A.J.; Twiggs, E.J.; Colquhoun, J. Habitat Specialization in Tropical Continental Shelf Demersal Fish Assemblages. PLoS ONE 2012, 7, e39634. [Google Scholar] [CrossRef] [PubMed] [Green Version]
  44. Monk, J.; Ierodiaconou, D.; Bellgrove, A.; Harvey, E.; Laurenson, L. Remotely sensed hydroacoustics and observation data for predicting fish habitat suitability. Cont. Shelf Res. 2011, 31, S17–S27. [Google Scholar] [CrossRef]
  45. Landero Figueroa, M.M.; Parsons, M.J.G.; Saunders, B.J.; Radford, B.; Salgado-Kent, C.; Parnum, I.M. The use of singlebeam echo-sounder depth data to produce demersal fish distribution models that are comparable to models produced using multibeam echo-sounder depth. Ecol. Evolut. 2021. [Google Scholar] [CrossRef]
  46. Randall, J.E. Food habits of reef fishes of the West Indies. Stud. Trop. Oceanogr. 1967, 5, 665–847. [Google Scholar]
  47. Landero Figueroa, M.M.; Parsons, M.J.G.; Saunders, B.J.; Radford, B.; Parnum, I.M. Testing the Improvement of Coral Reef Associated Fish Distribution Models Based on Multibeam Bathymetry by Adding Seafloor Backscatter Data. Front. Mar. Sci. 2021, 8. [Google Scholar] [CrossRef]
  48. Ebeling, A.W.; Hixon, M.A. Tropical and temperate reef fishes: Comparison of community structures. In The Ecology of Fishes on Coral Reefs; Sale, P.F., Ed.; Academic Press: San Diego, CA, USA, 1991; pp. 509–563. [Google Scholar]
  49. Holmes, T.H.; Wilson, S.K.; Travers, M.J.; Langlois, T.J.; Evans, R.D.; Moore, G.I.; Douglas, R.A.; Shedrawi, G.; Harvey, E.S.; Hickey, K. A comparison of visual- and stereo-video based fish community assessment methods in tropical and temperate marine waters of Western Australia. Limnol. Oceanog. Methods 2013, 11, 337–350. [Google Scholar] [CrossRef]
  50. Sheaves, M.J. Effect of design modifications and soak time variations on Antillean-Z fish trap performance in a tropical estuary. Bull. Mar. Sci. 1995, 56, 475–489. [Google Scholar]
  51. Cappo, M.; Harvey, E.; Shortis, M. Counting and measuring fish with baited video techniques-an overview. In Proceedings of the Australian Society for Fish Biology Workshop Proceedings, Bunbury, Western Australia, 23–24 September 2001; pp. 101–114. [Google Scholar]
  52. Godlewska, M.; Colon, M.; Jozwik, A.; Guillard, J. How pulse lengths impact fish stock estimations during hydroacoustic measurements at 70 kHz. Aquat. Living Resour. 2011, 24, 71–78. [Google Scholar] [CrossRef] [Green Version]
  53. Lawson, G.L.; Rose, G.A. The importance of detectability to acoustic surveys of semi-demersal fish. ICES J. Mar. Sci. 1999, 56, 370–380. [Google Scholar] [CrossRef] [Green Version]
  54. Harvey, E.; Fletcher, D.; Shortis, M. Estimation of reef fish length by divers and by stereo-video—A first comparison of the accuracy and precision in the field on living fish under operational conditions. Fish. Res. 2002, 57, 255–265. [Google Scholar] [CrossRef]
  55. Ona, E.; Mitson, R.B. Acoustic sampling and signal processing near the seabed: The deadzone revisited. ICES J. Mar. Sci. 1996, 53, 677–690. [Google Scholar] [CrossRef]
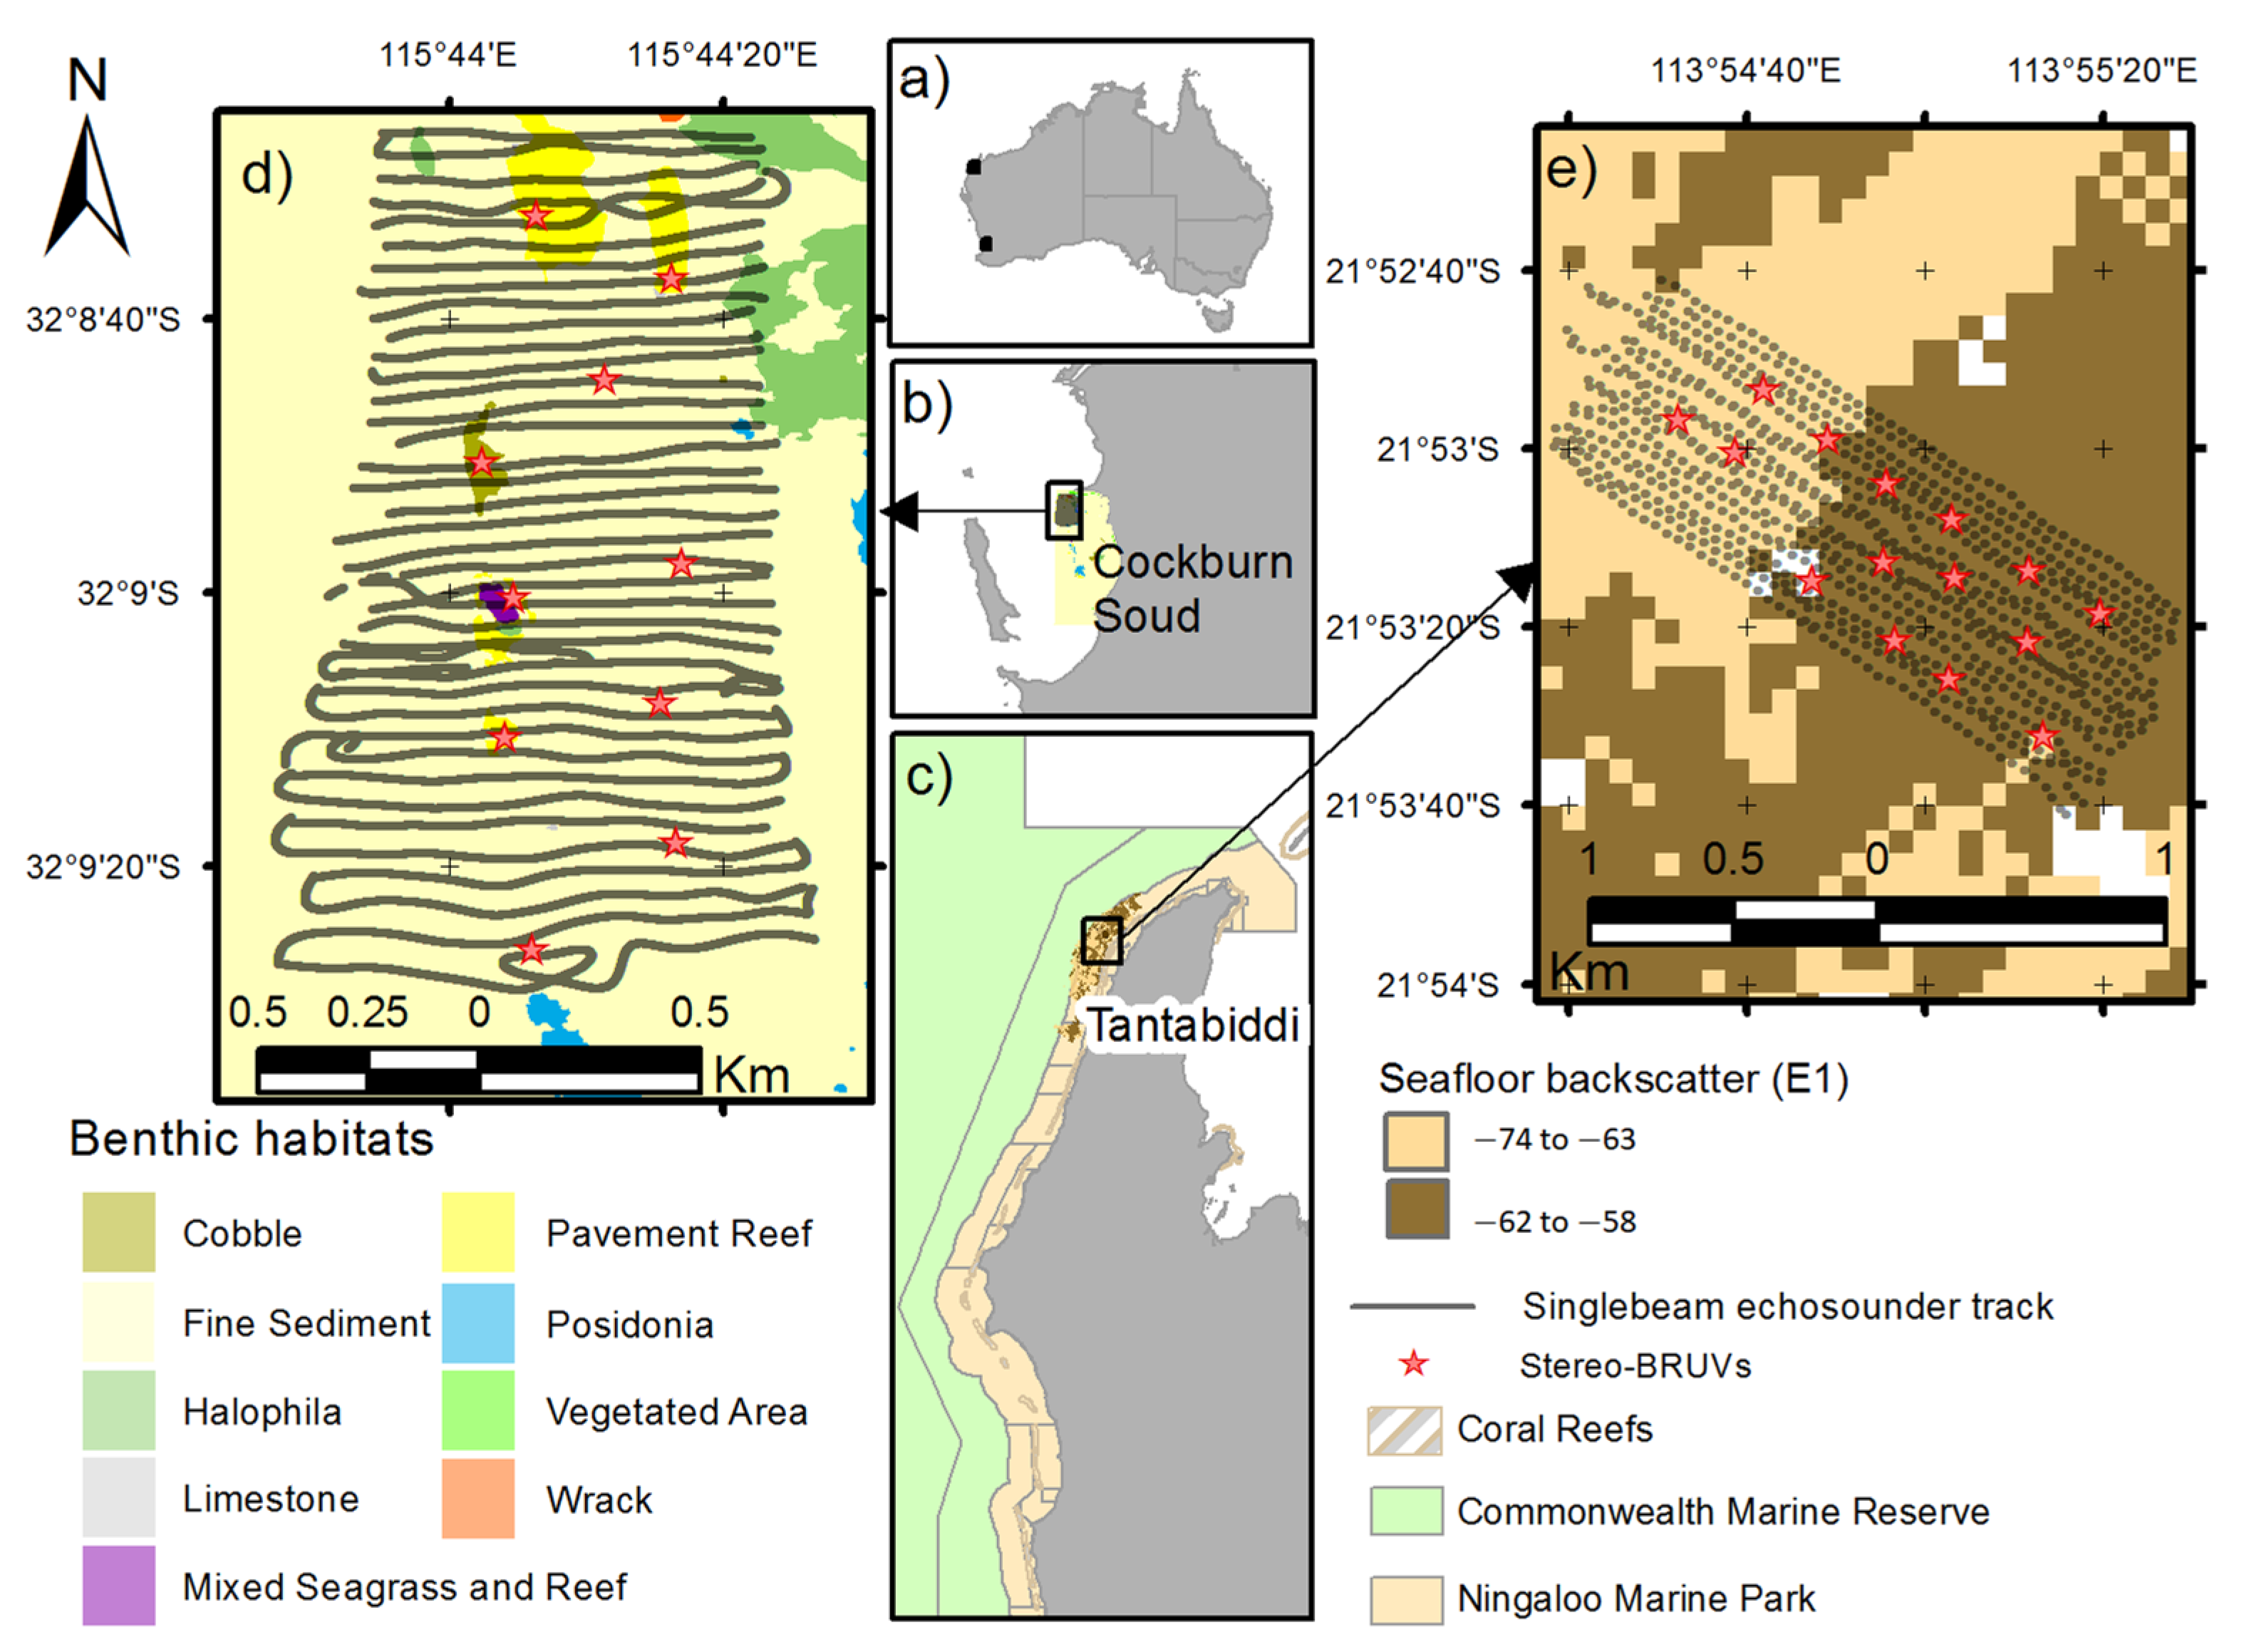
Figure 1. (a) Map of Australia with black dots signaling the two study sites. (b) Expansion of the Cockburn Sound area. (c) Expansion of the study site within the marine park. Details of the singlebeam echosounder track (back dots) and stereo-BRUV sites of deployment (red stars) are shown for (d) the Cockburn Sound area and (e) the Ningaloo Marine Park.
Jmse 10 00052 g001
Figure 2. Example of the extraction of acoustic data to be compared with the stereo-BRUV data. (a) Sv mean echogram where the acoustic energy was exported using a grid with intervals of 50 m long and 5 m deep layers. Each interval is represented on the left panel (b) as a blue dot. (b) Different radii of search around the stereo-BRUVs were used to extract the acoustic data, and a 50 m radius is shown as an example.
Jmse 10 00052 g002
Figure 3. (a) Depth-stratified acoustic NASC showed as graduated circles laid over the benthic habitats following the classification specified in Figure 1. (b) Depth-stratified acoustic NASC showed as graduated circles with isobaths shown in the background. (c) Total number of acoustic targets in the water column (green) and in the demersal layer (purple) shown as graduated circles with isobaths shown as discontinuous lines. (d) Relative biomass and abundance (MaxN) from the stereo-BRUVs shown as graduated circles laid over the benthic habitat map. (e) Relative biomass and abundance (MaxN) from the stereo-BRUVs shown as graduated circles with the isobaths shown as discontinuous lines.
Jmse 10 00052 g003
Figure 4. Correlations between (a) the relative biomass from stereo-BRUVs (kg) and the acoustic NASCBRUV-mean no schools using a radius of 300 m around the stereo-BRUVs and summing three layers (0.5 to 15.5 m) above the seafloor, (b) acoustic targets and relative biomass (kg) from the stereo-BRUVs with 300 m radius of search including only two layers (0.5–10.5 m) above the seafloor. The standard errors are shown as error bars. A linear regression with 95% confidence intervals is shown as a blue line with a grey band.
Jmse 10 00052 g004
Figure 5. Correlations between (a) the relative biomass without rays from the stereo-BRUVs and the acoustic NASCBRUV-mean no schools using a 250 m radius of search around the stereo-BRUVs and including 10.5 m above the seafloor, (b) relative biomass without rays from the stereo-BRUVs and acoustic targets using a 400 radius of search around the stereo-BRUVs and including 10.5 m above the seafloor. The standard errors are shown as error bars. A linear regression with 95% confidence intervals is shown as a blue line with a grey band.
Jmse 10 00052 g005
Figure 6. Box plot of the (a) relative abundance from the stereo-BRUVs (MaxN), (b) relative biomass from the stereo-BRUVs (kg), (c) acoustic NASCBRUV-mean, (d) acoustic NASCBRUV-mean no schools, and (e) acoustic targets grouped by benthic habitat class.
Jmse 10 00052 g006
Figure 7. (a) Depth-stratified acoustic NASC shown as graduated circles laid over the acoustic classification of the seafloor. (b) Depth-stratified acoustic NASC shown as graduated circles with isobaths shown in the background. (c) Relative biomass and abundance (MaxN) from the stereo-BRUVs shown as graduated circles laid over the acoustic classification of the seafloor. (d) Relative biomass and abundance (MaxN) from the stereo-BRUVs shown as graduated circles with the isobaths shown as discontinuous lines.
Jmse 10 00052 g007
Figure 8. (a) Correlation between the relative abundance from the stereo-BRUVs (MaxN) and the acoustic NASCBRUV-mean using a radius of search of 250 m and excluding 40.5 m closer to the bottom, where the number of acoustic samples (intervals) considered in the calculation of the NASCBRUV-mean and the standard error are shown. A linear regression with 95% confidence intervals is shown as a blue line with a grey band. (b) Spatial distribution of the acoustic depth-stratified NASC excluding 40.5 m closer to the bottom with the relative abundance from the stereo-BRUVs (MaxN) plotted as graduated circles.
Jmse 10 00052 g008
Figure 9. Benthic habitats present in the sampling points. (a) Classification of the benthic habitats based on the stereo-BRUV data over the seafloor backscatter. (b) Example of the bottoms classified as “Sand”. (c) Example of benthic habitat classified as “Reef” in the experiment at the Ningaloo Marine Park.
Jmse 10 00052 g009
Figure 10. Box plots of the (a) relative abundance from the stereo-BRUVs (MaxN), (b) relative biomass (kg) from the stereo-BRUVs, (c) acoustic NASCBRUV-mean, and (d) acoustic NASCBRUV-mean no schools, grouped by benthic habitat observed in the videos.
Jmse 10 00052 g010
Figure 11. Box plots of the acoustic variables (a) NASCBRUV-mean and (b) NASCBRUV-mean without schools grouped by benthic habitat observed in the video, excluding 40.5 m of water column above the seafloor.
Jmse 10 00052 g011
Table 1. Settings of the transducers mounted in the pontoon for the two areas included in the study.
FrequencyBeam WidthNMPCockburn Sound
Pulse LengthPing RatePulse LengthPing Rate
(kHz)(°)(ms)(Pings s−1)(ms)(Pings s−1)
389.80.81.90.39.2
1207.80.51.90.29.2
4206.80.51.90.19.2
Table 2. Summary of the main variables measured in Cockburn Sound and Ningaloo Marine Park, including acoustic NASC and relative biomass (kg) and abundance (MaxN) from the stereo-BRUVs.
Study SiteDepthBenthic HabitatsAcousticsStereo-BRUVs
MinMaxNASC Biomass (kg)MaxN
MinMaxMinMaxMinMax
Cockburn Sound717Fine sediment/rocky reef/seagrass0–1886130–16,3954–835–7035–42130–150
Ningaloo Marine Park6090Bare sand/soft corals/sponges0–1794385–13,28813–30200–55918–2296–135
Table 3. Results of the Wilcox test comparing the relative biomass, relative abundance (MaxN) of the stereo-BRUVs and acoustic NASCBRUV-mean, NASCBRUV-mean no schools, and number of targets between benthic habitat classes. Both acoustic and visual classifications are shown. Significant differences are shown in bold.
Benthic
Classification
MethodVariablePowerWp
Full water columnSoft/hard
n = 11; n = 4
Stereo-BRUVsMaxN0.8840.0220
Biomass0.19221.00
AcousticsNASC0.11300.34
NASCno0.11320.23
Targets0.38100.13
Sand/reef
n = 9; n = 6
Stereo-BRUVsMaxN0.8640.0078
Biomass0.30210.53
AcousticsNASC0.05340.46
NASCno0.04370.27
Targets0.05170.25
Water column excluding 40.5 m above the seafloor Soft/hard
n = 11; n = 4
AcousticsNASC0.462120.23
NASCno0.46120.23
Sand/reef
n = 9; n = 6
NASC0.209200.46
NASCno0.199200.46
Publisher’s Note: MDPI stays neutral with regard to jurisdictional claims in published maps and institutional affiliations.