Article

Two-Way Coupling Simulation of Solid-Liquid Two-Phase Flow and Wear Experiments in a Slurry Pump

1
Institute of Fluid Engineering Equipment, Jiangsu University, JITRI, Zhenjiang 212013, China
2
School of Energy and Power Engineering, Jiangsu University, Zhenjiang 212013, China
3
Henan Province Solid Waste and Chemical Technology Management Center, Zhengzhou 450004, China
4
Jiangsu Shentong Valve Co., Ltd., Nantong 226232, China
*
Authors to whom correspondence should be addressed.
J. Mar. Sci. Eng. 2022, 10(1), 57; https://doi.org/10.3390/jmse10010057
Submission received: 9 October 2021 / Revised: 8 December 2021 / Accepted: 15 December 2021 / Published: 4 January 2022
(This article belongs to the Special Issue Experiments and Numerical Analysis of Flow)

Abstract

:
The slurry pump is one of the most important pieces of equipment in mineral transportation and separation systems, and it has complex two-phase flow characteristics and wear mechanisms. By employing numerical and experimental methods, the solid–liquid two-phase flow characteristics and wear patterns were investigated in this study. A two-way coupling discrete phase model (DPM) method was used to predict the flow pattern and the wear location and shows good agreement with the experimental observations. The pump performance characteristics of numerical results under pure water conditions were consistent with the experimental results. The effects of particle parameters and operating conditions on the internal flow field and wear were compared and discussed. The results show that the wear degree increased with the increase in volume flow rate and solid volume fraction. With the increase in particle size, the wear range at the impeller inlet became significantly smaller, but the wear degree became obviously larger. This study provides a basis for reducing the wear and improving the hydraulic performance of slurry pumps.

1. Introduction

Marine minerals have the potential to become a new and important industry. As key equipment in the separation and transportation system of solid–liquid two-phase materials, slurry pumps are widely used in the mining industry and other fields. Slurry pumps also play an important role in channel dredging, coastal construction, and other fields of marine engineering [1,2,3,4]. The presence of solid particles directly leads to the prevalence of high energy consumption, severe wear of flow components, and poor operational reliability of solid–liquid slurry pumps [5,6,7,8]. Due to the complex mechanism of fluid, particle, and material, the design of solid–liquid slurry pumps is often based on a pure water condition and results in the slurry pump having low efficiency and a short service life. At present, the wear mechanisms and design methods of slurry pumps have not been fully grasped. Therefore, the in-depth study of two-phase flow and wear mechanism in solid–liquid slurry pumps to improve their efficiency and service life is the goal of many researchers in the world [9,10].
A large number of scholars have used experimental methods to study the wear in slurry pumps. Fan et al. [11] analyzed the worn impellers of slurry pumps by scanning electron microscopy, and they concluded that the wear mechanisms were different from each region. The amount of wear of the whole impeller and reduction of the blade thickness was obtained by 3000 h of wear tests. It was proposed that extending the service life of slurry pumps more likely required improving the wear resistance of the material. Bhupendra et al. [12] found that the amount of wear was less when the pump was operating in its highest efficiency points, and this implied a longer pump operating life. Kadambi et al. [13] measured the particle velocity in the impeller channel of a slurry pump by particle image velocimetry (PIV). The highest particle velocities were found to be generated on the suction side of the impeller and in the trailing edge region of the impeller. The particle fluctuation kinetic energy of particles at different speeds was compared to analyzing the wear mechanism inside the impeller of the slurry pump. Khalid et al. [14] found the weight losses of the impeller were caused by the impact of solid particles on the surface area. The area near the center of the impeller encountered less wear compared to the area at the edge of the impeller. Madadnia et al. [15] investigated the phenomenon of localized inhomogeneous wear in slurry pumps by using electron microscopy and numerical methods. The wear areas included the impeller inlet, inside and outside the impeller shroud, inside the pump body cover, and along the impeller outlet. With the rapid development of computer technology and theoretical mechanics, computational fluid dynamics (CFD) are becoming the most efficient methods to study solid–liquid flow mechanisms. Currently, the commonly used multiphase flow models include the Euler–Euler method and the Euler–Lagrange method. For the Euler–Euler method, Liao et al. [16] investigated the effect of particle diameter on the internal flow field and performance of centrifugal pumps by a two-phase particle flow model. The volume fraction distribution of sediment particles and the velocity distribution of sediment particles were analyzed at different sediment particle diameters. Liu et al. [17] used the mixture multiphase flow model to study the effect of transporting flow field and particle distribution in the impeller passage of a flue gas desulfurization system with limestone aqueous slurry. It was based on single particles of different concentrations and sizes. It was found that the particle distribution was more severely influenced by particle diameter than solid phase concentration. Wang et al. [18] used the Euler–Euler multiphase flow model to study the effect of particle concentration on the conveying performance of slurry pumps. The degradation of pump performance at high volume concentrations was mainly due to increased frictional losses and collisions between particles and between particles and impeller surfaces. Wadnerkar et al. [19] used the Eulerian–Eulerian model to simulate an agitated tank containing a solid–liquid mixture and investigated the turbulent energy and cloud height in the agitated tank. The presence of solid phase leads to a weakening of turbulence. The maximum deviation was observed in the impeller plane. Zhang et al. [20] used the mixture multiphase model to analyze the effect of particle diameter, volume concentration, and particle density on the hydraulic performance of a low specific speed centrifugal pump. As the particle diameter and solid phase concentration increased, the pump head and efficiency decreased. However, the effect of particle density on the external characteristics of the pump was smaller. Although the Eulerian–Eulerian model is simpler and easier to converge, the calculation cannot reflect the differences of particle density, size, shape, and other physical properties of the particles. Therefore, this model cannot fully and accurately reveal the state of motion, location of the particles, and degree of wear. In summary, the Eulerian–Eulerian model can only obtain the wear status indirectly through the solid volume fraction near the wall and the solid phase slip speed, but cannot obtain the wear status of the pump through the erosion model.
Erosion models based on CFD numerical simulation have become more and more widely used recently. One of the earliest erosion models is the Finnie erosion model [21], based on the hypothesis of micro-cutting theory, which believes that when the particle impact angle was low, the tube wall material deformed by cutting. However, the micro-cutting theory was more suitable for a low angle of attack conditions. Grant and Tabakoff [22] used the Monte Carlo method to simulate the erosion process of solid particles and liquid droplets in a turbomachine. The simulation only considered the drag force that determined the particle trajectory. By calculating the erosion caused by each collision, the model can predict the amount and location of material erosion. McLaury [23] fully considered the erosion caused by direct collisions and random collisions. A CFD-based general erosion prediction process was established and its applicability was verified in two-dimensional shapes, which is in good agreement with the experimental results. McLaury and Shirazi [24] established an erosion model for predicting the maximum permeability of the pipe wall based on CFD for pipes of different shapes. The model was based on a large amount of empirical data from Tulsa University, LSU, Harwell, and DNV for sand movement in multiphase flows. Chen et al. [25] added Grant and Tabakoff’s particle random rebound model to simulate the erosion severity of elbows and tees. The above wear model studies mainly focused on pipes, elbows, and tees, with less focus on the wear of pumps.
The discrete phase model (DPM) belongs to the Euler–Lagrange method, which is more suitable for particle track study and wear prediction. Pagalthivarthi et al. [26] used a two-dimensional model of the pump body with two-way coupling to obtain the dilute slurry flow field by combining the DPM with the standard k-ε model. The qualitative effects of these parameters on the erosion rate were investigated by varying the pump flow rate, rotating speed, particle diameter, and various geometric conditions. Li et al. [27] numerically simulated the solid–liquid two-phase turbulent flow by DPM method. The results showed that the particle diameter has a significant effect on the wear characteristics, and the wear could be reduced by reducing the exit blade angle. Noon et al. [28] performed a three-dimensional numerical analysis of wear in a slurry pump and found that the locations subject to the greatest wear were the tongue and passage of the volute. Shen et al. [29] used the DPM model to study the screw centrifugal pump that transported the solid–liquid two-phase flow of large particles. The wear distribution under the conditions of solid phase parameters with different density, particle sizes, and solid volume fractions was analyzed. The wear distribution of low-density particles was uniform, and the wear of high-density particles was concentrated. Shen et al. [30] analyzed the wear of a double-suction centrifugal slurry pump. By combining the analysis with the scanning electron microscope (SEM) images, the wear of the impeller blades at different locations was obtained. By comparing the wear distribution of numerical calculation with the experimental results, it was concluded that the DPM can be used to predict the wear of the pump. Zhu et al. [31] studied the effects of different turbulence models and rebound models on the wear of the three-stage electric submersible pump (ESP) through DPM. The difference between turbulence models was mainly due to the particle incidence angle and impact velocity. The effect of different rebound models can be ignored. Zhu et al. [32] also used numerical simulations and wear experiments to compare the accuracy of erosion models in CFD. The wear experiments were to calculate the average erosion rate by measuring the weight loss and verify it with the erosion model. It was concluded that the Oka erosion model had the highest accuracy in the ESP, but the computational resources were the most expensive. Jiang et al. [33] conducted numerical simulation and experimental research on the wear characteristics of centrifugal pumps with different solid volume fractions. Through the comparison of wear pictures and numerical simulation results, the accuracy of the numerical simulation was verified, and the energy gradient and particle motion were combined to explain the wear characteristics. However, only one-way coupling between solid–liquid phases were considered in these studies, which ignored the interaction of solid particles and the effects of particle motion on the flow field of the fluid phase.
Two-way coupling not only considers the effect of the flow field on the particle motion but also the effect of the particles on the flow field. In particular, continuous phase flow under the influence of particle motion was analyzed in this study to explain the effect of particles on the continuous phase. This study took a typical centrifugal slurry pump as the research object. The accuracy of the numerical simulation results was verified by experimental methods. The effects of particle parameters and operating conditions on the internal flow field and wear were compared and discussed.

2. Parameters and Methods

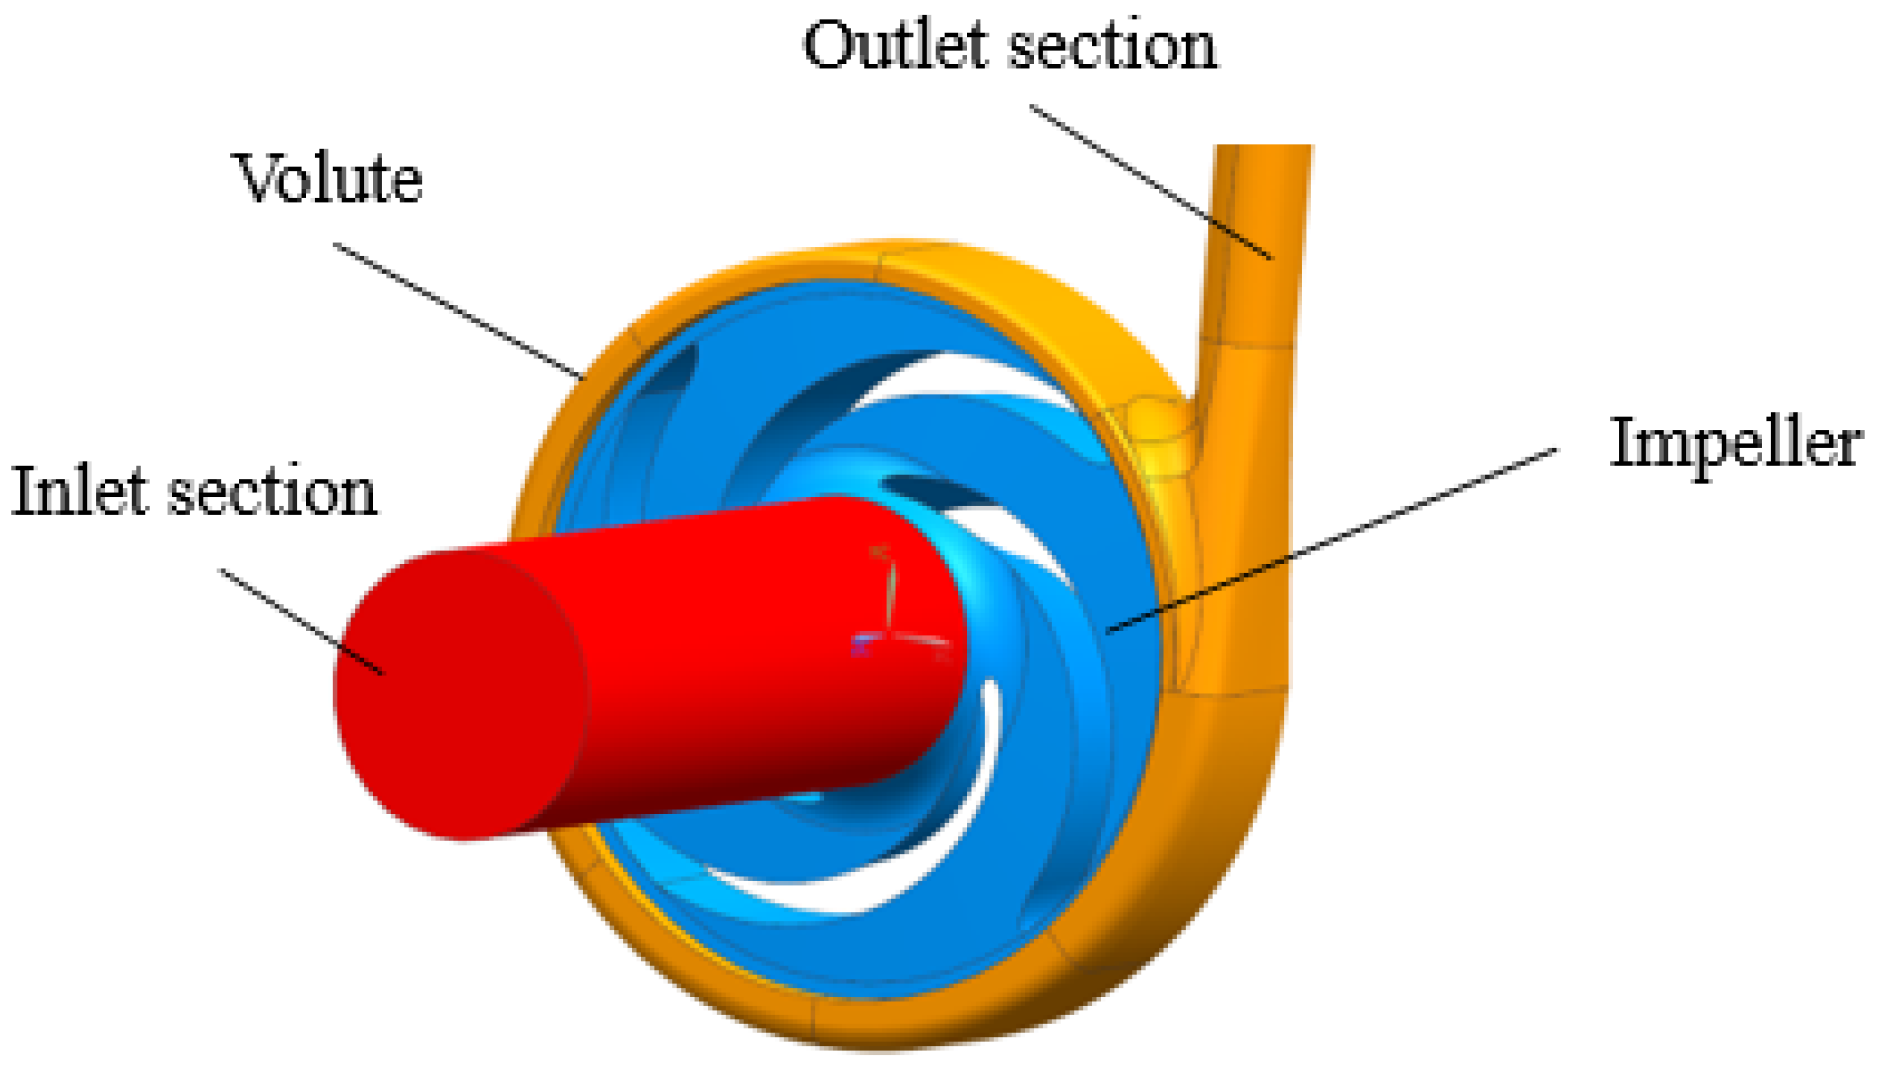
2.1. Geometry and Parameters
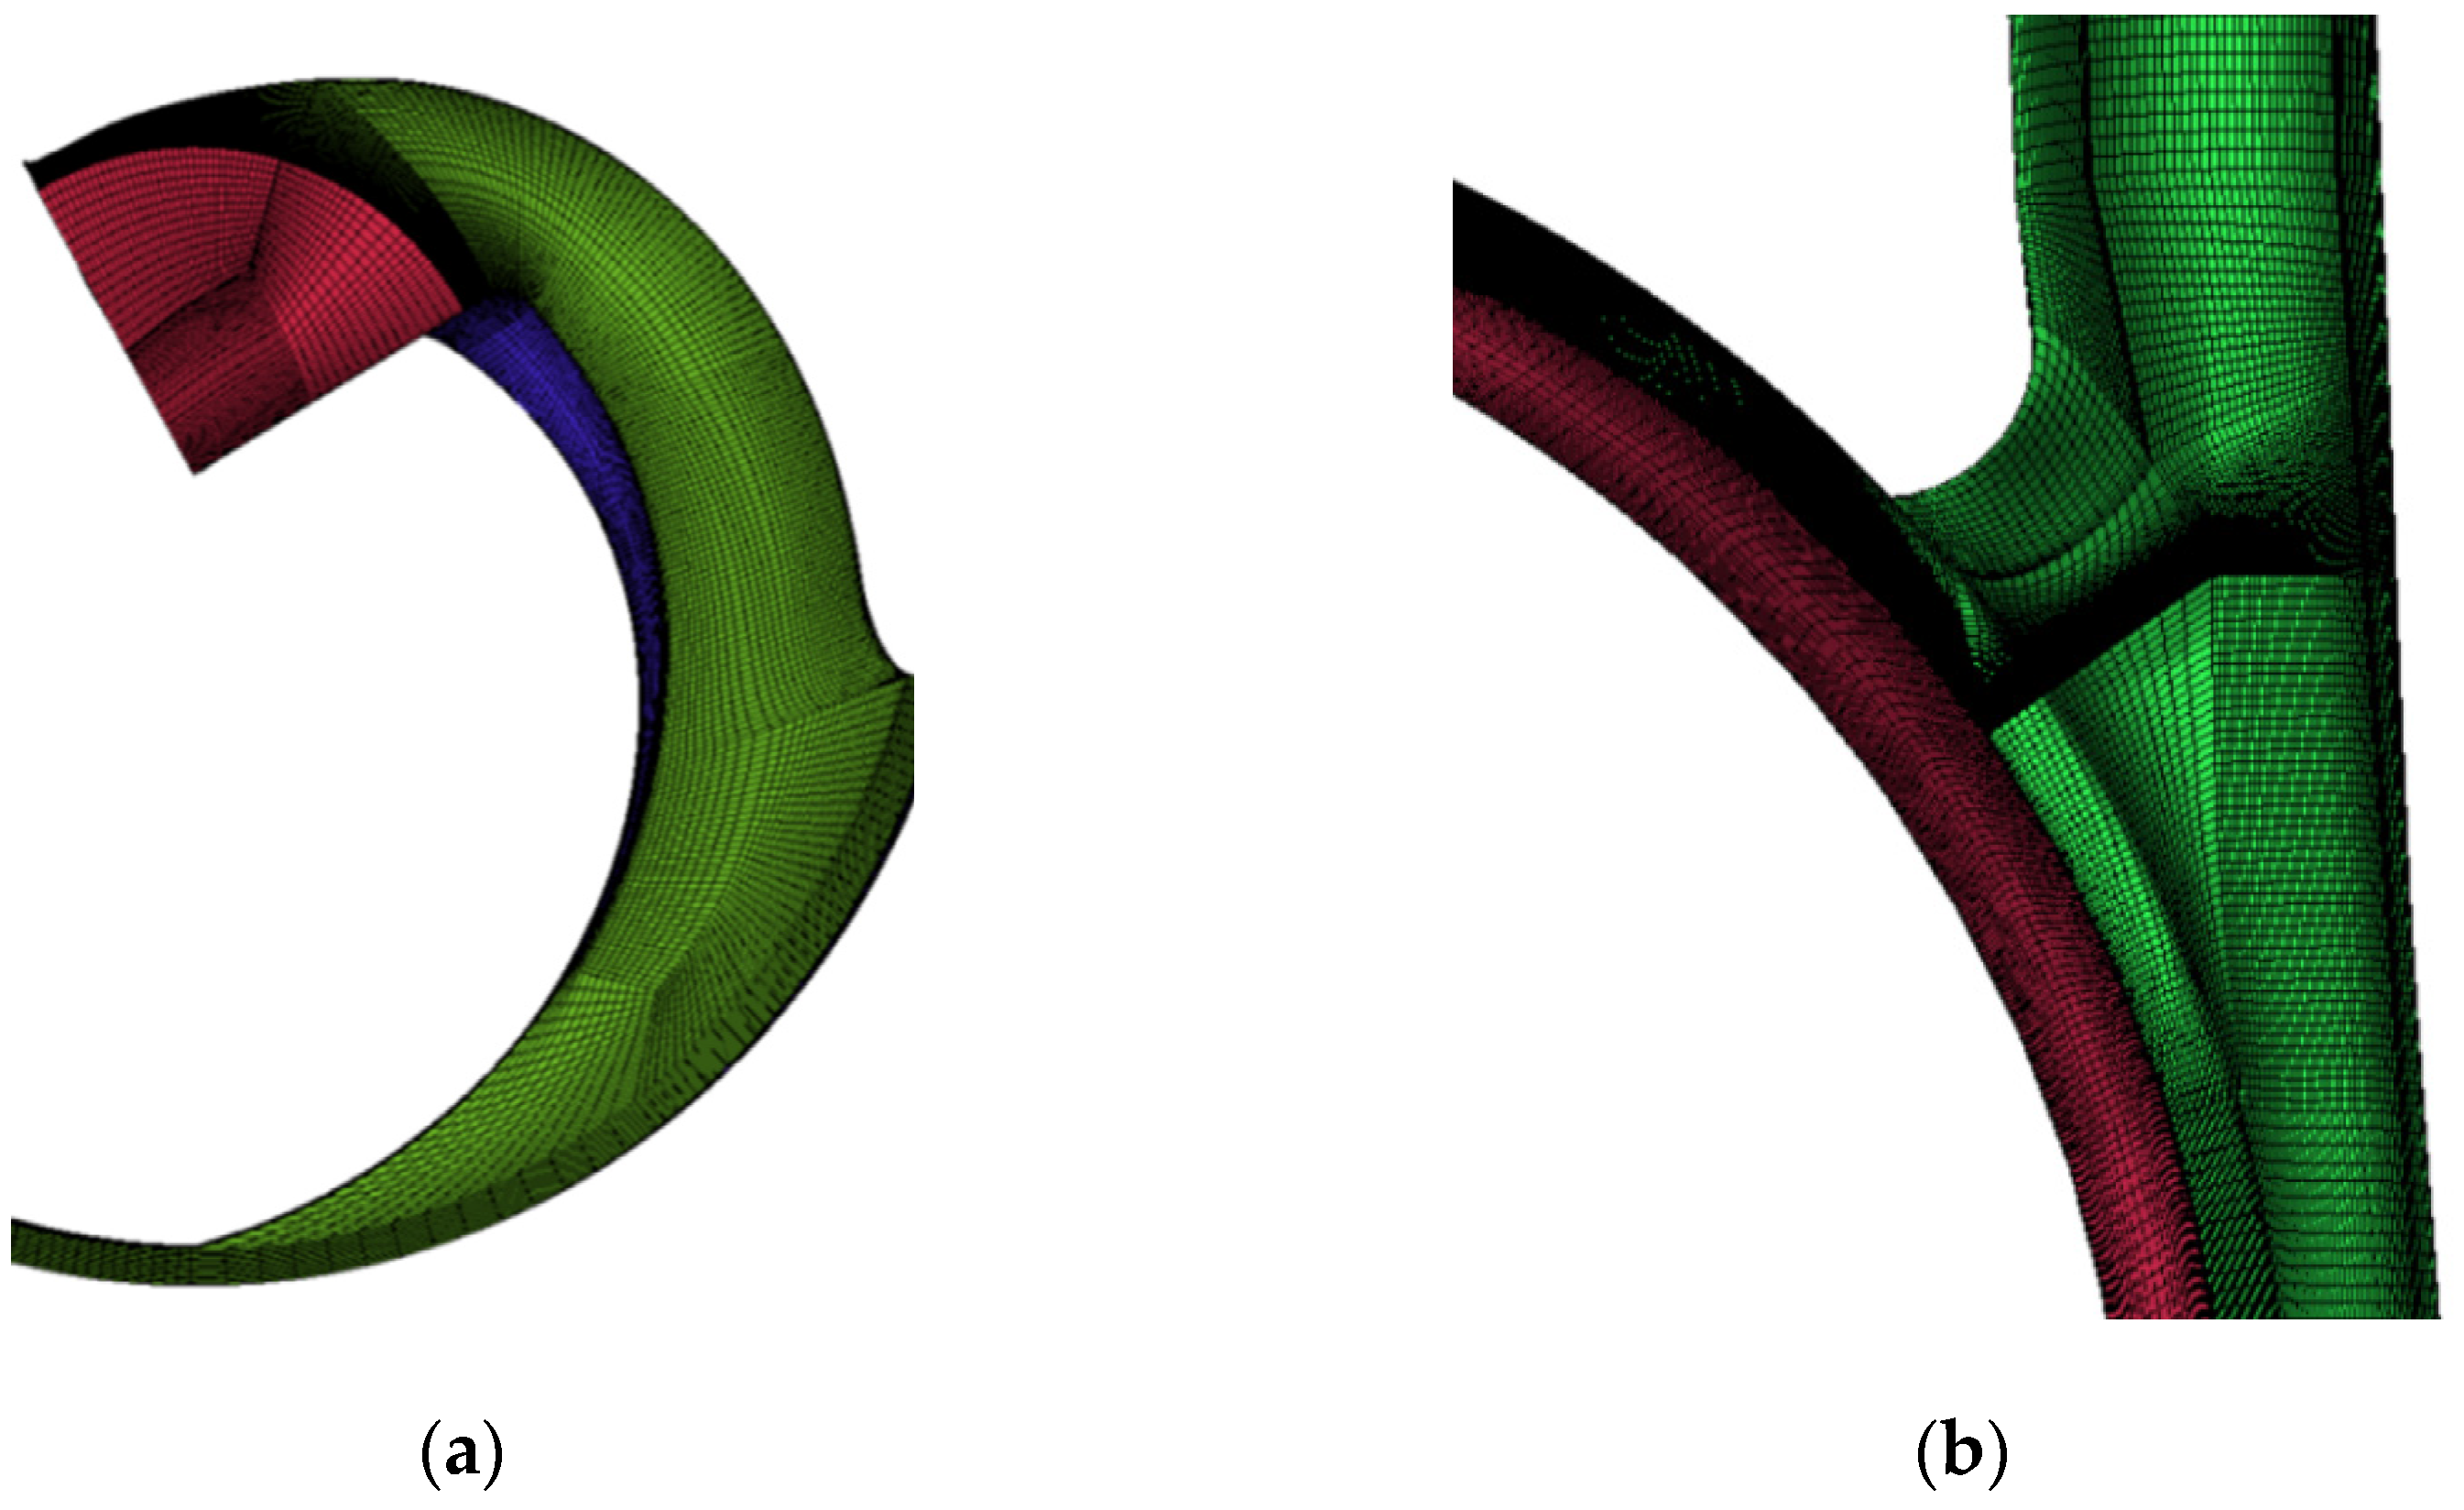
The 500 MZ centrifugal slurry pump was selected as the object of study. As shown in Table 1, its design volume flow rate was Q = 26 m3/h, rotating speed was n = 1500 r/min, and design head was H = 11 m. Therefore, its specific speed was:
n s = 3 . 65 n Q H 3 / 4 = 77
Three-dimensional (3D) modeling is based on the real physical model using Unigraphics NX10.0 software (Siemens PLM Software, Plano, TX, USA). The fluid domain model was simplified into four parts: inlet section, impeller, volute, and outlet section, in which the inlet and outlet section were extended to five times the impeller diameter in order to ensure the flow fully developed. The specific three-dimensional calculation domain is shown in Figure 1.

2.2. Grids

In this study, ANSYS-ICEM 19.0 software (ANSYS Inc., Canonsburg, PA, USA) was used for grids generation. The quality of the grids has great influence on the convergence and reliability of the computational results. A relatively reasonable number of grids could meet the required accuracy of the simulation and save computational resources. The hexahedral structural grids with near-wall refinement was employed. Five schemes with different grid numbers were selected for grid independence analysis. As shown in Table 2, the head and efficiency gradually stabilize as the number of grids gradually increase. After comparison, it could be seen that the number of grids stabilizes at 3 million. The total grid number of 3.1 million was adopted for the calculation of single-phase pure water and solid–liquid two-phase flow. The structural grids of the impeller and volute are shown in Figure 2.

2.3. Numerical Methods

2.3.1. Turbulence Model

The standard k-ε model is the most widely used model for industrial applications. Its model parameters were calibrated by experimental data and have good stability and reasonable accuracy for most applications [34]. This model implements the Reynolds time-averaged two-equation model by introducing turbulent kinetic energy k and turbulent dissipation rate ε into the transport equation. The values for k and ε are solved by the turbulent kinetic energy dissipation and turbulent energy equations [35,36]:
t ( ρ k ) + x i ( ρ k u i ) = x j [ ( μ + μ t σ k ) k x j ] + G k + G b ρ ϵ Y M + S k  
t ( ρ ε ) + x i ( ρ ε u i ) = x j [ ( μ + μ t σ ε ) ε x j ] + C 1 ε ε k ( G k + C 3 ε G b ) C 2 ε ρ ε 2 k + S ε
where G k represents the generation of turbulence kinetic energy due to the mean velocity gradients, G b is the generation of turbulence kinetic energy due to buoyancy, Y M represents the contribution of the fluctuating dilatation in compressible turbulence to the overall dissipation rate, C 1 ε , C 2 ε , and C 3 ε are constants, σ k and σ ε are the turbulent Prandtl numbers for k and ε , respectively, and S k and S ε are user-defined source terms.
The turbulent viscosity μ t can be computed by combining k and ε as follows:
μ t = ρ C μ k 2 ε

2.3.2. Discrete Phase Model

In the discrete phase model [37,38], the calculation of the particle track is independent. It is scheduled to be completed within the interval specified in the fluid phase calculation. The track of the discrete phase particles is solved by integrating the differential equations for the forces acting on the particles in Lagrangian coordinates. Solid particles moving in solid–liquid two-phase flow field are mainly subjected to the forces of gravity, winding resistance, additional mass force, additional forces induced by the pressure gradient of the flow field, Basset force, Saffman lift, and Magnus lift. The controlling equations of the forces on the particles in the x-direction are listed here as follows:
m s d u s d t = π d s 3 ρ s 6 [ g x ( ρ s ρ f ) ρ s + F D + F V + F P + F x ]  
F D = 18 μ ρ s d s 2 C D R e s 24 ( u f u s )  
F V = 1 2 ρ f ρ s d d t ( u f u s )  
F P = ρ f ρ s u s u x  
where g x is the x-direction gravitational acceleration; F D is the fluid bypassing resistance per unit mass of solid particles; F V is the additional mass force per unit mass of solid particles; F P is the additional force induced by the pressure gradient of the flow field; C D is the drag coefficient; and F x is the sum of other external forces, mainly including Basset force, Saffman lift force, Magnus lift force, and other force.
Saffman lift and Magnus lift caused by the rotation of the particles due to the transverse velocity gradient (shear layer flow) are only valid for subscopic particles (1 to 10 μm in diameter). Because the particle size of solid particles in the two-phase fluid conveyed by centrifugal slurry pumps is much larger than that of subscopic particles, the effect of the particles’ own rotation can be neglected when numerical simulations are performed. The Basset force per unit mass of solid particles in the flow field can be calculated according to the following equation:
F B = 9 d s ρ s ρ f μ π 0 1 d u f d t d u s d t t t d t  
In the rotating coordinate system (e.g., rotating impeller zone), the additional forces in the equation also include the centrifugal and Coriolis force exerted on the solid particles due to the impeller rotation. When the impeller rotation axis is the z-axis, the additional forces per unit mass of solid particles in the x and y directions in the Cartesian coordinate system are as follows:
F s , x = ( 1 ρ f ρ s ) ω 2 x + 2 ω ( u y , s ρ f ρ s u y , f )  
F s , y = ( 1 ρ f ρ s ) ω 2 y + 2 ω ( u x , s ρ f ρ s u x , f )  
where u x , s , u y , s are the velocities of solid phase particles in x, y direction;   u x , f , u y , f are the velocities of liquid phase in x, y direction; and ω is the angular velocity of solid particles rotation. The calculation of force in the y and z direction is similar to the x direction.

2.4. Erosion Model

The McLaury erosion model [39] was employed to predict the erosion rate of the solid phase, which is one of the most common and widely used erosion models for dense flow. McLaury erosion rate is expressed as:
E = A V n f ( γ )  
A = F ( B h ) k  
where V is the particle impact velocity; F is the empirical constant; B h is the Brinell hardness of the wall material; and n is the velocity index.
f ( γ ) = b γ 2 + c γ                           for     γ γ l i m  
f ( γ ) = x cos 2 ( γ ) sin ( w γ ) + y sin 2 ( γ ) + z                       for   γ > γ l i m  
where b, c, w, x, y, z are the constants in the collision angle function. In this study, A = 2.38810−7, γlim = 10, n = 1.73, b = −34.79, c = 12.3, x = 0.147, y = −0.745, and w = 5.205.

2.5. Boundary Conditions

For the single-phase pure water condition, the steady three-dimensional numerical simulation was carried out to predict the flow field and pump performance characteristics. The liquid medium in the computational domain was liquid water with a density of 998.2 kg/m3, and the gravitational acceleration was set to 9.81 m/s2. The standard k-ε model was selected as the turbulence model. The boundary condition outlet was set as a mass flow outlet. The inlet boundary condition was set as a pressure inlet. The solid wall surface was set as a no-slip wall surface. Except for the impeller, which was set as rotating at 1500 r/min, all the other computational domains were set as stationary. The dynamic-static computational domain intersection was adopted as the frozen rotor model. The data were exchanged with the computational domains through the interface.
The solid–liquid two-phase flow calculation settings were partially adjusted for the pure water working condition settings. DPM tracks the mass and momentum of the particles along the orbit. These physical quantities can be acted upon in the subsequent calculation of the continuous phase. Thus, whereas the continuous phase affects the discrete phase, the effects of the discrete phase on the continuous phase were also considered. The control equations for the discrete phase and the continuous phase were solved alternately until both converged.
The inlet surface was specified as the particle incidence surface, and the particle incidence velocity was the same as the liquid phase inlet velocity. The solid particles were brown corundum with a density of 2900 kg/m3. The particle diameters were 1.0 mm, 0.8 mm, 0.6 mm, 0.3 mm, 0.15 mm, and 0.1 mm, respectively. The default particle shape was set as regular sphere. The outlet surface of the computational domain was designated as “Escape”, and the rest of the wall surface was designated as “Reflect”. The single-phase pure water flow field was used as the initial flow field to start the solid–liquid two-phase computation.
The particle collision model is an important part of the DPM model, which is used to describe the interaction between the particles and the wall. In this study, the collision model proposed by Pagalthivarthi and Gupta [40] was utilized. The equations are as follows:
{ e n = 0.993 0.0307 θ + 0.000475 θ 2 0.00000261 θ 3 e t = 0.998 0.029 θ + 0.000643 θ 2 0.00000356 θ 3  
where e n is the normal restitution coefficient, e t is the tangential restitution coefficient, and θ is the particle impact angle.

3. Experimental Verification and Simulation
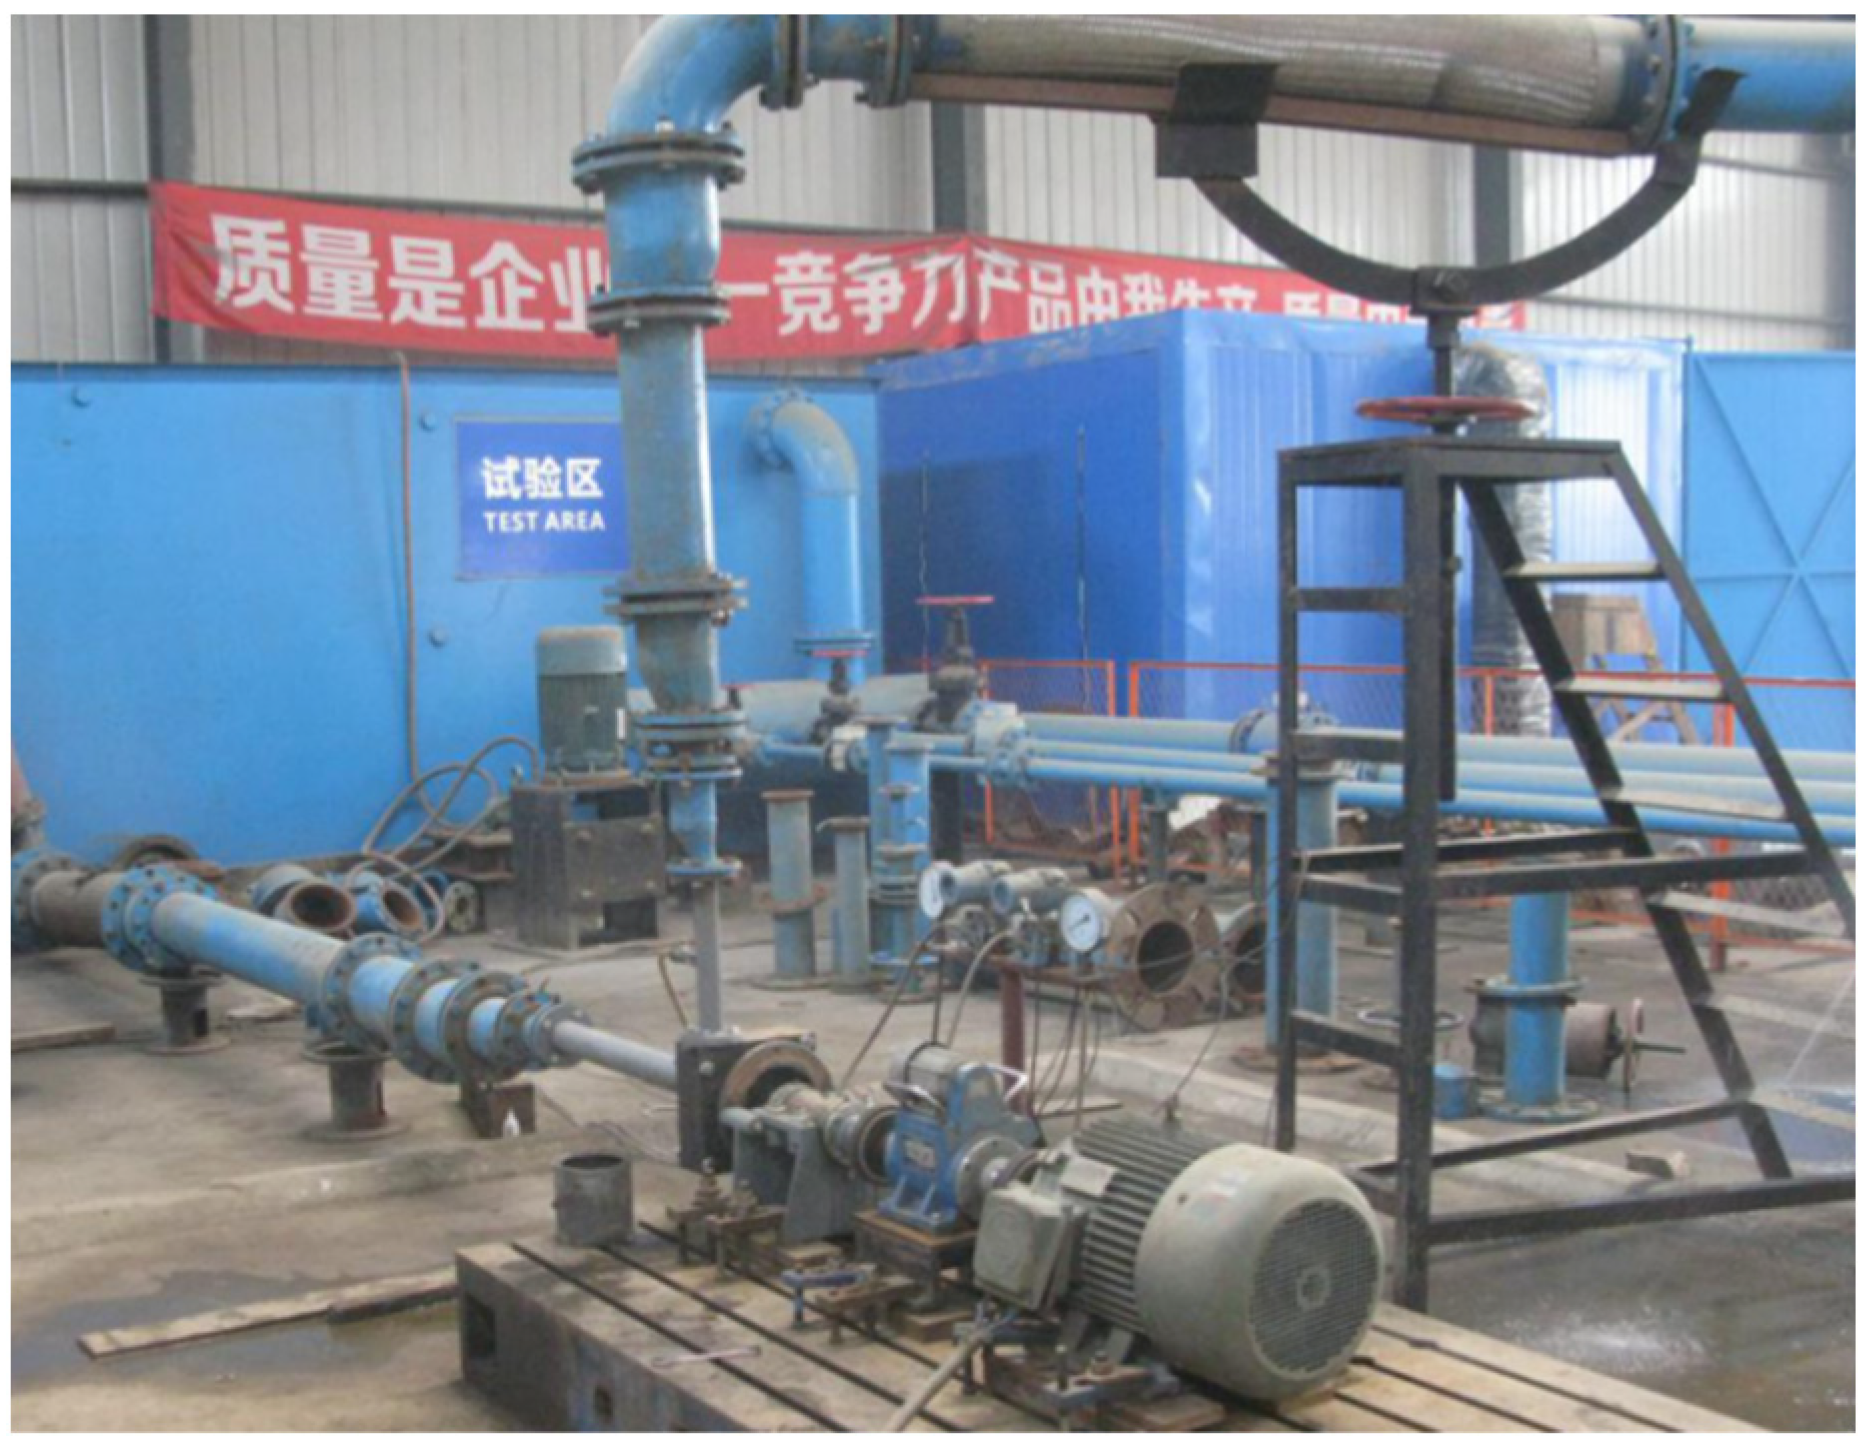
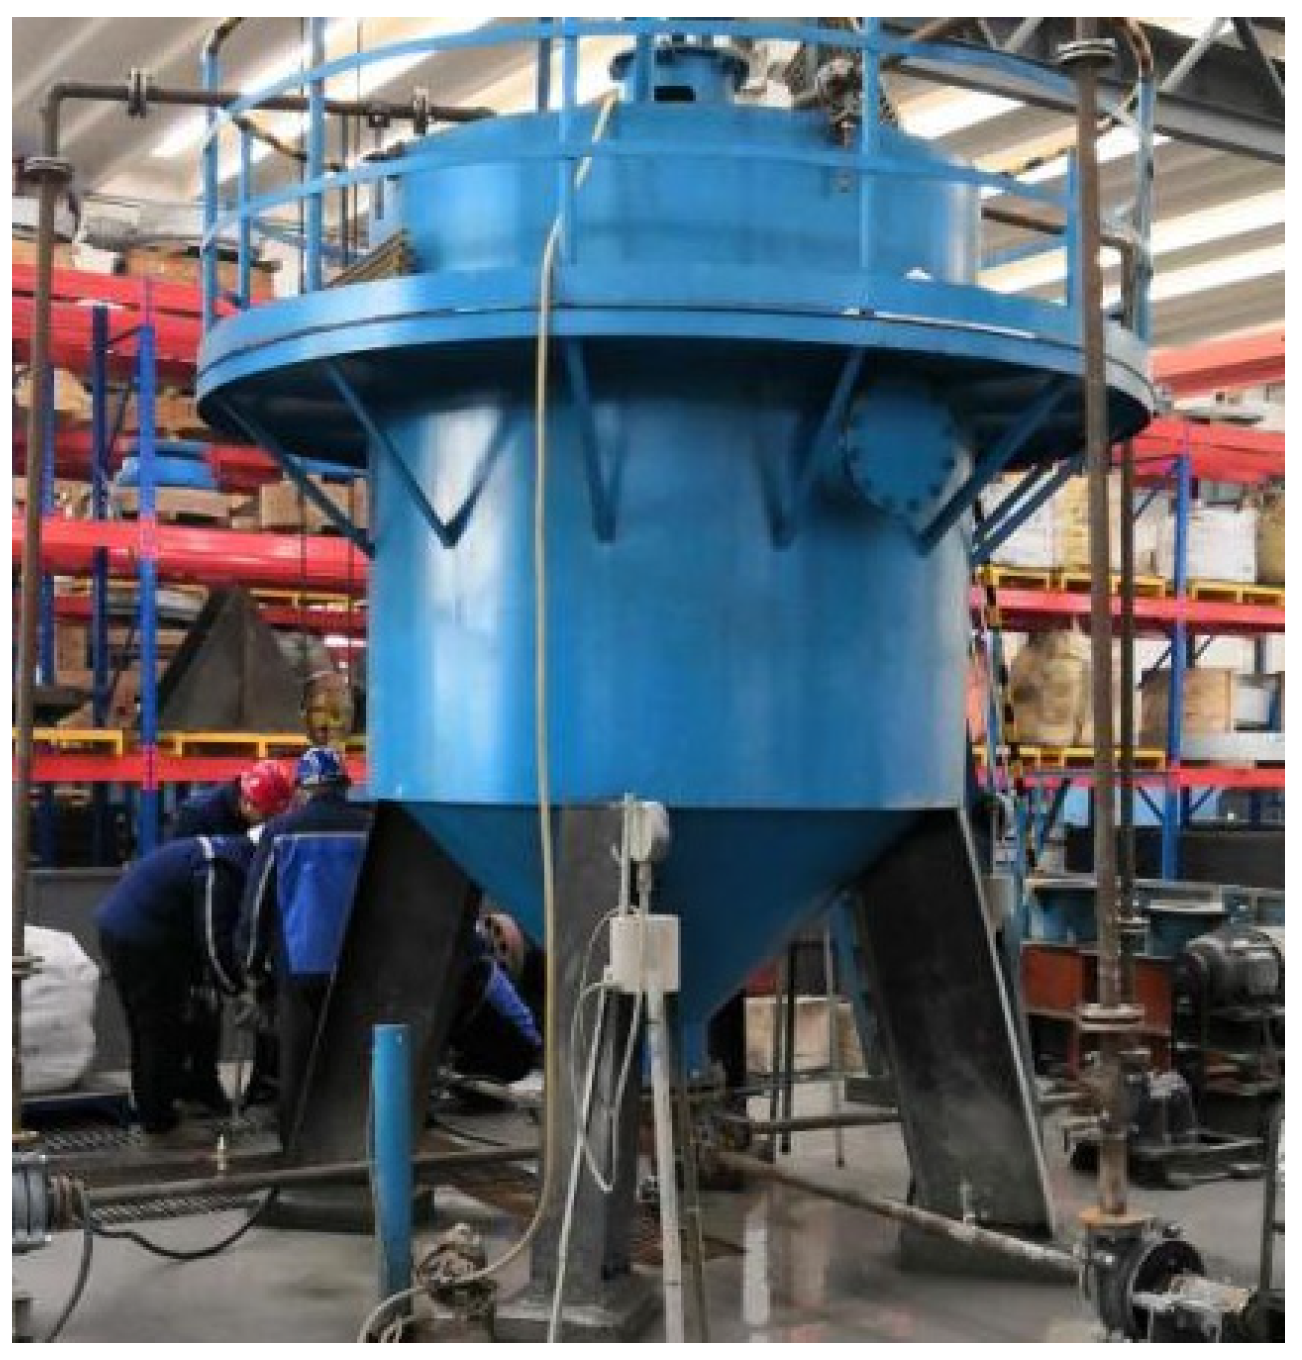
3.1. Experiments

3.1.1. Performance Experiments

The test bench [41,42] for the pump performance experiment under pure water conditions is shown in Figure 3. A turbine flow meter (accuracy ±0.1%) was applied to measure the volume flow rate, and a pressure sensor (accuracy ±0.1%) was used to measure the pump inlet and outlet pressure. A torque sensor (accuracy of ±0.5%) and speed sensor (accuracy of ±0.1%) were employed to measure torque and speed.
H = p 2 p 1 ρ g + v 2 2 v 1 2 2 g + ( z 2 z 1 )  
η = ρ g Q H P s × 100 %
where p1, v1, z1 are the pump inlet parameters, p2, v2, z2 are the pump outlet parameters, η is the pump efficiency, and Ps is the output power of the motor. According to the uncertainty calculation procedure of ISO 9906 [43], the total measurement error of this test system is Ds = ±0.37%.

3.1.2. Wear Experiments

The slurry pump wear test bench [41] is shown in Figure 4 and consisted of a slurry barrel, pump, pressure gauge, pipeline, valve, motor, and test system. The test system included electric parts such as a buck starting cabinet, system power distribution cabinet, test conversion protection cabinet, and weak electric parts (such as intelligent display instrument, signal conversion device, and various signal sensors). The total duration of the test was 44.5 h. The operating speed of the slurry pump was 1500 r/min, and solid volume fraction was 15%. The solid particles are brown corundum with the density of 2900 kg/m3 and diameter of 0.6 mm.
The first phase of the experiment lasted for 24 h. When the pump was running for 4 h, it was disassembled and the surface shape of the impeller and volute was inspected. The disassembly inspection revealed that obvious wear marks appeared on the blade inlet, the intersection of the blade suction surface, and the shroud. In the pump disassembly inspection after 24 h operation, it was found that there was serious wear in the pump impeller inlet and 1–2 mm oval deep pitting in the hub. There was more serious wear in the intersection of the impeller blade suction surface and the shroud, the blade showed an approximately 3 mm wear groove. The second phase of the experiment lasted for 20.5 h. After the second phase of the wear experiment, the blade at the impeller inlet was badly worn. The impeller hub was almost destroyed.

3.2. Comparison and Verification

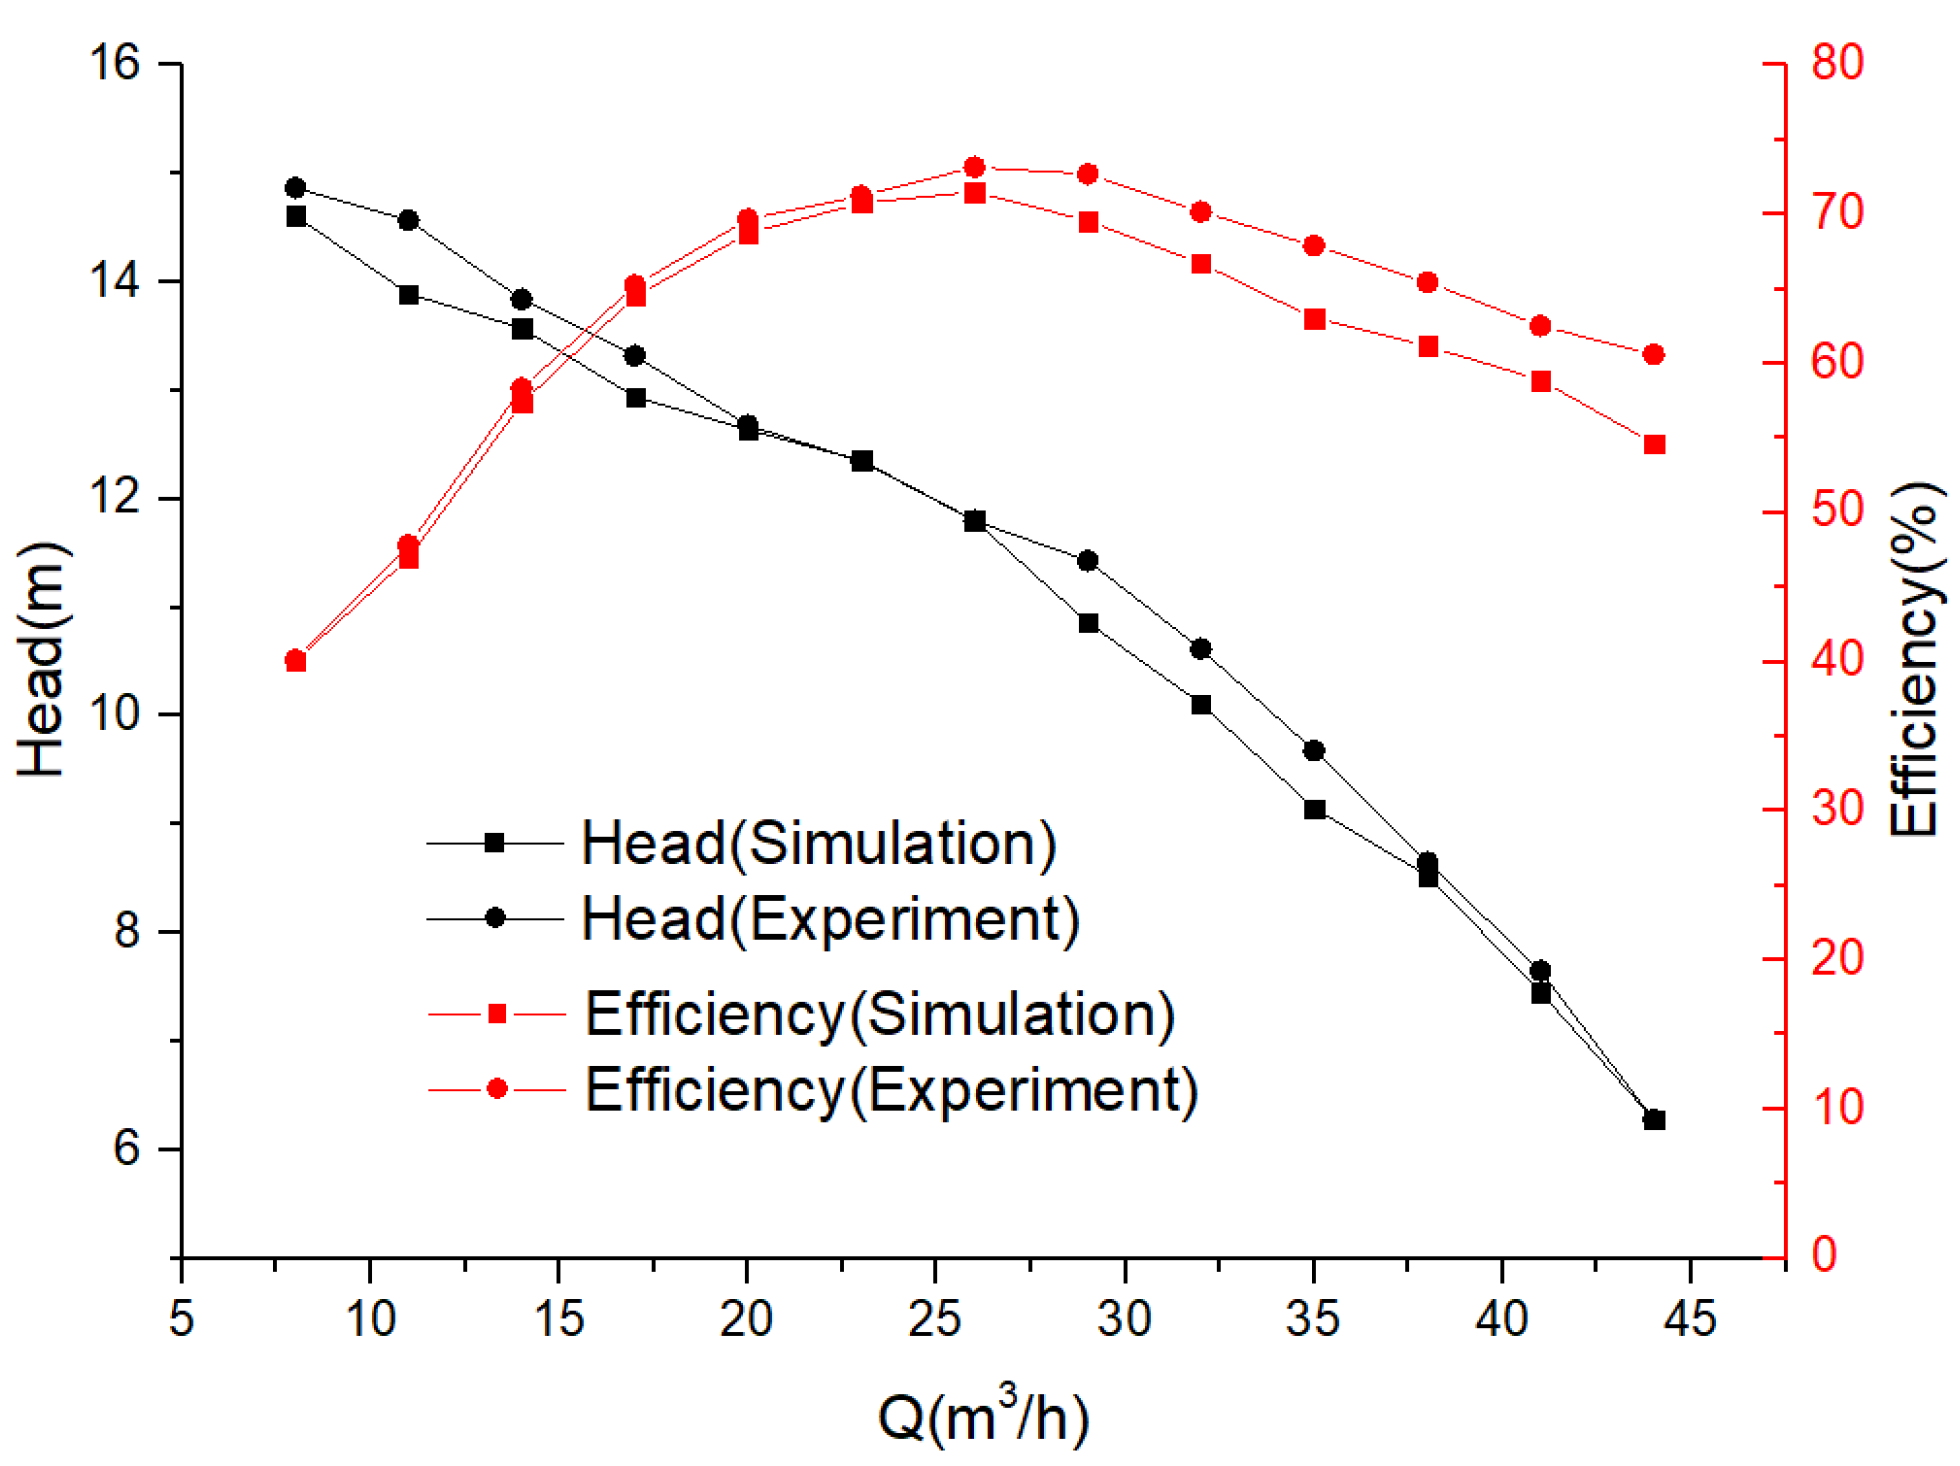
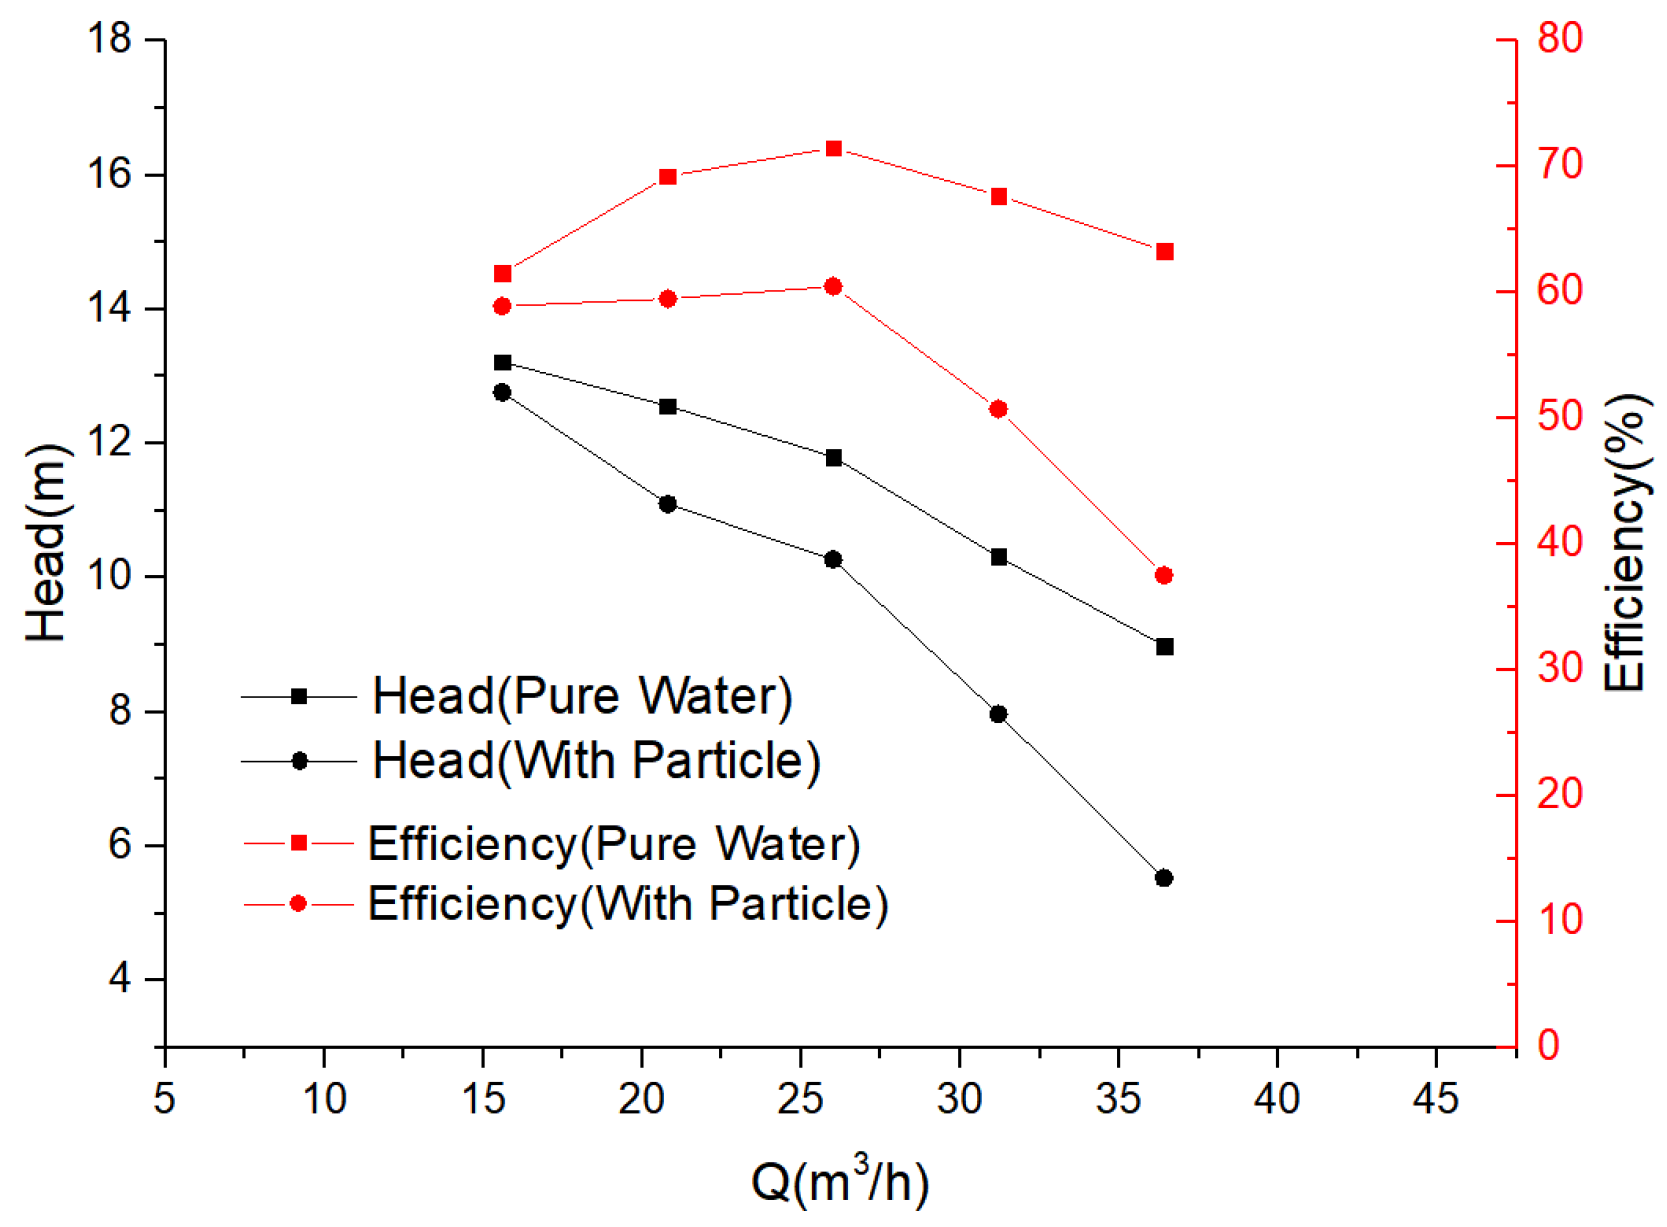
3.2.1. Performance Comparison under Pure Water Conditions

The performance comparison of calculation results and experimental results is shown in Figure 5. The simulated head and efficiency variation trends were in high agreement with the experimental values. The minimum deviation between the simulated and experimental heads at the volume flow rate of 26 m3/h was only 0.02%. The deviation of efficiency near the design working condition was within 2.25%. The deviation of head calculation in this full flow range was basically within 5%, so the calculation model could accurately predict the pump performance.

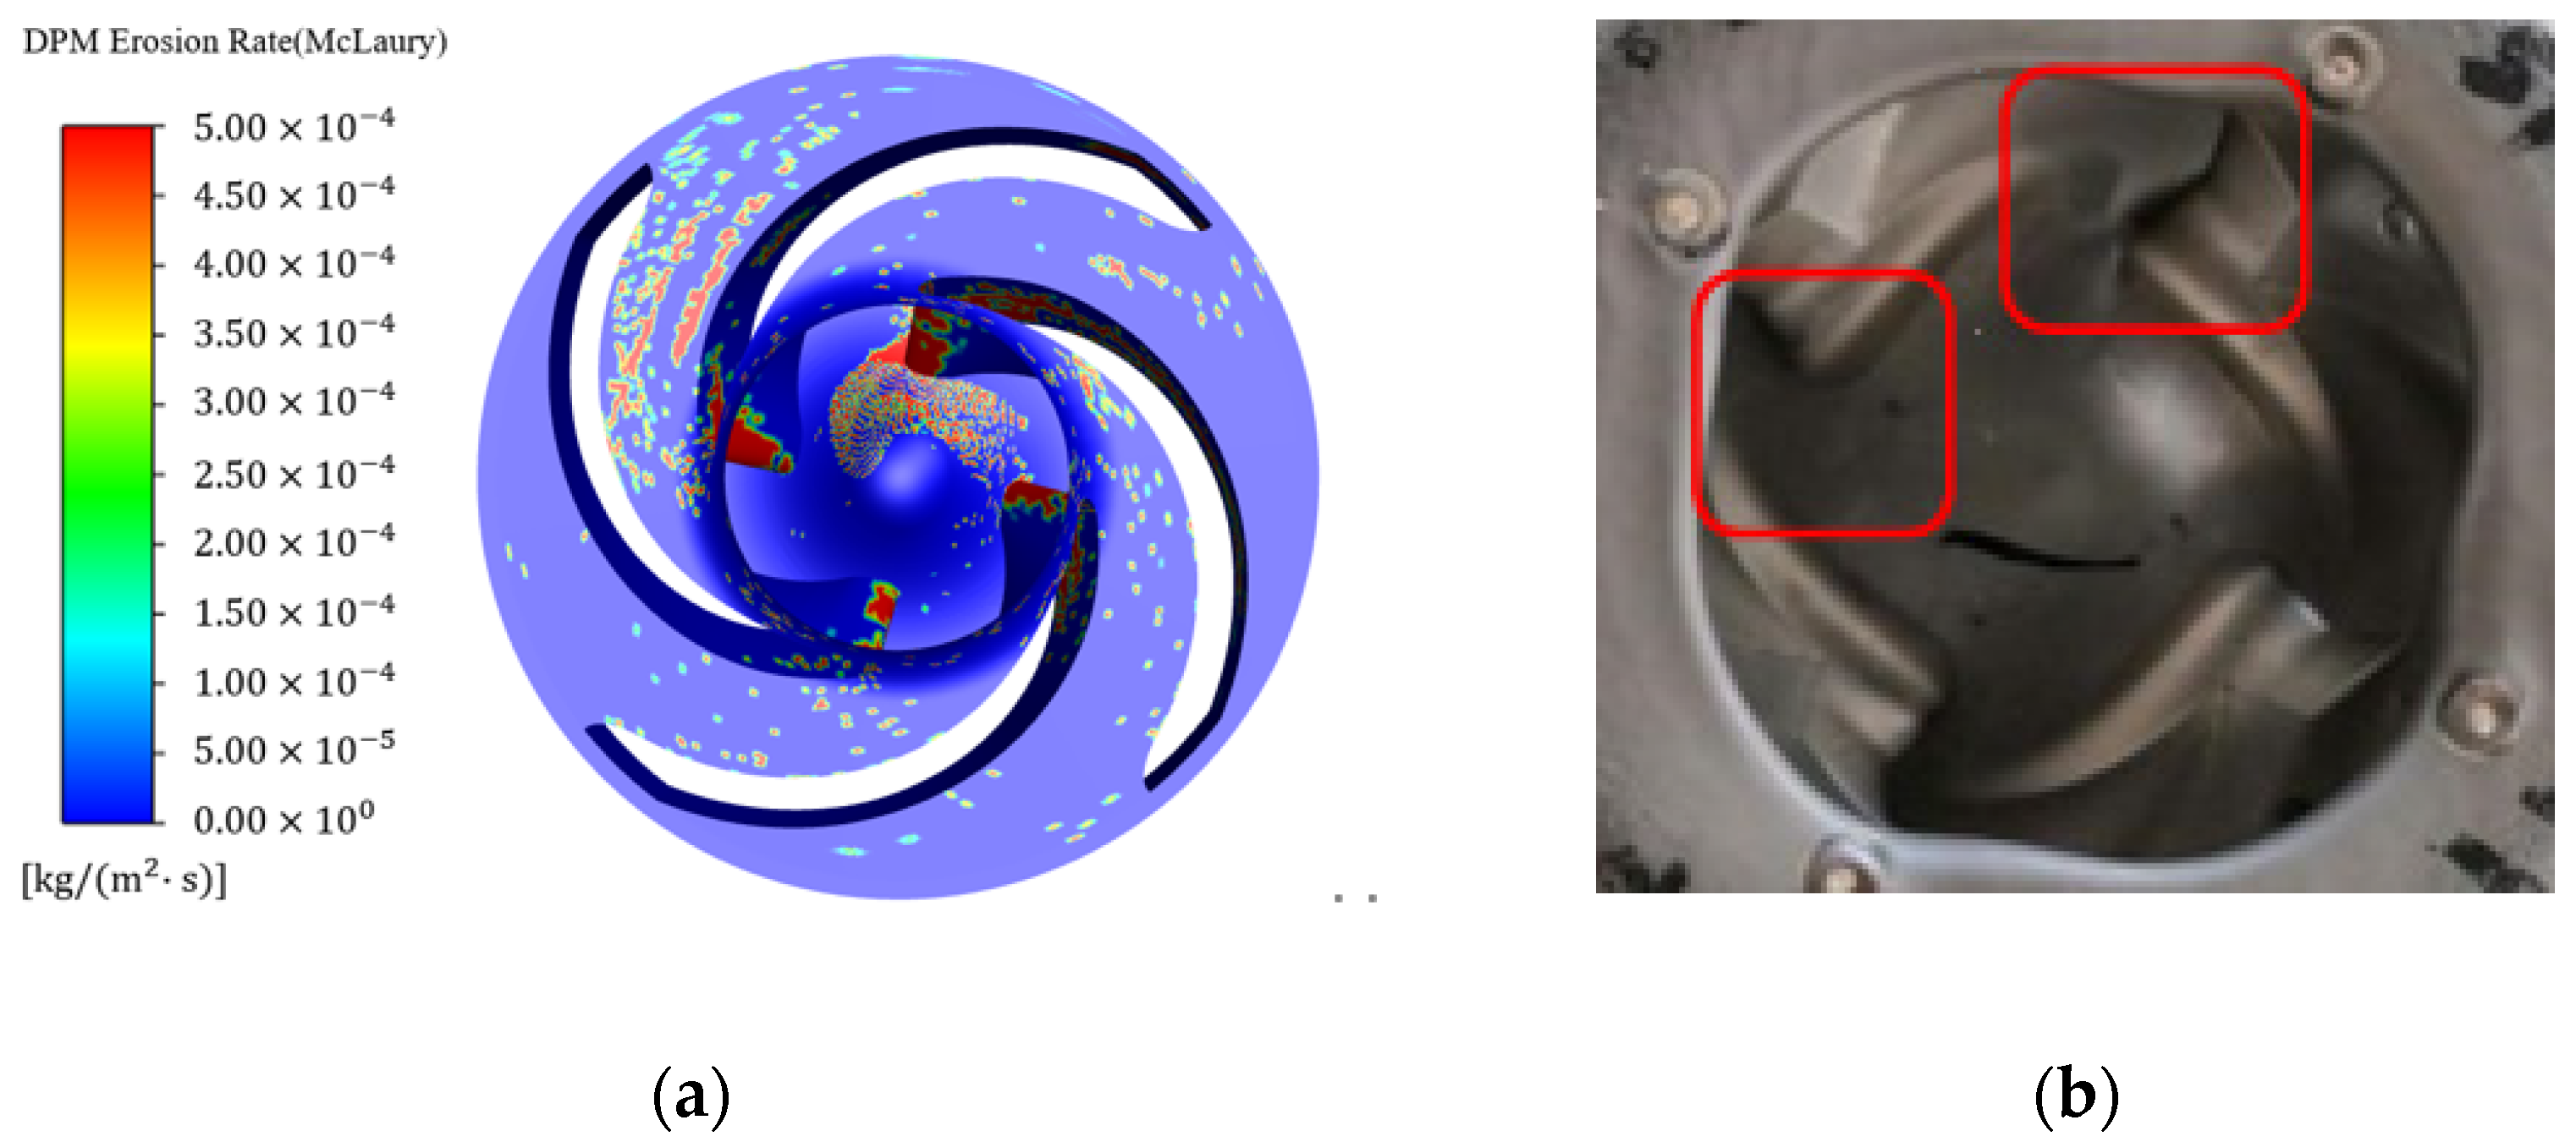
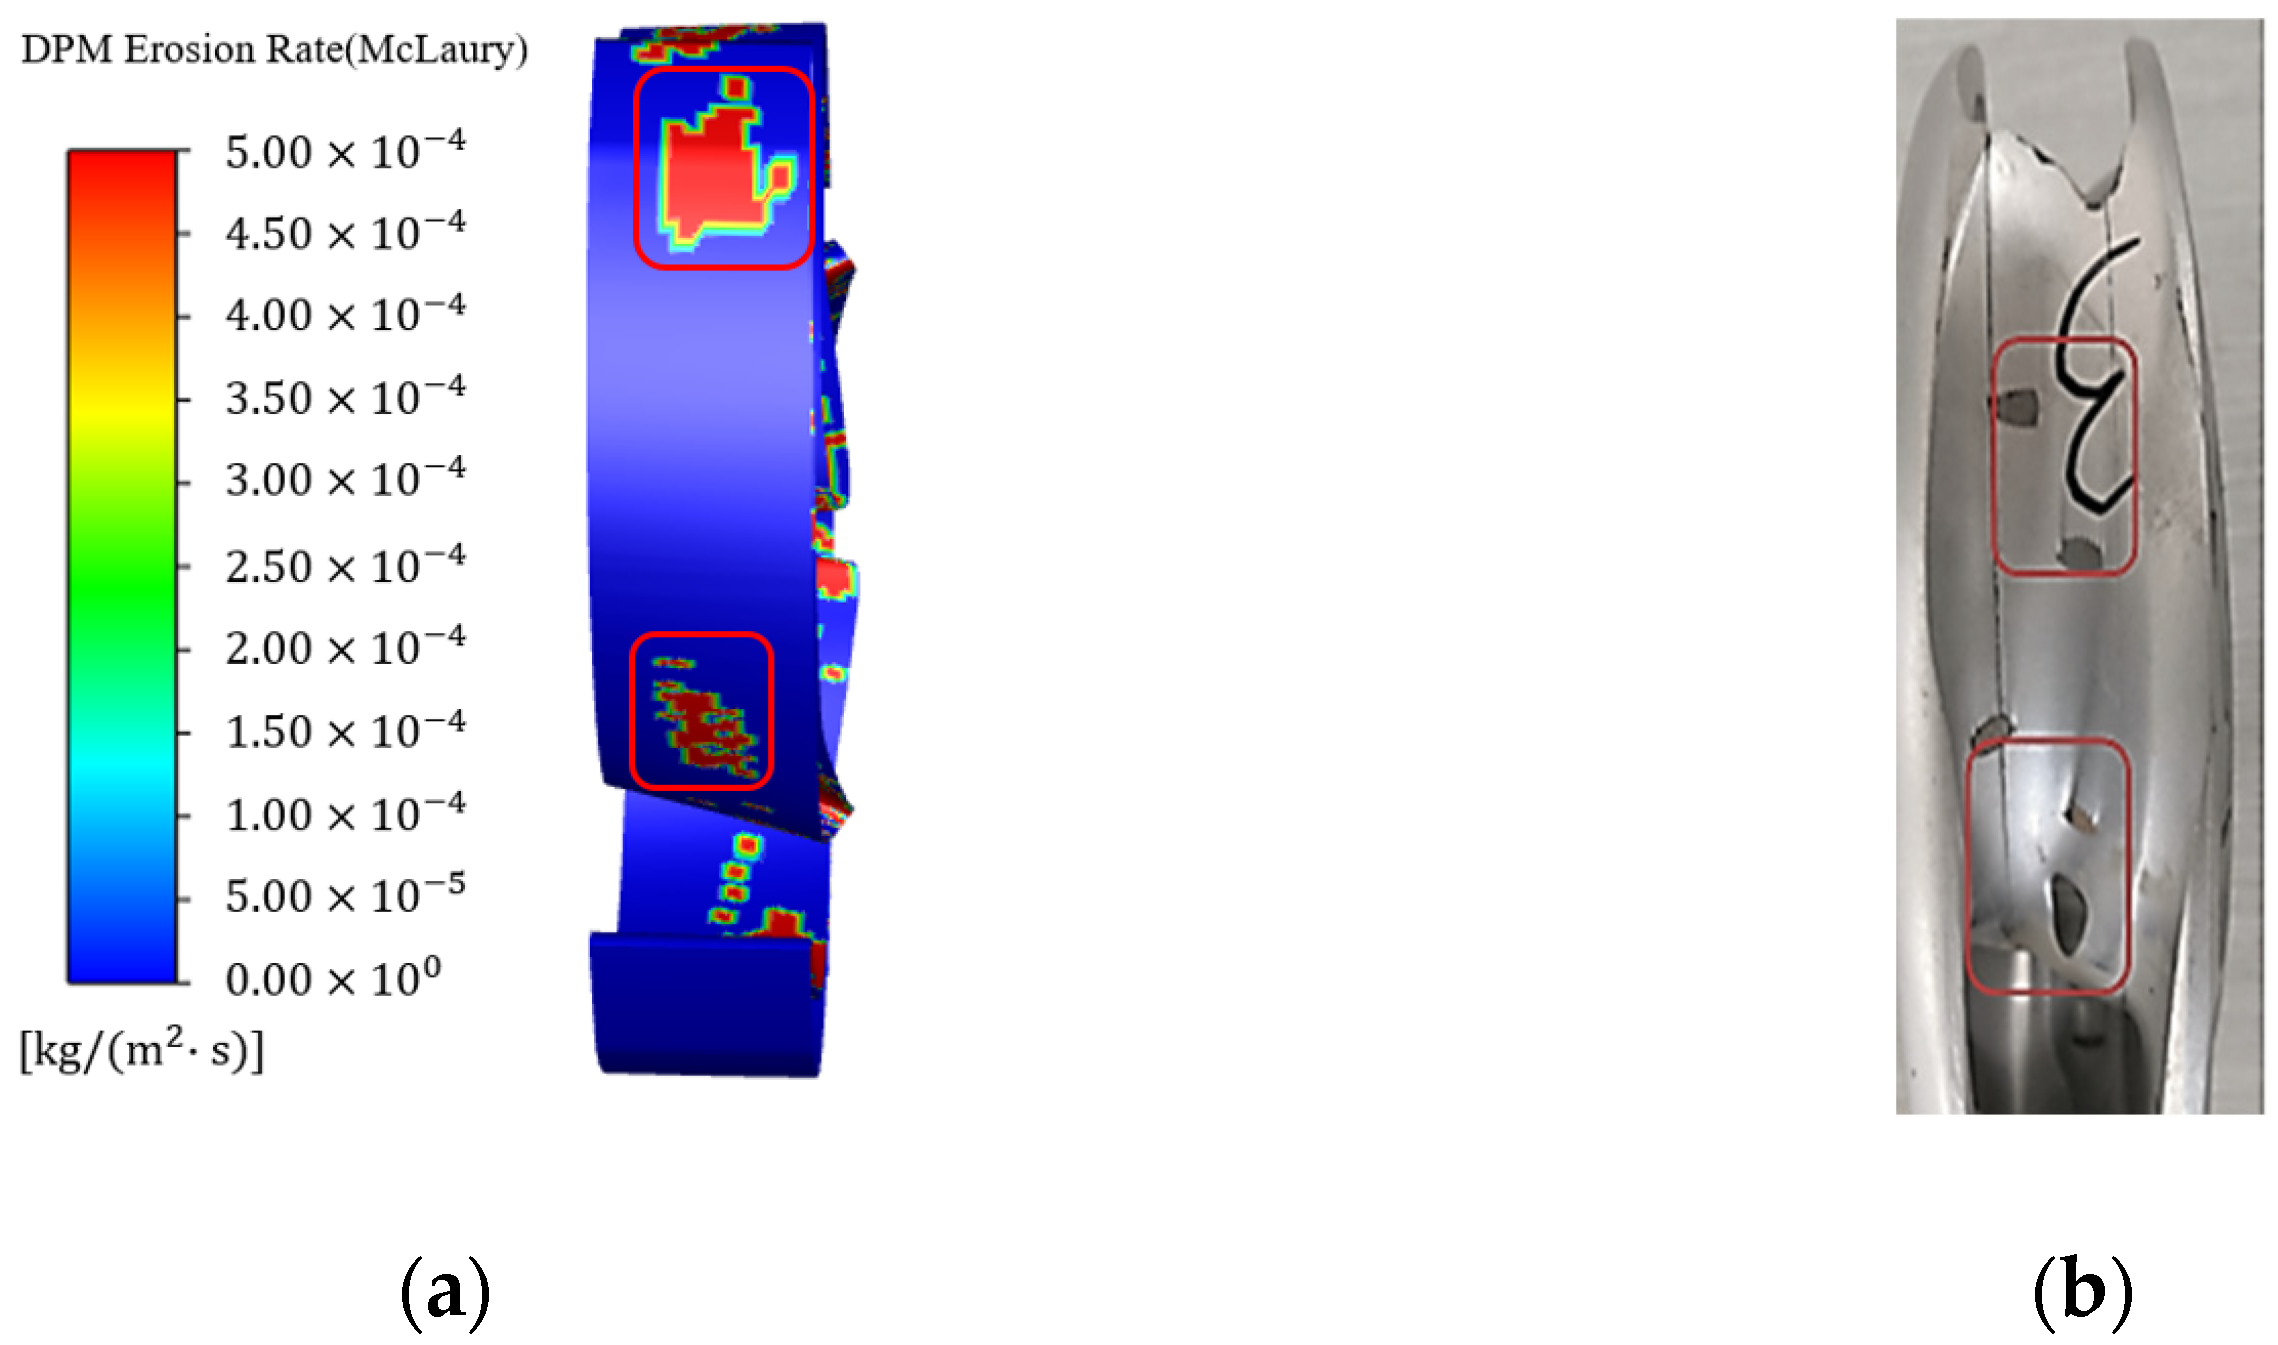
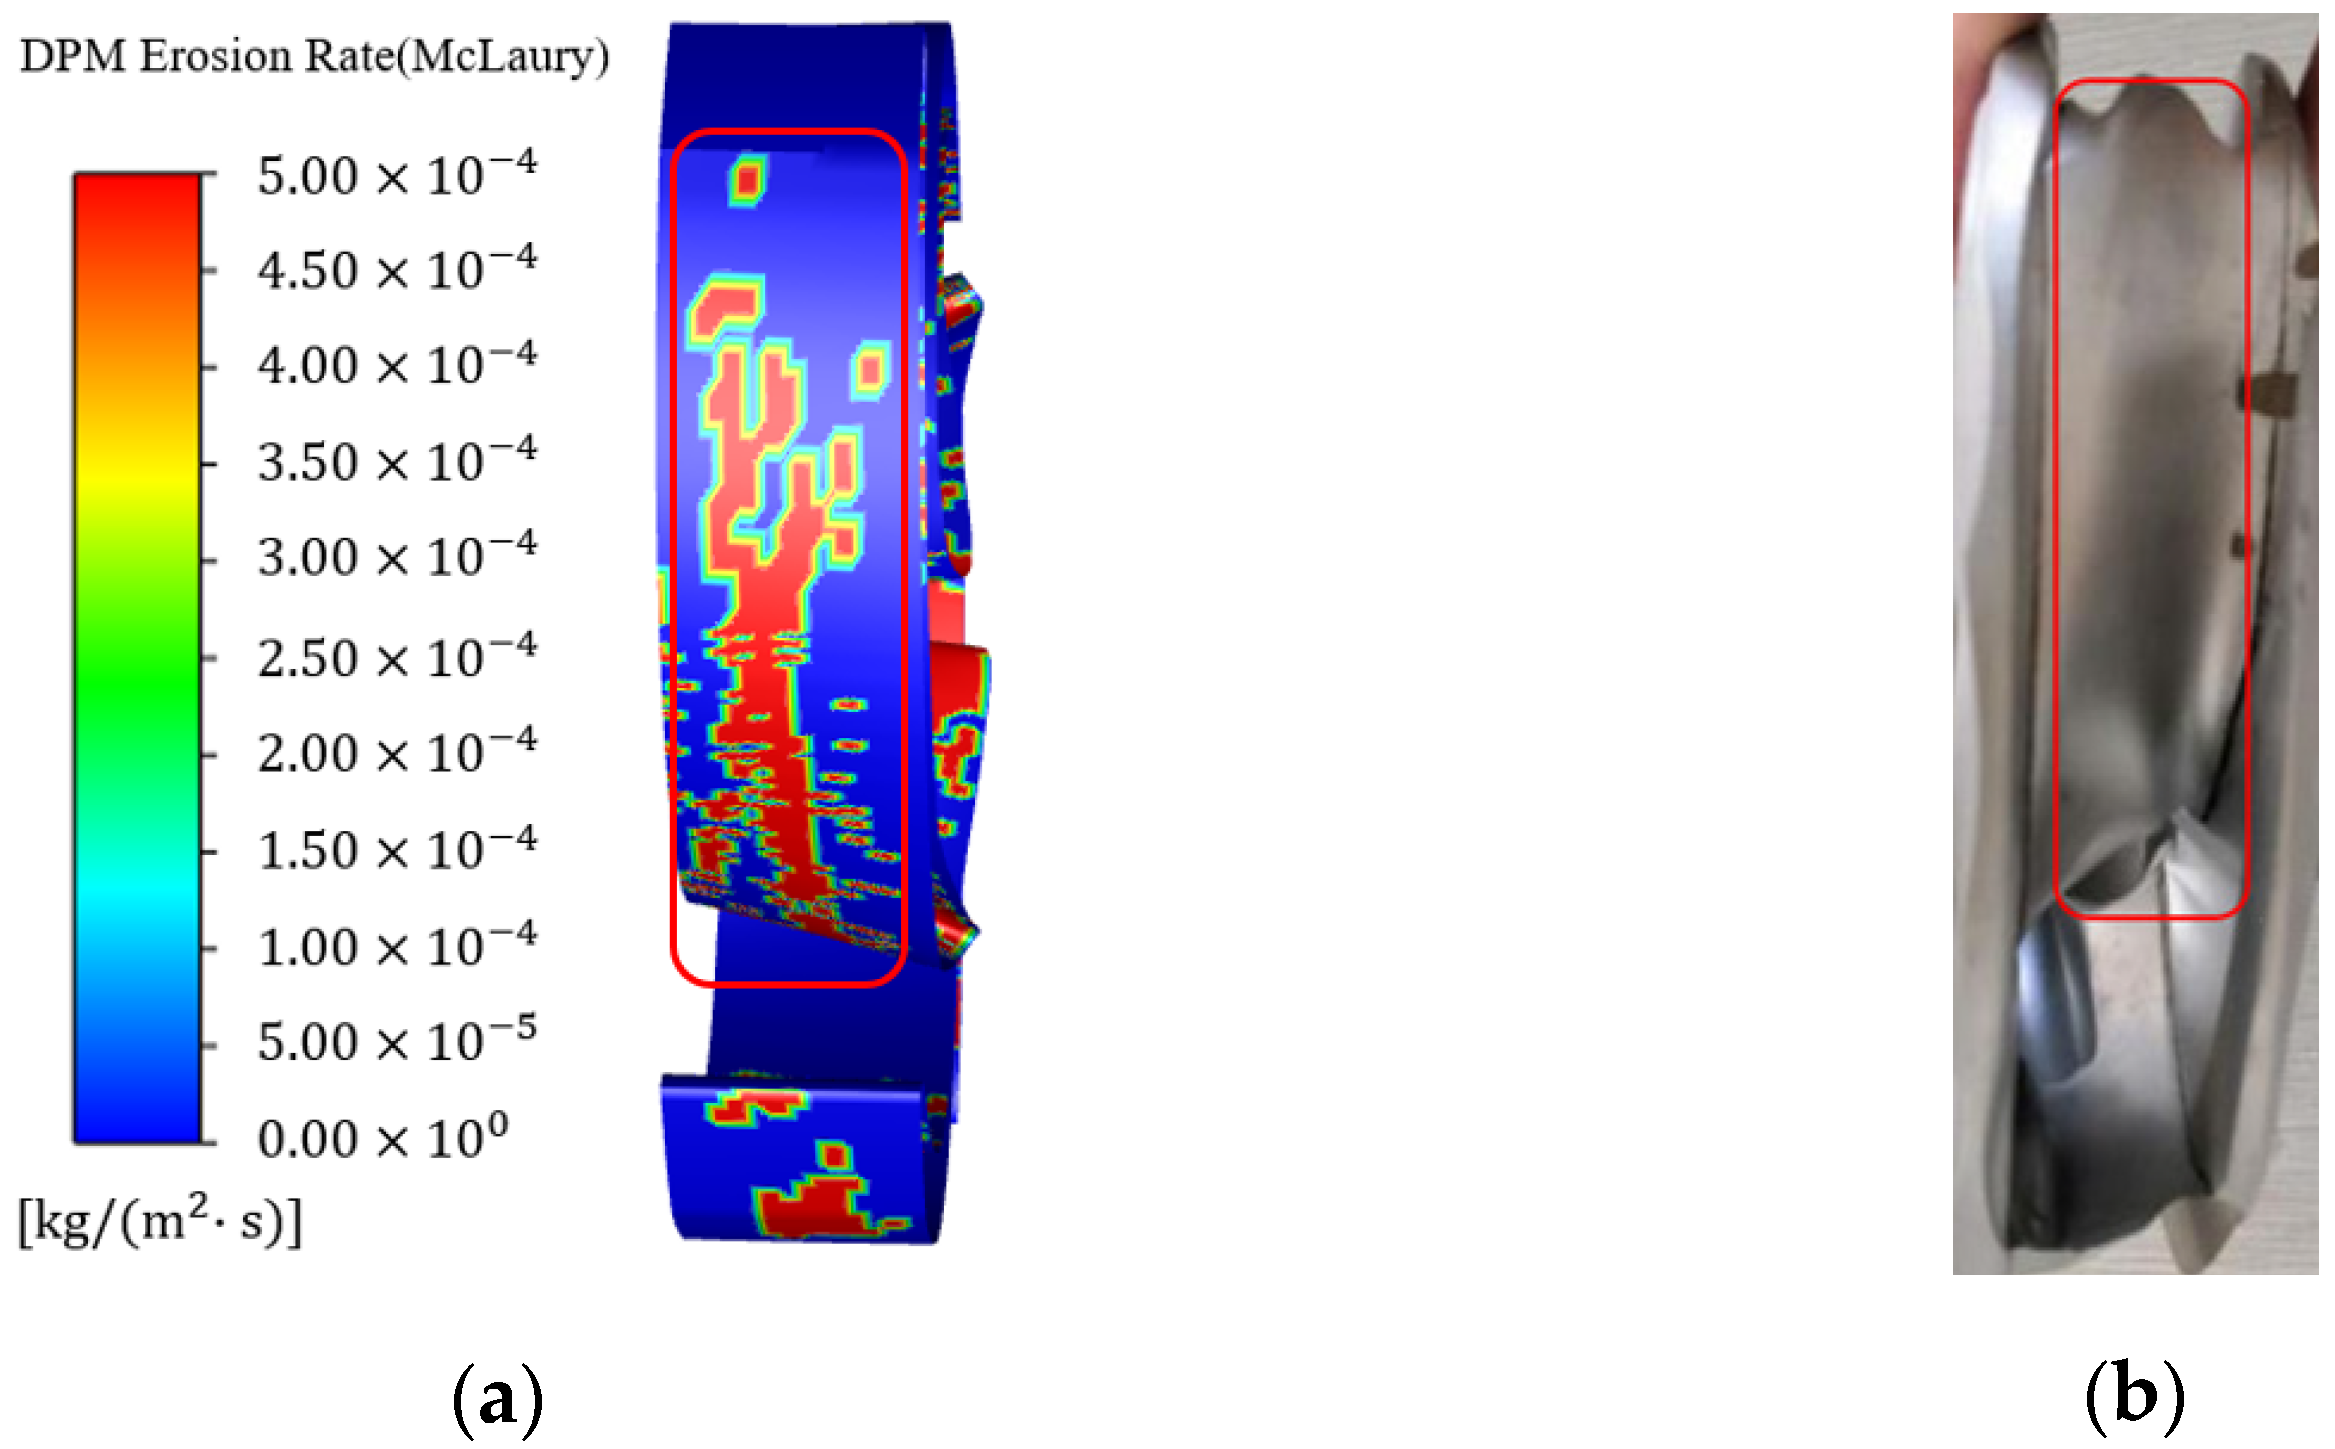
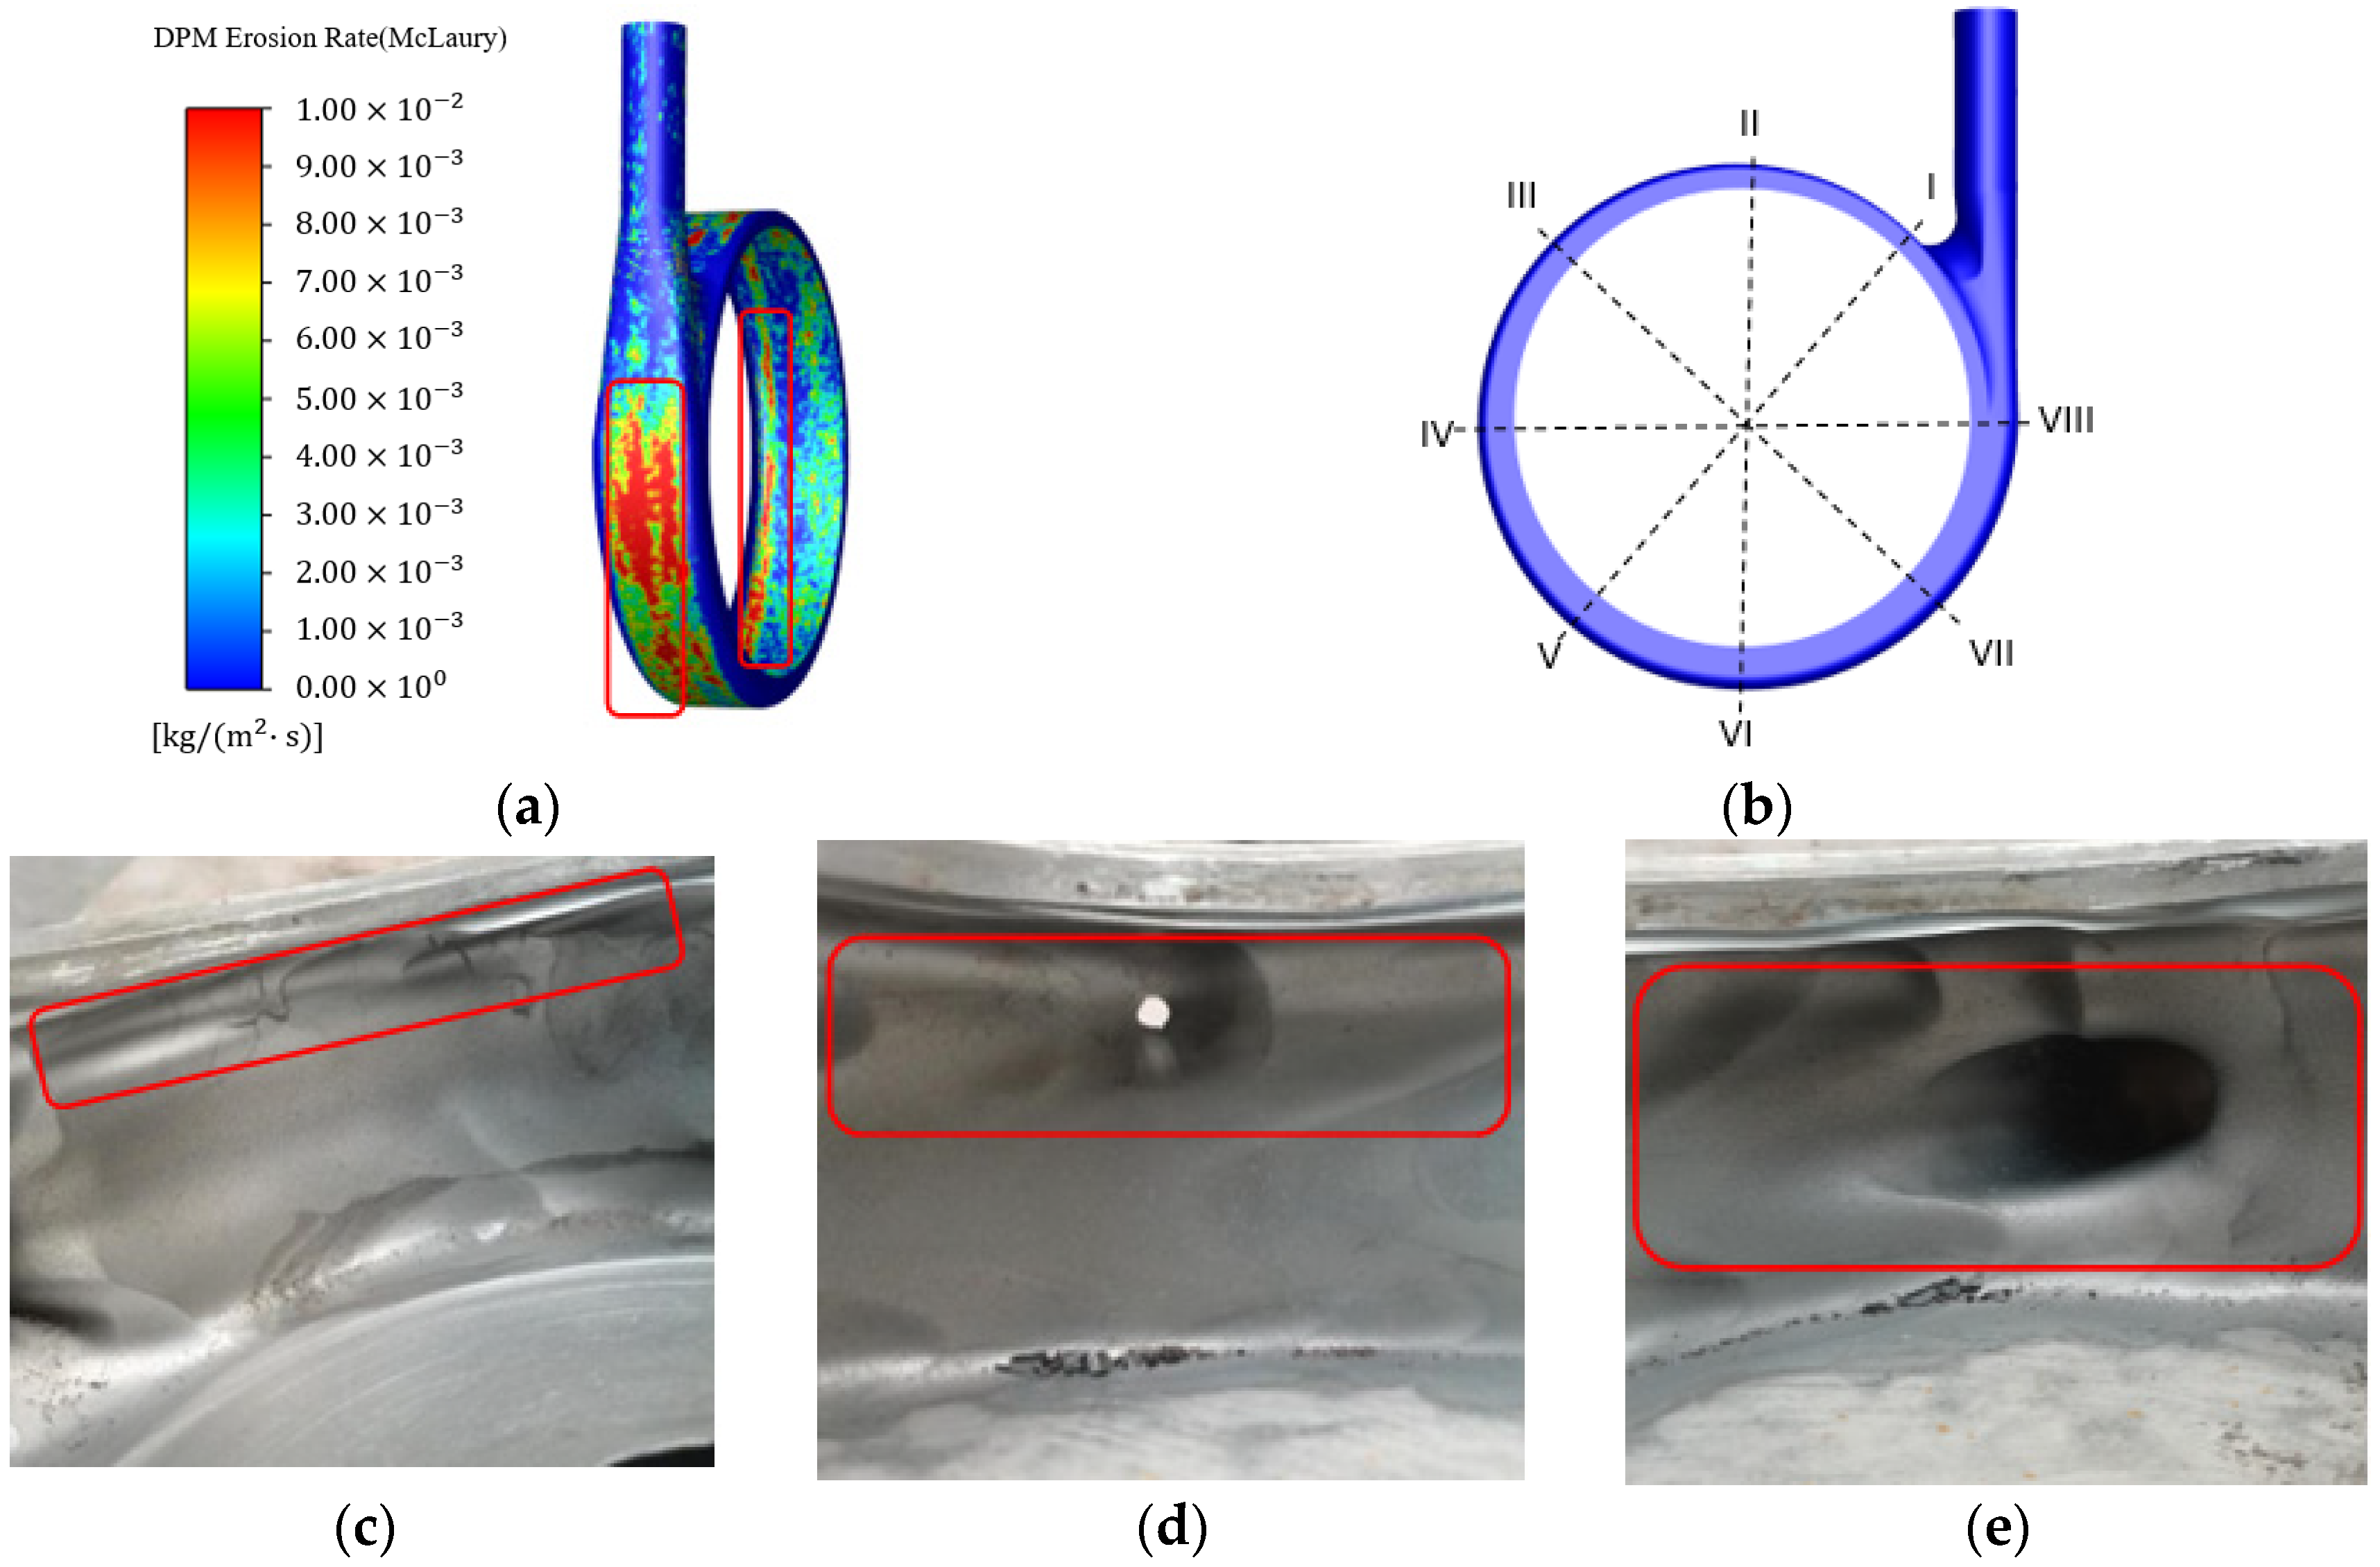
3.2.2. Wear Comparison

The comparison of wear at the impeller inlet is shown in Figure 6. From the simulation results, it could be seen that there was a high degree of wear in the junction between the leading edge of the blade inlet and the hub. There were scattered wear marks in the shroud. In the experiments, the wear at the impeller inlet was mainly concentrated on the leading edge of the blades, especially around the hub side. The red mark on Figure 6 shows the leading edge of the impeller inlet had serious wear. The main reason might be that the particles enter the impeller and move toward the hub due to inertia [44], resulting in more severe wear at the junction of the impeller inlet and the hub than at the shroud. The wear at the impeller inlet was relatively consistent between the simulation and experiments.
The wear comparison at the blade pressure surface is shown in Figure 7 and Figure 8. From the simulation result, it could be seen that the junction of the front half of the blade and the hub showed higher wear. From the leading edge of the blade to the trailing edge, the wear position shifted from the hub to the middle part. The experimental result shows that the blade near the hub side had serious wear, with a worn groove in the middle of the blade. The wear at the impeller was mainly concentrated on the leading edge of the blade closer to the hub side. By comparing Figure 7 and Figure 8, it could be concluded that the wear at the blade pressure surface and impeller outlet was relatively consistent between the simulation and experiments.
The wear comparison at the volute is shown in Figure 9. The simulation result shows that the whole volute wall surface near the shroud was heavily worn. From the second section to the eighth section of the volute, only the volute wall close to the shroud showed wear. In the experimental results, the wear area gradually became larger from the first section to the eighth section. In particular, the middle of the volute wall surface showed the most serious wear. The simulation results were consistent with the experimental results in terms of wear location.

4. Results and Discussion

4.1. Flow Field Analysis

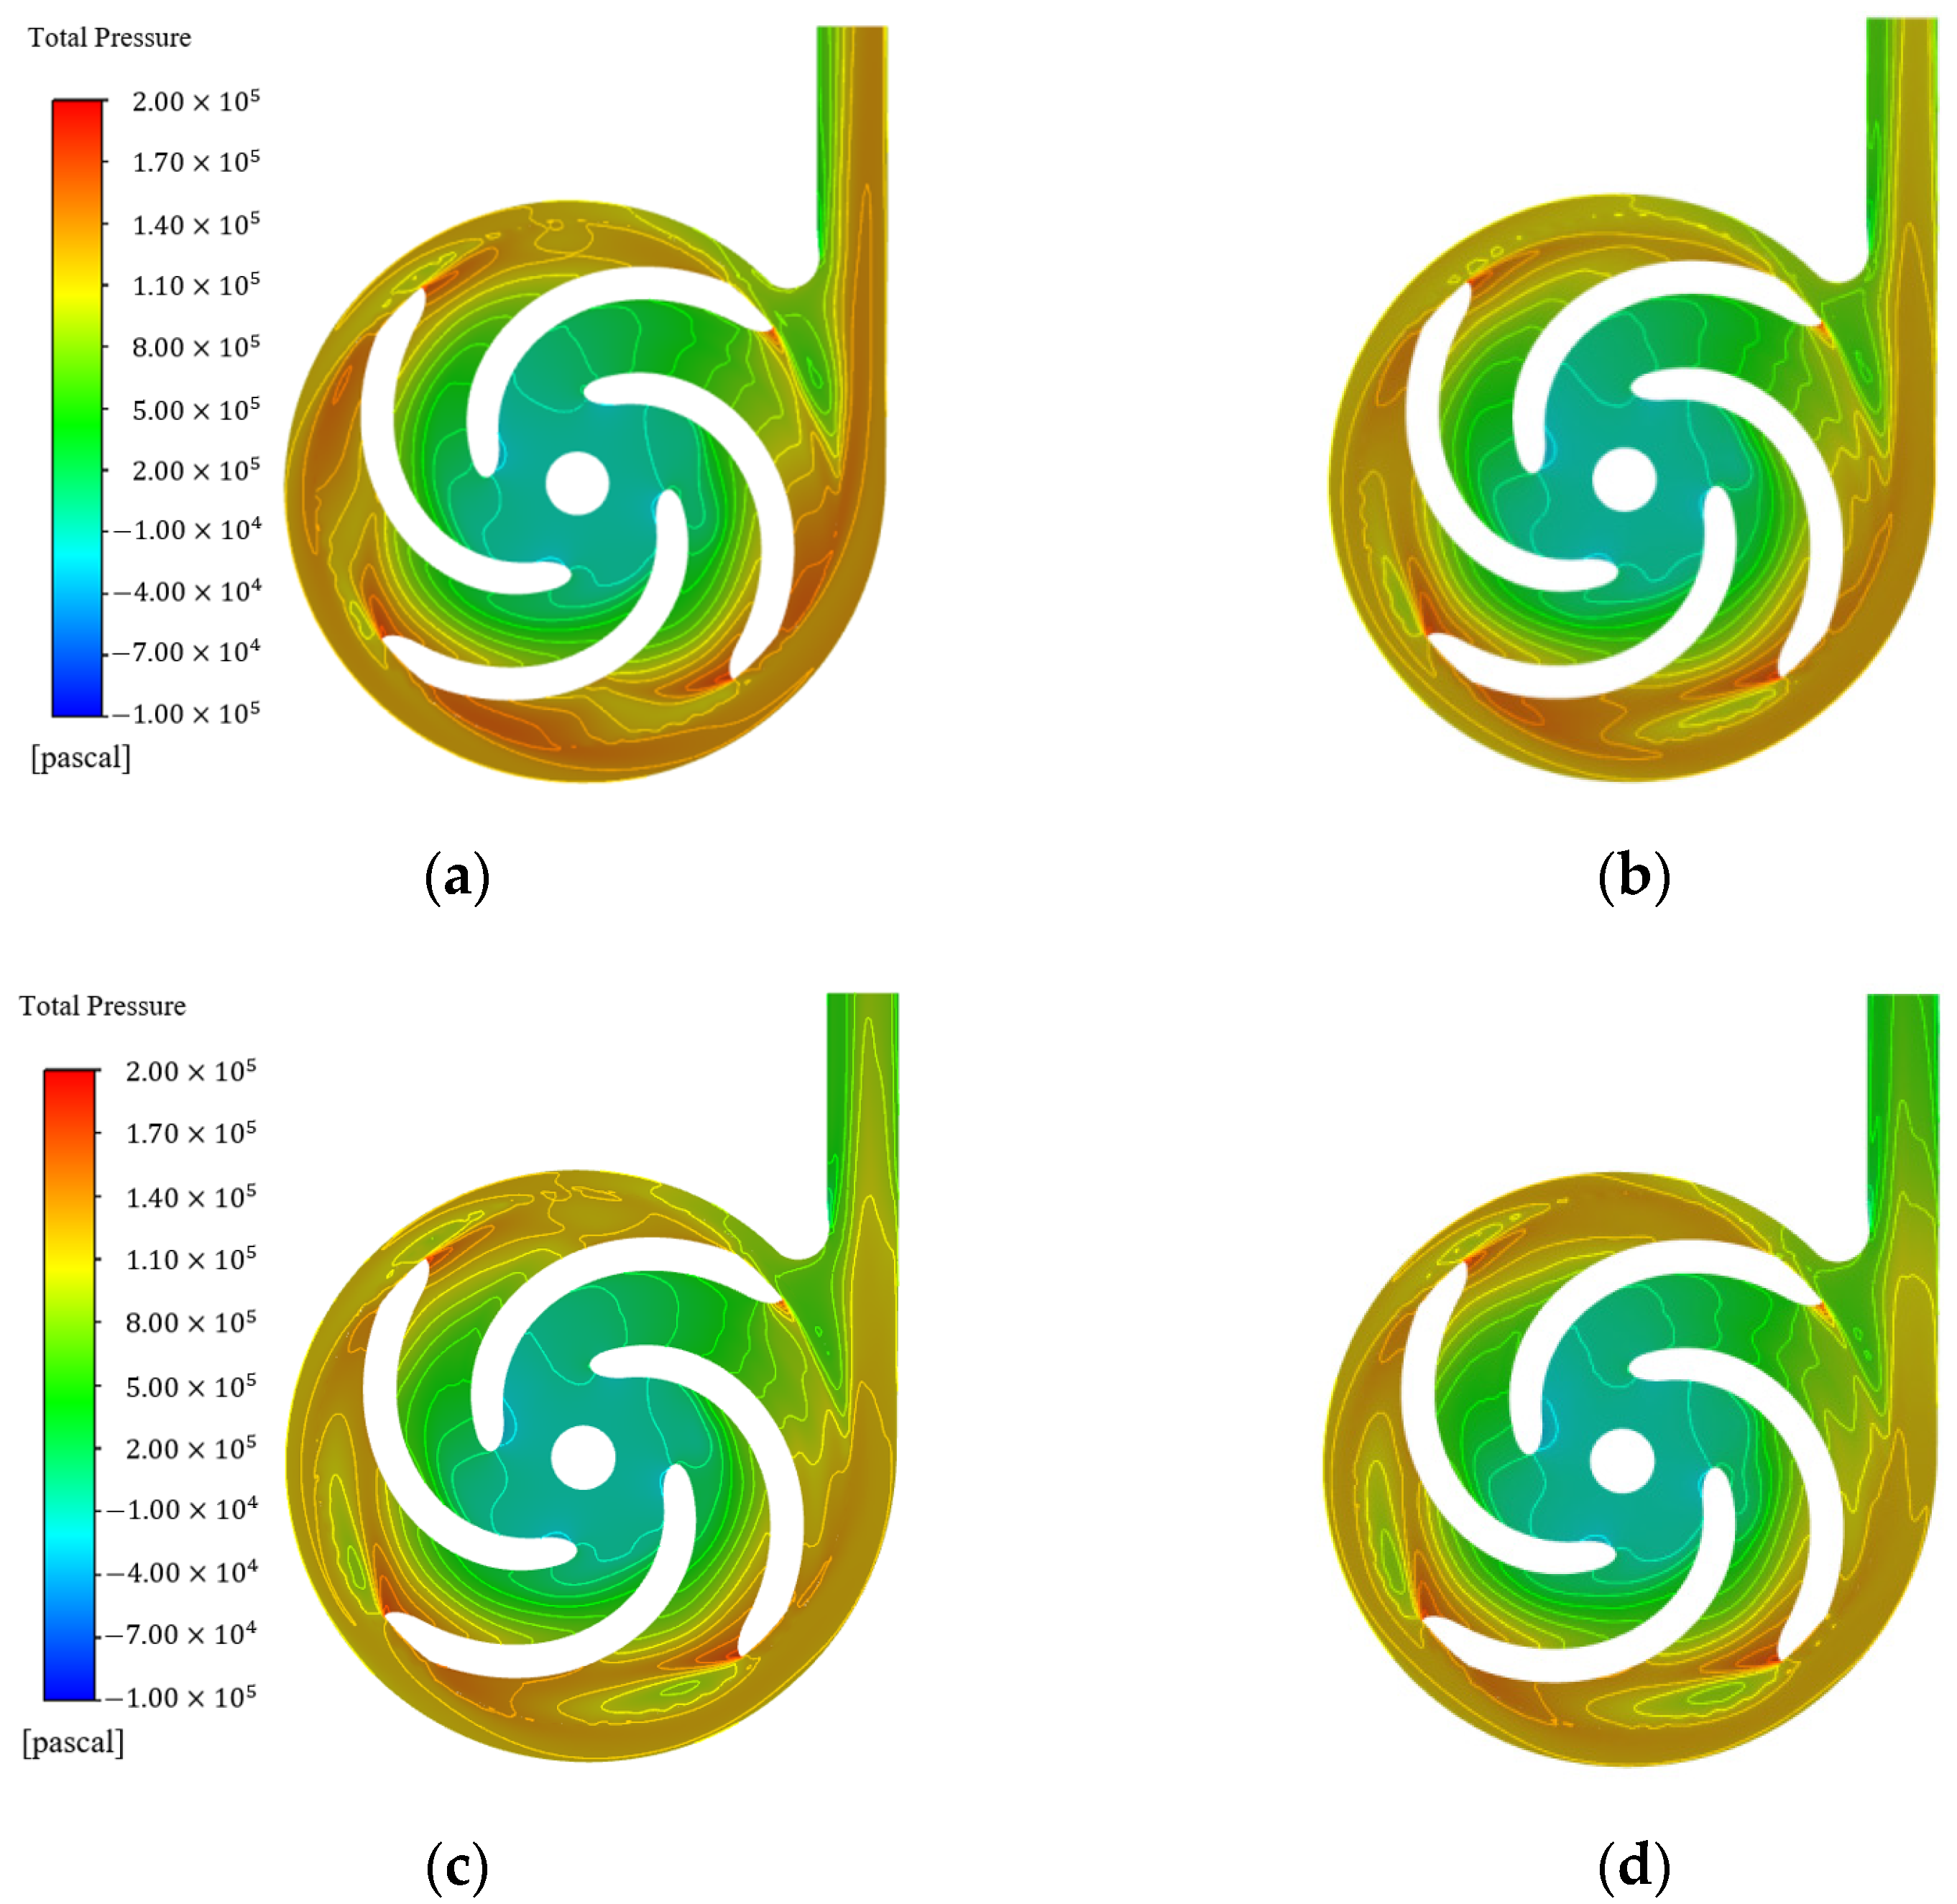
4.1.1. Pressure Distribution

The pressure distribution of the pump cross-section with different solid volume fractions under 1.0QBEP is shown in Figure 10. The term QBEP represents the flow rate of the design operating condition. It was found that the pressure distribution in the cross-section of the volute under different solid volume fractions was relatively similar to the distribution in pure water conditions. The pressure at the impeller passage increased from the inlet to the outlet. Compared with the impeller passage, the pressure inside the volute was more influenced by the solid–liquid two-phase flow. A certain degree of pressure drop in the volute was caused by the presence of solid particles. As the solid volume fraction increased, the particles in the volute hit the wall more frequently, resulting in a large amount of energy loss. Therefore, the total pressure of the liquid that entrained with particles gradually decreased. Especially when the solid volume fraction was 15%, there was a more significant drop of the outlet pressure in the volute outlet diffusion section.

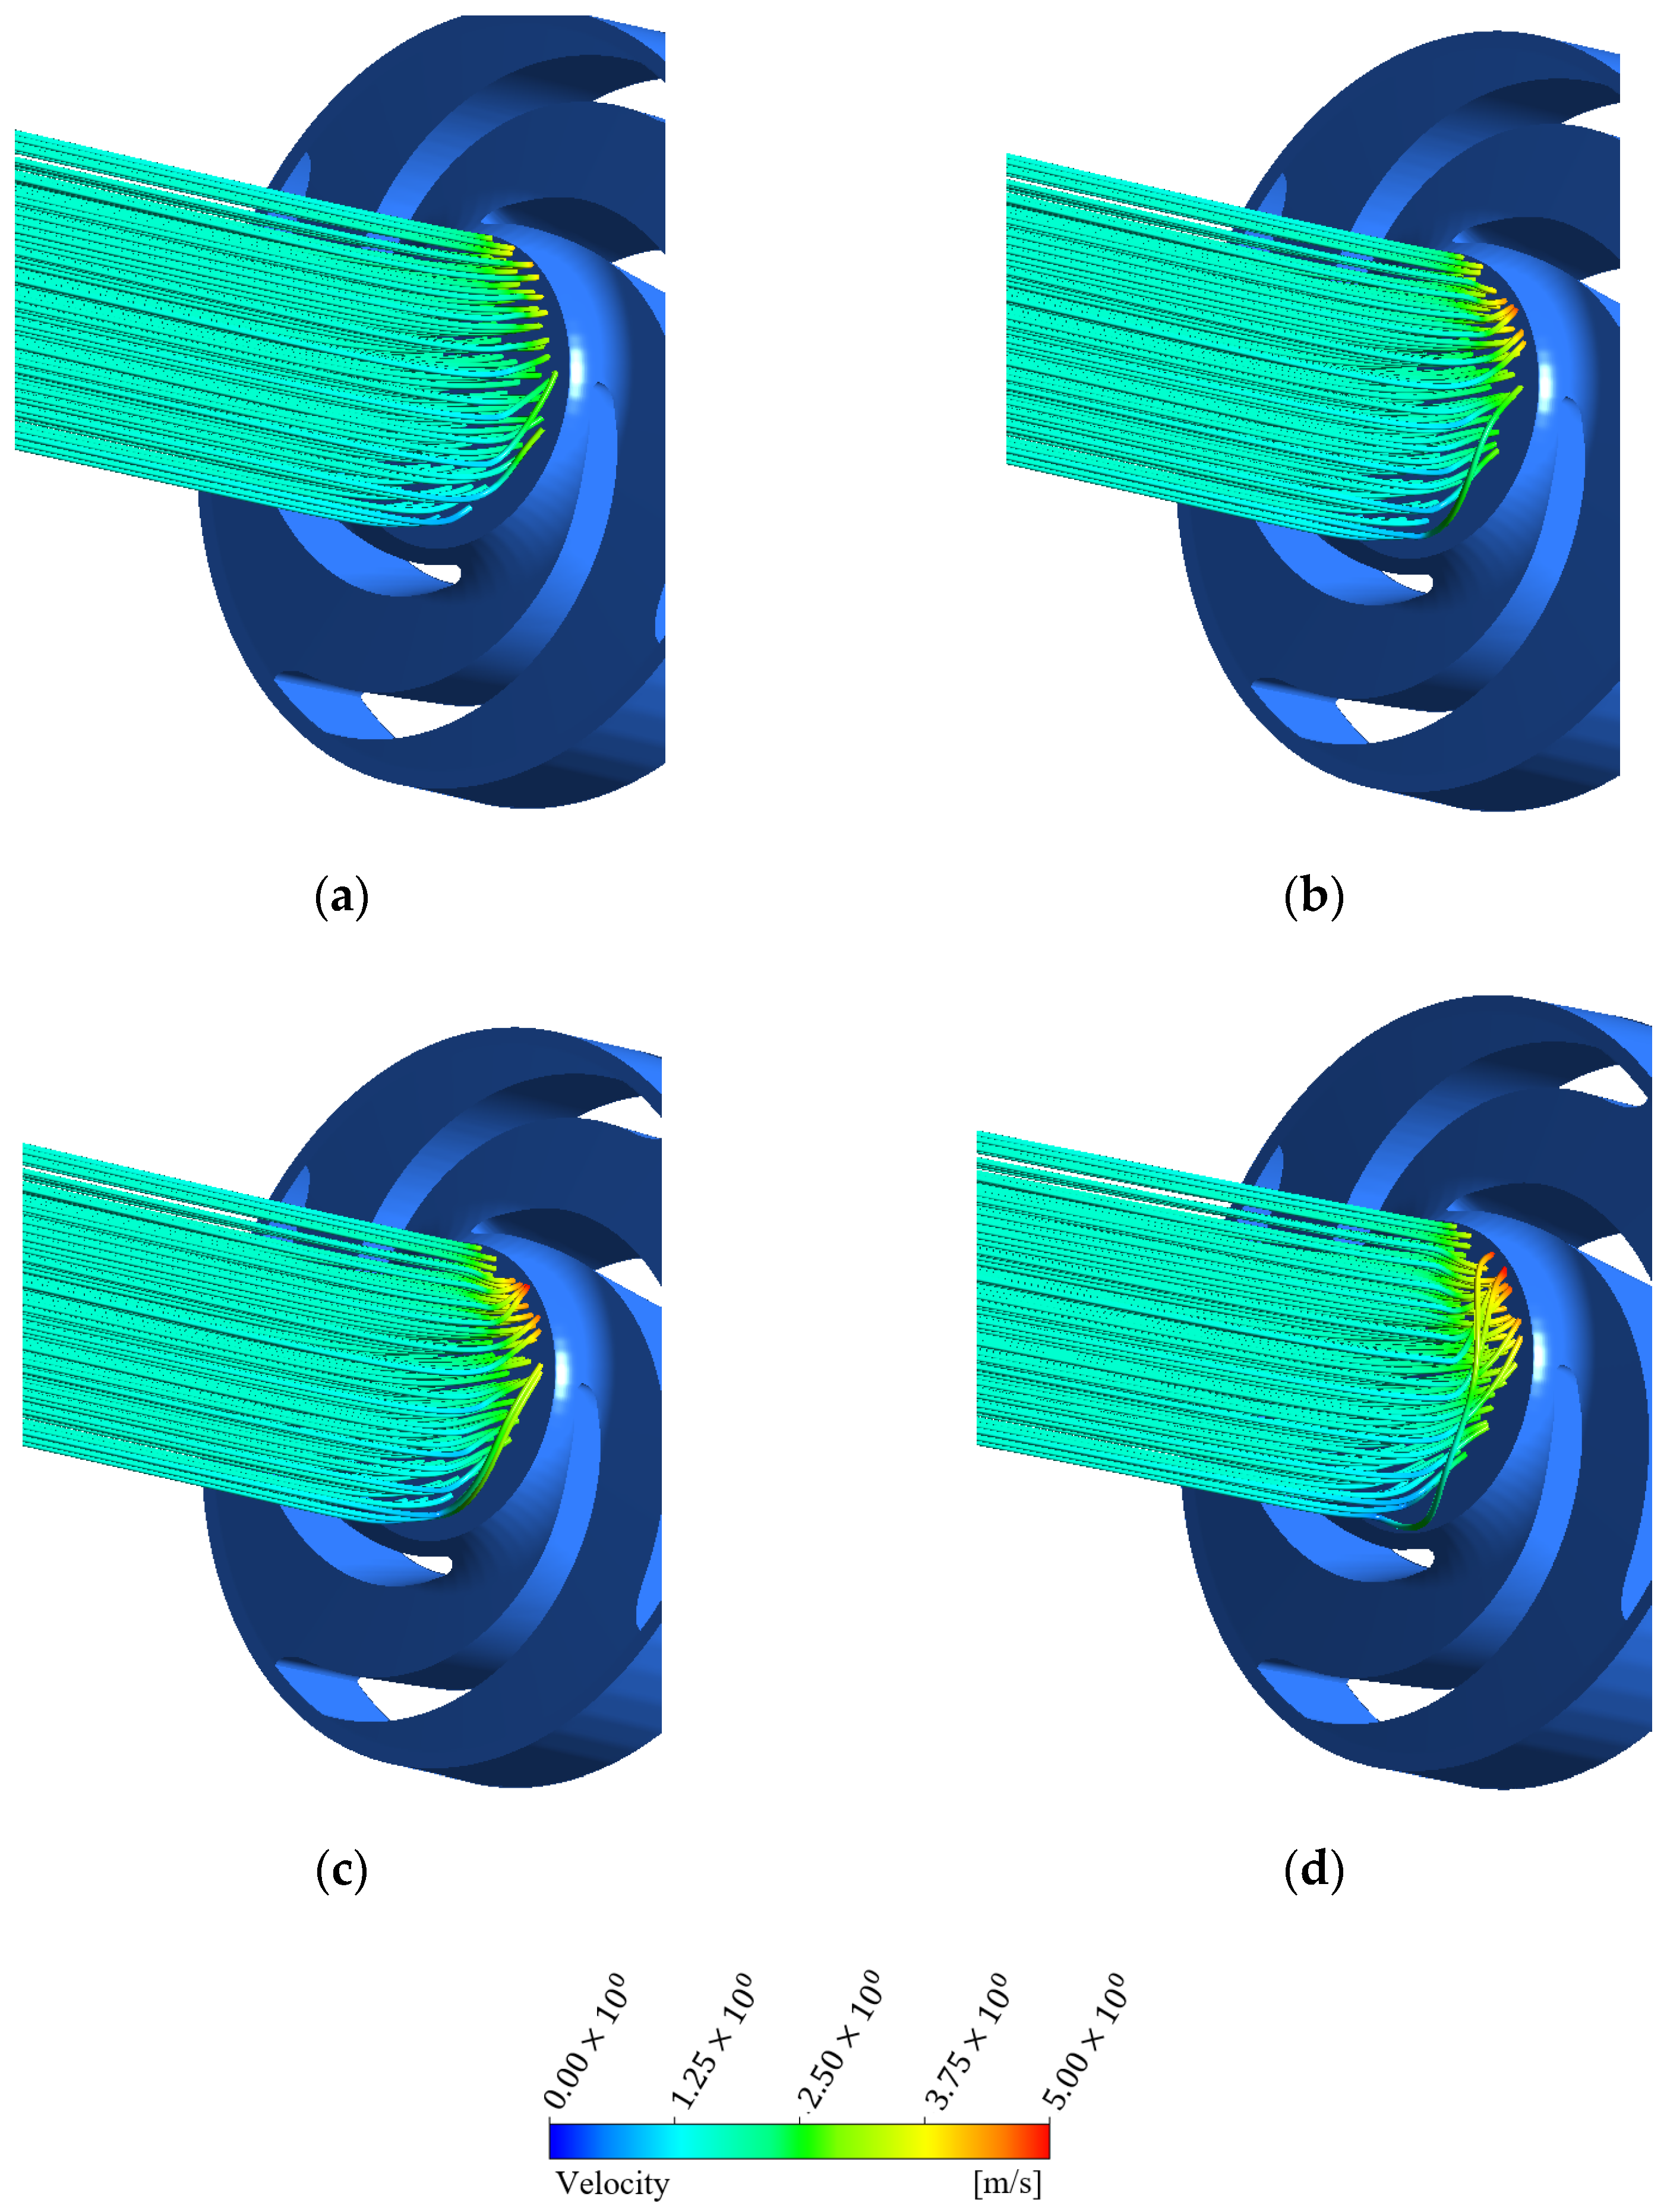
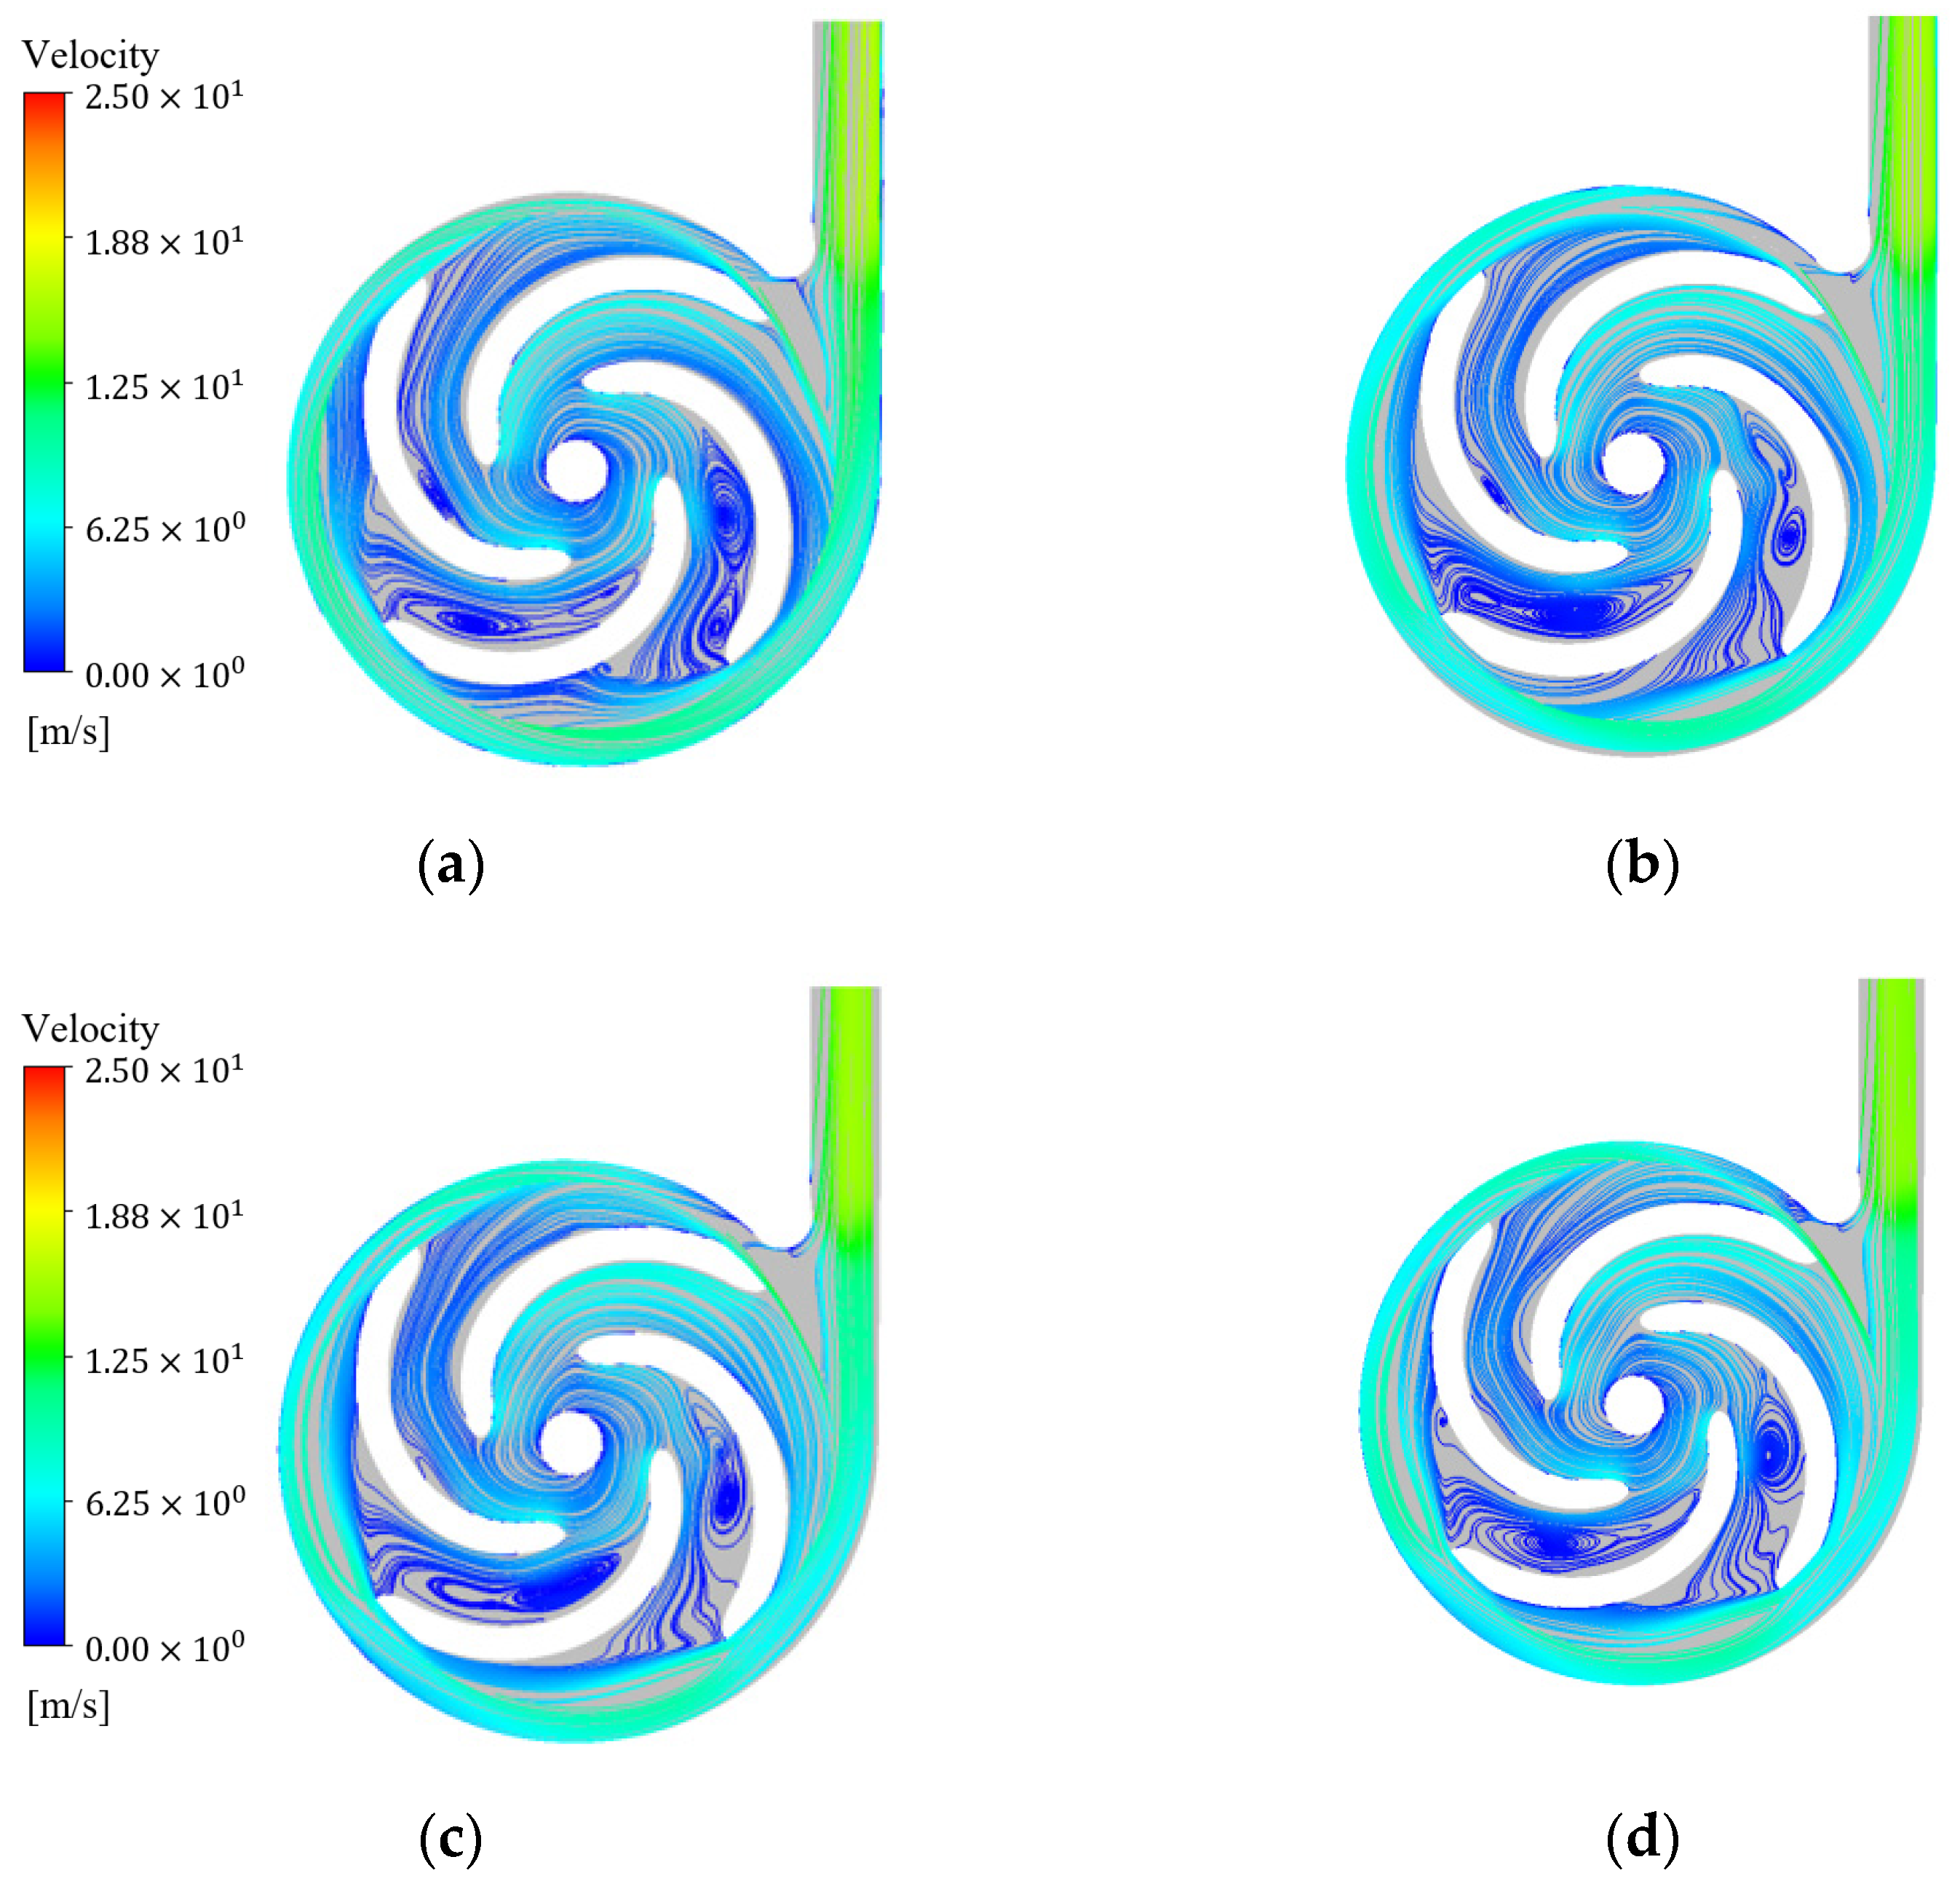
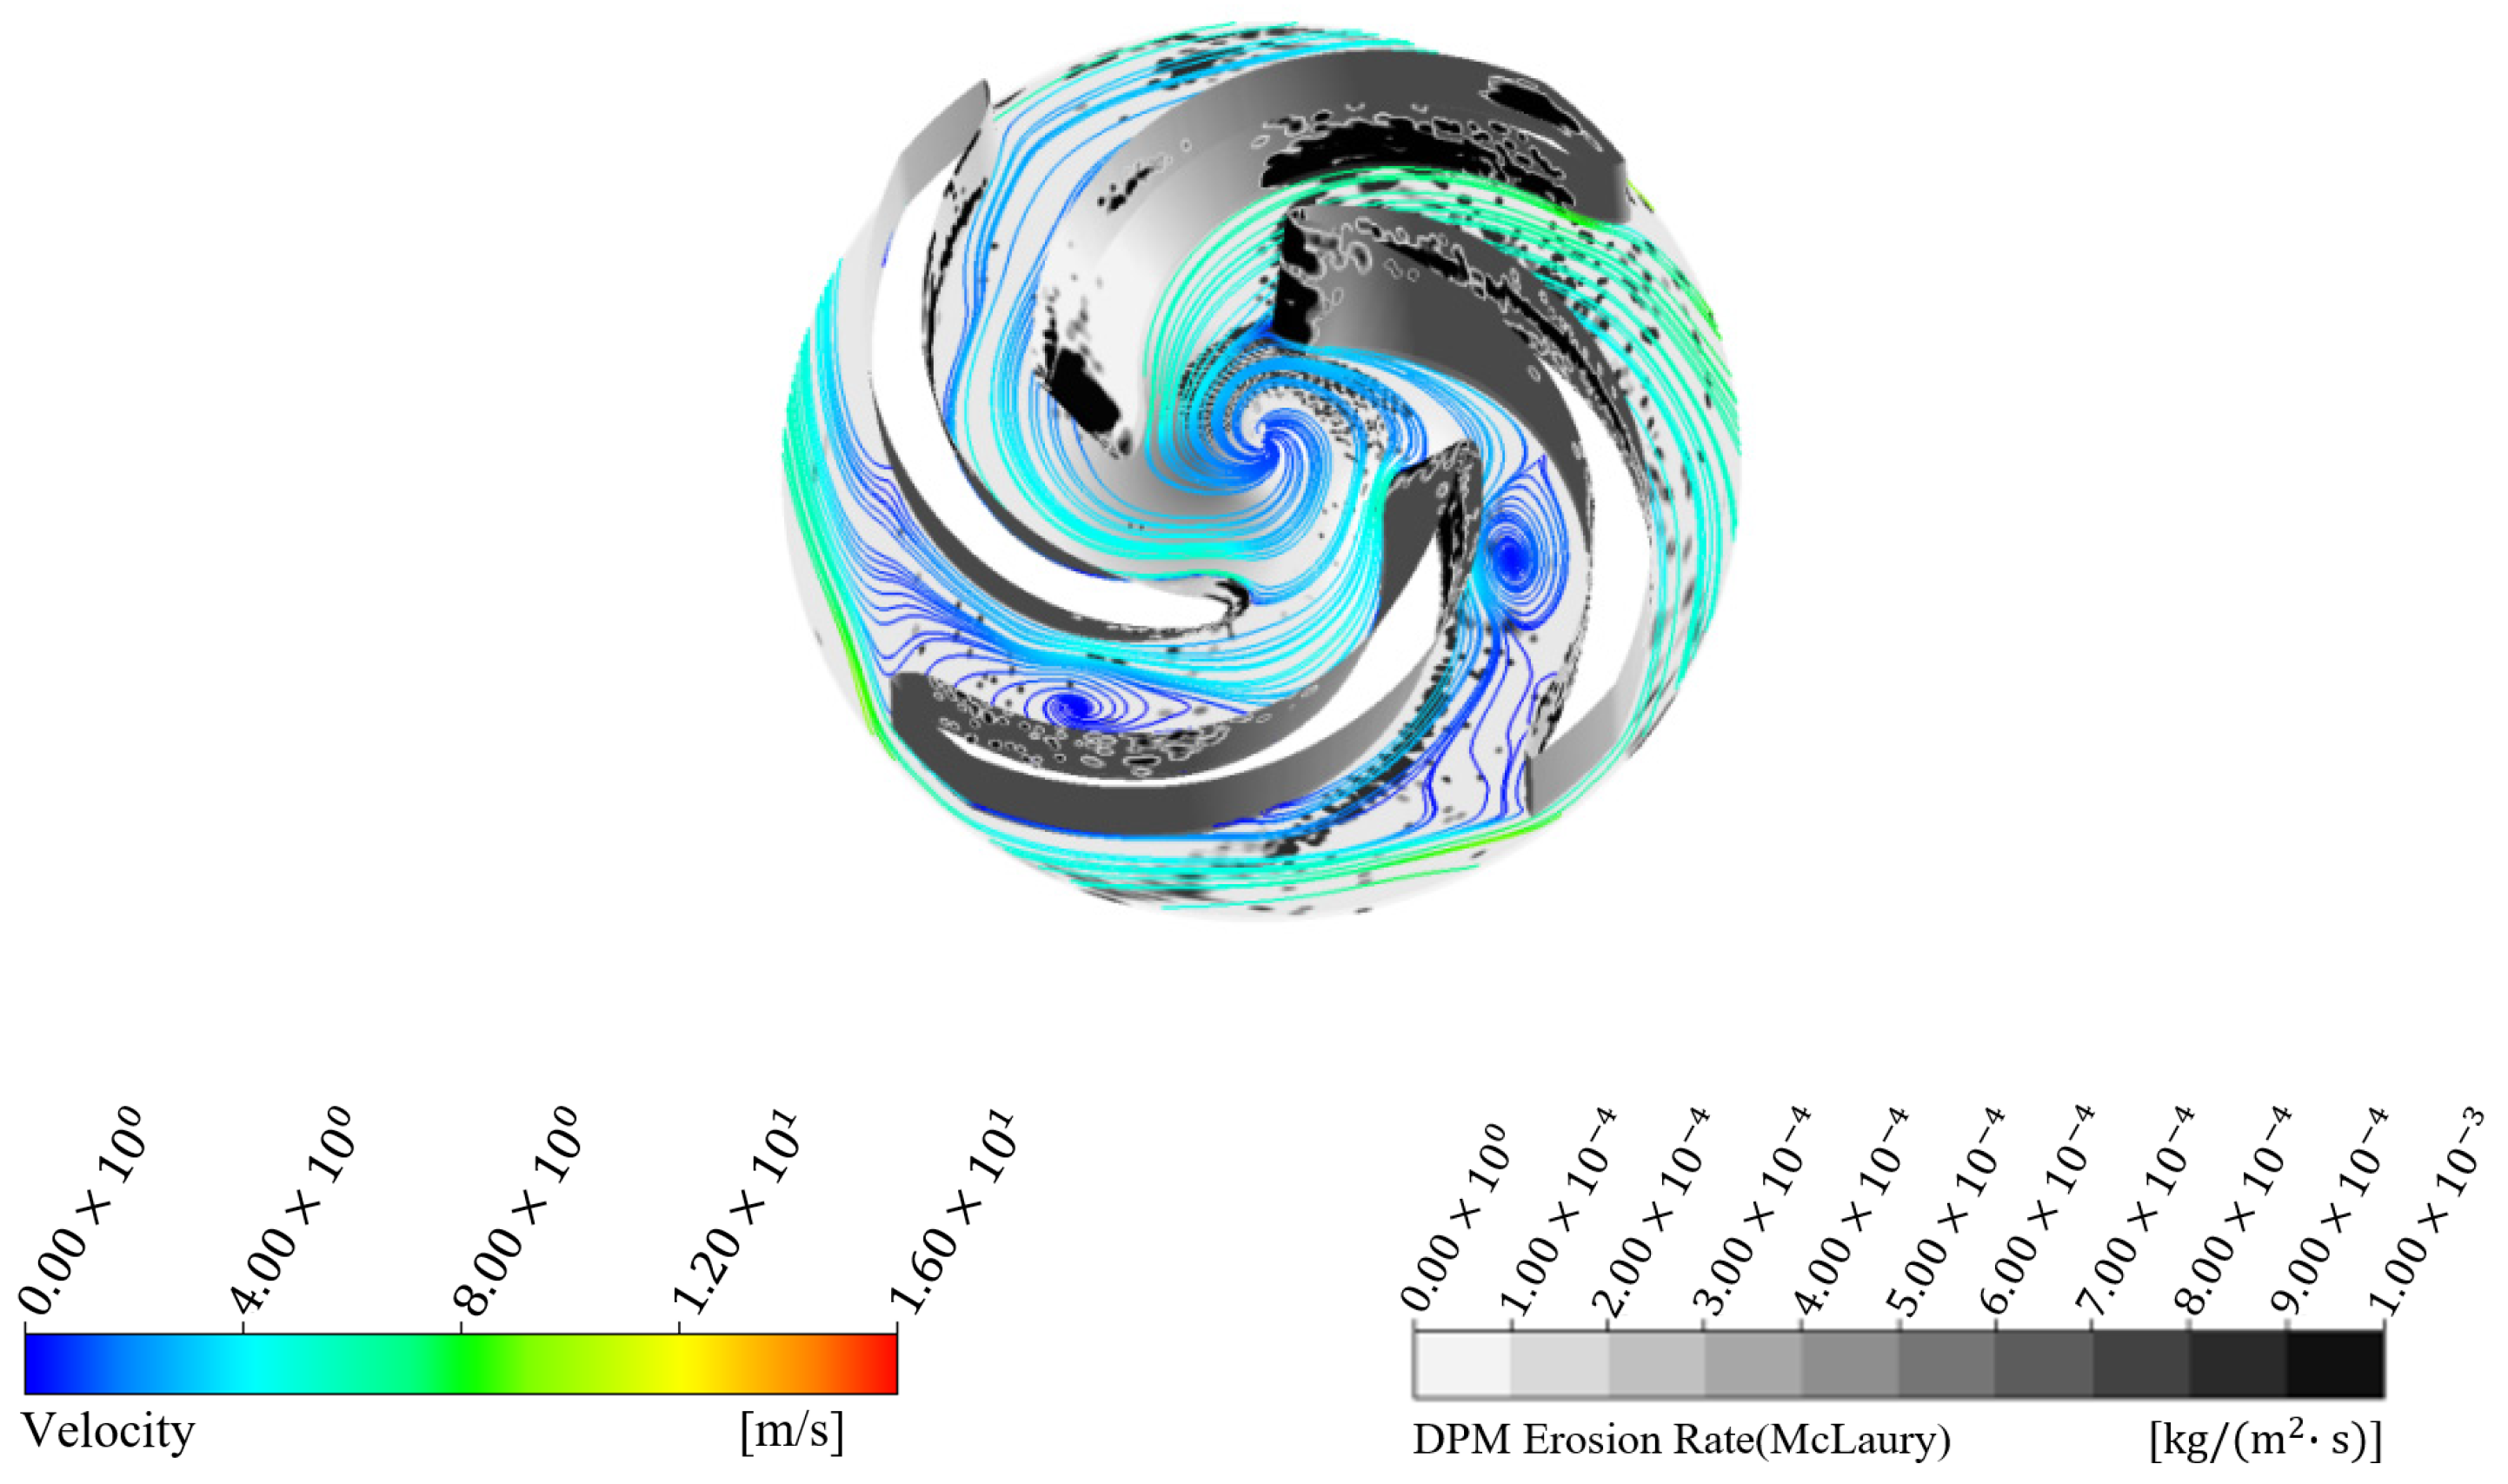
4.1.2. Velocity Streamlines

The inlet section streamline distributions of the slurry pump at 0%, 5%, 10%, and 15% solid volume fraction with particles of 0.6 mm diameter under 1.0QBEP are shown in Figure 11. Under the pure water conditions, the liquid entering the impeller would be affected by the rotation of the impeller. The original axial flow then became radial flow due to the impeller rotating effects. Slight prewhirl occurred at the impeller inlet section and its direction was consistent with the direction of impeller rotation. When particles were added to the liquid, the particles improved the viscosity of the medium. The backflow at the front chamber was intensified, and the prewhirl was strengthened. Thus, the ability of the impeller to drive the prewhirl near the inlet was enhanced compared with pure water conditions. As solid volume fraction increased, the prewhirl became more intense. Under the 15% solid volume fraction condition, there was a stronger prewhirl in the impeller inlet.
The velocity streamline distributions in the cross-section under different solid volume fraction are shown in Figure 12. Similar to the pure water conditions, the velocity of the flow field increased from the impeller inlet to the outlet. In the impeller passage near the suction surface, a large vortex appeared. Compared with the pure water conditions, there was a decreasing trend of the vortex strength in the impeller passage under the solid–liquid condition. The reason might be that the total mass of the particles is larger, so the liquid rotational motion needs to overcome the larger inertia of particle motion with more energy consuming. The vortex development is somewhat inhibited by particle motion. Under the design operating conditions, the velocity streamline distributions at the cross-section of the volute was approximately identical under different solid volume fractions. There were more streamlines back into the spiral section passage at the location of the volute tongue. Due to the large inertia of particle motion and more frequent collision between the particles and the wall, a certain flow separation occurred at the downstream of the volute diffusion section. The flow separation was more serious under the larger solid volume fraction.
The inter-impeller vortex started from the pressure surface near the leading edge of the blade. With the liquid movement in the impeller passage, the vortex developed to the trailing of the suction surface [44]. The blade flow separation led to the occurrence of the inter-impeller vortex. The vortex clockwise direction rotation in the impeller passage is shown in Figure 13. The inter-impeller vortex had a large impact on the particle trajectory. The particles were subjected to great resistance at the leading edge of the pressure surface. Thus, the particles hit the wall at the leading edge of the pressure surface. The wear range of the pressure surface was concentrated on the leading edge, and the degree was slight. The particles were affected by the vortex at the suction surface and hit the wall more frequently. Therefore, the wear of the suction surface concentrated on the middle and rear of the suction surface, and the degree of wear was larger. Compared with other impeller passages without vortex, the impeller passages with the strong vortex showed less wear. It is because the blockage of the impeller passages by the vortex causes fewer particles to flow through the impeller passage, resulting in less frequent particle collision with the wall.

4.2. Wear Analysis

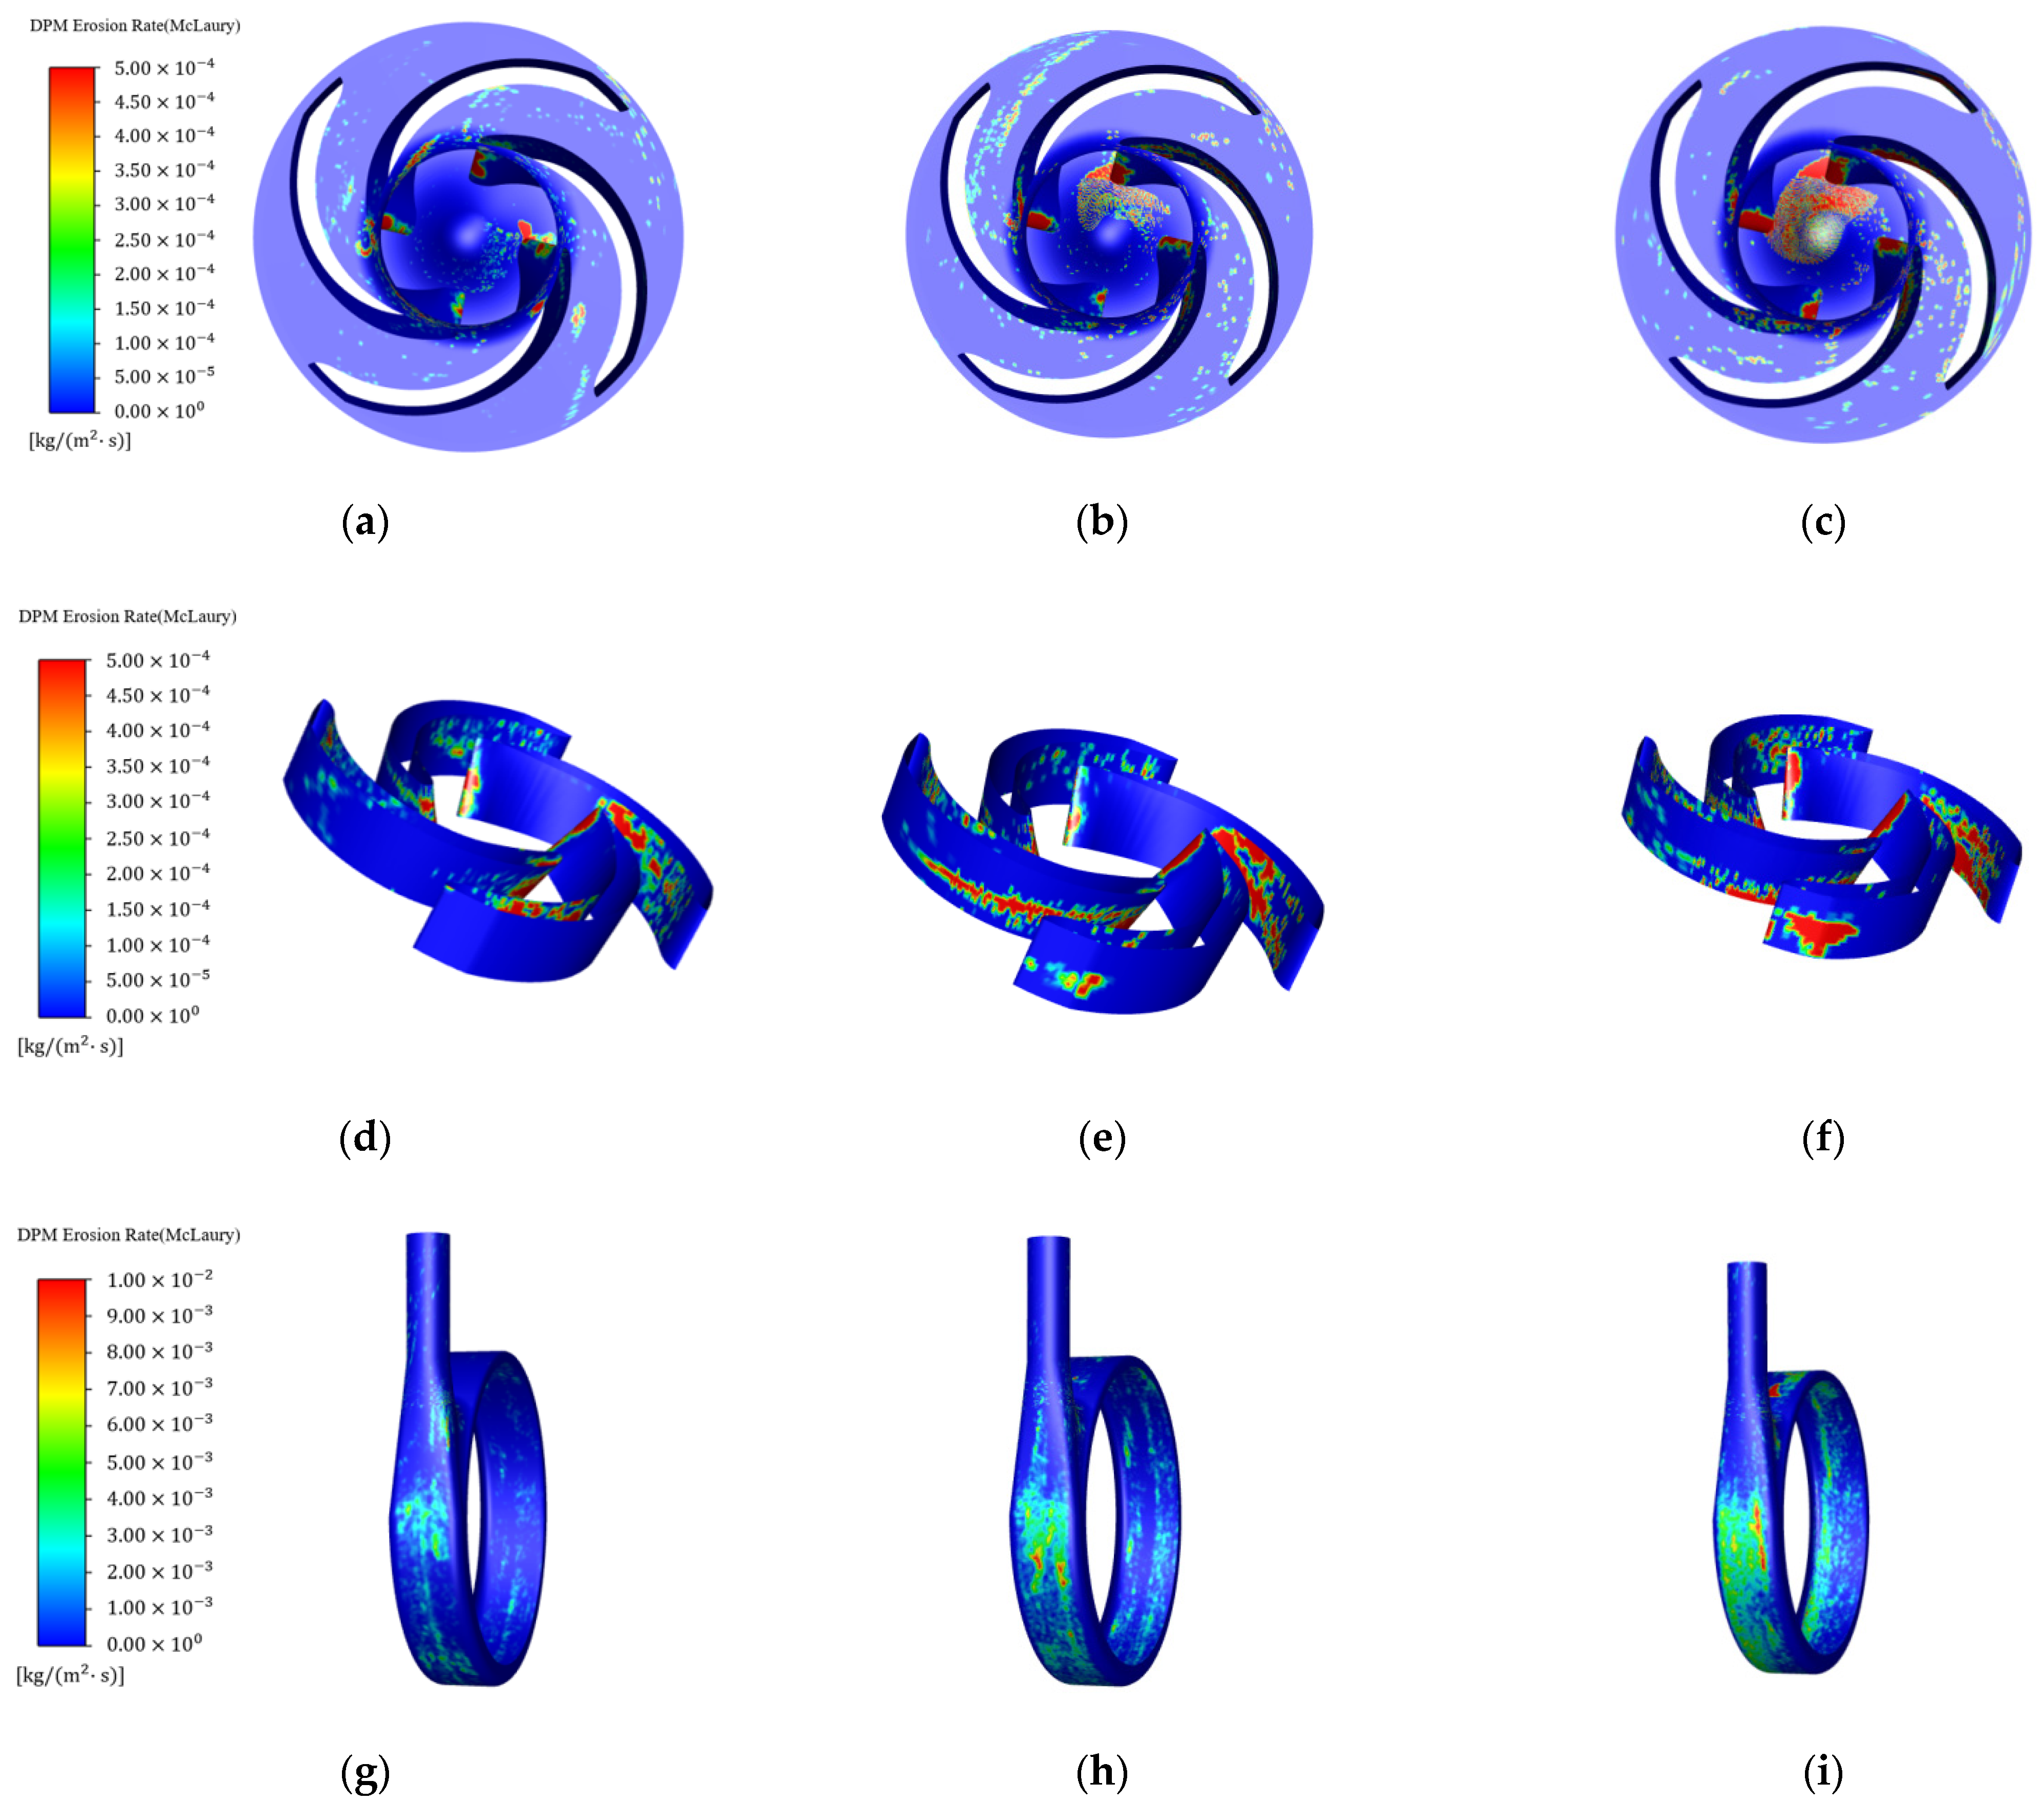
4.2.1. Effects of Volume Flow Rates

Figure 14 shows the pump head and efficiency under different volume flow rates. The pump performance curve under pure water and 5% solid volume fraction conditions were compared. With particles, the head and efficiency drop faster than under pure water conditions. The reason might be that with the increase in the volume flow rate, the collisions between the particles and between the particles and the wall cause additional energy losses. The impeller consumes more energy under the solid–liquid two-phase flow condition. Figure 15 shows the wear distribution of each part under different volume flow rates, with a particle diameter of 0.6 mm and solid volume fraction of 5%. As the volume flow rate increased, the wear range and degree of the impeller inlet became significantly larger. Remarkable wear appeared at the blade leading edge and the shroud. The wear on the blades near the hub was larger than at other parts. The reason might be as the volume flow rate increased, the flow velocity increased, and more solid particles move with the liquid from the shroud to the hub [44].

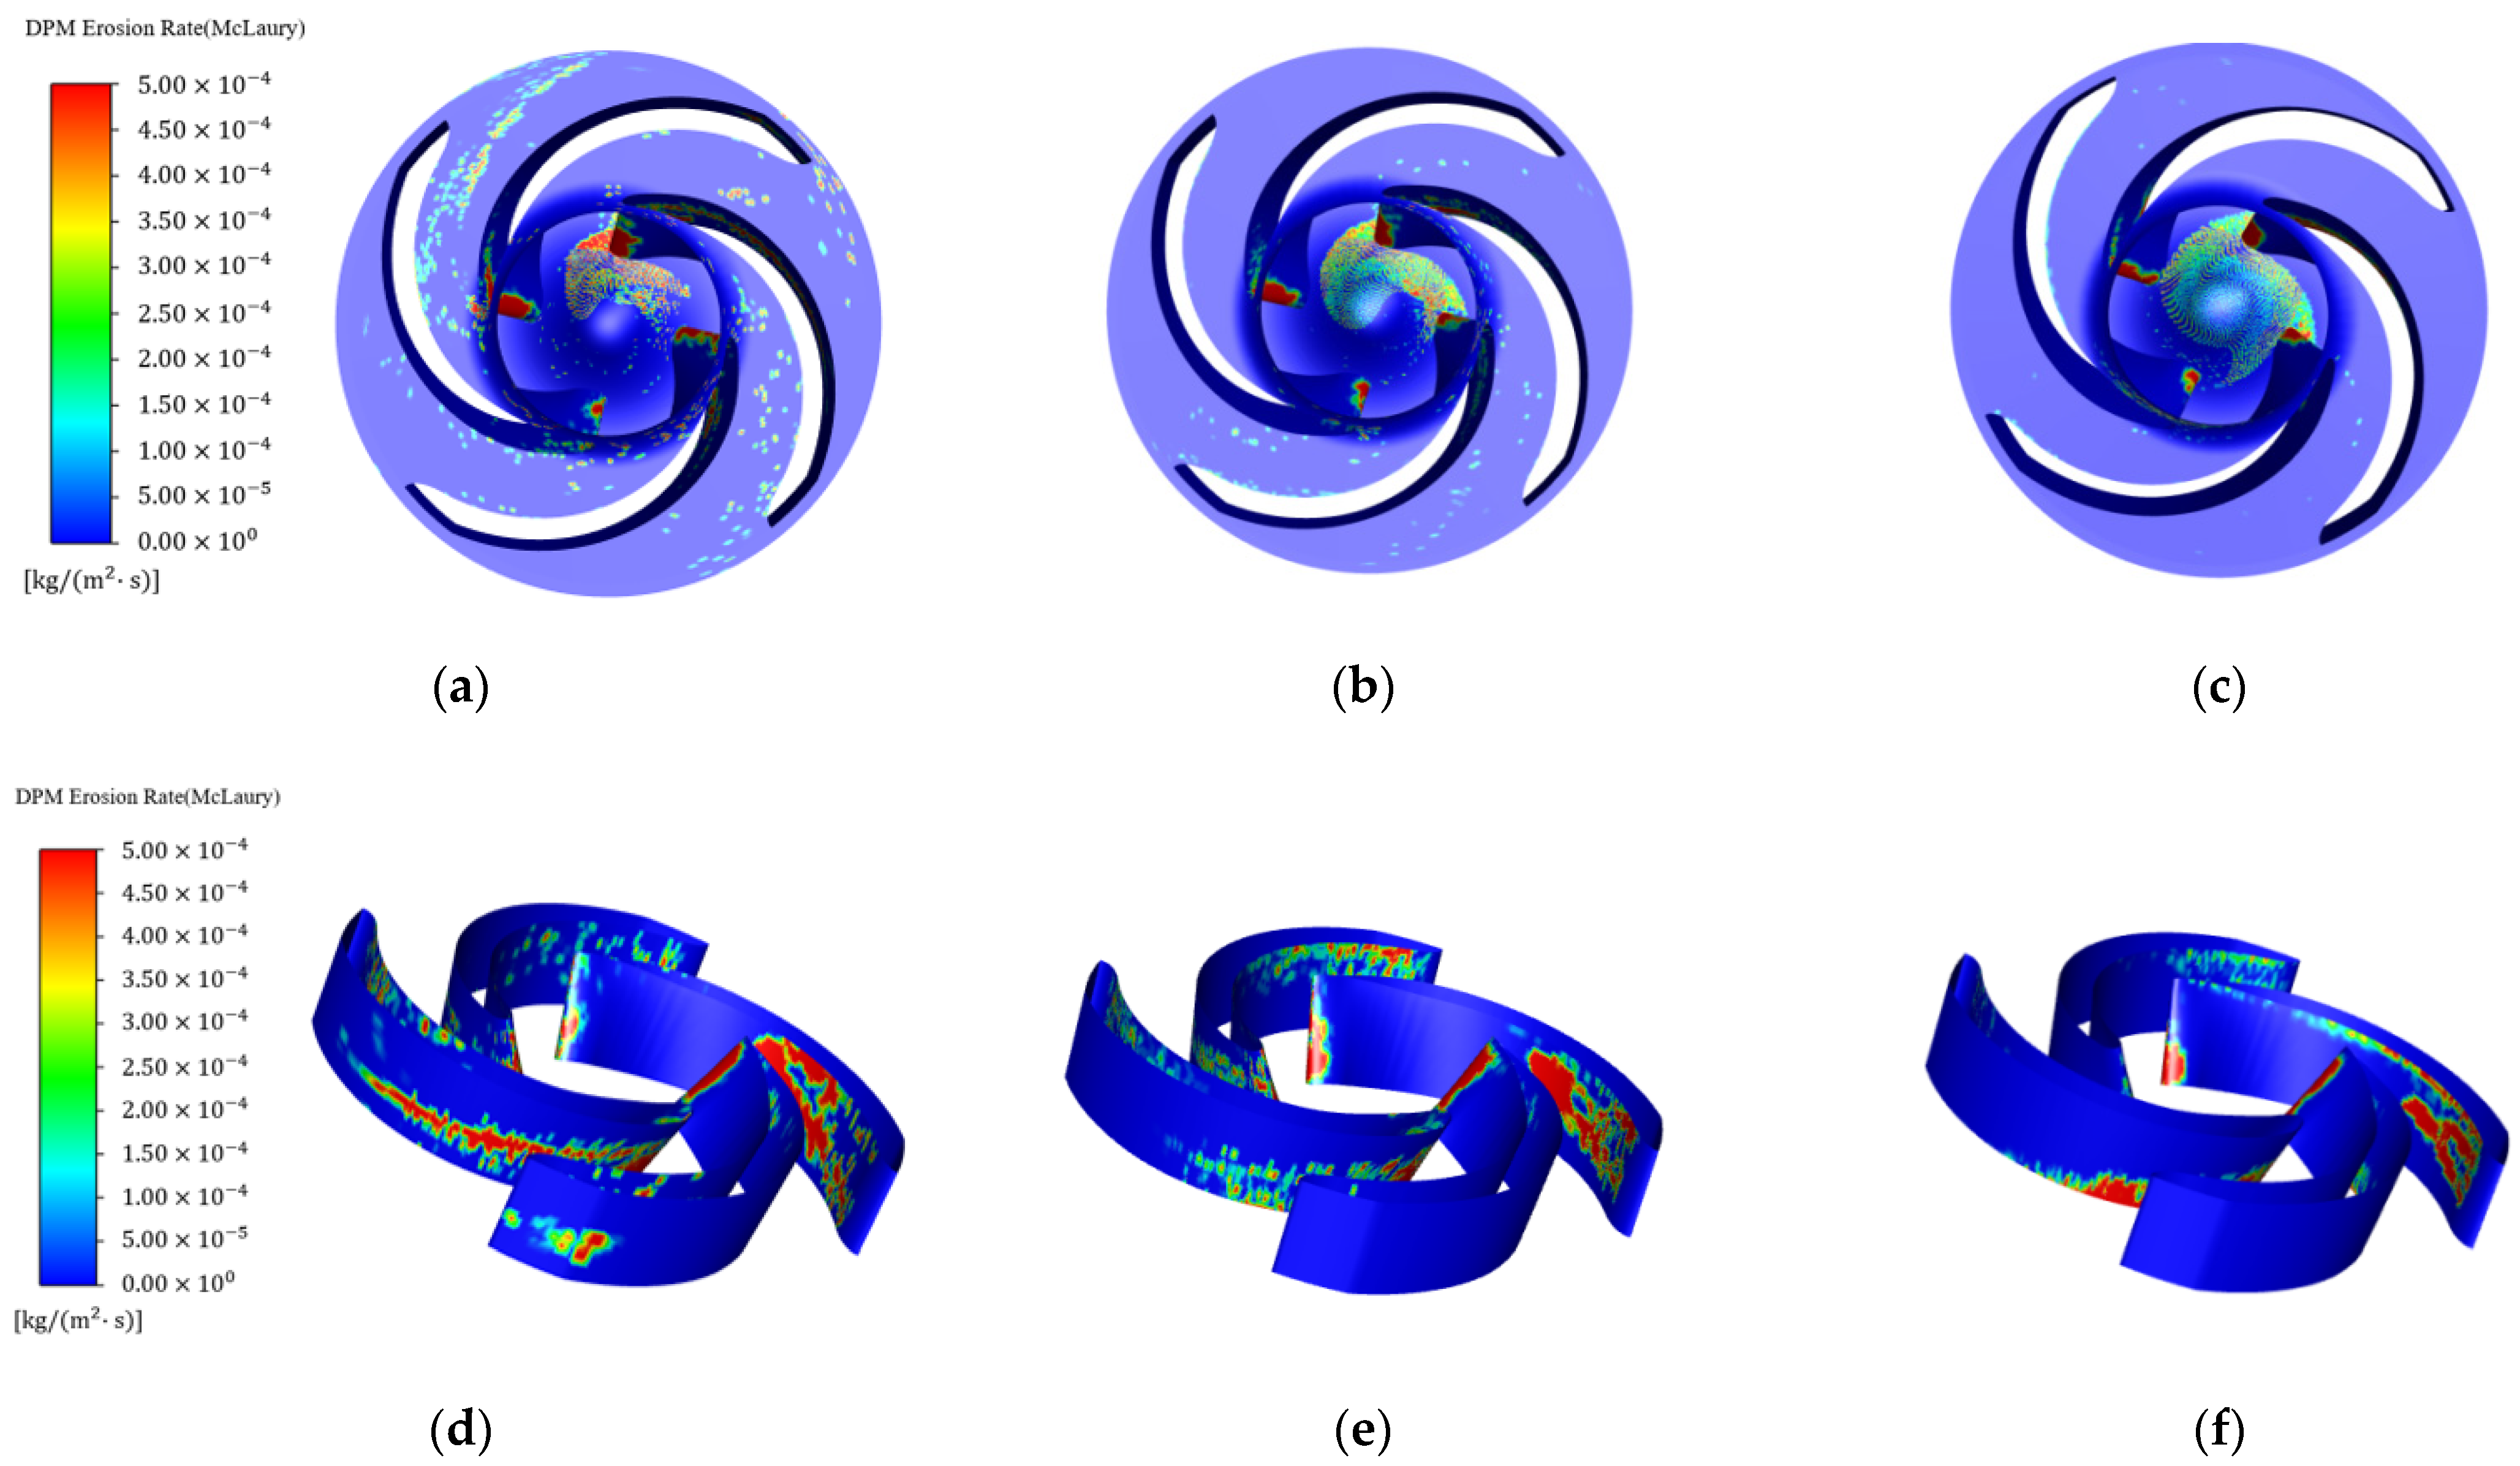
4.2.2. Effects of Particle Diameters

The comparisons of pump head and efficiency with different particle diameters (dp = 1.0 mm, dp = 0.8 mm, dp = 0.6 mm, dp = 0.3 mm, dp = 0.15 mm, and dp = 0.1 mm) under 5% solid volume fraction are shown in Figure 16. The particle diameter shows limited effects of on the head and efficiency. Because the particle volume fraction keeps as a constant of 5%, the total mass of the particles is still same. In addition, the increase in particle diameter led to the reduction of the particle number for the same volume fraction. The negative impact on increasing particle diameter on the pump head and efficiency is offset. Therefore, under the same small volume fraction, particle diameter had relatively limited influence on the external characteristics of the pump.
Figure 17 shows the wear distribution of each part under different particle diameters, with volume flow rate of 26 m3/h and solid volume fraction of 5%. When the solid particles entered the impeller, they were affected by the inertia and blade displacement, which caused the collision between the particles and the hub at the impeller inlet. With the increase in particle diameters, the wear range of the impeller inlet became significantly smaller, but the wear degree was markedly larger. Moreover, there was an increase in degree of wear on the blade leading edge. The wear at the pressure surface was changed from closer to the shroud to closer to the hub. Because of the increase in particle diameter, the particle mass increased, resulting in a stronger centrifugal force on the particles. It led to a larger wear range and more severe wear on the pressure surface and the hub. There was more wear on the entire volute wall surface near the shroud. As the particle diameter became smaller, the entire volute wall wear area moved closer to the hub. The reason might be that as the particle diameter decreased, the inertia of the particles is smaller and the influence of the liquid centrifugal force on the solid particles was reduced.

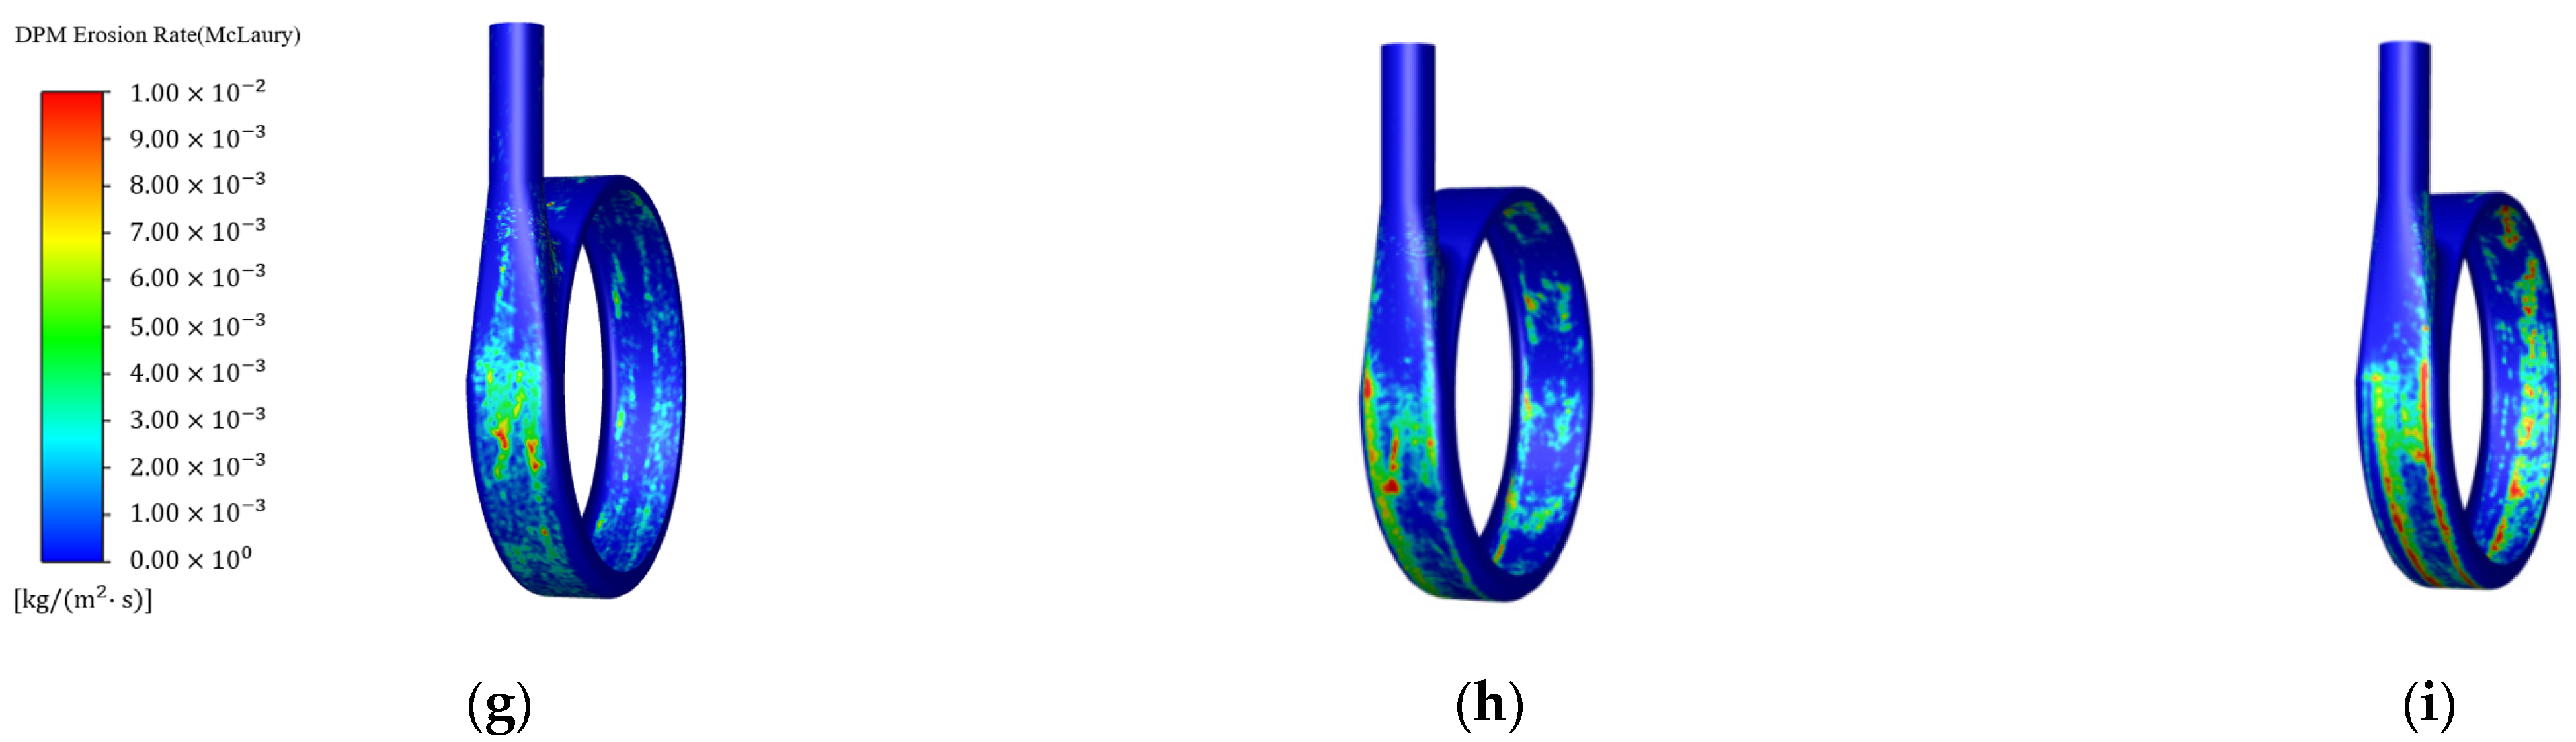
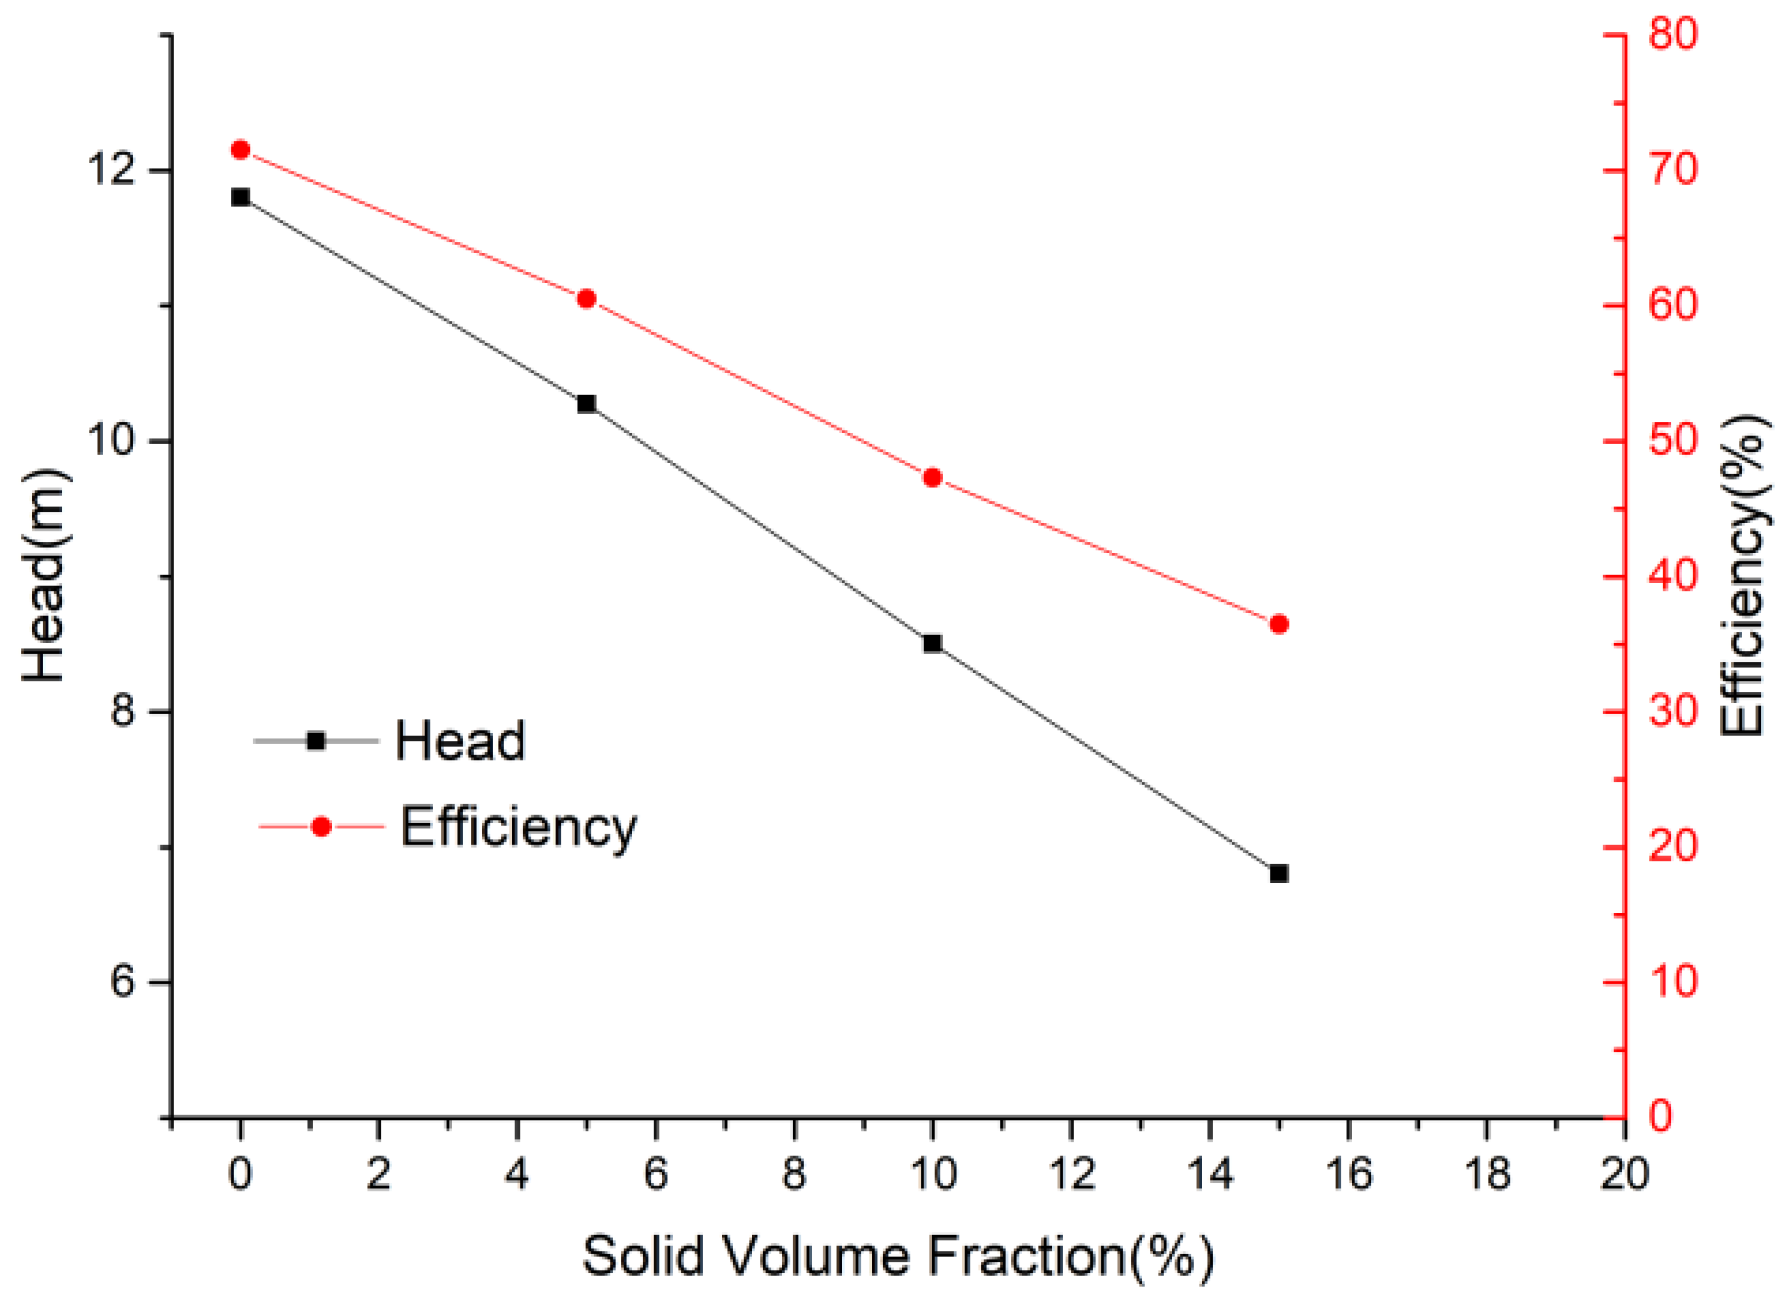
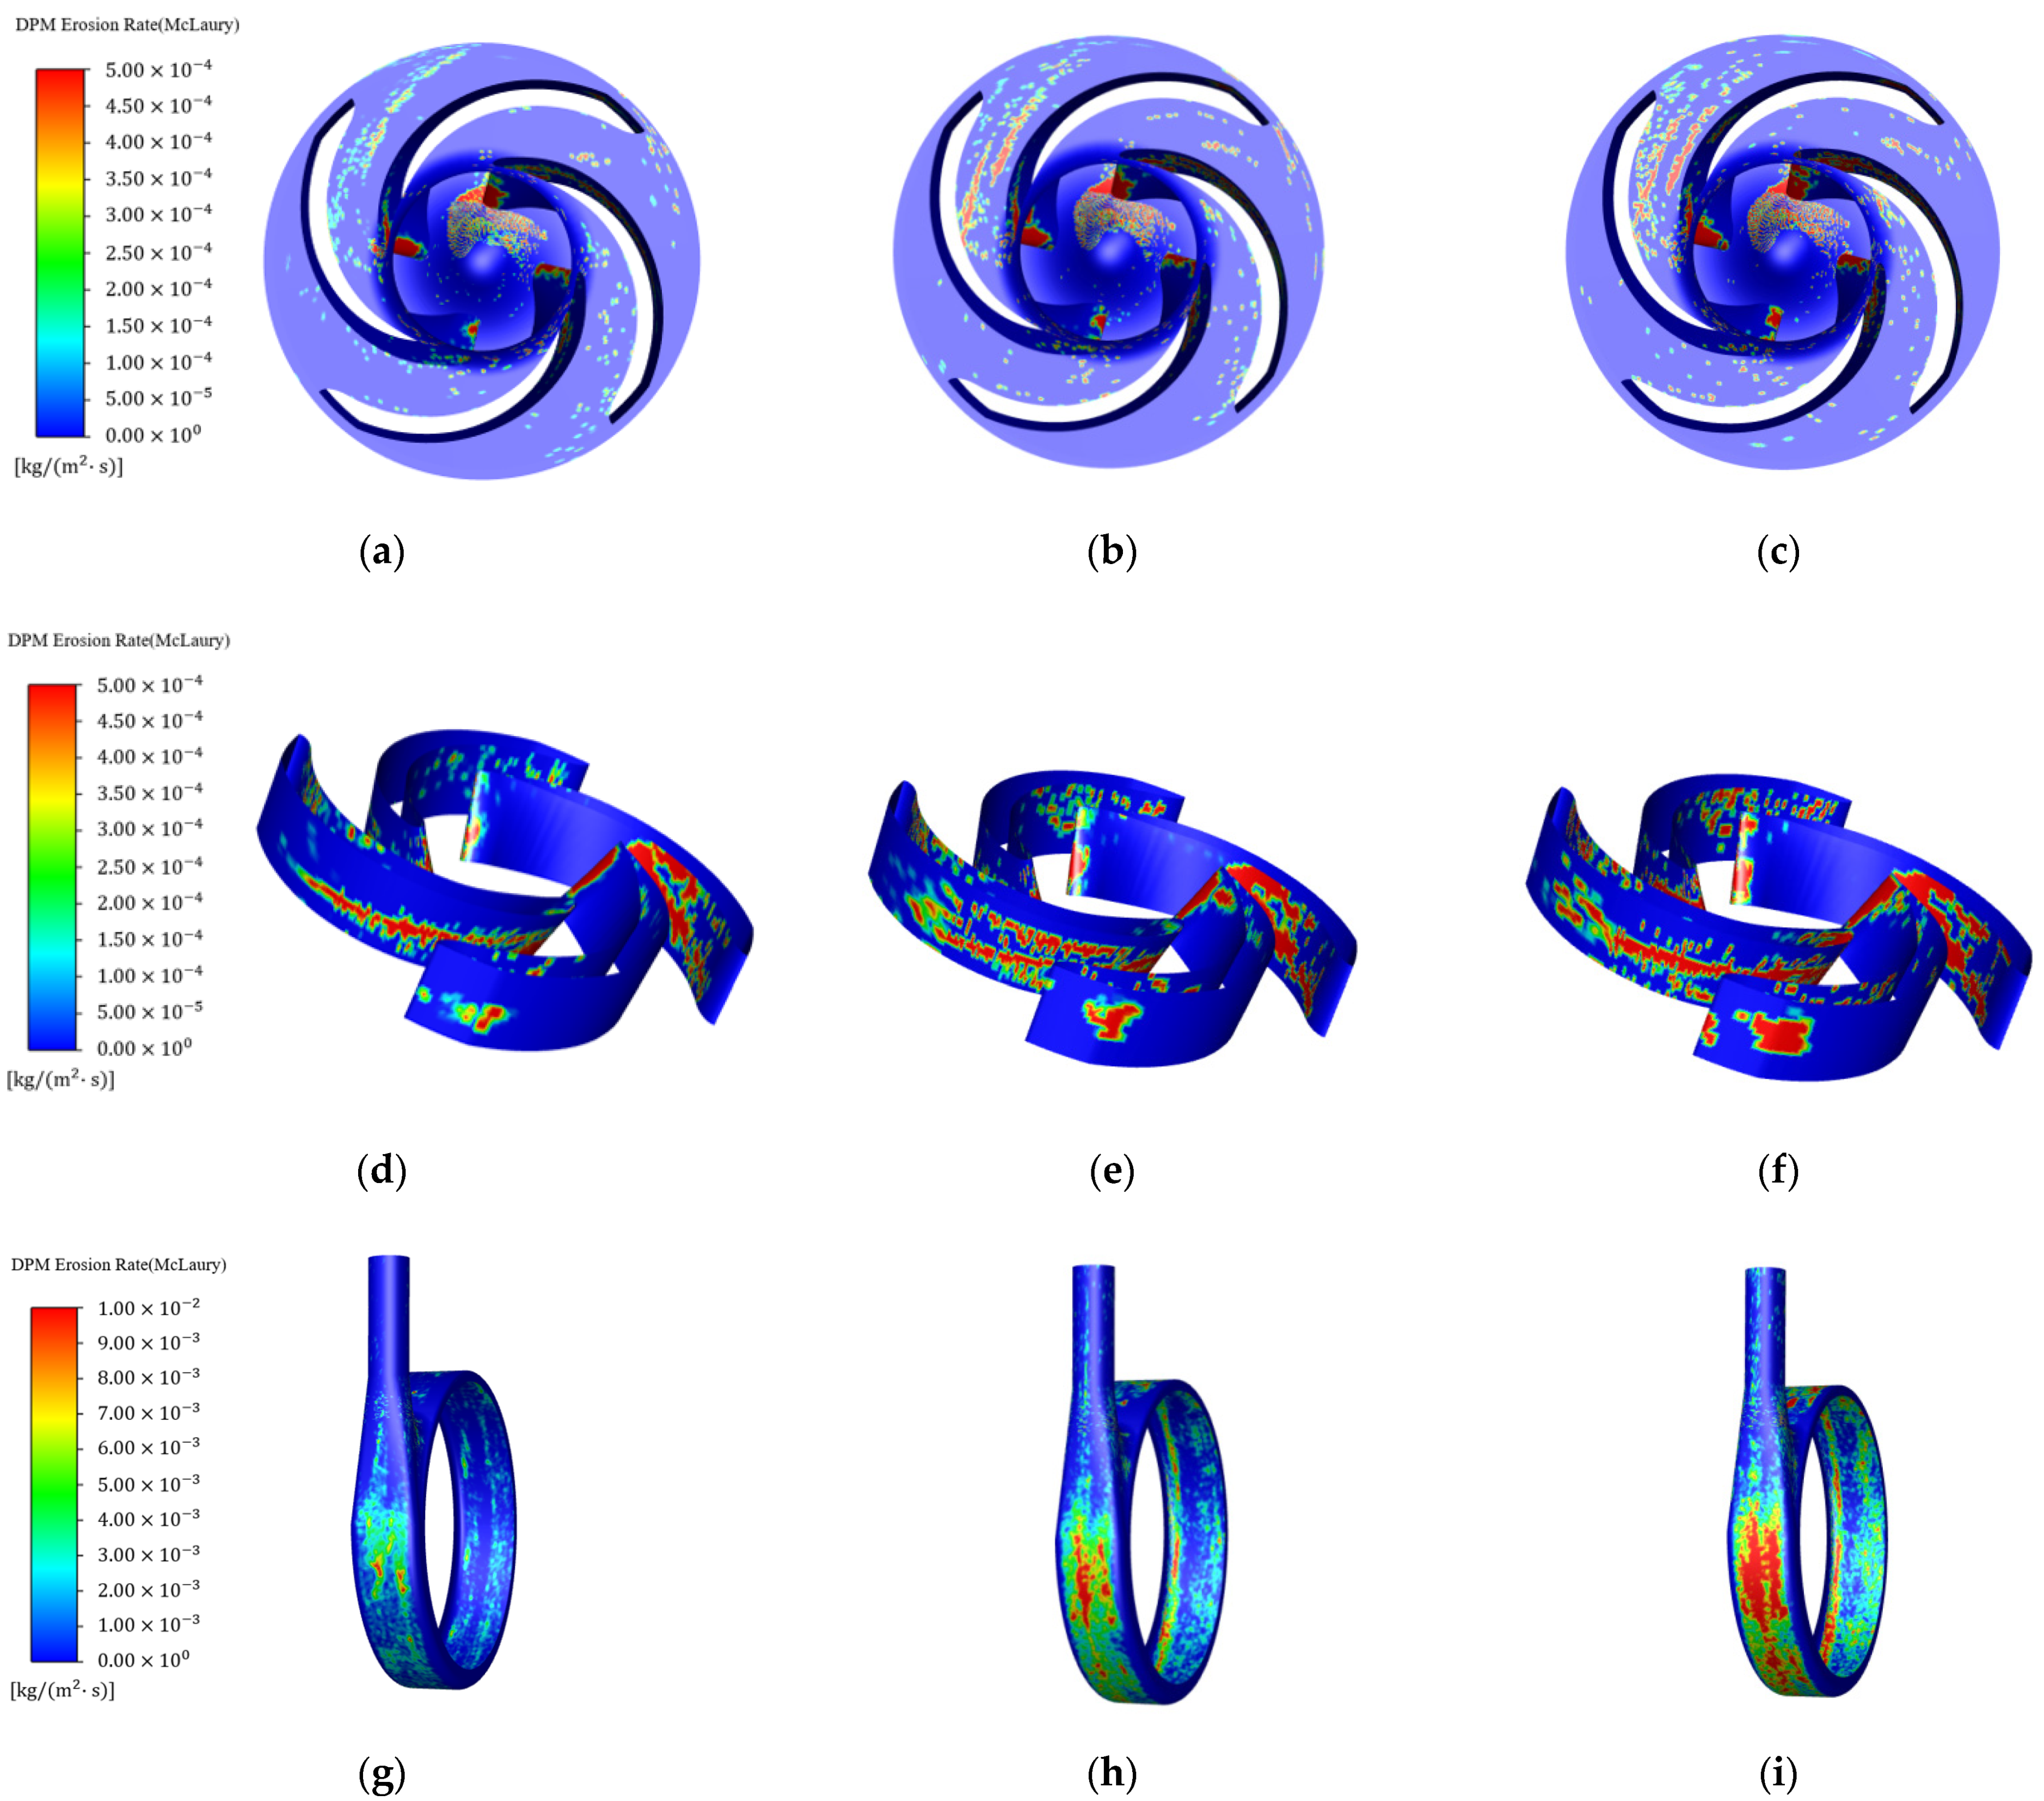
4.2.3. Effects of Solid Volume Fraction

As can be seen in Figure 18, the performance curves of the pump under different solid volume fractions show remarkable differences compared with the pure water condition. The increase in solid volume fraction led to a bigger decrease in pump head and efficiency. The effect of smaller solid volume fraction on the flow field was weak. When the particle volume fraction CV = 15%, the head and efficiency drop reached their maximum. Due to the addition of particles, the density of the mixed liquid is higher than the density of pure water. Under the same conditions, the impeller should expend more energy to transport the solid–liquid two-phase flow. Therefore, the increase in solid volume fraction would make the head and the efficiency drop significantly.
Figure 19 shows the wear distribution of each part under different solid volume fractions, with volume flow rate of 26 m3/h and particle diameter of 0.6 mm. With the increase in solid volume fraction, the wear range at impeller inlet had tiny changes, but the wear degree became larger. Moreover, the wear degree on the blade leading edge and the shroud also increased. On the blade surface, with the increase in solid volume fraction, the wear basically showed similar distribution characteristics, but the wear degree gradually became larger. There was severe wear on the entire volute wall surface near the shroud. At the eighth section of the volute, the wall surface was worn entirely.

5. Conclusions

In this study, wear experiments and numerical simulations on a 500 MZ type centrifugal slurry pump were carried out. The flow characteristics and wall wear under pure water and solid–liquid two-phase conditions were studied and compared. Two-way coupling discrete phase model with the standard k-ε turbulence model were used. The numerical results were validated by experimental results. Most importantly, the effects of particle parameters and pump operating conditions on the internal flow field and wear were investigated. The main results can be concluded as follows:
(1) The head and efficiency based on numerical predictions agrees well with the experimental values. At the design volume flow rate, the difference between the simulation and test values of head and efficiency is less than 2.25%. Thus, the reliability of the numerical calculation method is verified.
(2) As solid volume fraction increases, the prewhirl becomes more severe at the impeller inlet. The flow separation is more serious at the downstream of the volute at a larger solid volume fraction. Compared with the pure water conditions, the intensity of the vortex in the impeller passage has a certain degree of decreasing trend, which is caused by the particle inhibition. In addition, the particle movement is affected by the vortex. The wear on the pressure surface and suction surface is more serious than the wear on the impeller shrouds.
(3) With the increase in volume flow rate or solid volume fraction, the head and efficiency decline. Under the same solid volume fraction, particle diameter has a relatively limited impact on the pump performance. As the volume flow rate increases, the degree and range of wear at the impeller inlet become significantly larger. As the particle diameter decreases, the impeller inlet wear range becomes considerably larger, but the wear degree changes only slightly. The wear shows remarkable increase as the solid volume fraction increases.

Author Contributions

Conceptualization, L.Z. and L.J.; methodology, G.P.; software, L.J.; validation, L.B., L.J., and P.X.; formal analysis, L.J.; investigation, L.B.; resources, P.X.; data curation, G.P.; writing—original draft preparation, L.J.; writing—review and editing, L.Z.; visualization, L.B. and P.X.; supervision, L.B. and P.X.; project administration, G.P.; funding acquisition, L.Z. All authors have read and agreed to the published version of the manuscript.

Funding

This research was supported by the National Natural Science Foundation of China (Grant Nos. 52079058), Key Research and Development Project of Zhenjiang (Grant No. GY2020008), Nature Science Foundation for Excellent Young Scholars of Jiangsu Province (Grant No. BK20190101).

Institutional Review Board Statement

Not applicable.

Informed Consent Statement

Not applicable.

Data Availability Statement

Not applicable.

Conflicts of Interest

The authors declare no conflict of interest.

References

  1. Roco, M.C.; Addie, G.R.; Visintainer, R. Study on Casing Performances in Centrifugal Slurry Pumps. Part. Sci. Technol. 1985, 3, 65–88. [Google Scholar] [CrossRef]
  2. Wang, Y.; Li, G.; Yuan, X.; Zhang, G. Influence of mixed sand on wear of centrifugal pump with semi-open impeller. J. Drain. Irrig. Mach. Eng. 2021, 39, 764–769. [Google Scholar]
  3. Miedema, S.A. A head loss model for slurry transport in the heterogeneous regime. Ocean Eng. 2015, 106, 360–370. [Google Scholar] [CrossRef]
  4. Ramirez, R.; Avila, E.; Lopez, L.; Bula, A.; Duarte Forero, J. CFD characterization and optimization of the cavitation phenomenon in dredging centrifugal pumps. Alex. Eng. J. 2020, 59, 291–309. [Google Scholar] [CrossRef]
  5. Chen, W.; Zhang, S.; Gao, R.; Zheng, J.; Chen, J. Particle movement and blade erosion of diagonal flow pump for deep-sea mining. J. Drain. Irrig. Mach. Eng. 2020, 38, 1215–1220. [Google Scholar]
  6. Ziejewski, M.; Stanislao, J. A Study on New Centrifugal Pump for Slurries. SAE Trans. 1989, 98, 401–407. [Google Scholar]
  7. Williams, R.A. Slurry transport using centrifugal pumps. Powder Technol. 1997, 94, 187. [Google Scholar] [CrossRef]
  8. Bross, S.; Addie, G. Prediction of impeller nose wear behaviour in centrifugal slurry pumps. Exp. Therm. Fluid Sci. 2002, 26, 841–849. [Google Scholar] [CrossRef]
  9. El-Emam, M.A.; Zhou, L. Theories and applications of CFD–DEM coupling approach for granular flow: A review. Arch. Comput. Methods Eng. 2021, 28, 4979–5020. [Google Scholar] [CrossRef]
  10. Zhou, L.; Han, C.; Bai, L.; Li, W.; El-Emam, M.A.; Shi, W. CFD-DEM bidirectional coupling simulation and experimental investigation of particle ejections and energy conversion in a spouted bed. Energy 2020, 211, 118672. [Google Scholar] [CrossRef]
  11. Fan, A.; Long, J. Failure analysis of the impeller of a slurry pump subjected to corrosive wear. Wear 1995, 181, 876–882. [Google Scholar]
  12. Gandhi, B.K.; Singh, S.N. Variation of wear along the volute casing of a centrifugal slurry pump. JSME Int. J. Ser. B-Fluids Therm. Eng. 2001, 44, 231–2370. [Google Scholar] [CrossRef] [Green Version]
  13. Kadambi, J.R.; Mehta, M. Particulate Velocity Measurements in the Intra-Blade Passages of a Centrifugal Slurry Pump. In Proceedings of the ASME/JSME 2003 4th Joint Fluids Summer Engineering Conference, Honolulu, HI, USA, 6–10 July 2003. [Google Scholar]
  14. Khalid, Y.A.; Sapuan, S.M. Wear analysis of centrifugal slurry pump impellers. Ind. Lubr. Tribol. 2007, 59, 18–28. [Google Scholar] [CrossRef]
  15. Madadnia, J.; Amjad, M. Analysis of Severe Erosion in Industrial Centrifugal Slurry Pumps. In Proceedings of the ASME Fluids Engineering Division Summer Meeting, Incline Village, NV, USA, 7–11 July 2013. [Google Scholar]
  16. Liao, J.; Lai, X.D. Numerical Analysis of Internal Flow in Centrifugal Pump based on Solid-liquid Two-phase Modeling. J. Eng. Therm. Energy Power 2017, 32, 95–99. [Google Scholar]
  17. Liu, J.R.; Xu, Y.G. Analysis of Liquid-Solid Two-Phase Turbulent Flow in FGD System Pump. In Proceedings of the 10th IEEE International Conference on Computer-Aided Industrial Design and Conceptual De-sign, Wenzhou, China, 26–29 November 2009. [Google Scholar]
  18. Wang, P.W.; Zhao, J. Experimental study and numerical simulation of the solid-phase particles’ influence on outside characteristics of slurry pump. In Proceedings of the 26th IAHR Symposium on Hydraulic Machinery and Systems, Tsinghua University, Beijing, China, 19–23 August 2012. [Google Scholar]
  19. Wadnerkar, D.; Utikar, R.P. CFD simulation of solid-liquid stirred tanks. Adv. Power Technol. 2012, 23, 445–453. [Google Scholar] [CrossRef]
  20. Zhang, Y.L.; Li, Y. Numerical Simulation and Analysis of Solid-liquid Two-phase Flow in Centrifugal Pump. Chin. J. Mech. Eng. 2013, 26, 53–60. [Google Scholar] [CrossRef]
  21. Finnie, I. Erosion of surfaces by solid particles. Wear 1960, 3, 87–103. [Google Scholar] [CrossRef]
  22. Grant, G.; Tabakoff, W. Erosion Prediction in Turbomachinery Resulting from Environmental Solid Particles. J. Aircr. 1975, 12, 471–478. [Google Scholar] [CrossRef]
  23. McLaury, B.S. A Model to Predict Solid Particle Erosion in Oilfield Geometries. Ph.D. Thesis, University of Tulsa, Tulsa, OK, USA, 1993. [Google Scholar]
  24. McLaury, B.S.; Shirazi, S.A. An Alternate Method to API RP 14E for Predicting Solids Erosion in Multiphase Flow. J. Energy Resour. Technol. 2000, 122, 115–122. [Google Scholar] [CrossRef]
  25. Chen, X. Application of Computational Fluid Dynamics (CFD) to Flow Simulation and Erosion Prediction in Single-Phase and Multiphase Flow. Ph.D. Thesis, The University of Tulsa, Tulsa, OK, USA, 2004. [Google Scholar]
  26. Pagalthivarthi, K.V.; Gupta, P.K. CFD Prediction of Erosion Wear in Centrifugal Slurry Pumps for Dilute Slurry Flows. J. Comput. Multiph. Flows 2011, 3, 225–246. [Google Scholar] [CrossRef] [Green Version]
  27. Li, Y.; Zhu, Z.C. Abrasion characteristic analyses of solid-liquid two-phase centrifugal pump. J. Therm. Sci. 2011, 20, 283–287. [Google Scholar] [CrossRef]
  28. Noon, A.A.; Kim, M.-H. Erosion wear on centrifugal pump casing due to slurry flow. Wear 2016, 364, 103–111. [Google Scholar] [CrossRef]
  29. Shen, Z.J.; Li, R.N.; Han, W.; Zhao, W.G.; Wang, X.H. The research on particle trajectory of solid-liquid two-phase flow and erosion predicting in screw centrifugal pump. In Proceedings of the 7th International Conference on Pumps and Fans (ICPF2015), Hangzhou, China, 18–21 October 2015. [Google Scholar]
  30. Shen, Z.J.; Chu, W.L. Sediment erosion in the impeller of a double-suction centrifugal pump—A case study of the Jingtai Yellow River Irrigation Project, China. Wear 2019, 422, 269–279. [Google Scholar] [CrossRef]
  31. Zhu, H.; Zhang, J.; Zhu, J.; Rutter, R.; Zhang, H. A Numerical Study of Turbulence Model and Rebound Model Effect on Erosion Simulations in an Electrical Submersible Pump (ESP). In Proceedings of the ASME-JSME-KSME 2019 8th Joint Fluids Engineering Conference, San Francisco, CA, USA, 28 July–1 August 2019. [Google Scholar]
  32. Zhu, H.; Zhu, J.; Rutter, R.; Zhang, H.-Q. A Numerical Study on Erosion Model Selection and Effect of Pump Type and Sand Characters in Electrical Submersible Pumps by Sandy Flow. J. Energy Resour. Technol.-Trans. ASME 2019, 141, 122004. [Google Scholar] [CrossRef]
  33. Jiang, Z.; Zeng, X.; Li, Y. Study on the Relationship between Wear and Flow Characteristics of a Centrifugal Pump at Different Mass Concentrations. Processes 2021, 9, 988. [Google Scholar] [CrossRef]
  34. Han, Y.; Zhou, L.; Bai, L.; Shi, W.; Agarwal, R. Comparison and validation of various turbulence models for U-bend flow with a magnetic resonance velocimetry experiment. Phys Fluids 2021, 33, 125117. [Google Scholar] [CrossRef]
  35. Launder, B.E.; Spalding, D.B. Lectures in Mathematical Model of Turbulence; Academic Press: Cambridge, MA, USA, 1972. [Google Scholar]
  36. Launder, B.E.; Spalding, D.B. The numerical computation of turbulent flows. Comput. Methods Appl. Mech. Eng. 1974, 3, 269–289. [Google Scholar] [CrossRef]
  37. Saffman, P.G. The lift on a small sphere in a slow shear flow—Corrigendum. J. Fluid Mech. 1968, 31, 624. [Google Scholar] [CrossRef]
  38. Li, A.; Ahmadi, G. Dispersion and Deposition of Spherical Particles from Point Sources in a Turbulent Channel Flow. Aerosol Sci. Technol. 1992, 16, 209–226. [Google Scholar] [CrossRef]
  39. McLaury, B.S.; Shirazi, S.A. Effect of entrance shape on erosion in the throat of chokes. J. Energy Resour. Technol.-Trans. ASME 2000, 122, 198–204. [Google Scholar] [CrossRef]
  40. Pagalthivarthi, K.V.; Gupta, P.K. Prediction of Erosion Wear in Multi-Size Particulate Flow through a Rotating Channel. FDMP-Fluid Dyn. Mater. Process. 2009, 5, 93–122. [Google Scholar]
  41. Peng, G.; Chen, Q.; Bai, L.; Hu, Z.; Zhou, L.; Huang, X. Wear mechanism investigation in a centrifugal slurry pump impeller by numerical simulation and experiments. Eng. Fail. Anal. 2021, 128, 105637. [Google Scholar] [CrossRef]
  42. Peng, G.; Huang, X.; Zhou, L.; Zhou, G.; Zhou, H. Solid-liquid two-phase flow and wear analysis in a large-scale centrifugal slurry pump. Eng. Fail. Anal. 2020, 114, 104602. [Google Scholar] [CrossRef]
  43. International Organization for Standardization. Rotodynamic Pumps—Hydraulic Performance Acceptance Tests—Grades 1, 2 and 3; ISO 99062012; ISO: Geneva, Switzerland, 2012. [Google Scholar]
  44. El-Emam, M.; Zhou, L.; Shi, W.; Han, C. Performance evaluation of standard cyclone separators by using CFD–DEM simulation with realistic bio-particulate matter. Powder Technol. 2021, 385, 357–374. [Google Scholar] [CrossRef]
Figure 1. 3D model of the slurry pump.
Jmse 10 00057 g001
Figure 2. Grid generation of the computing domain: (a) impeller; (b) volute.
Jmse 10 00057 g002
Figure 3. Hydraulic performance test bench.
Jmse 10 00057 g003
Figure 4. Slurry pump wear test bench.
Jmse 10 00057 g004
Figure 5. Pump performance curve comparison under pure water conditions.
Jmse 10 00057 g005
Figure 6. Wear comparison at impeller inlet: (a) simulation; (b) experiment.
Jmse 10 00057 g006
Figure 7. Wear comparison at blade pressure surface: (a) simulation; (b) experiment.
Jmse 10 00057 g007
Figure 8. Wear comparison at middle section of blade pressure surface: (a) simulation; (b) experiment.
Jmse 10 00057 g008
Figure 9. Wear comparison at middle section of blade pressure surface: (a) simulation; (b) volute cross-section; (c) experiment, sections I to II; (d) experiment, sections IV to V; (e) experiment, sections VI to VIII.
Jmse 10 00057 g009
Figure 10. Pressure distribution of pump cross-section with different solid volume fractions under 1.0QBEP: (a) CV = 0%; (b) CV = 5%; (c) CV = 10%; (d) CV = 15%.
Jmse 10 00057 g010
Figure 11. Velocity streamline distributions in the inlet section at different solid volume fractions under 1.0QBEP: (a) CV = 0%; (b) CV = 5%; (c) CV = 10%; (d) CV = 15%.
Jmse 10 00057 g011
Figure 12. Velocity streamline distributions of impeller-volute with different solid volume fractions under 1.0QBEP: (a) CV = 0%; (b) CV = 5%; (c) CV = 10%; (d) CV = 15%.
Jmse 10 00057 g012
Figure 13. Velocity streamlines and wear in the impeller.
Jmse 10 00057 g013
Figure 14. Pump head efficiency under different volume flow rates (dp = 0.6 mm, CV = 5%).
Jmse 10 00057 g014
Figure 15. Wear distribution of each part at different volume flow rates: Impeller inlet: (a) 0.6QBEP; (b) 1.0QBEP; (c) 1.4QBEP; Blades: (d) 0.6QBEP; (e) 1.0QBEP; (f) 1.4QBEP; Volute: (g) 0.6QBEP; (h) 1.0QBEP; (i) 1.4QBEP.
Jmse 10 00057 g015
Figure 16. Pump performance characteristics curve at different particle diameters (1.0QBEP, CV = 5%).
Jmse 10 00057 g016
Figure 17. Wear distribution of each part under different particle diameters: Impeller inlet: (a) dp = 0.6 mm; (b) dp = 0.3 mm; (c) dp = 0.15 mm; Blades: (d) dp = 0.6 mm; (e) dp = 0.3 mm; (f) dp = 0.15 mm; Volute: (g) dp = 0.6 mm; (h) dp = 0.3 mm; (i) dp = 0.15 mm.
Jmse 10 00057 g017aJmse 10 00057 g017b
Figure 18. Pump performance characteristics curve under different solid phase volume fractions (Q = 1.0QBEP, dp = 0.6 mm).
Jmse 10 00057 g018
Figure 19. Wear distribution of each fraction at different solid volume fractions: Impeller inlet: (a) CV = 5%; (b) CV = 10%; (c) CV = 15%; Blades: (d) CV =5 %; (e) CV = 10%; (f) CV = 15%; Volute: (g) CV = 5%; (h) CV = 10%; (i) CV = 15%.
Jmse 10 00057 g019
Table 1. Geometric specifications of the impeller.
Design ParametersValue
Rotating Speed1500 r/min
Design Volume Flow Rate26 m3/h
Design Head11 m
Inlet Diameter75 mm
Number of Blades4
Impeller Outer Diameter178 mm
Impeller Outlet Width30 mm
Table 2. Grid independence analysis.
Number of ElementsHead/mEfficiency/%
369,71312.4574.43
921,49312.1873.24
1,565,84811.9572.12
3,146,21411.7671.27
4,041,36311.7871.37
Publisher’s Note: MDPI stays neutral with regard to jurisdictional claims in published maps and institutional affiliations.

