Article

Study on the Comparison of the Hydraulic Performance and Pressure Pulsation Characteristics of a Shaft Front-Positioned and a Shaft Rear-Positioned Tubular Pump Devices

1
College of Hydraulic Science and Engineering, Yangzhou University, Yangzhou 225000, China
2
Jiangsu Water Supply Co., Ltd., Nanjing 210019, China
*
Author to whom correspondence should be addressed.
J. Mar. Sci. Eng. 2022, 10(1), 8; https://doi.org/10.3390/jmse10010008
Submission received: 5 November 2021 / Revised: 16 December 2021 / Accepted: 16 December 2021 / Published: 22 December 2021
(This article belongs to the Section Ocean Engineering)

Abstract

:
The shaft front-positioned tubular pump device has been widely used in practical engineering, but the shaft rear-positioned pump device is rarely used due to its low efficiency. To investigate the effect of the shaft position on the performance of a tubular pump device, the optimized shaft front-positioned and shaft rear-positioned pump devices were compared and studied. Both tubular pump devices adopt a TJ04-ZL-06 pump model. Three dimensional steady and unsteady numerical simulations combined with model tests were used to compare the difference of two pump devices. Meanwhile, three groups of pressure monitoring points were set at different positions of the pump device to collect pressure information and pressure pulsation was analyzed. The results show that, the highest efficiency of the shaft front and rear positioned pump device are 81.78% and 80.26%, respectively. The hydraulic performance of the two inlet passages is excellent, and the hydraulic loss is close to each other. Therefore, the hydraulic performance of the pump device depends mainly on the hydraulic performance of the outlet passage. The shaft is set in the outlet passage, which will increase the hydraulic loss and reduce efficiency. Under design conditions, the pressure pulsation amplitude at the impeller inlet is the largest, and the pressure pulsation amplitude increases from the hub to the shroud. The pressure pulsation amplitude of the shaft rear-positioned pump device is larger than that of the shaft front-positioned pump device. The pressure pulsation at the impeller inlet and outlet is greatly affected by the number of blades, and the main frequency is three times the RF. This study can provide practical and effective guidance for the design and optimization of the shaft front-positioned and rear-positioned tubular pump devices, which has theoretical value and application value.

1. Introduction

Axial flow pump devices play a significant role in water diversion projects, environmental management and improvement projects, flood control applications and irrigation and drainage projects due to their large flow and low head characteristics [1]. Pump devices are generally divided into vertical, slanted and tubular pump devices according to the flow passage form. Due to the extensive use of axial flow pump devices, many experts have studied the optimization and design of various types of pump device [2,3,4,5].
For shaft tubular pump devices, the motor and its ancillary equipment are installed in the shaft built by reinforced concrete. The structure is simple, and the inlet and outlet passages are straight. According to the position of the shaft, shaft tubular pump devices can be divided into shaft front-positioned tubular pump devices and shaft rear-positioned tubular pump devices. Xu et al. [6,7] performed a comprehensive study of commonly used tubular pump devices; the results showed that pre-shaft tubular pump devices have excellent hydraulic performance. Lu et al. [8] conducted a model experiment of a pre-shaft pump device of a low head pumping station and studied the hydraulic performance by adjusting the blade angle. The experimental results showed that the efficiency at the optimal operating point is 78.83%. Liu et al. [9] found that the flow pattern of the pre-shaft device is smooth and the device has high efficiency. However, the flow in the outlet passage of the rear shaft pump device is disordered and the head loss is relatively large, resulting in the efficiency of the device being lower than that of shaft front-positioned tubular pump devices. Yang et al. [10] compared the hydraulic performance characteristics of pre-shaft and rear shaft pump devices and believed that shaft front-positioned pump devices are superior to shaft rear-positioned pump devices in performance. Shi et al. [11] studied bidirectional shaft tubular pump devices. The results showed that when the pump station is running forward, the shaft passage is used as the inlet passage, and the highest efficiency of the device is 72.18%. When the pump station is running backward, the shaft passage is used as the outlet passage, and the efficiency is only 60.5%. Many scholars have conducted studies on the optimization of shaft pump devices [12,13,14]. They found that when the shaft is set in the outlet passage, the flow in the outlet passage will be disordered, and the hydraulic loss is large. The hydraulic loss should be reduced as much as possible to improve the efficiency of the shaft rear-positioned tubular pump device. Zheng et al. [15] conducted an experiment of axial flow pumps. It was found that the pressure pulsation at the impeller inlet is greater than that at the impeller outlet. Wang et al. [16] carried out the unsteady calculation of axial flow pumps. It was found that the pressure pulsation was mainly controlled by the rotational frequency of the impeller. Al-Obaidi et al. [17] studied the pressure pulsation under different blade angles by CFD. It was found that the blade angles greatly influence the amplitude of fluctuation. Gonzalez et al. [18] took centrifugal pumps as the research object and studied their internal unsteady flow characteristics by model test. The results show that the vibration of these pumps is closely related to unsteady pressure pulsations.
According to previous exploration, shaft front-positioned tubular pump devices have been widely used in China during the past decade. However, shaft rear-positioned tubular pump devices have not been widely used because of their low efficiency. This study compared the hydraulic performance and pressure pulsation characteristics of optimized pre-shaft pump devices and rear shaft pump devices by numerical simulation method and model test. This study can provide practical and effective guidance for the design and optimization of the shaft front and rear-positioned tubular pump devices, which has theoretical value and application value.

2. Numerical Simulation

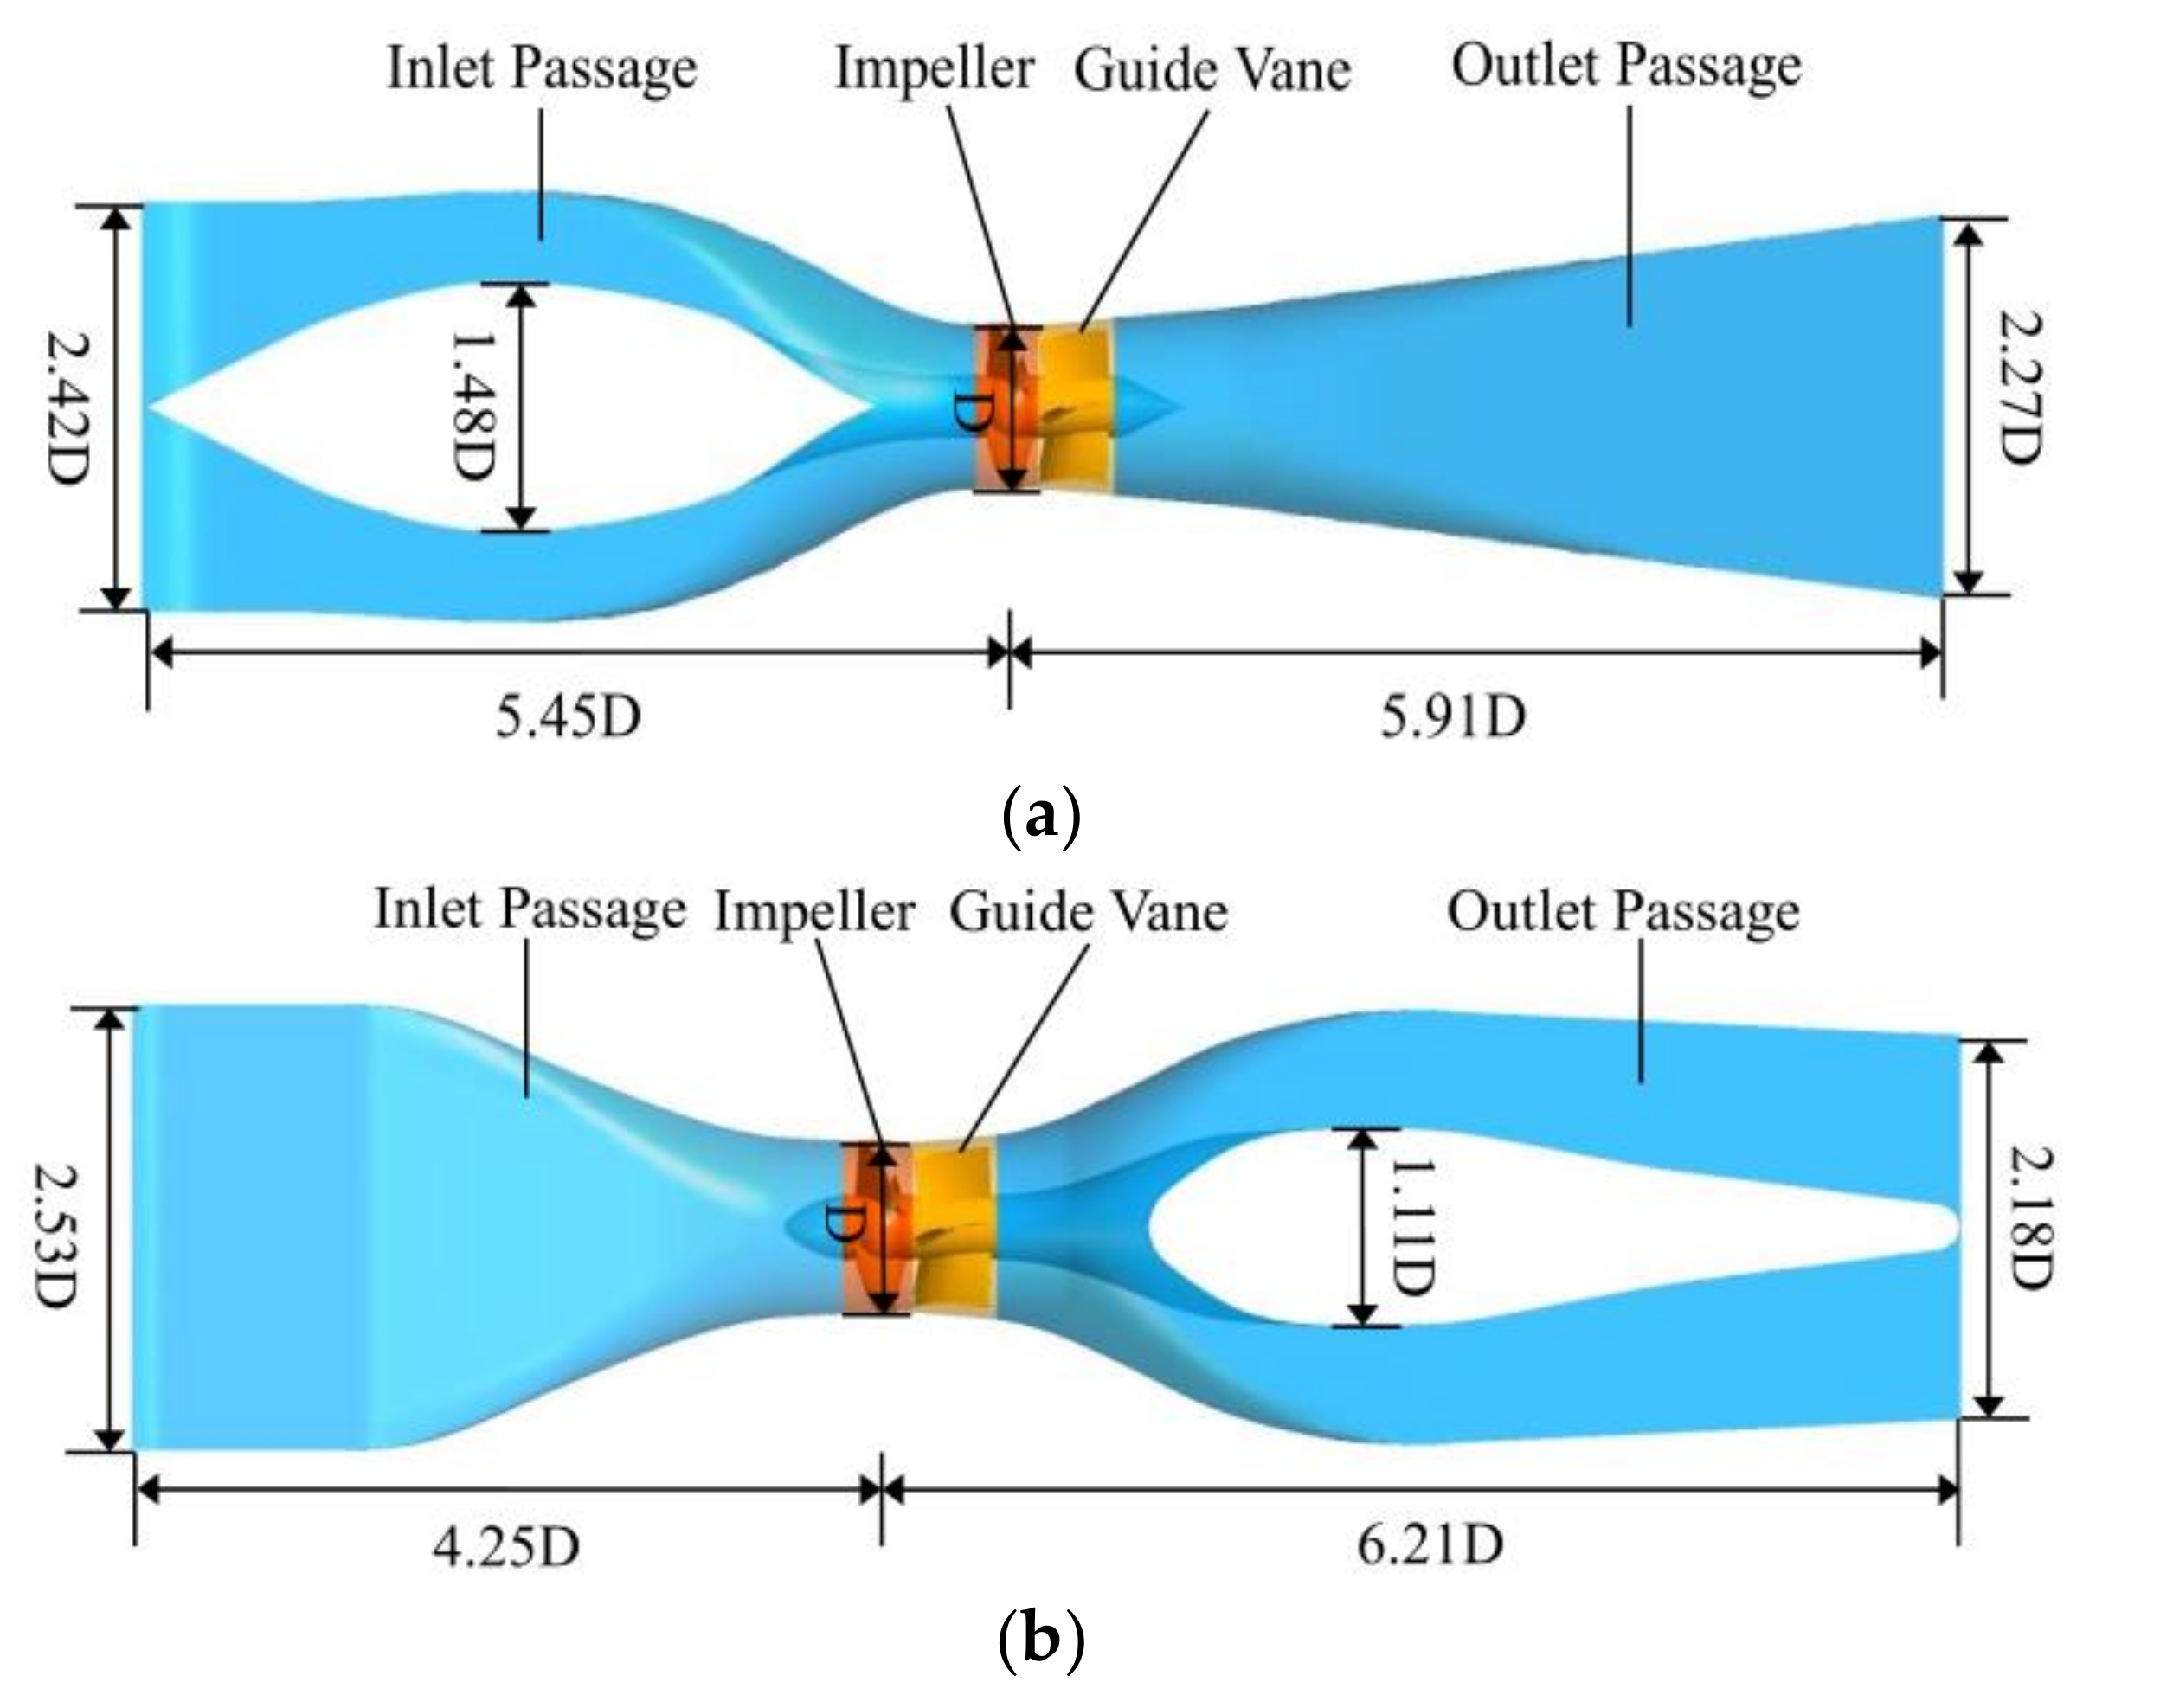
2.1. Three Dimensional Modeling

The inlet passage is the connection between the forebay and the impeller chamber. The purpose is to make the flow uniform and smooth and provide a good inlet condition for the impeller. The outlet passage is commonly used to recover kinetic energy [19]. In this research, two tubular pump devices with different shaft position were studied. Both pump devices adopt a TJ04-ZL-06 pump model. Figure 1 shows the model of two pump devices. Table 1 shows the design parameters of two pump devices.

2.2. Turbulence Model

In recent years, the numerical simulation method has become a common method for research [20,21,22,23]. In this numerical simulation, the time-averaged Navier–Stokes equation is adopted to describe flow [24,25]. Because of the advantage of RNG k-ε turbulence model in solving the flow field of rotating machinery, the model is used in this paper [26,27,28,29,30]. The equations are shown below:
t ( ρ k ) + x i ( ρ k u i ) = x j ( α k μ e f f k x j ) + G k + ρ ε ,
t ( ρ ε ) + x i ( ρ ε u i ) = x j ( α ε μ e f f ε x j ) + C 1 ε ε k G k C 2 ε ρ ε 2 k ,
where Gk represents the turbulent kinetic energy generated by the average velocity gradient. C1ε = 1.42, and C2ε = 1.68. μeff is the effective viscosity of turbulence. k is the turbulence energy. ε is the dissipation rate of the turbulent kinetic energy.

2.3. Numerical Simulation Setup

In this research, the numerical simulation is divided into two parts. First, steady calculation is carried out, and then unsteady calculation is carried out on the basis of steady calculation. For the dynamic and static interface in the calculation domain, due to the change of the coordinate system on both sides of the interface, the “stage” type is used in the steady calculation, and the “transient rotor and stator” is used in the unsteady calculation. The boundary conditions and calculation settings are shown in Table 2. The location of the pressure monitoring point is shown in Figure 2.

2.4. Grid Division and Irrelevance Verification
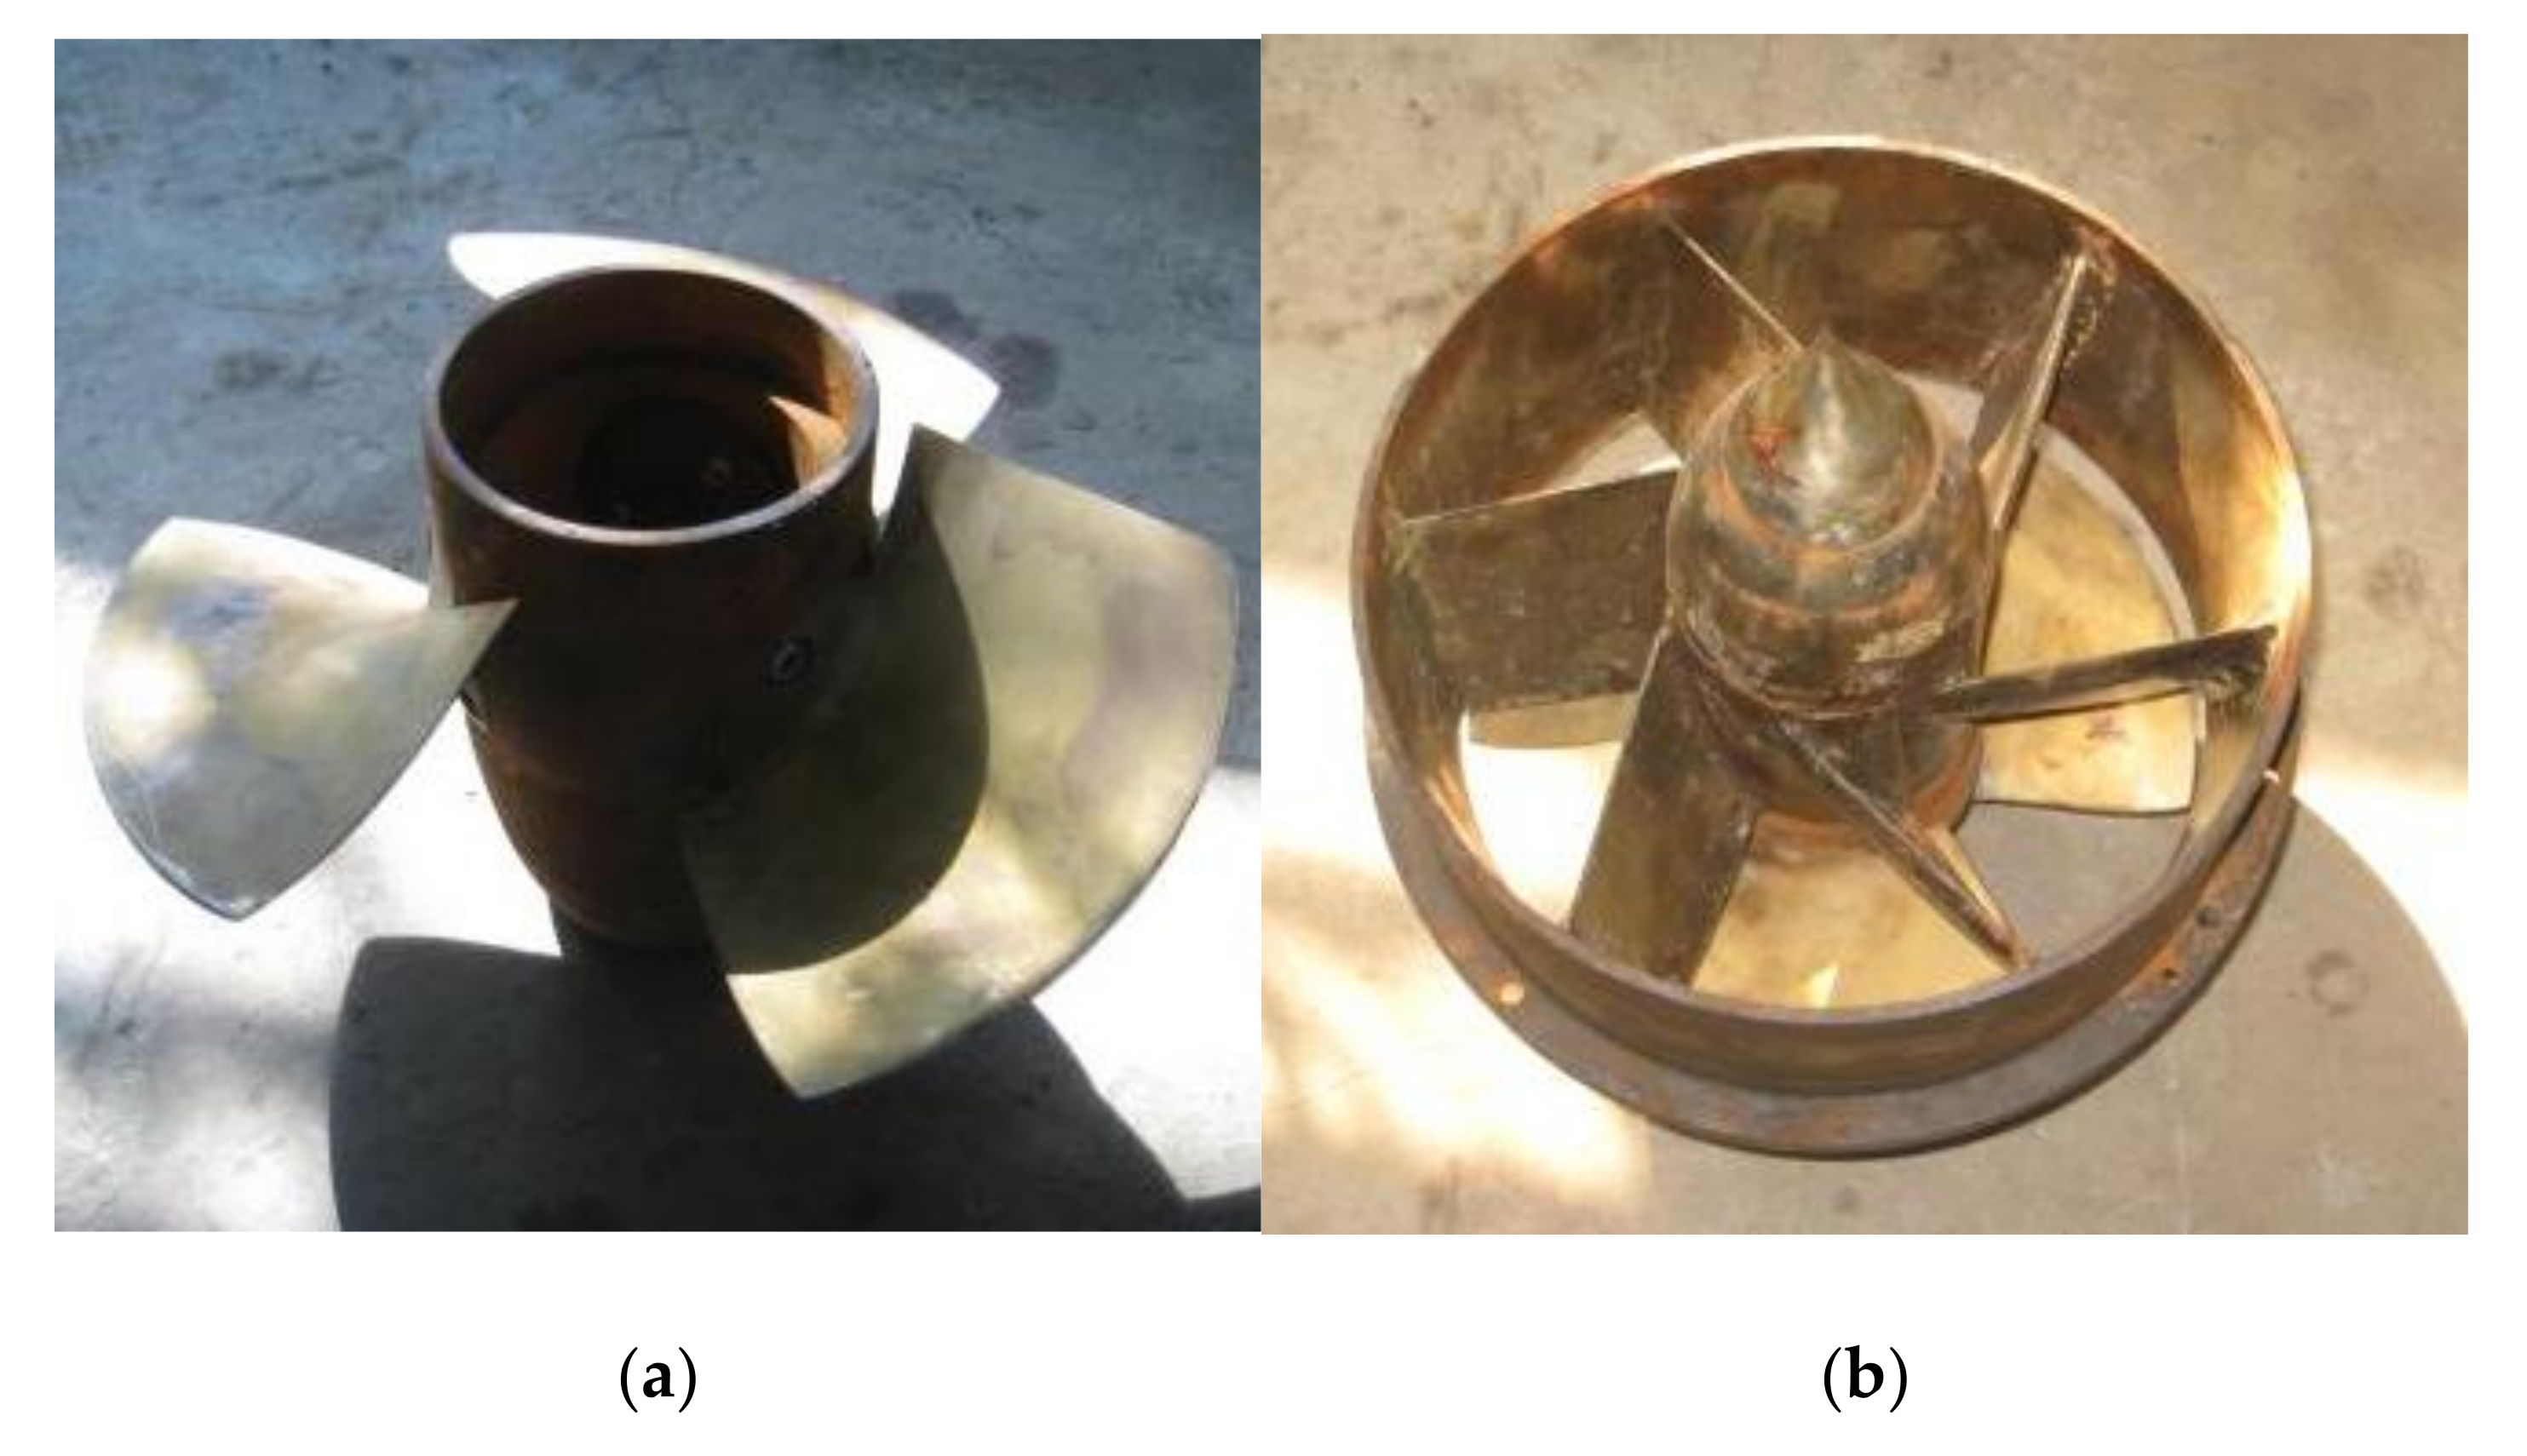
According to the design parameters, flow passage components of pump devices are modeled, and the grid is divided in ICEM software. The impeller and guide vane are modeled according to coordinate points and divided into structural grids in TurboGrid Software. A large number of studies show that the value of y+ and the setting of tip clearance will affect the calculation accuracy [31,32,33]. The tip clearance was 0.15 mm in this calculation. The y+ value of the impeller wall was 18. In this study, six sets of grids were divided for the calculation domain, and the efficiency of the shaft front-positioned tubular pump device under design condition was used as an index to judge grid independence. Figure 3 shows that the efficiency is almost constant when the grid number is more than 6.29 million. When the number of grids continues to increase, efficiency changes less than 0.03%. The grid number of 6.29 million was finally selected, and the grid of the shaft rear-positioned tubular pump device was also divided according to this scheme. Figure 4 shows the grid division of each part.

3. Experiment

The test of the shaft front-positioned tubular pump device was carried out on the general hydraulic model test bench of the China Water Resources Beifang Co., Ltd. (Tianjin, China). The general hydraulic test bench is composed of a hydraulic circulation device, power control device and data acquisition and computer analysis device. The random error of the efficiency test of the test bench is less than ±0.1%, and the comprehensive error is less than ±0.3%. The tests were completed under the requirements of Chinese standards. Performance curves for each blade angle were obtained from more than 15 test points. The information about the test instruments is shown in Table 3. The model diagram of the experiment is shown in Figure 5.
The uncertainty of the head measurement system is less than ±0.1%, the uncertainty of the torque and rotation speed measurement system is less than ±0.1%, the uncertainty of the flow rate measurement system is less than ±0.2%, according to the above uncertainty, the uncertainty of the test bench system is calculated to be ±0.25%. In this study, the data, under optimal conditions, were collected 10 times, and the efficiency of each time was calculated and then the average efficiency and standard deviation were calculated. The Student-t distribution is adopted with a confidence of 95%, and the random uncertainty of the efficiency test is ±0.0728%. According to the system uncertainty and random uncertainty, the comprehensive uncertainty of the efficiency test is ±0.26%.
Figure 6 compares the numerical simulation results with the model test results; under design condition (Qd = 388 L/s), the experimental efficiency value is 81.93%, the efficiency predicted by the CFD is 81.78% and the absolute error is only 0.15%, the relative error is 0.18%, which is within the allowable range. The experimental head value is 4.79 m, the head predicted by the CFD is 4.71 m and the absolute error is 0.08 m, the relative error is 1.7%. The characteristic curves obtained by experiment and numerical simulation are basically the same, indicating that the numerical simulation method is reliable.

4. Results and Discussion

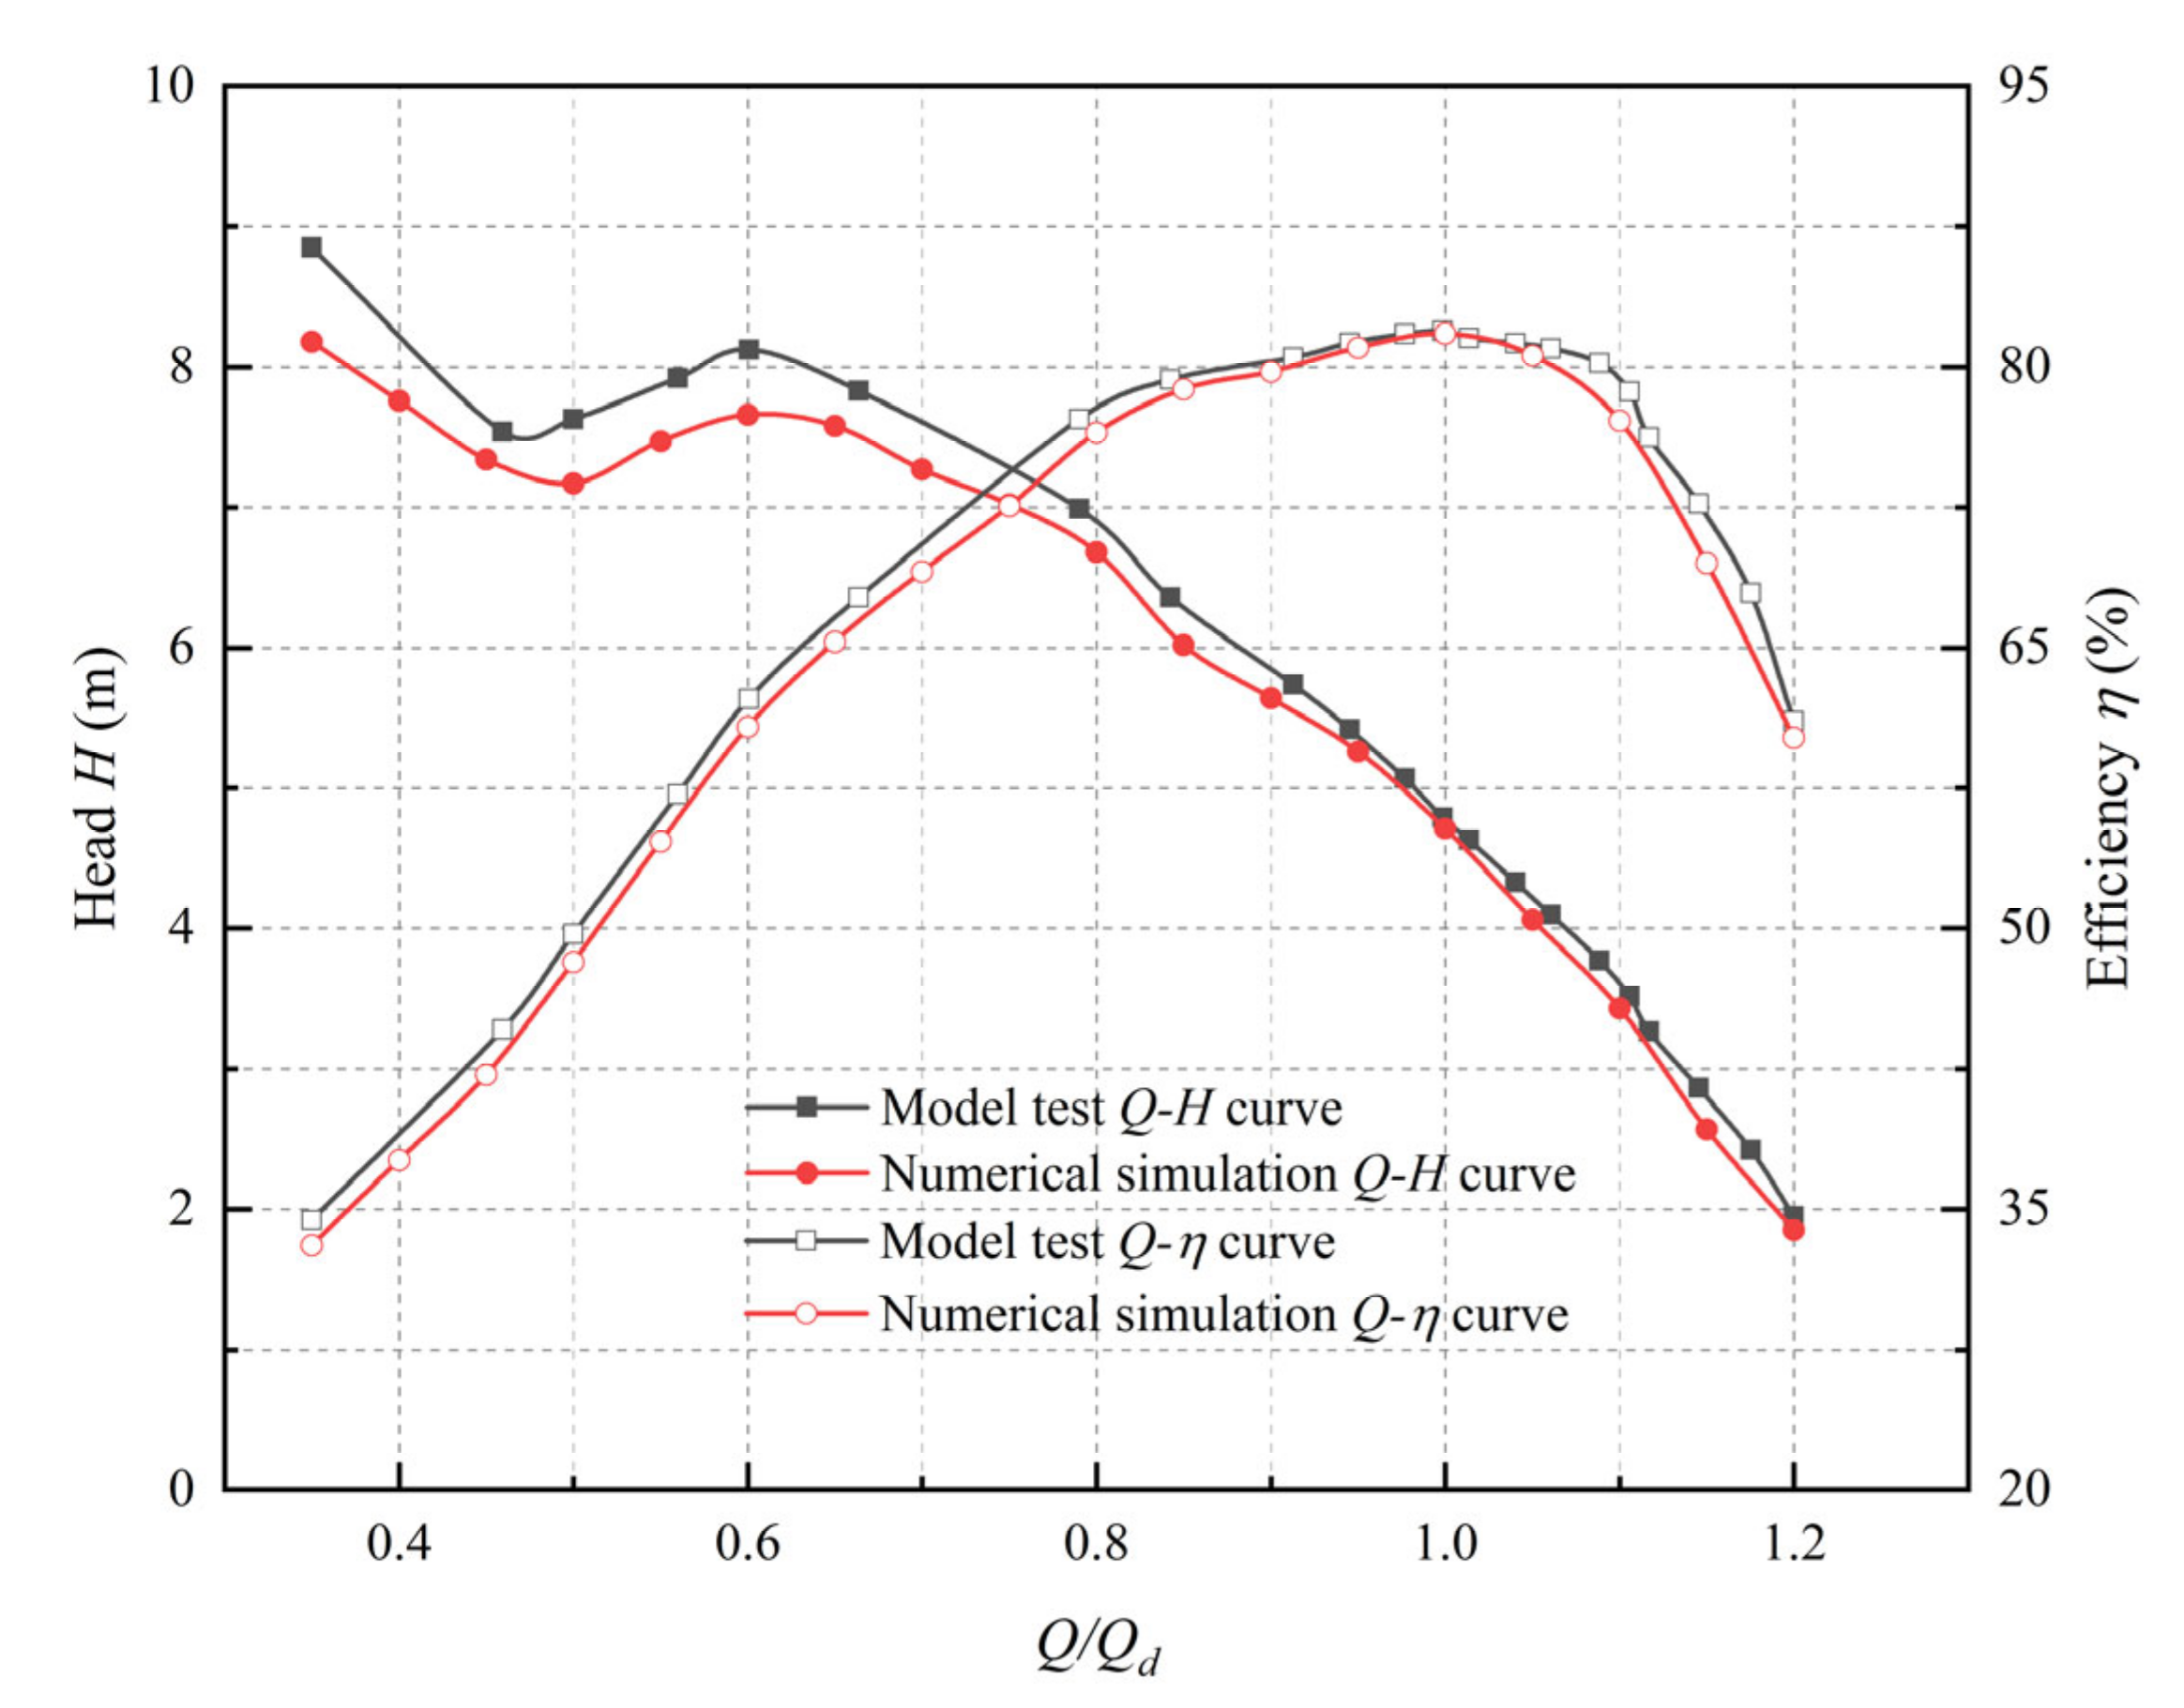
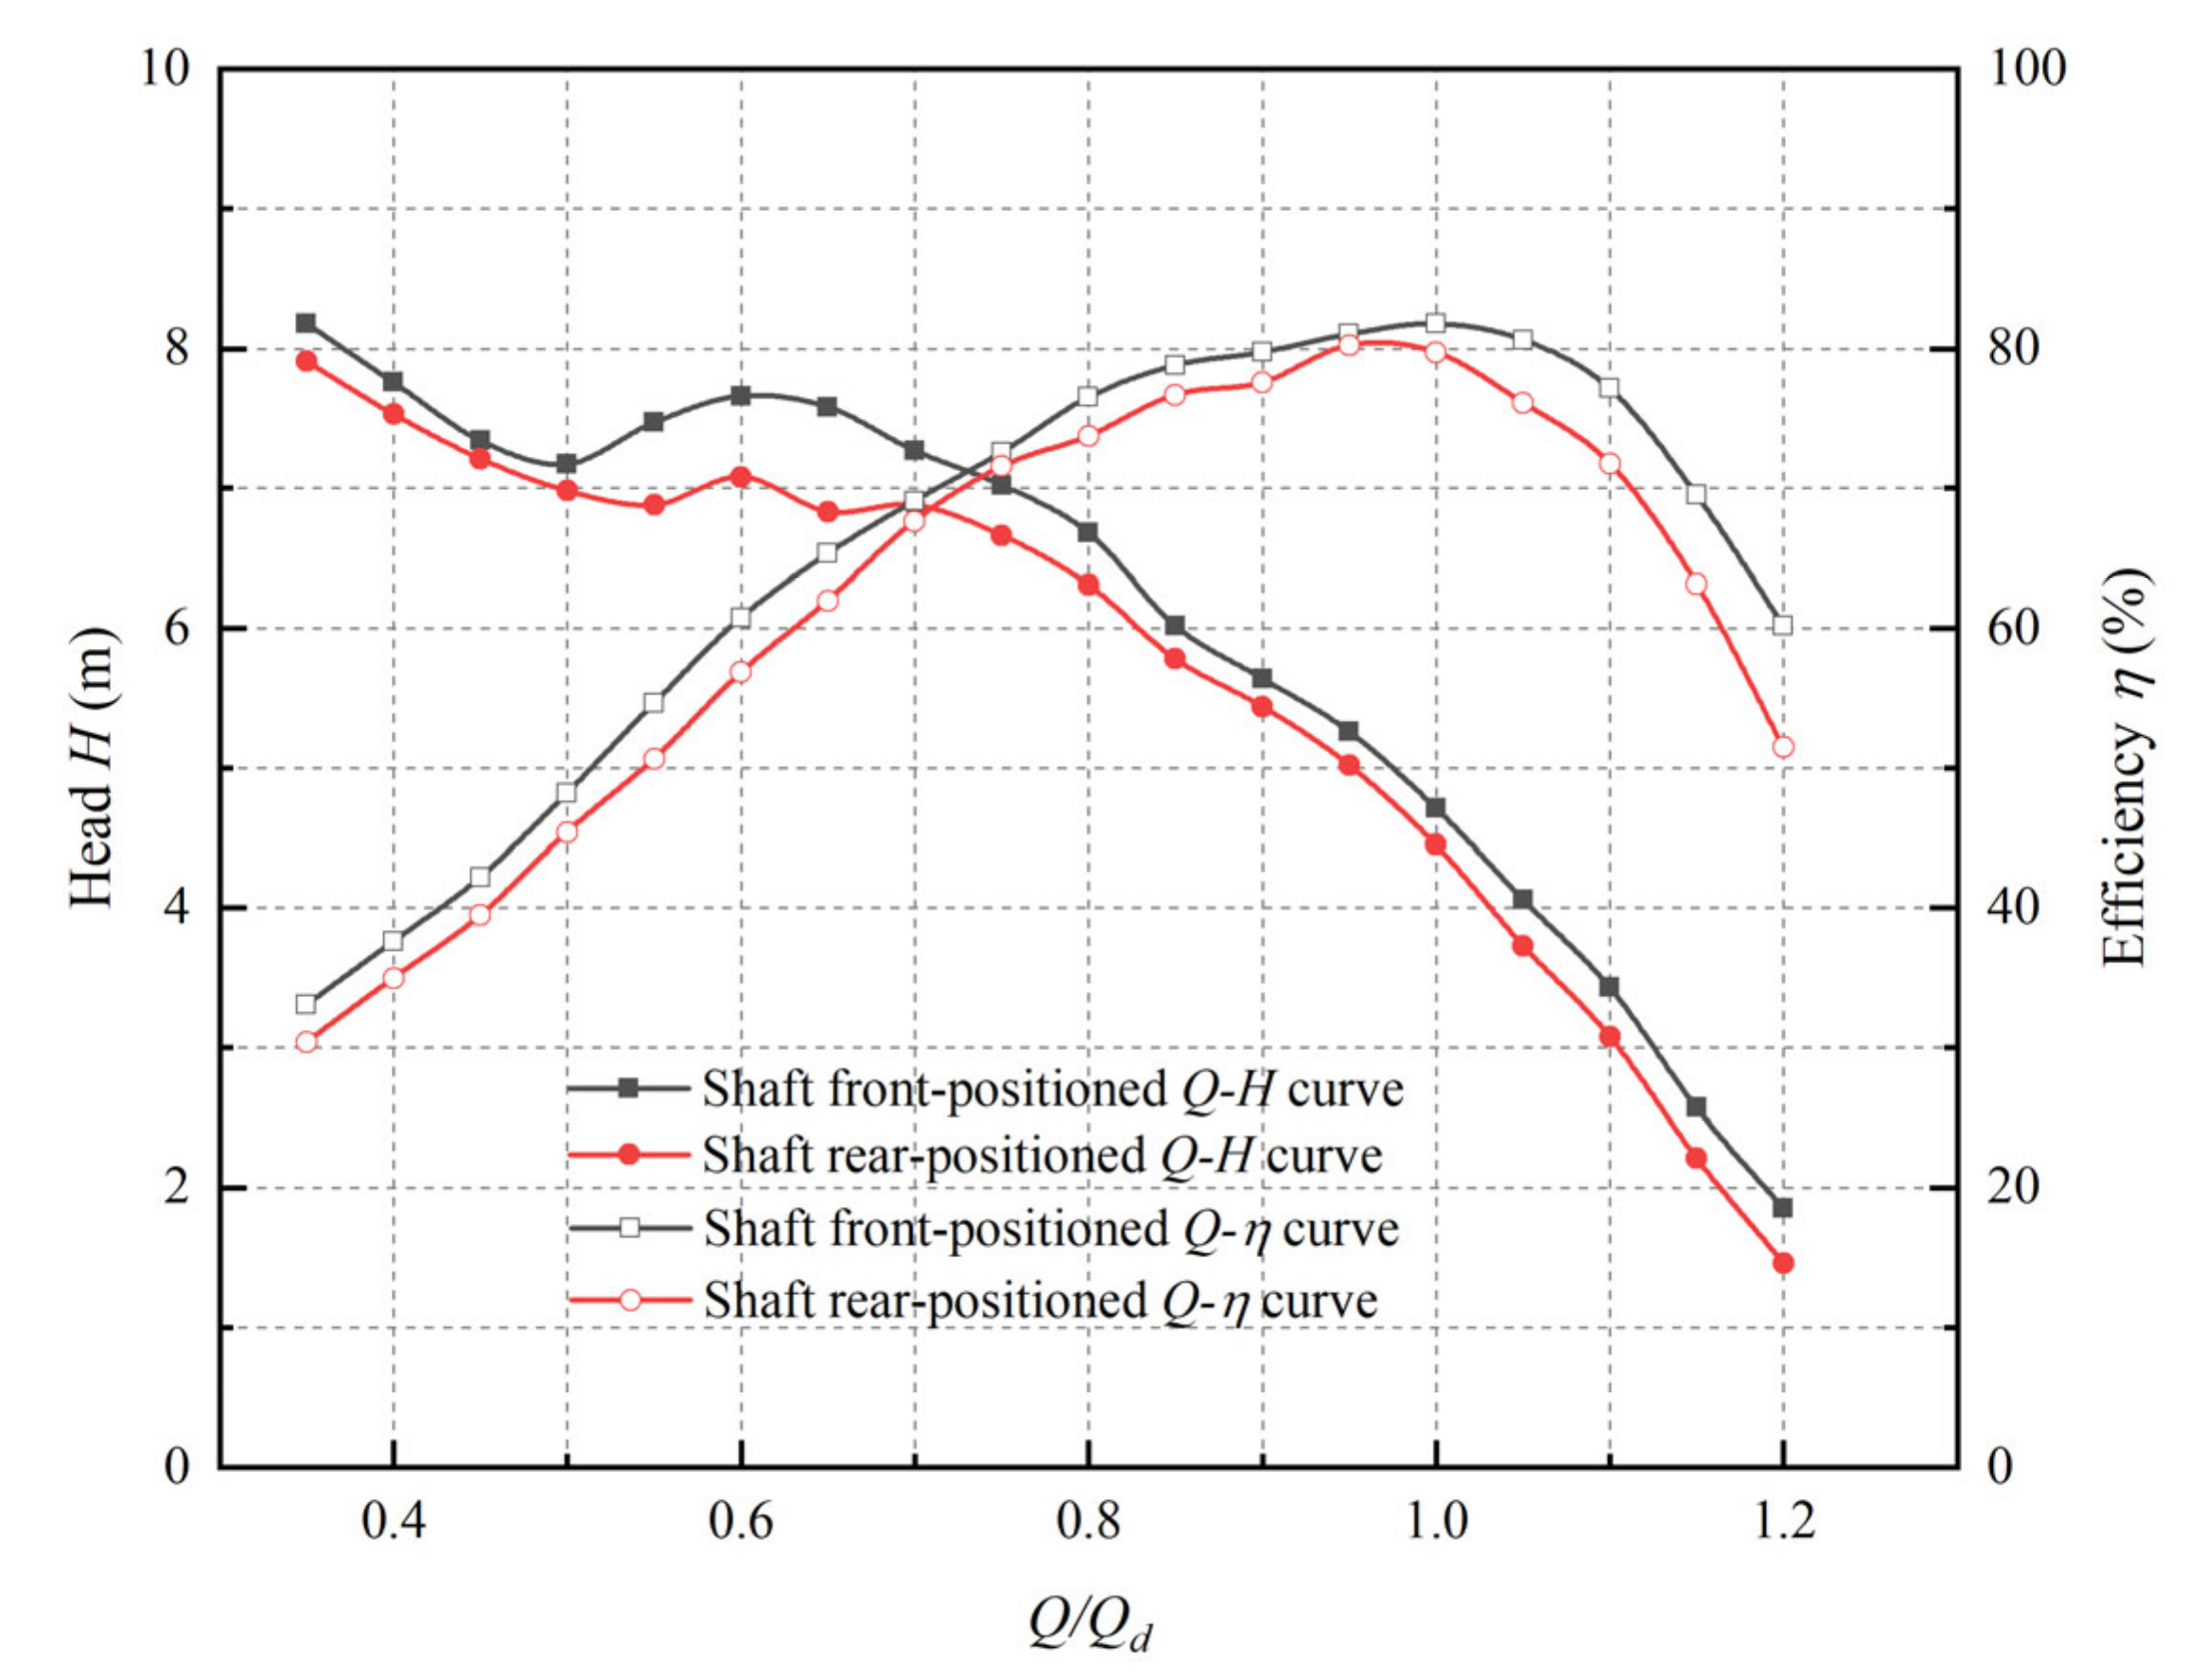
4.1. Analysis of the External Characteristics

According to the numerical simulation results, the head and efficiency of pump devices were calculated, and the Origin software was used to draw the curves. Figure 7 shows the Q-H and Q-η curves of the two pump devices; the trend of the external characteristic curves of two pump devices is basically the same and the shaft front-positioned pump device has higher efficiency than the shaft rear-positioned pump device. This is consistent with the results in reference [9], however the efficiency of pump devices in this study is higher. Under design flow rate condition, the head of the shaft front-positioned tubular pump device is 4.71 m and its efficiency is 81.78%, and this working condition is the optimal working condition. The head of the shaft rear-positioned tubular pump device is 4.45 m and efficiency is 79.73%. When the Q/Qd = 0.95, the efficiency of the shaft rear-positioned pump device is the highest, and the peak efficiency is 80.26%, the head is 5.02 m. The maximum efficiency difference between the two pump devices is only 1.52%. Under design condition, the hydraulic performance of both pump devices is excellent, which exceeds the standard Chinese requirements (GB50265-2010) that the efficiency of axial flow pump stations and mixed flow pump stations should not be less than 70~75%. Results show that the two tubular pump devices have high application value.

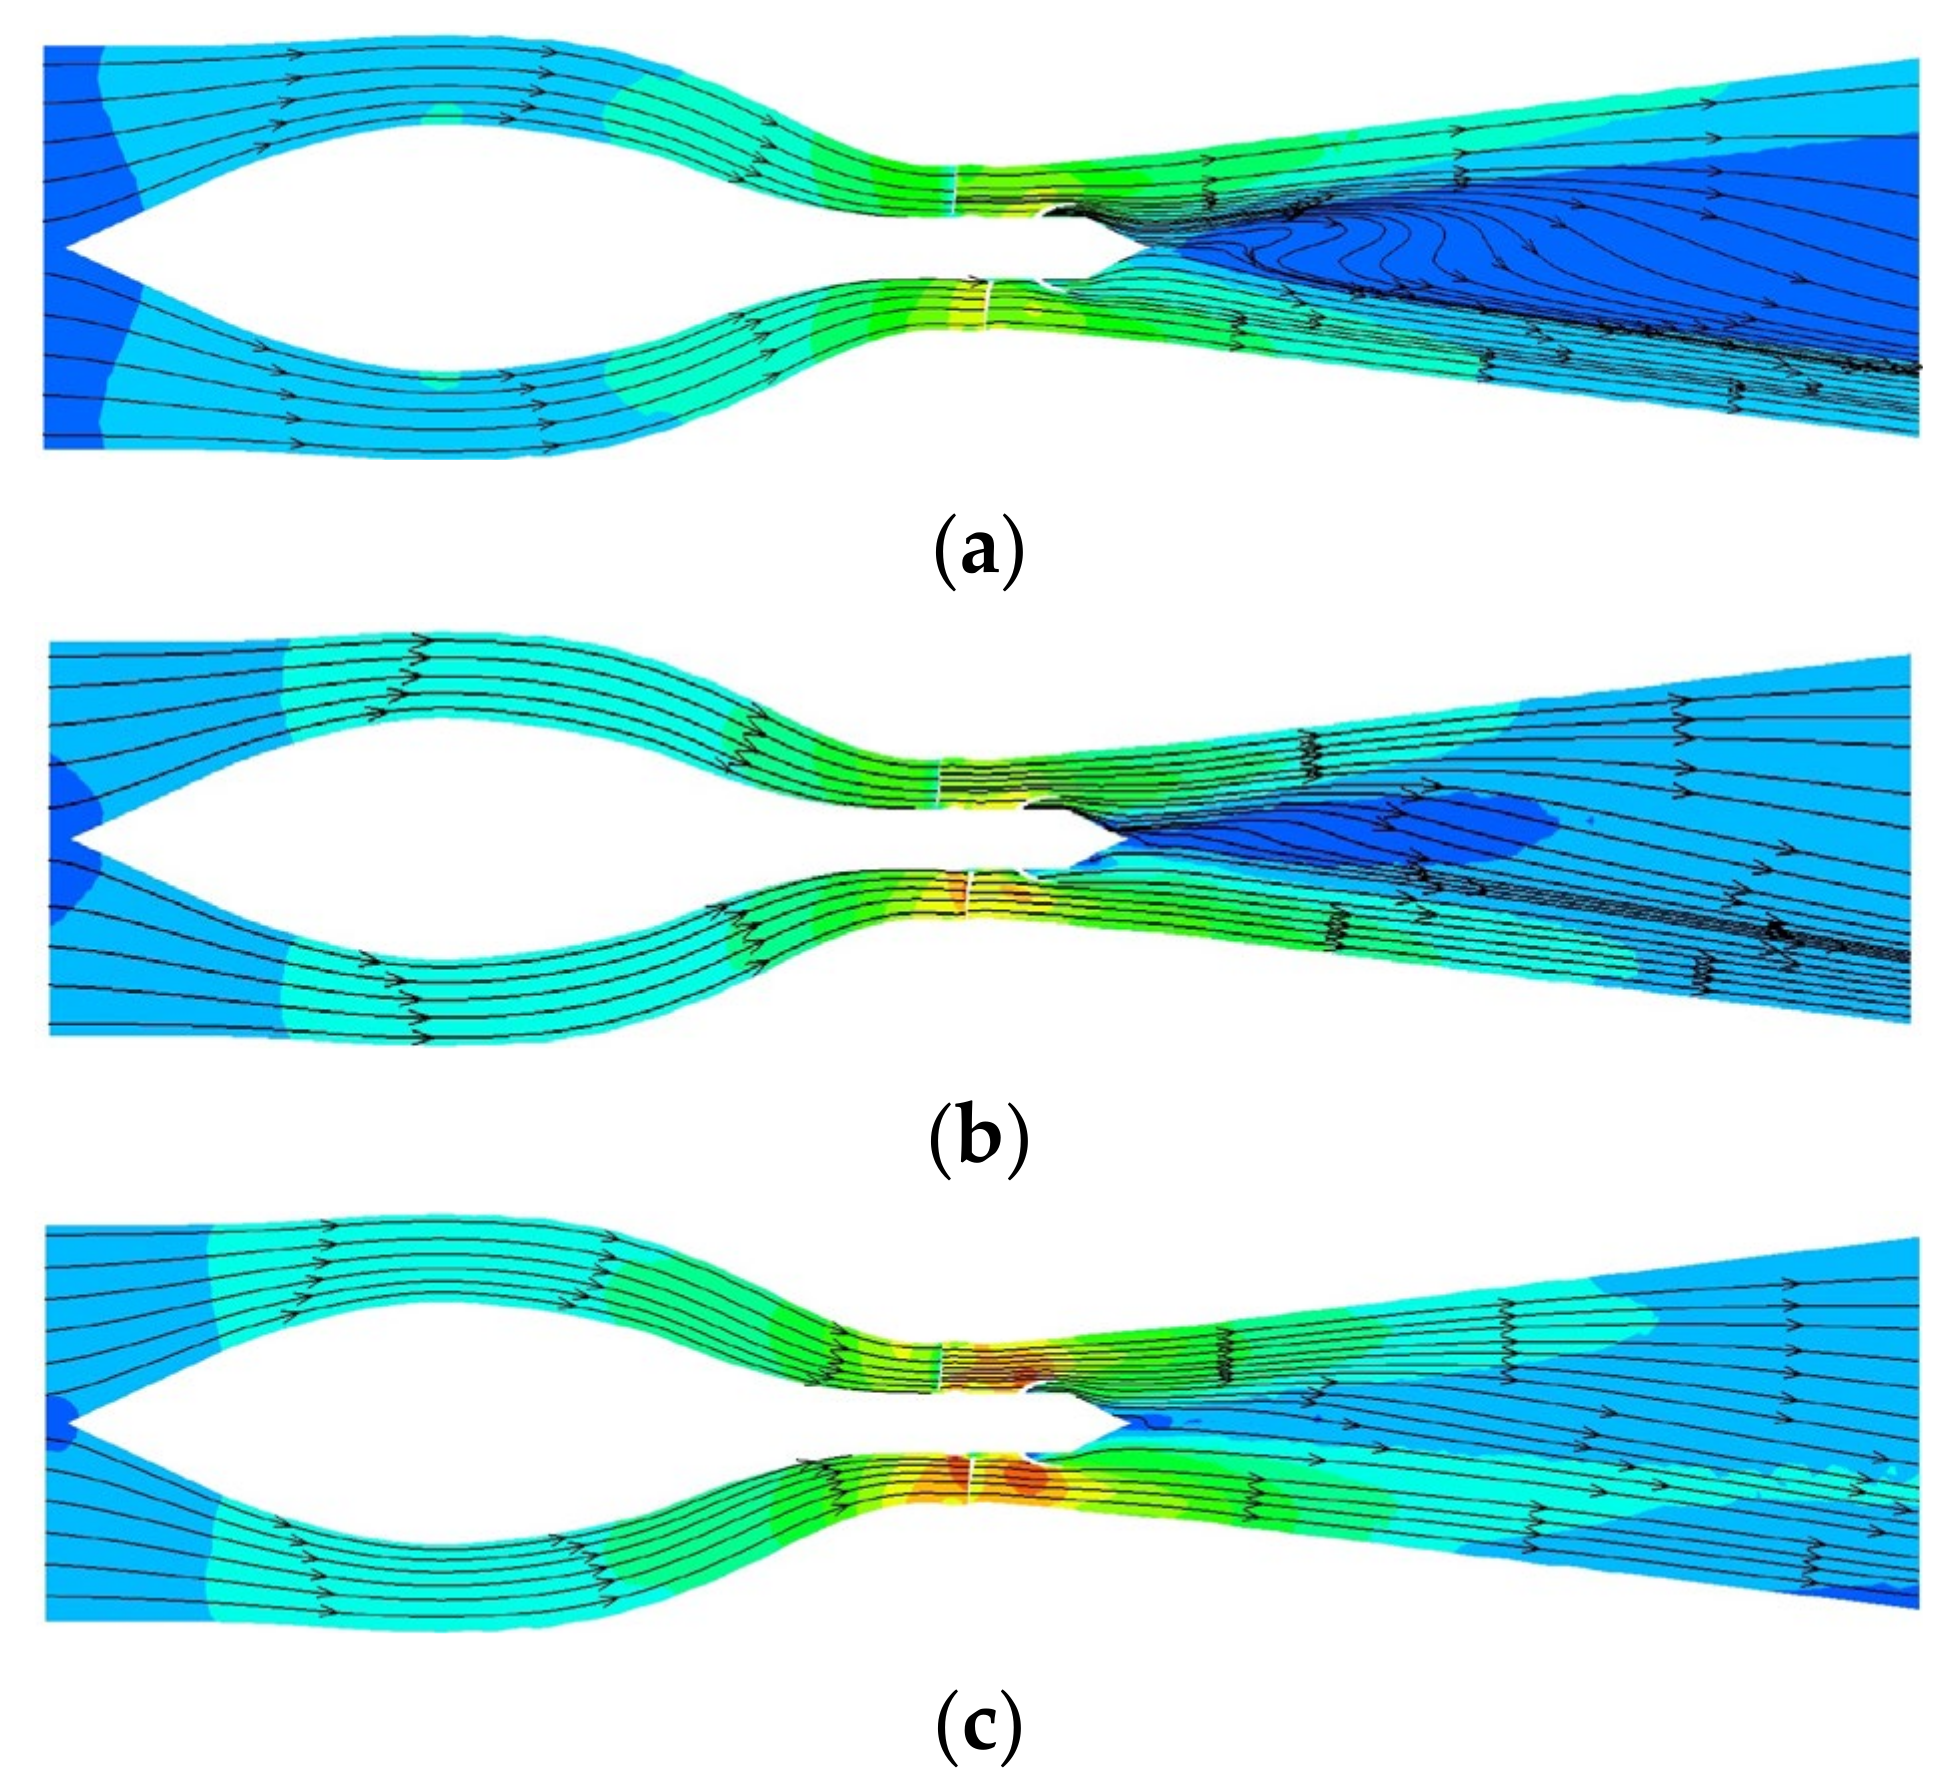
4.2. Analysis of the Flow Pattern in Pump Devices

Tecplot software was used to post-process the numerical simulation results, and the flow field distribution inside the pump devices was obtained. Figure 8 and Figure 9 show the streamlines and velocity contour on horizontal cross sections of two pump devices under different working conditions. For the shaft front-positioned pump device, the shaft inlet passage changes from a smooth and gradually shrinking section to a circular section. The flow is divided into two strands by the shaft, the flow velocity on both sides of the shaft increases gradually and the flow pattern is symmetrically distributed along the shaft. Under different working conditions, the streamlines in the inlet passage are smooth, the flow moves almost vertically into the impeller, and the velocity distribution is uniform. There is no bad flow pattern such as vortex. The water flow enters the outlet passage after passing through the pump. Since the guide vane cannot recover all the circulation, the water flow in the outlet passage is spirally advancing, and the rotation direction is consistent with the impeller rotation. Under different working conditions, the flow in the outlet passage diffuses uniformly, the flow velocity decreases gradually, the streamline is smooth and there is no bad flow pattern. The flow field of the shaft front-positioned is basically the same as that in reference [7].
For the shaft rear-positioned pump device, the streamlines in the straight inlet passage are smooth under different working conditions, the flow velocity increases gradually, and there is no vortex or backflow. The flow passes through the pump section, enters the outlet passage with the residual circulation, and is divided into two strands by the shaft. When the Q/Qd = 0.8 and 1.0, the flow in the shaft outlet passage flows forward along the shaft, and the flow velocity decreases uniformly. When the Q/Qd = 1.2, along the flow direction, there is a large range of vortex close to the tail of the shaft. Compared with reference [10], the optimized shaft rear-positioned pump device in this paper has better internal flow pattern and higher efficiency.
Comparing the internal flow characteristics of the two pump devices, it can be found that the flow pattern of the impeller and the guide vane are basically the same under different working conditions. The straight inlet passage and the shaft inlet passage can provide good flow conditions for the impeller. Under different working conditions, the flow pattern of the straight outlet passage is good, while under large flow rate condition, there is a large of vortex at the tail of the shaft.

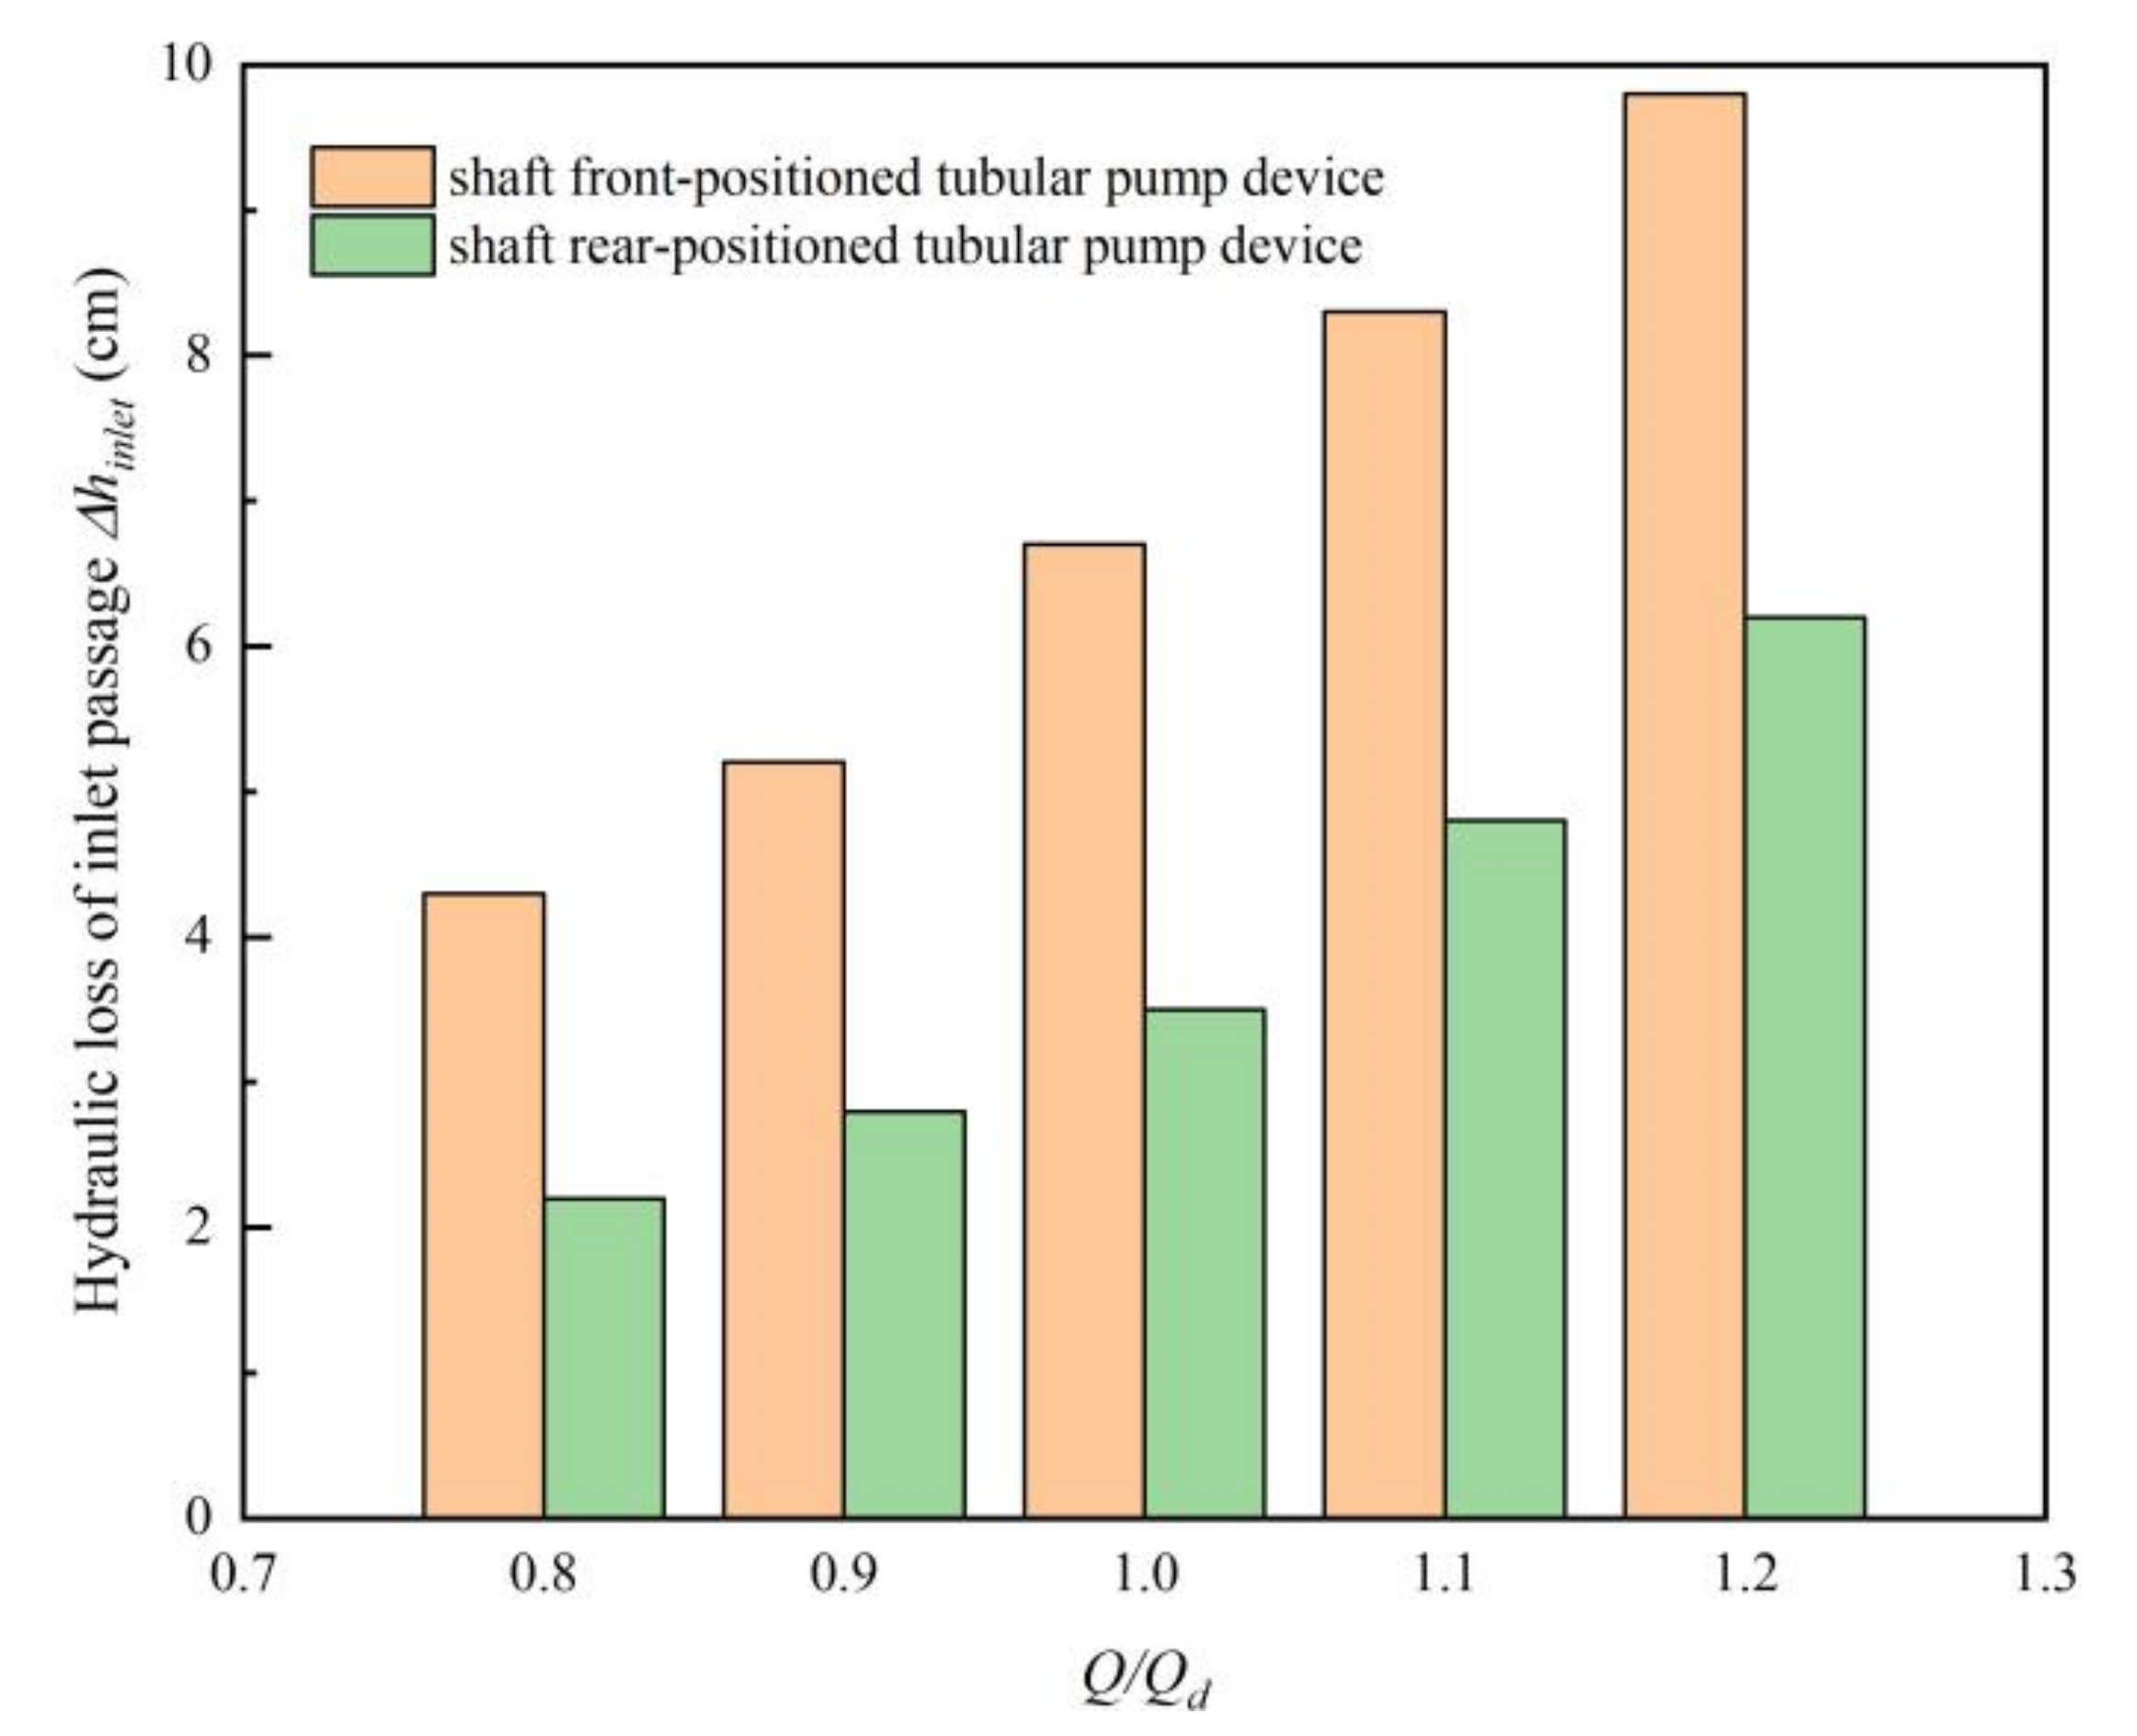
4.3. Analysis of Hydraulic Performance of Inlet Passage

In this study, to quantitatively compare the superiority of the inlet passages of two pump devices, the uniformity of the velocity distribution (Vu) and the weighted-velocity average angle (θ) are introduced in addition to the head loss. In an ideal state, Vu = 100% and θ = 90°. The formulas are as follows:
Δ h = E i n E o u t ρ g ,
where Ein and Eout, respectively, represent the total pressure of the inlet and outlet section, Pa.
V u = 1 1 u a ¯ u a i u a ¯ 2 m × 100 % ,
θ = i = 1 n u a i 90 arctan u u i u a i i = 1 n u a i ,
where uai and u a ¯ , respectively, represent the axial velocity of each element and the averaged axial velocity of calculation section, m/s, uti is the tangential velocity of each element of the calculation section, m/s.
Figure 10 shows the hydraulic loss of inlet passages under different conditions, it can be found that when the flow rate increases, the loss also increases, and the loss is related to the quadratic of flow. The hydraulic loss of two inlet passages is within 10 cm, and the loss of shaft front-positioned inlet passage is slightly larger. The reason for this gap is that the shaft is set in the passage, resulting in a slightly larger velocity than the straight inlet passage.
The results in Figure 11 suggest that Vu and θ increase with an increasing flow rate, in the calculation conditions, Vu and θ at the shaft front-positioned inlet passage outlet are larger than those of the straight inlet passage, and when the flow rate increases, the gap between the two decreases gradually. In the design condition, the hydraulic loss of shaft inlet passage is 7.4 cm, and Vu = 83.78%, θ = 82.37°, whereas the hydraulic loss of straight inlet passage is 3.9 cm, and Vu = 82.39%, θ = 81.68°. Overall, both inlet passages have excellent hydraulic performance. According to Figure 10 and Figure 11, it can be found that the hydraulic performance of two inlet passages is excellent, and the hydraulic loss is close to each other.

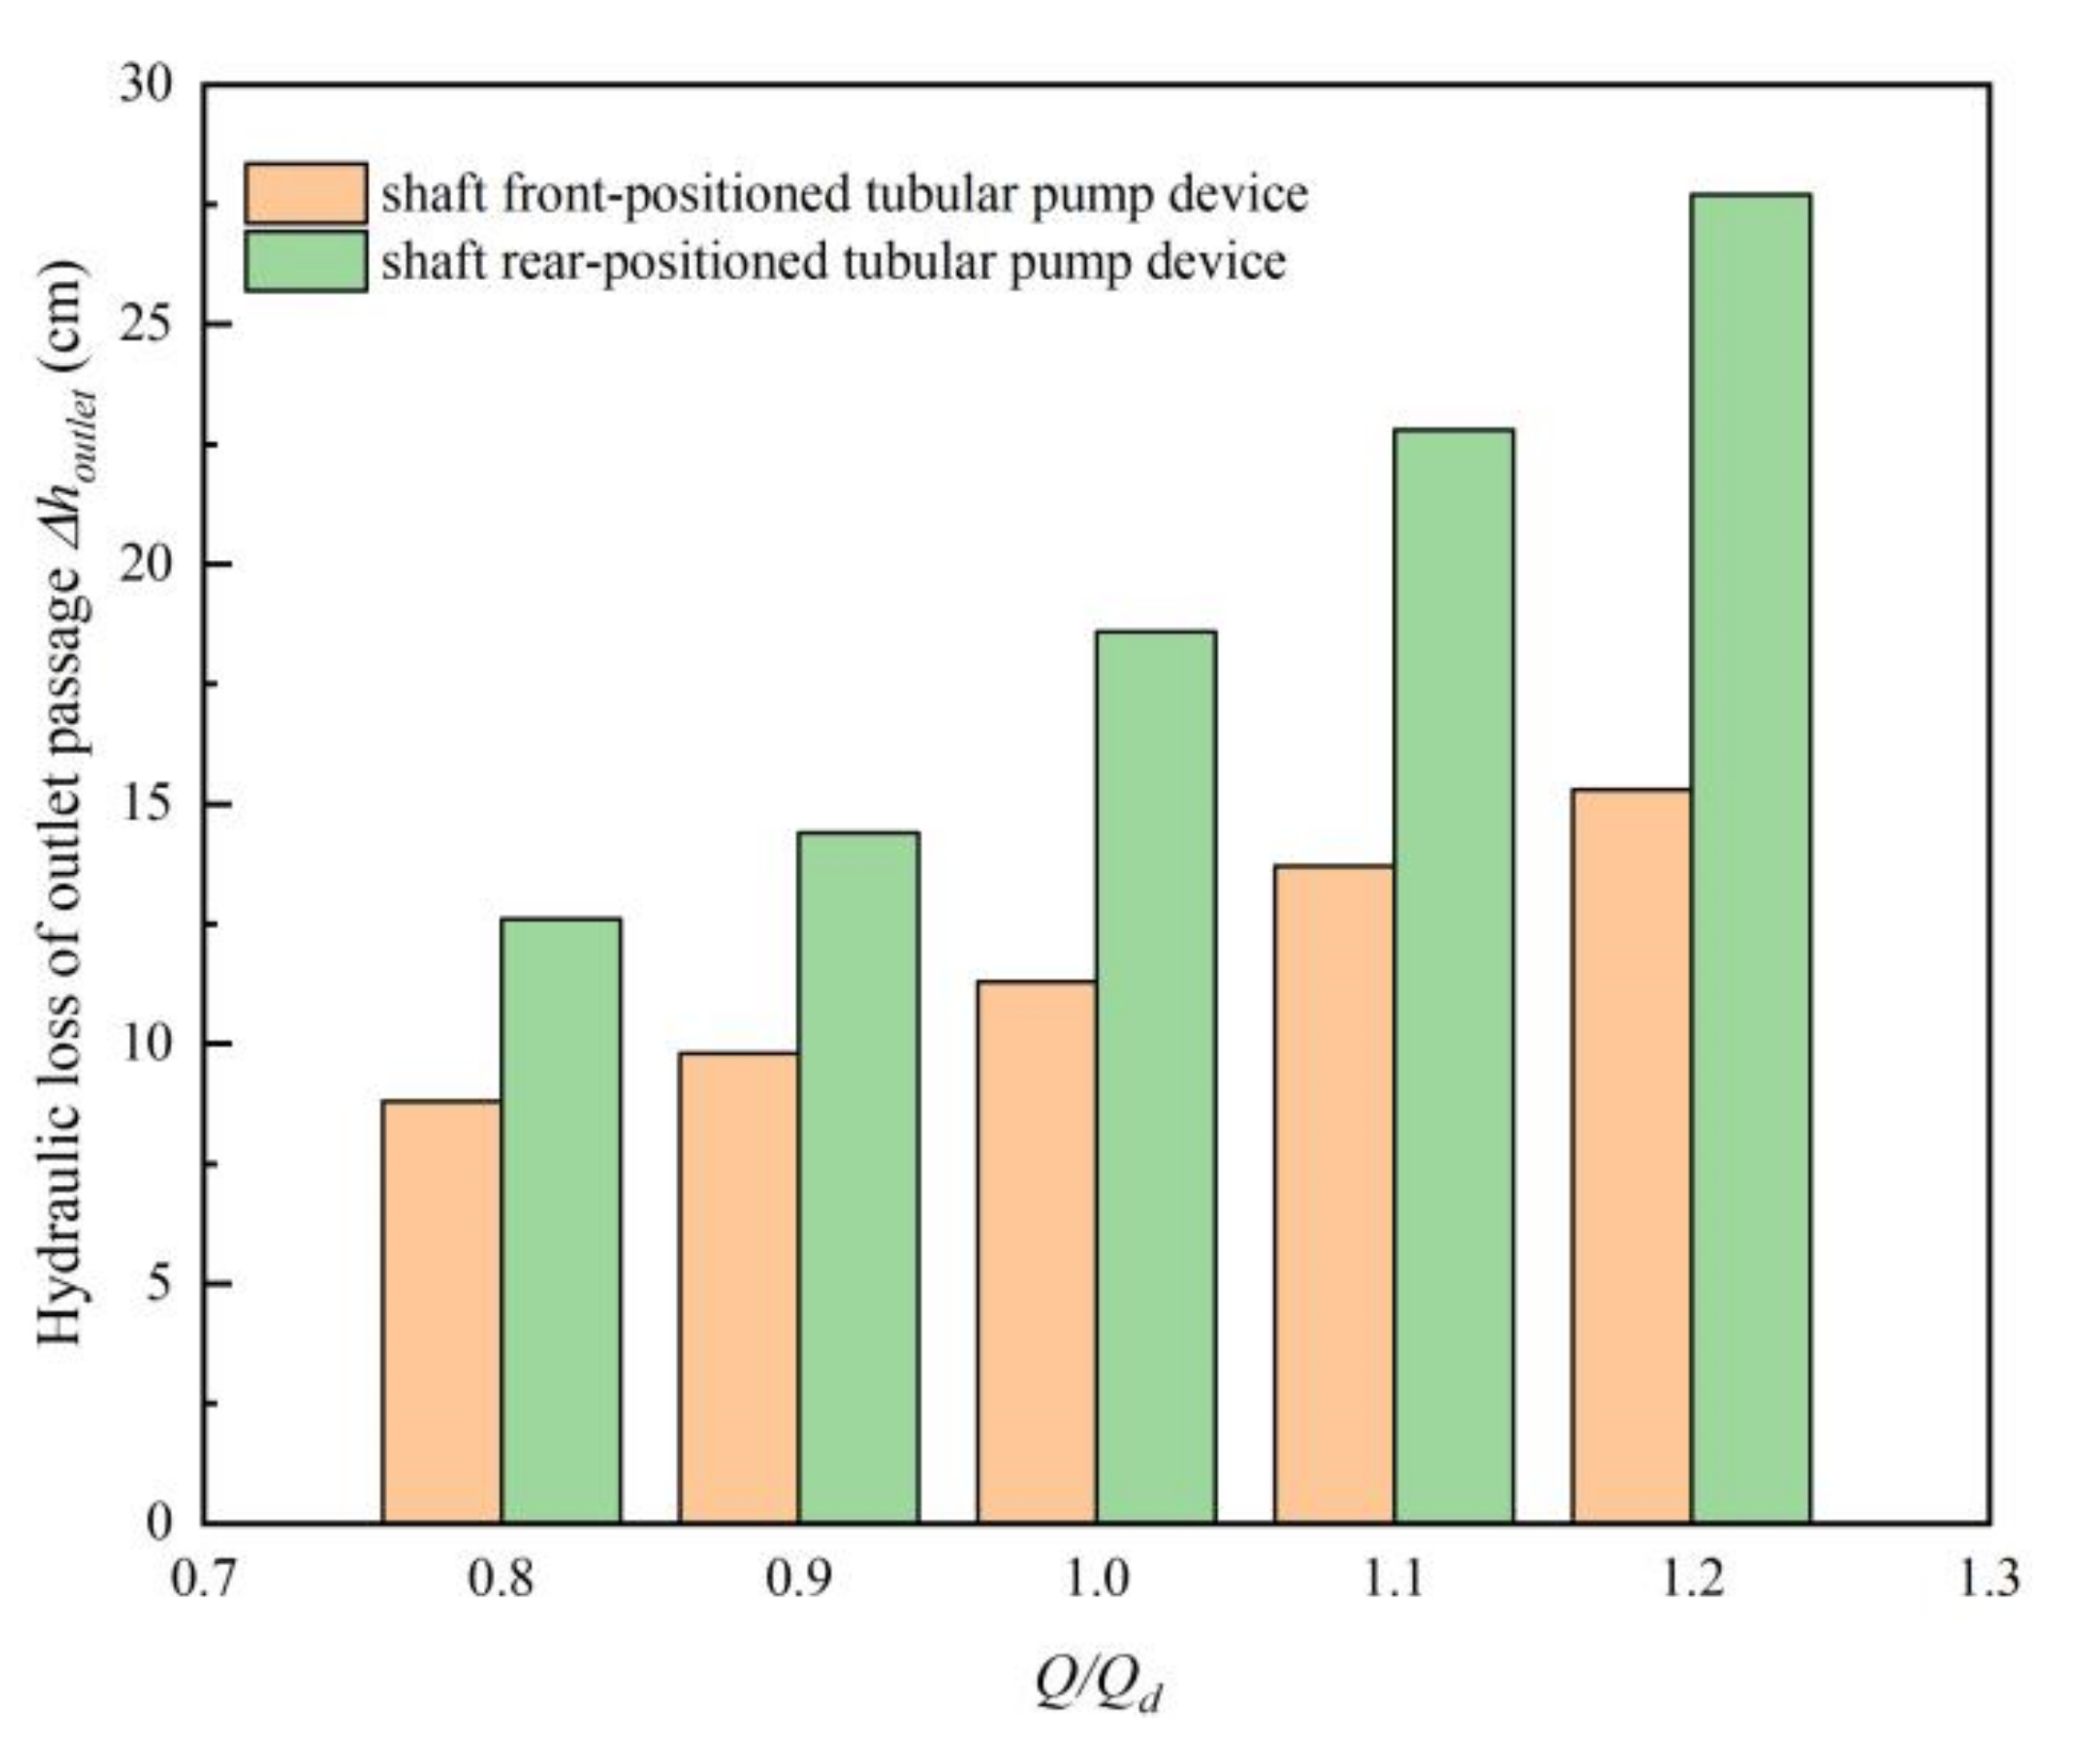
4.4. Analysis of the Hydraulic Performance of Outlet Passage

Figure 12 shows the hydraulic loss of outlet passages under different conditions, it can be found that the loss increases with increasing flow rate. Under design conditions, the loss of straight outlet passage is 11.3 cm, while that of the shaft rear-position outlet passage is 18.6 cm, and the ratio of two outlet passages is 0.608. When the Q/Qd = 0.8, the loss of straight outlet passage is 8.8 cm, while that of the shaft rear-position outlet passage is 12.6 cm, and the ratio of two outlet passages is 0.698. When the Q/Qd = 1.2, the loss of straight outlet passage is 15.3 cm, while that of the shaft rear-position outlet passage is 27.7 cm, and the ratio of two outlet passages is 0.552. With the increase of flow rate, the loss of the straight pipe outlet passage is much smaller than that of the shaft rear-position outlet passage, which is the reason why the efficiency of the shaft front-positioned pump device is obviously higher under large flow condition.
According to Figure 10 and Figure 12, we found that compared with the inlet passage, the loss of the outlet passage accounts for a large proportion of the total loss. Therefore, the performance of the outlet passage will greatly affect the efficiency of the pump device. The total loss of the pre-shaft pump device is smaller than that of the shaft rear-positioned pump device, and the efficiency is higher.

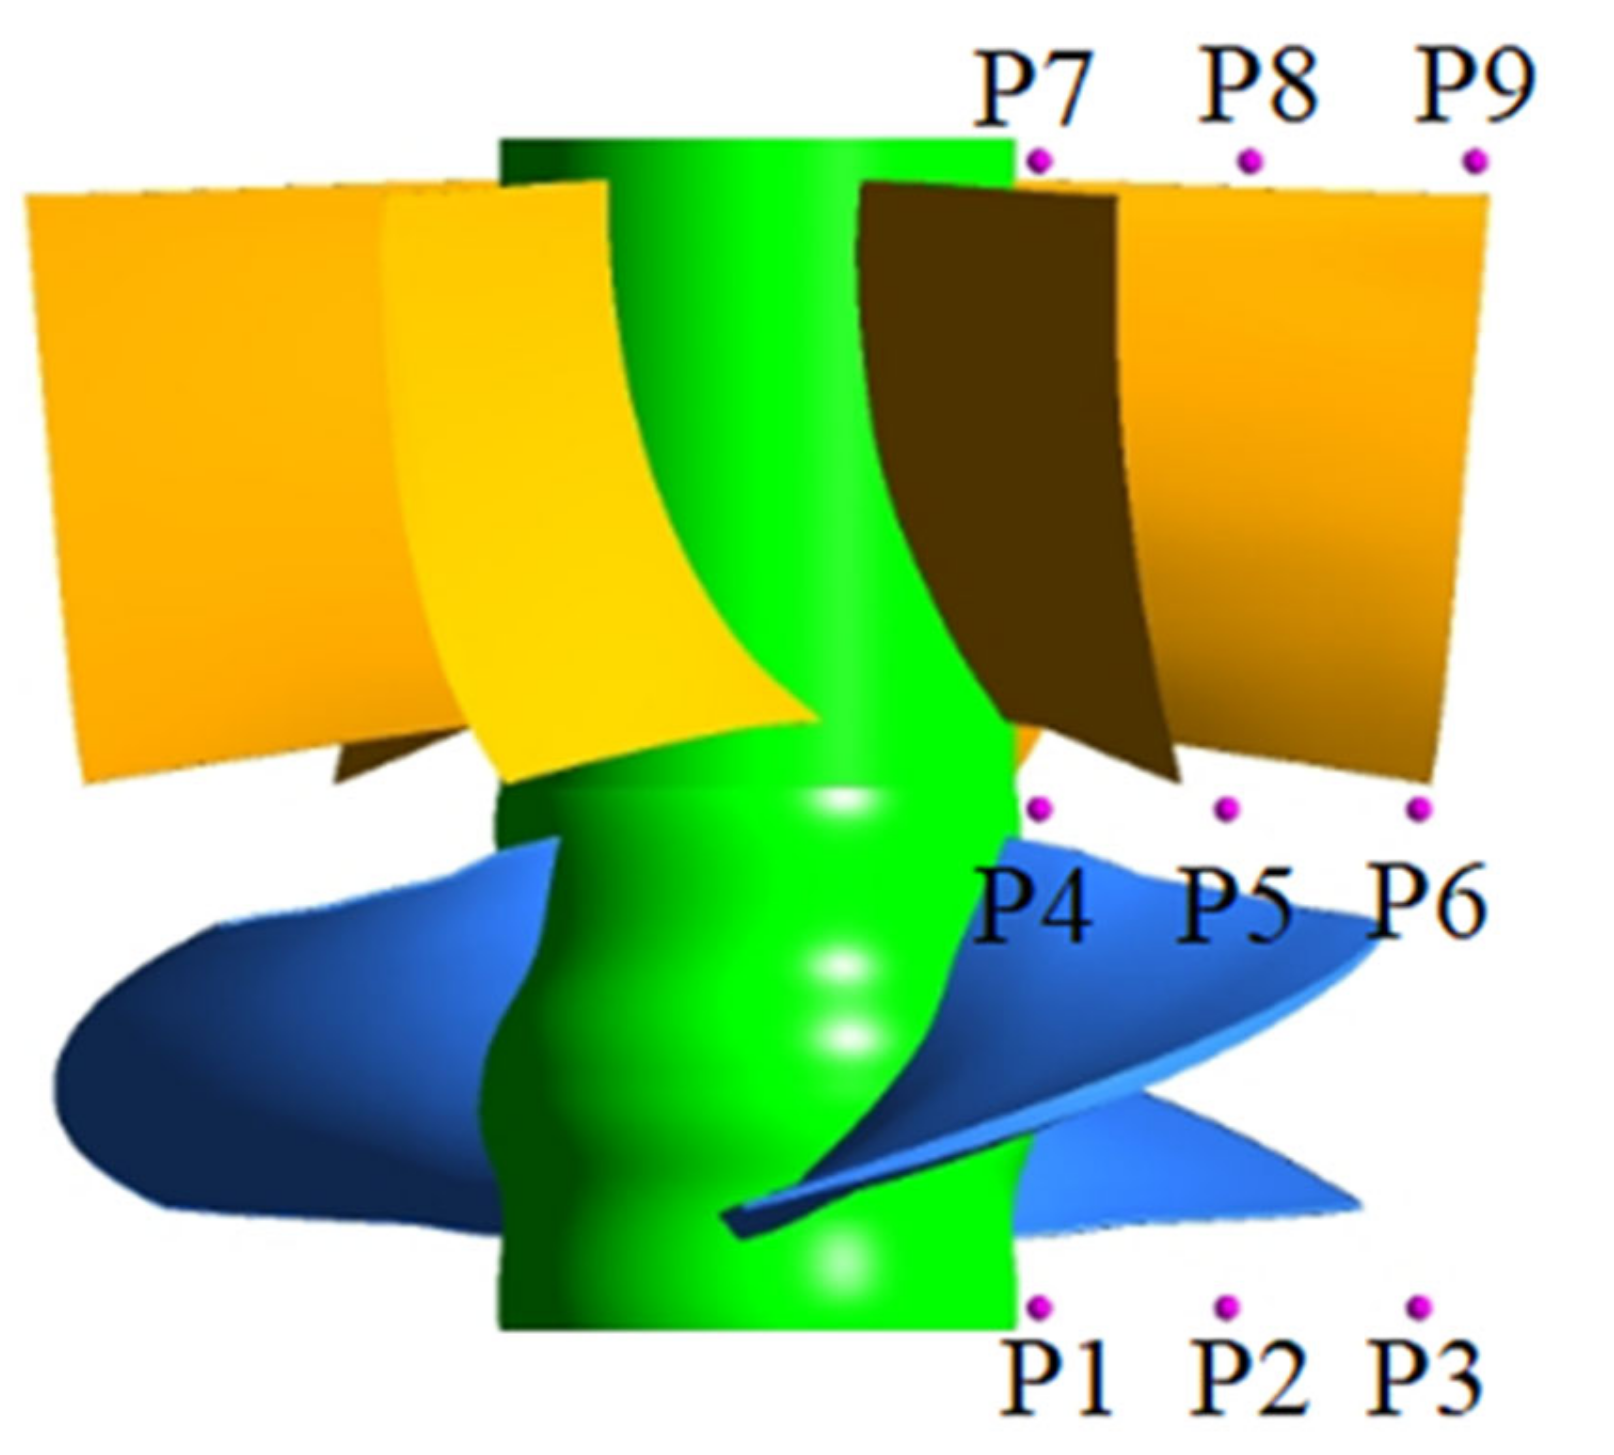
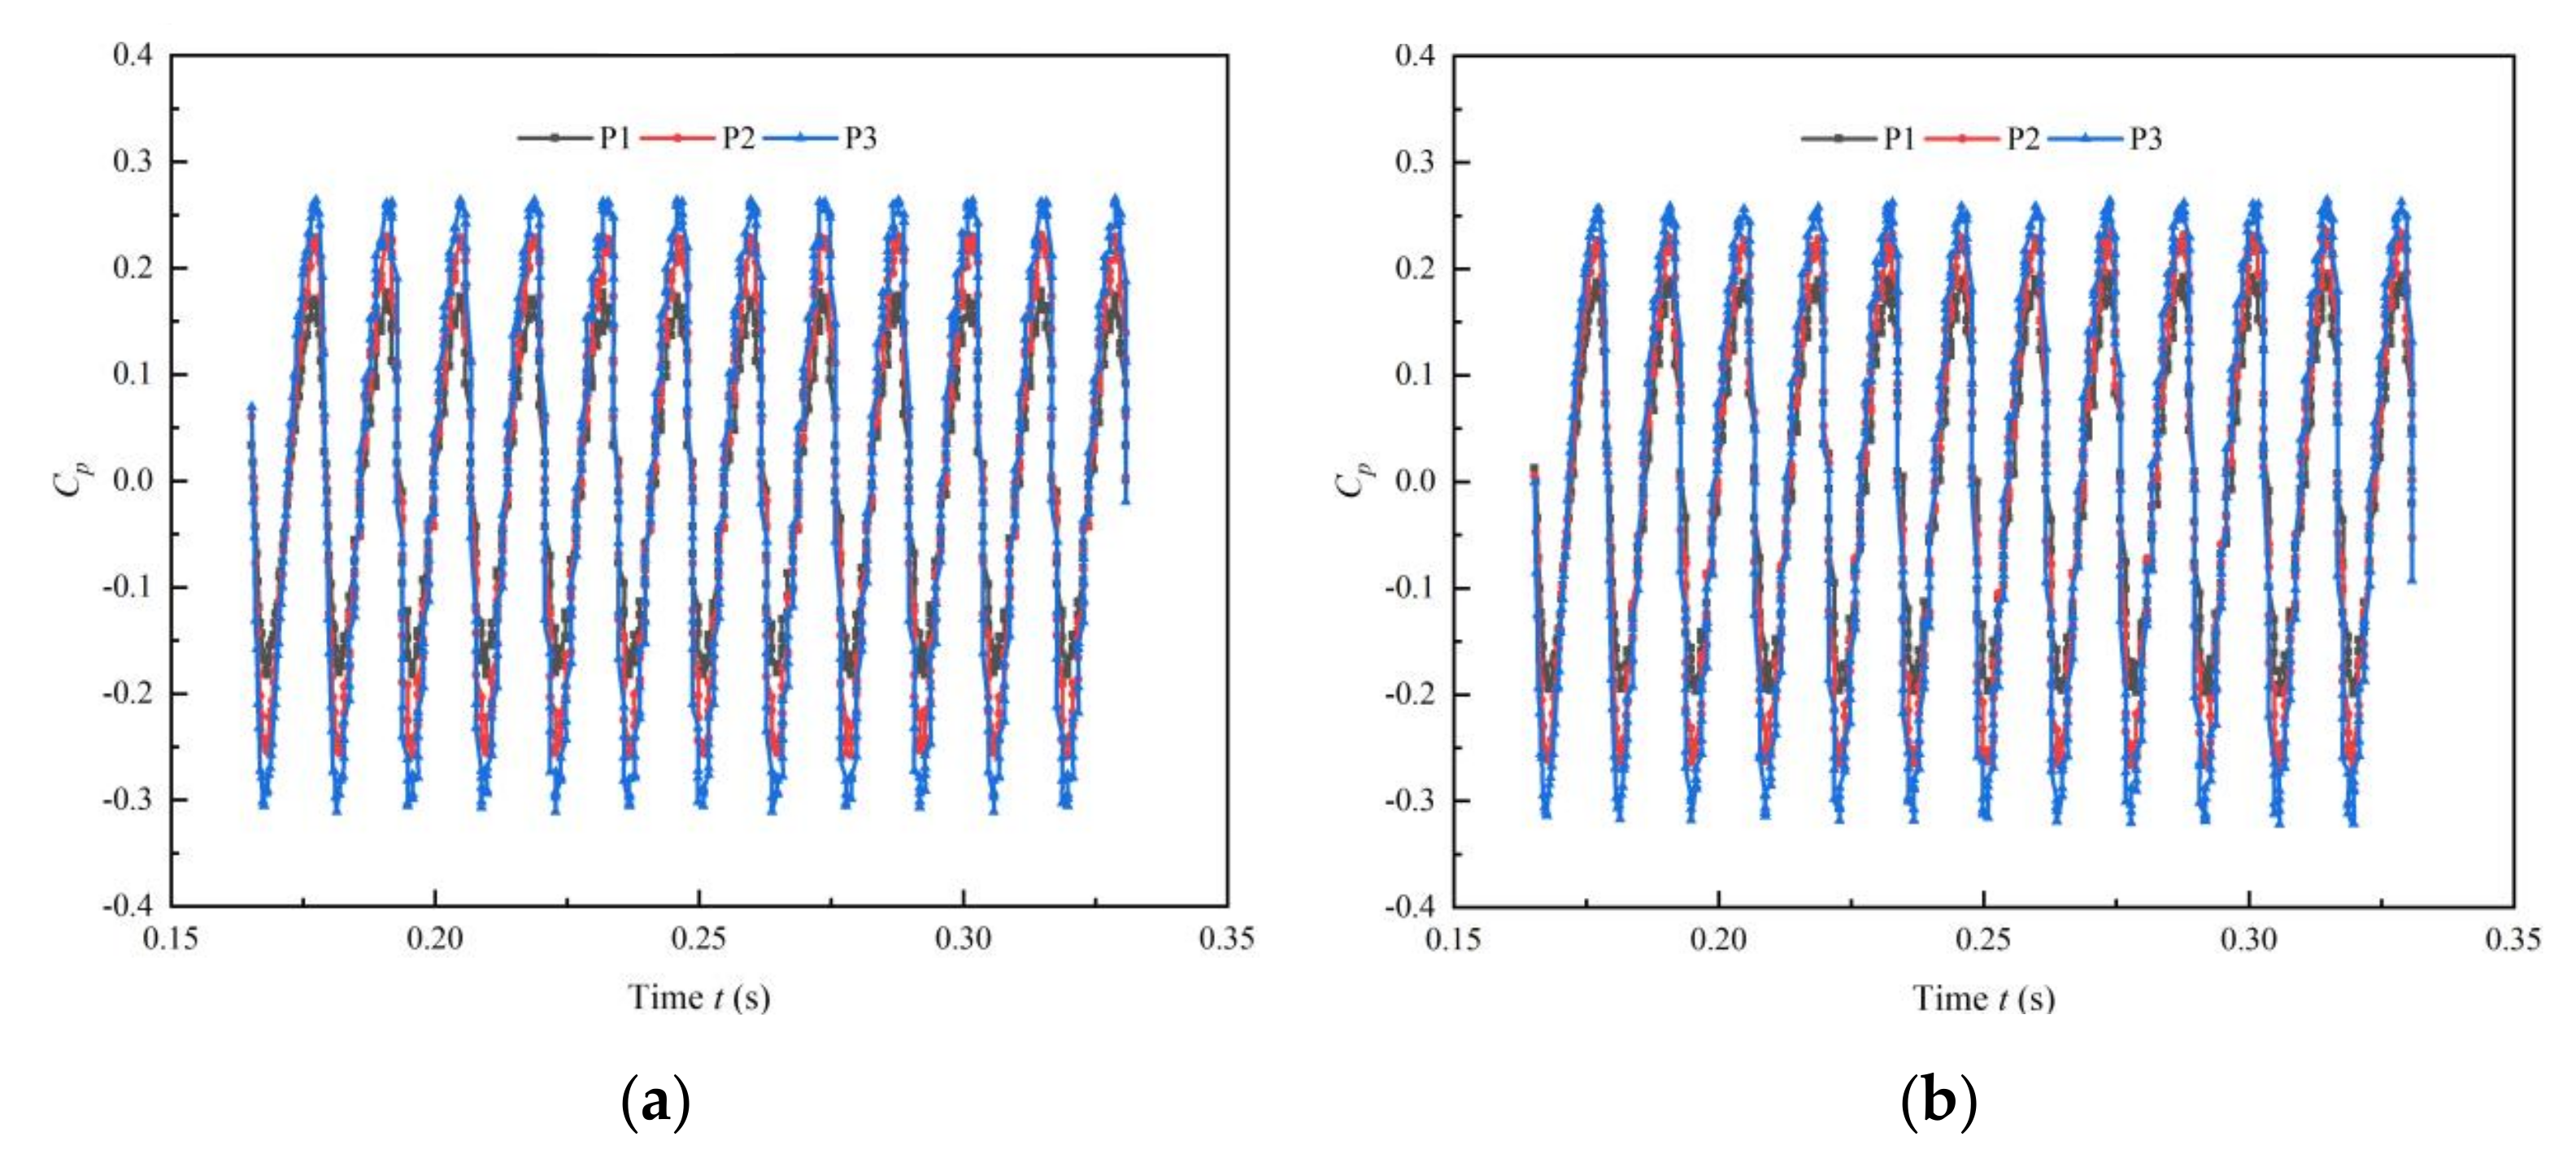
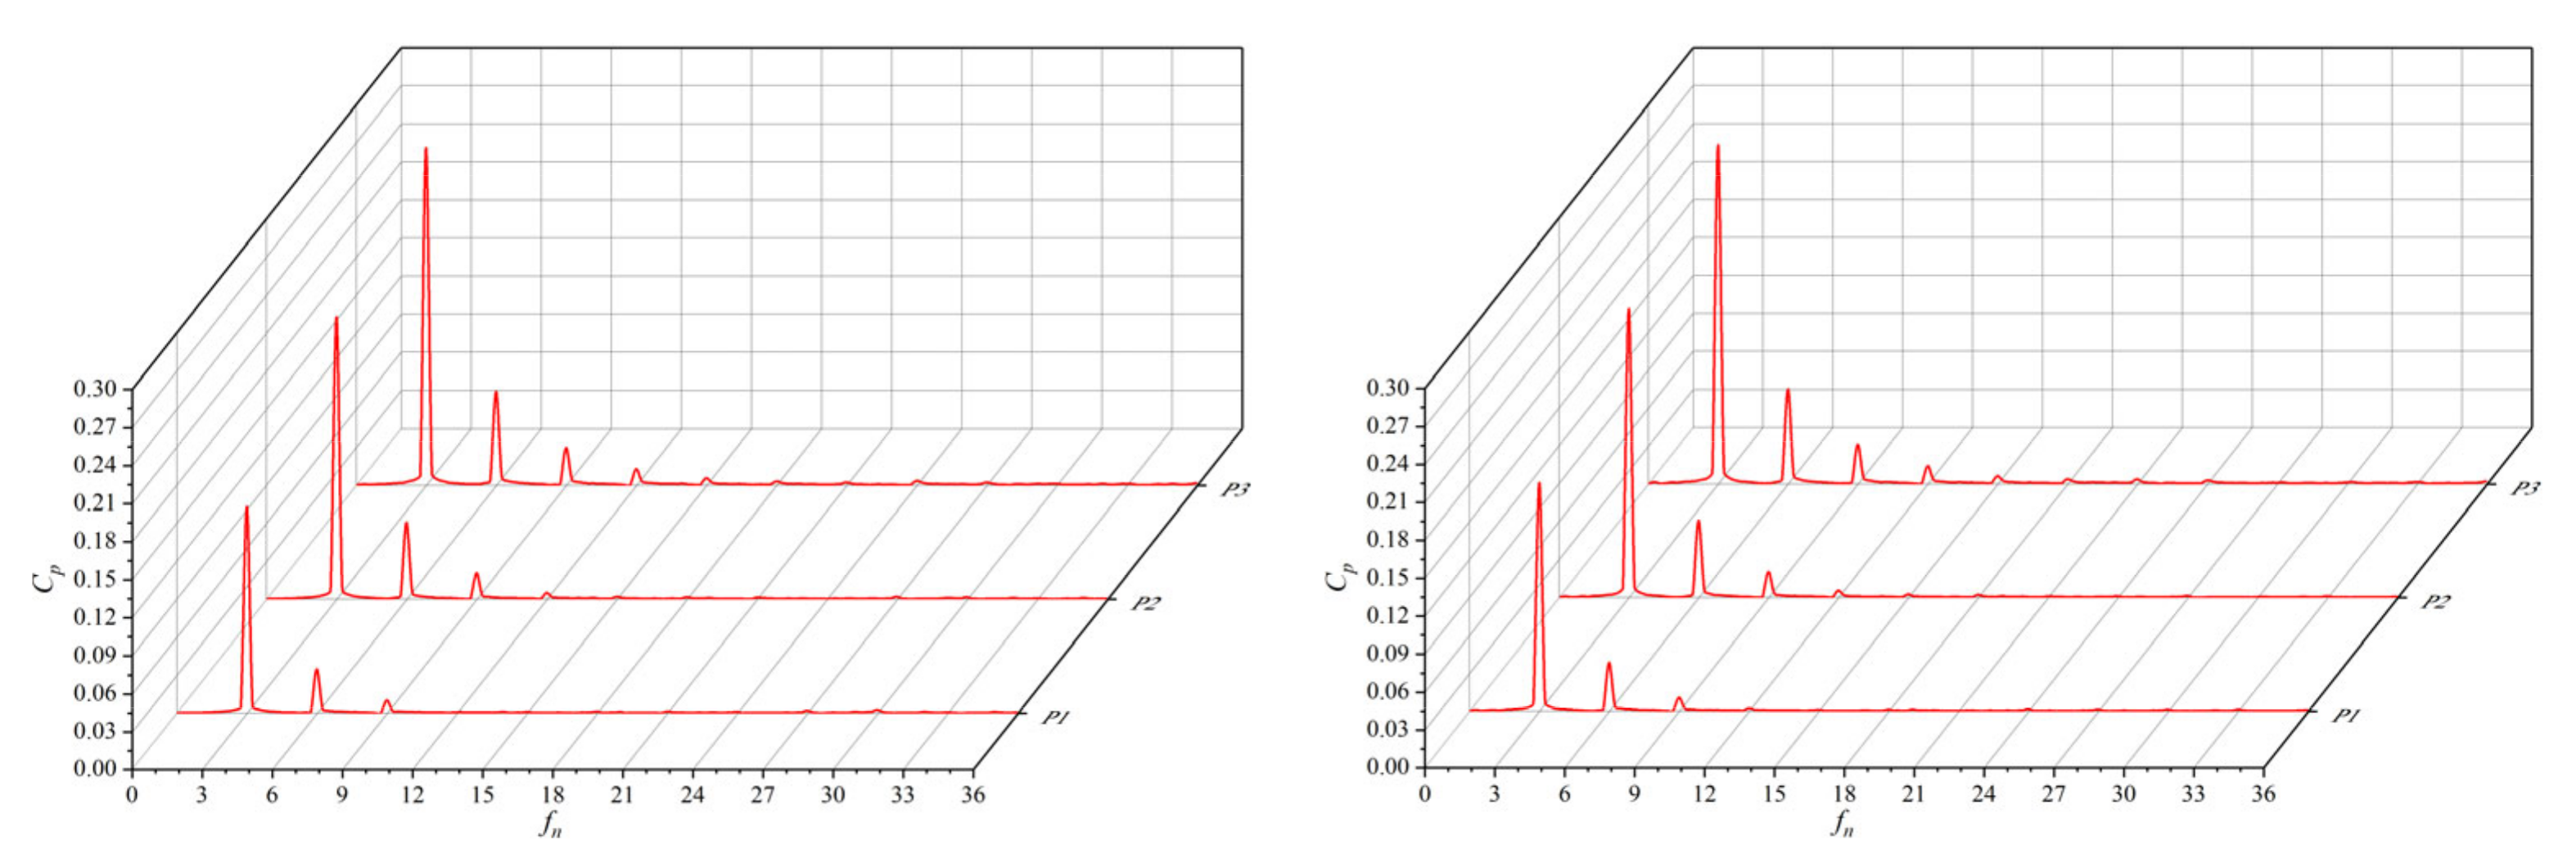
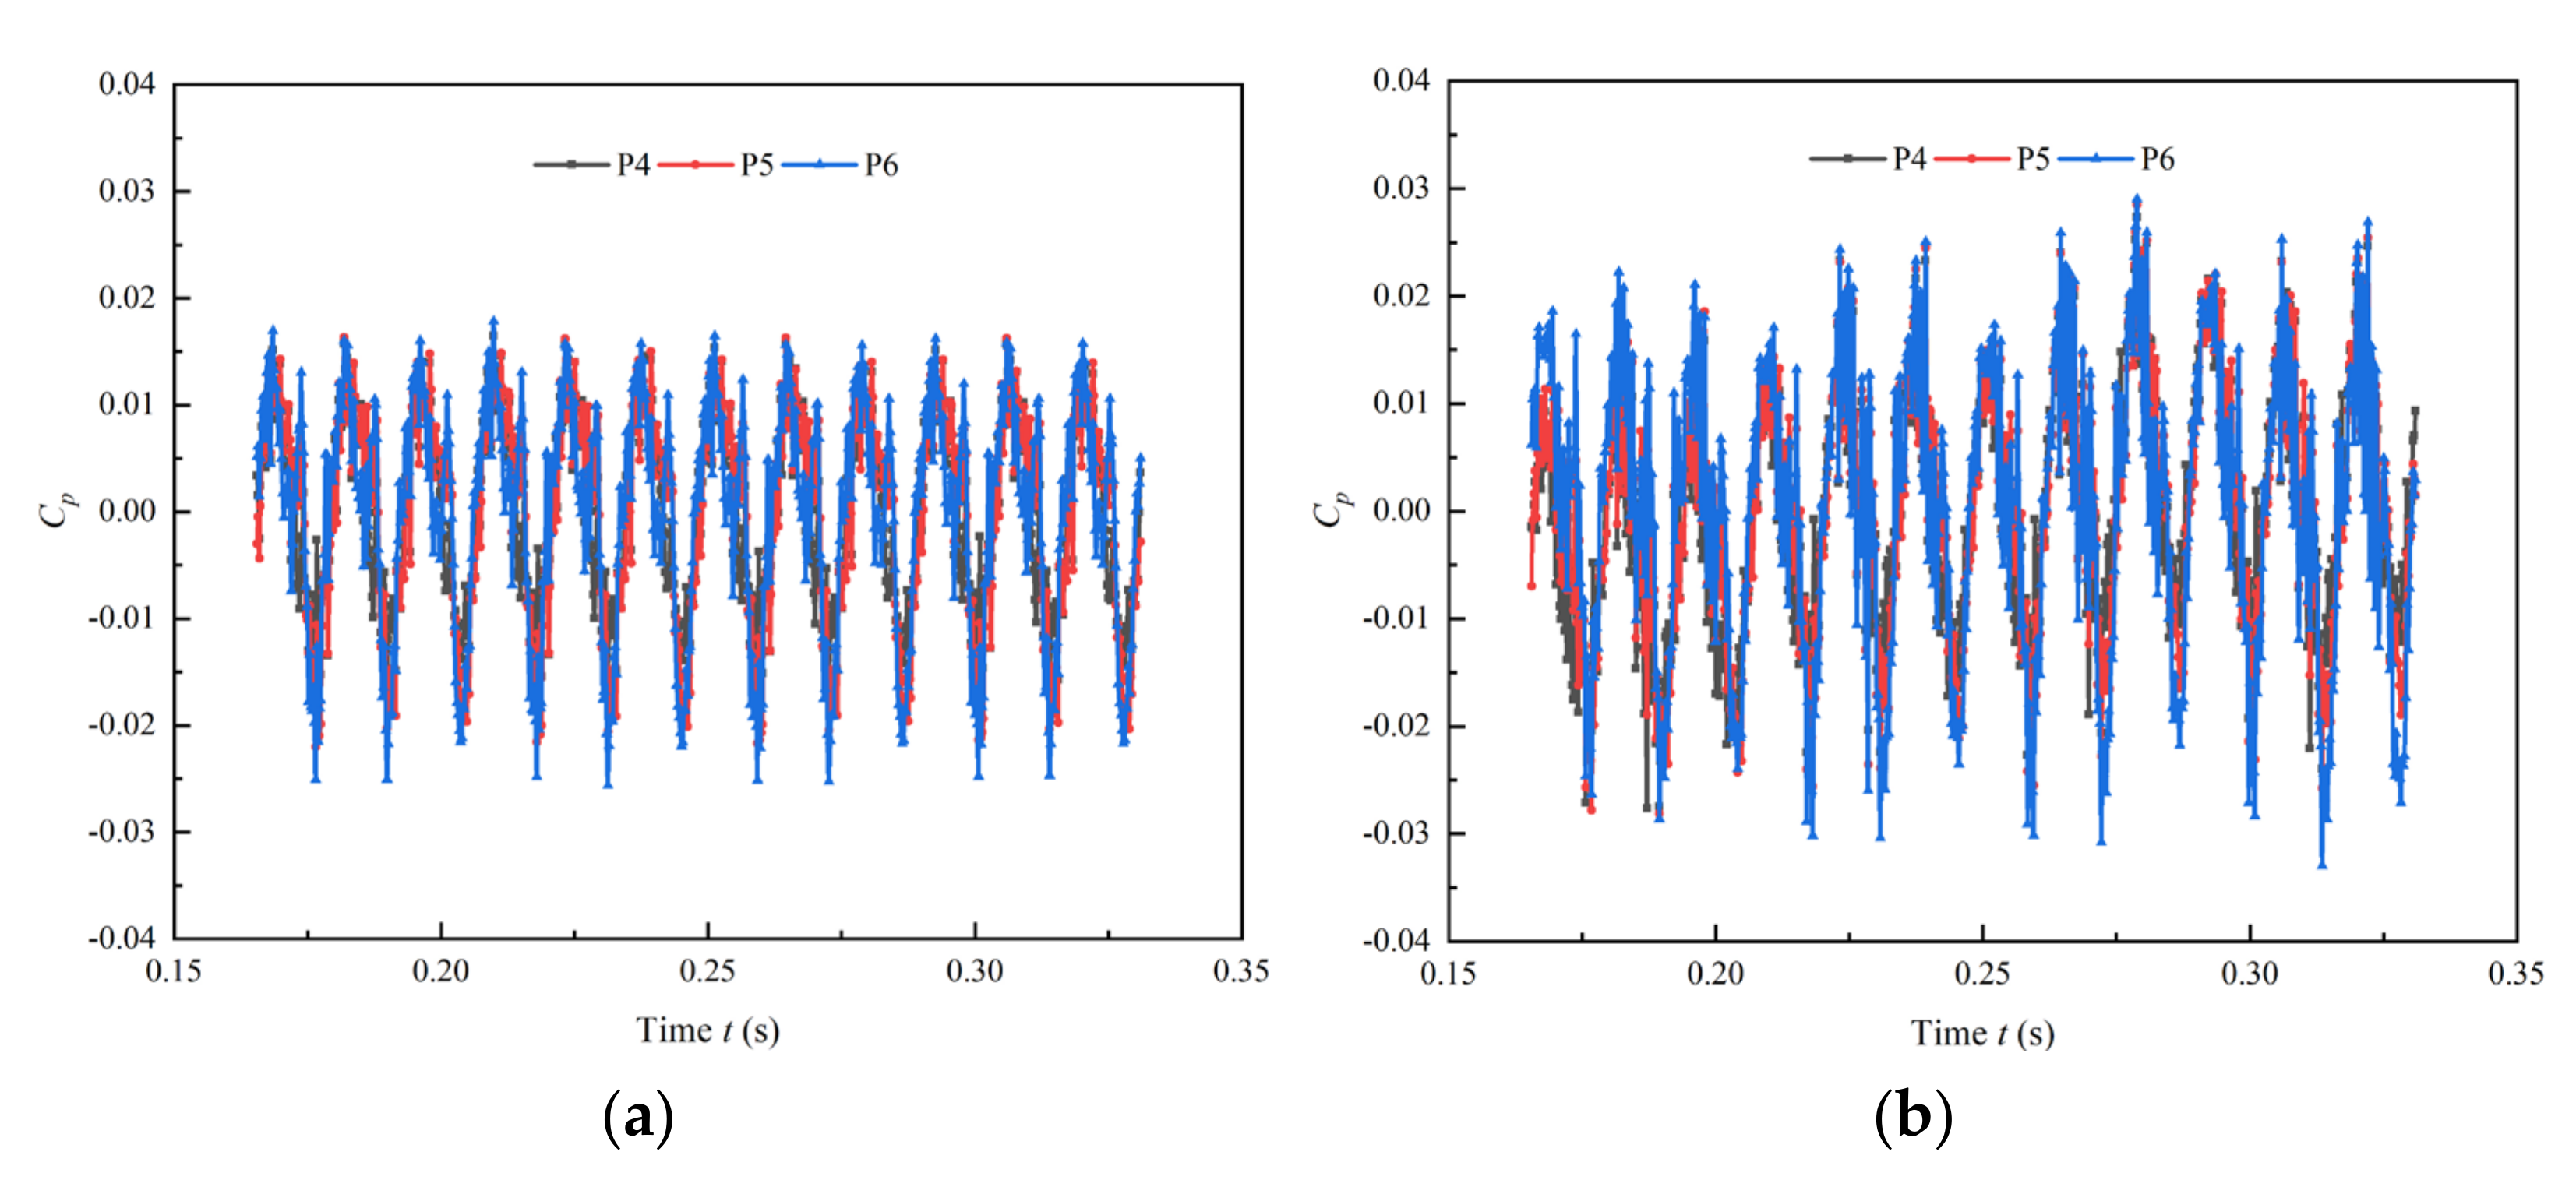
4.5. Analysis of Pressure Pulsation Characteristics

The complex flow inside the axial flow pump will cause pressure pulsation. It is easy to cause vibration, noise and reduce the efficiency and service life of the pump device. With the increase of the calculation cycle, the flow field tends to be stable, so the pressure date of the last four cycles were taken for analysis. The monitoring points P1–P3 are set at the impeller inlet from the hub to the shroud, P4–P6 are set at the impeller outlet from the hub to the shroud, P7–P9 are set at the guide vane outlet from the hub to the shroud.
The dimensionless pressure pulsation coefficient Cp and rotating frequency fn are used. The formulas are as follow:
f n = 60 F n ,
C p = P i P a v e P a v e ,
where F is the frequency obtained by FFT, Hz; Pi and Pave represent instantaneous pressure and average pressure, Pa.
Figure 13 and Figure 14 show the time domain and frequency domain diagrams of P1-–P3 of two pump devices. The pressure pulsation of two pump devices at the impeller inlet is sinusoidal and has obvious periodicity. There are three peaks and three troughs in a rotation cycle which is consistent with the number of blades, indicating that the pressure pulsation at the impeller inlet is affected by the number of blades. The length of peaks and troughs is basically the same. The amplitude of the pressure pulsation increases from P1 to P3. For the shaft front-positioned pump device, the amplitude at P3 is 1.42 times that at P1 and 1.2 times that at P2. For the shaft rear-positioned pump device, the amplitude at P3 is 1.48 times that at P1 and 1.22 times that at P2. Moreover, the amplitude of the shaft rear-positioned pump device is slightly larger than that of the shaft front-positioned pump device, and the ratios from P1 to P3 are 1.08, 1.05 and 1.02, respectively. This may be due to the inlet conditions for the impeller provided by the shaft inlet passage is slightly better than that provided by the straight inlet passage.
By analyzing the frequency domain in Figure 14, it is found that the main frequency of three monitoring points is three times the rotating frequency (RF), which is consistent with the blade passing frequency (BPF), the second main frequency is six times the RF. The results demonstrate that the pressure pulsation at the impeller inlet is greatly affected by the number of blades.
Figure 15 and Figure 16 show the time domain and frequency domain diagrams of P4–P6 of two pump devices. It can be found from Figure 15 that there are three peaks and three troughs in a rotation period, which indicates that the pressure pulsation at the impeller outlet is still affected by the number of blades. Meanwhile the pressure pulsation amplitude increases from P4 to P6, and the amplitude at the impeller outlet is obviously smaller than that at the impeller inlet, accounting for about 15%. For the shaft front-positioned pump device, the amplitude at P6 is 1.45 times that at P4 and 1.16 times that at P5. For the shaft rear-positioned pump device, the amplitude at P6 is 1.4 times that at P4 and 1.17 times that at P5. The pressure pulsation amplitude of the shaft rear-positioned pump device is larger than that of the shaft front-positioned pump device, and the ratios from P4 to P6 are 1.53, 1.35 and 1.29, respectively.
According to Figure 16, it can be found that the main frequency of P4–P6 at the impeller inlet is three times the RF, and the second main frequency is six times the RF, which shows that the pressure pulsation at impeller outlet is also affected by the number of blades. The pressure pulsation amplitude increases from P4 to P6. Compared with the shaft front-positioned pump device, the low frequency pulsation at the impeller outlet of the shaft rear-positioned pump device is more abundant.
The time domain and frequency domain diagrams of P7–P9 of two pump devices are shown in Figure 17 and Figure 18. According to the time domain diagram, it is found that the pressure pulsation at the guide vane outlet has poor periodicity. The periodicity of the shaft rear-positioned pump device is obviously worse than that in the shaft front-positioned pump device. This is due to the shaft being set in the outlet passage, which hinders the rotating water flow and leads to poor periodicity. The amplitude at the guide vane outlet is smallest, which indicates that the guide vane can suppress part of the pressure pulsation. Meanwhile, the amplitude increases from P7 to P9, and the amplitude of the shaft rear-positioned pump device is larger than that of the shaft front-positioned pump device.
The main frequency of the monitoring points of the two pump devices is not three times the RF, which indicates that the pressure pulsation at the guide vane outlet is not affected by the number of blades. Compared with the shaft front-positioned pump device, the low frequency pulsation at the guide vane outlet of the shaft rear-positioned pump device is more abundant.

5. Conclusions

In this study, the hydraulic performance under different working conditions and the pressure characteristics under design conditions of the shaft front-positioned tubular pump device and the shaft rear-positioned tubular pump device were analyzed and studied, and a model experiment was conducted to validate the accuracy of simulation. The conclusions are as follows:
  • In the case of optimized shaft front-positioned and shaft rear-positioned pump devices, the efficiency of the shaft front-positioned pump device is higher than that of the shaft rear-positioned pump device. The highest efficiency of the shaft front and rear positioned pump device are 81.78% and 80.26%, respectively; both pump devices have excellent hydraulic performance.
  • The hydraulic performance of the inlet passage of the two pump devices is excellent, and can provide good flow conditions for the impeller, and the hydraulic loss is very small. The hydraulic performance of the straight outlet passage is better than that of the shaft outlet passage, and the gap increases with the increase of flow rate. The hydraulic loss of of the outlet passage has a great influence on the total loss of the pump device. In practical engineering, the outlet passage should be optimized to reduce the loss.
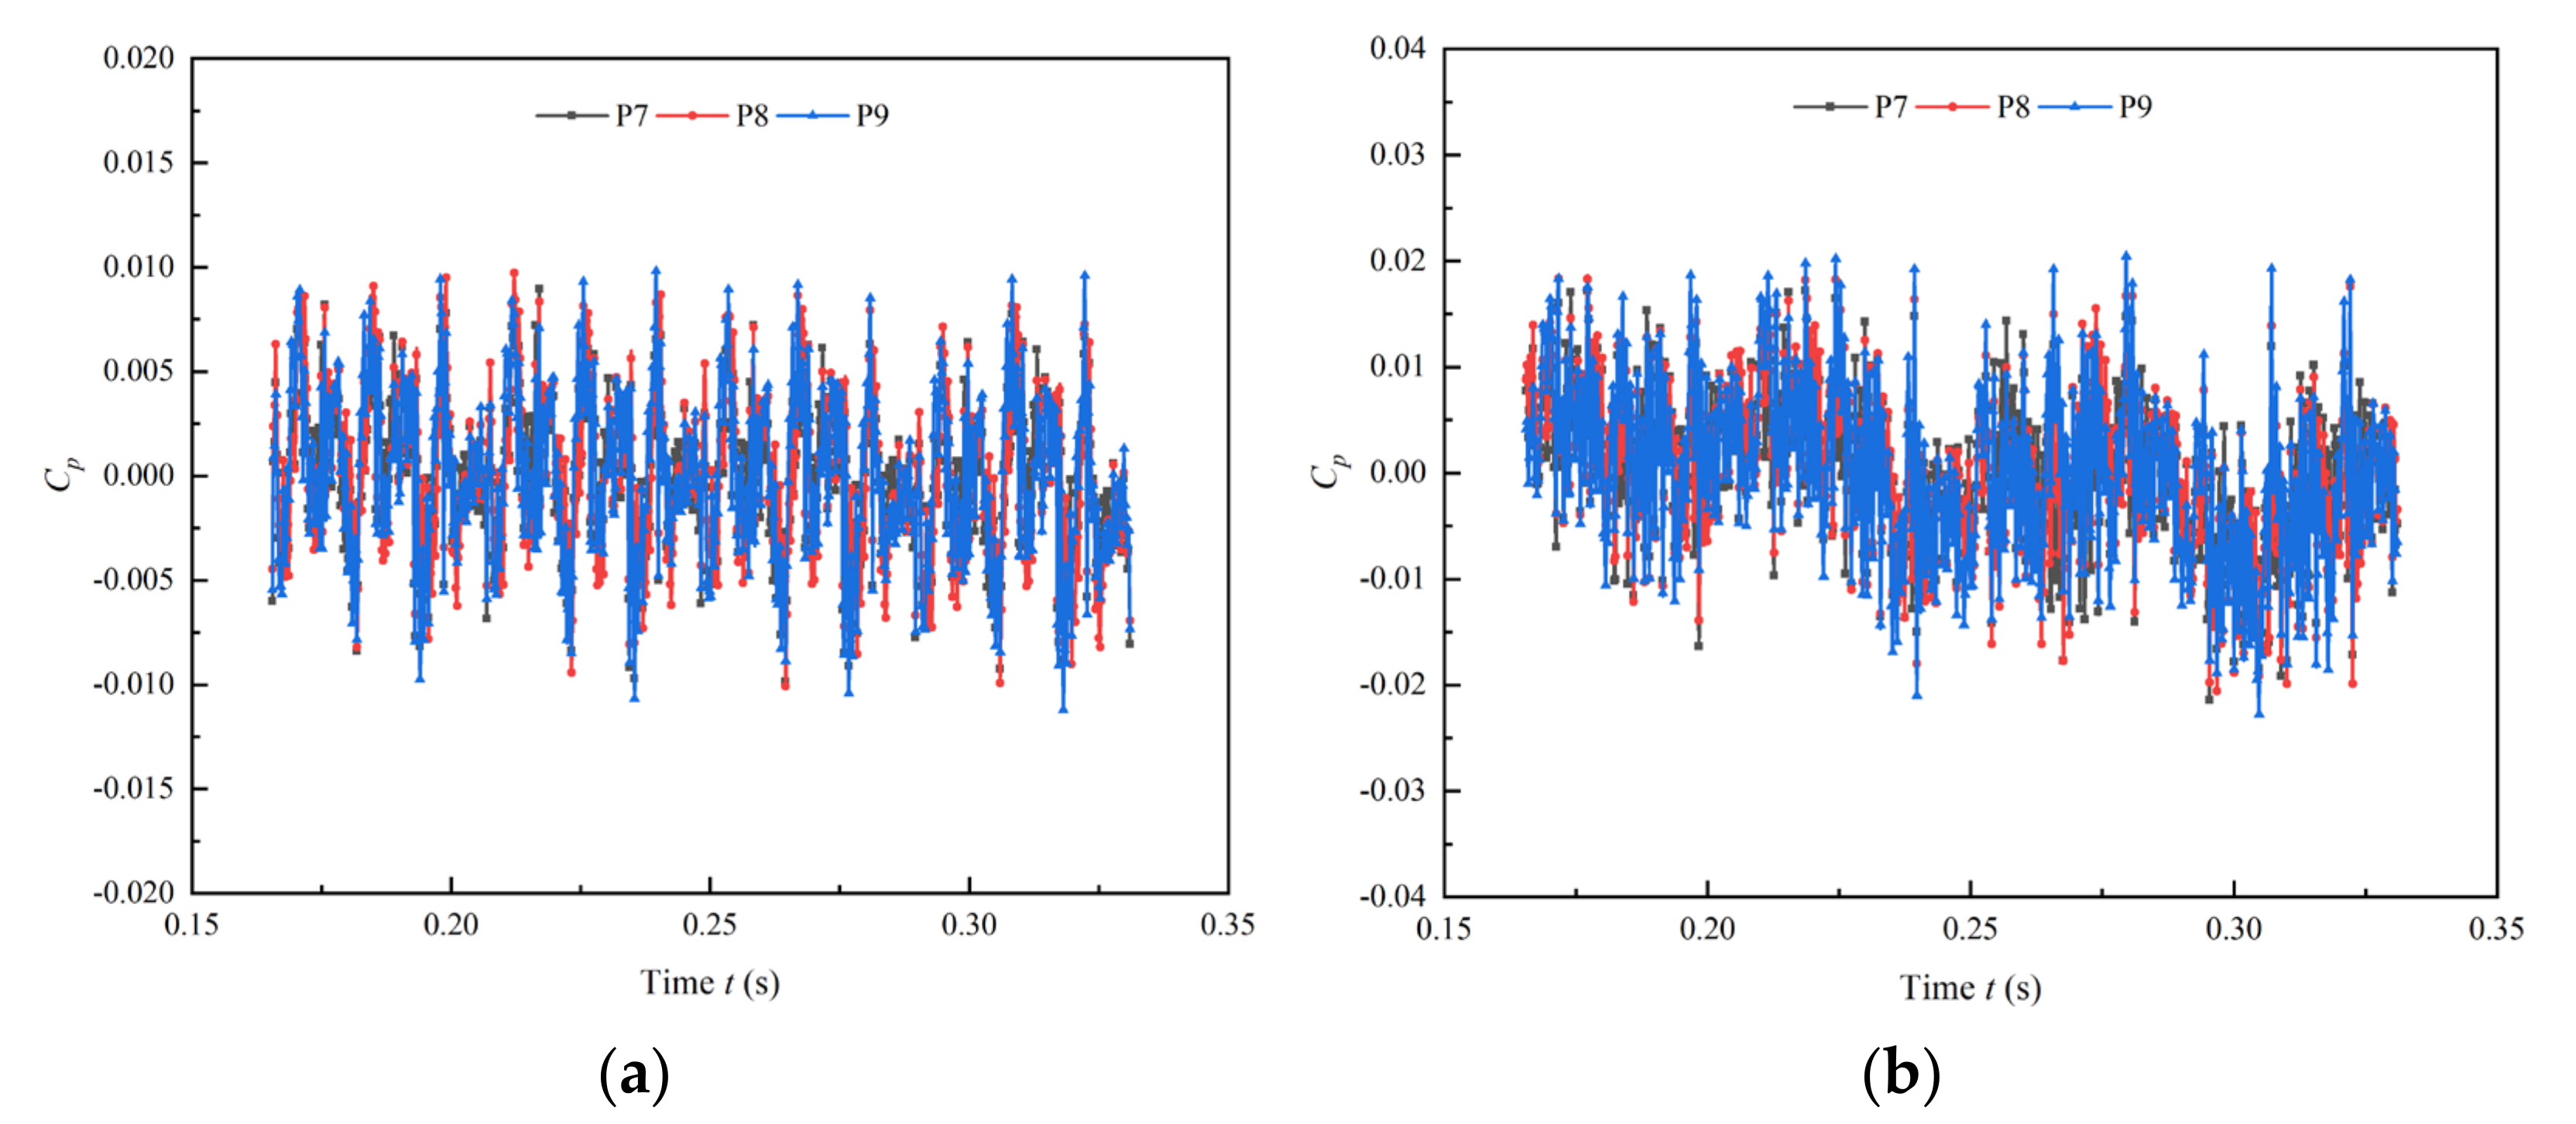
  • Under design conditions, pressure pulsation amplitude at the impeller inlet is the largest, and that at the guide vane outlet is the smallest. The pressure pulsation amplitude increases from the hub to the shroud. The pressure pulsation amplitude of the shaft rear-positioned pump device is larger than that of the shaft front-positioned pump device. The pressure pulsation at the impeller inlet and outlet is greatly affected by the number of blades, and the main frequency is three times the RF, while the number of blades has little effect on pressure pulsation at the guide vane outlet. The pressure pulsation caused by the internal flow of the pump has little influence on the pump’s performance and will not cause obvious vibration and noise.
  • The optimized shaft rear-positioned pump device can also have excellent hydraulic performance, which makes up for the low efficiency in practical engineering.

Author Contributions

Data curation, D.J. and L.X.; methodology, W.L. and L.L.; software, D.J. and G.H.; writing—original draft preparation, D.J.; writing—review and editing, J.L. and W.S.; supervision, W.L.; All authors have read and agreed to the published version of the manuscript.

Funding

This research was funded by the National Nature Science Foundation of China, grant number 51779215.

Institutional Review Board Statement

Not applicable.

Informed Consent Statement

Not applicable.

Data Availability Statement

Not applicable.

Conflicts of Interest

The authors declare no conflict of interest.

References

  1. Liu, C. Researches and developments of axial-flow pump system. Trans. Chin. Soc. Agric. Mach. 2015, 46, 49–59. [Google Scholar]
  2. Lu, W.G.; Dong, L.; Wang, Z.F.; Lu, L.G. Cross influence of discharge and circulation on head loss of conduit of pump device with low head. Appl. Math. Mech. 2012, 33, 1533–1544. [Google Scholar] [CrossRef]
  3. Ji, D.T.; Lu, W.G.; Lu, L.G.; Xu, L.; Liu, J.; Shi, W. Characteristics and application of saddle-shaped zone in performance curve of axial-flow pump system. J. Drain. Irrig. Mach. Eng. 2021, 39, 1081–1086. [Google Scholar]
  4. Xie, L.H.; Wang, F.J.; He, C.L.; Su, S.L.; Zhang, S.C.; Wang, B.L. Experimental investigation on hydrodynamic characteristics of a 15 degree slanted axial-flow pump system. J. Hydraul. Eng. 2019, 50, 798–805. [Google Scholar]
  5. Wang, B.H.; Wang, F.J.; Xie, L.H. Flow deviation in the discharge passage of a slanted axial-flow pump system. J. Hydraul. Eng. 2021, 52, 829–840. [Google Scholar]
  6. Xu, L.; Lu, L.G.; Chen, W.; Gang, W. Flow pattern analysis on inlet and outlet conduit of shaft tubular pump system of Pizhou pumping station in South-to-North Water Diversion Project. Trans. Chin. Soc. Agric. Eng. 2012, 37, 653–658. [Google Scholar]
  7. Xu, L.; Lu, L.G.; Chen, W.; Wang, G. Study on comparison of hydraulic design schemes for shaft tubular pump device. J. Hydroelectr. Eng. 2011, 30, 207–215. [Google Scholar]
  8. Lu, W.G.; Zhang, X. Research on model test of hydraulic characteristics for super-low head shaft-well tubular pump unit. J. Irrig. Drain. 2012, 31, 103–106. [Google Scholar]
  9. Liu, J.; Zheng, Y.; Zhou, D.Q.; Mao, Y.; Zhang, L. Analysis of basic flow pattern in shaft front-positioned and shaft rear-positioned tubular pump systems. Trans. Chin. Soc. Agric. Mach. 2010, 41, 32–38. [Google Scholar]
  10. Yang, F.; Liu, C.; Tang, F.P.; Cheng, L.; Lu, D.W. Numerical simulation of 3D internal flow and performance analysis of the shaft tubular pump system. J. Hydroelectr. Eng. 2014, 33, 178–184. [Google Scholar]
  11. Shi, L.J.; Liu, X.Q.; Tang, F.P.; Yao, Y.; Xie, R.; Zhang, W. Design optimization and experimental analysis of bidirectional shaft tubular pump device. Trans. Chin. Soc. Agric. Mach. 2016, 47, 85–91. [Google Scholar]
  12. Xie, R.S.; Wu, Z.; He, Y.; Tang, F.P.; Xie, C.L.; Tu, L.L. Optimization research on passage of bidirectional shaft tubular pump device. Trans. Chin. Soc. Agric. Mach. 2015, 46, 68–74. [Google Scholar]
  13. Xia, Y.; Tang, F.P.; Shi, L.J.; Xie, C.-I.; Zhang, W.-P. Numerical simulation and experimental analysis of bidirectional shaft tubular pump device. China Rural. Water Hydropower 2015, 7, 149–153. [Google Scholar]
  14. Wang, Q.J.; Zheng, Y.; Kan, K. Optimization analysis of inlet and outlet channels of shaft tubular pump. Water Resour. Power 2015, 33, 132–135. [Google Scholar]
  15. Zheng, Y.; Liu, J.; Zhou, D.Q.; Mao, Y.; Liu, M. Pressure pulsation of model test in large-size axial-flow pump. J. Drain. Irrig. Mach. Eng. 2010, 28, 51–55. [Google Scholar]
  16. Wang, F.J.; Zhang, L.; Zhang, Z.M. Analysis on pressure fluctuation of unsteady flow in axial-flow pump. J. Hydraul. Eng. 2007, 8, 1003–1009. [Google Scholar]
  17. Al-Obaidi, A.R. Analysis of the effect of various impeller blade angles on characteristic of the axial pump with pressure fluctuations based on time and frequency domain investigations. Iran. J. Sci. Technol. Trans. Mech. Eng. 2021, 45, 441–459. [Google Scholar] [CrossRef]
  18. Gonzalez, J.; Santolaria, C. Unsteady flow structure and global variables in a centrifugal pump. J. Fluids Eng. Trans. ASME 2006, 128, 937–946. [Google Scholar] [CrossRef]
  19. Lu, G.L. Optimal Hydraulic Design of High Performance Large Low Head Pump System; China Water Power Press: Beijing, China, 2013. [Google Scholar]
  20. Bhatti, M.M.; Abdelsalam, S.I. Thermodynamic entropy of a magnetized Ree-Eyring particle-fluid motion with irreversibility process: A mathematical paradigm. J. Appl. Math. Mech. 2021, 101. [Google Scholar] [CrossRef]
  21. Patil, A.; Sundar, S.; Delgado, A.; Gamboa, J. CFD based evaluation of conventional electrical submersible pump for high-speed application. J. Pet. Sci. Eng. 2019, 182, 106287. [Google Scholar] [CrossRef]
  22. Zawistowski, T.; Kleiber, M. Gap flow simulation methods in high pressure variable displacement axial piston pumps. Arch. Comput. Methods Eng. 2017, 24, 519–542. [Google Scholar] [CrossRef] [Green Version]
  23. Caruso, F.; Meskell, C. Effect of the axial gap on the energy consumption of a single-blade wastewater pump. Inst. Mech. Eng. Part A J. Power Energy 2021, 235, 432–439. [Google Scholar] [CrossRef]
  24. Jafarzadeh, B.; Hajari, A.; Alishahi, M.M.; Akbari, M.H. The flow simulation of a low-specific-speed high-speed centrifugal pump. Appl. Math. Model. 2011, 35, 242–249. [Google Scholar] [CrossRef]
  25. Wang, F.J. Analysis Method of Flow in Pumps and Pumping Stations; China Water Power Press: Beijing, China, 2019. [Google Scholar]
  26. Yakhot, V.; Orszag, S.A. Renormalization group analysis of turbulence: Basic theory. J. Sci. Comput. 1986, 1, 3–51. [Google Scholar] [CrossRef]
  27. Cheng, L.; Liu, C.; Tang, F.P.; Zhou, J. 3D numerical simulation and performance predication of vertical axial flow pumping station by RNG turbulent model. J. Mech. Eng. 2009, 45, 252–257. [Google Scholar] [CrossRef]
  28. Chen, Q.G.; Xu, Z.; Zhang, Y.J. Application of RNG k–ε models in numerical simulation of engineering turbulent flows. Chin. Q. Mech. 2003, 24, 88–95. [Google Scholar]
  29. Xu, Z.H.; Wu, Y.L.; Chen, N.X.; Liu, Y.; Liang, L.; Wu, Y.Z. Simulation of turbulent flow in pump based on sliding mesh and RNG k–ε model. J. Eng. 2005, 26, 66–68. [Google Scholar]
  30. Zheng, Y.J.; Wang, K.; Lei, X.C.; Tang, F. 3D numerical simulation in inlet passages of pumping station by RNG k–ε turbulent model with wall-function law. Water Resour. Power 2008, 26, 123–125. [Google Scholar]
  31. Zierke, W.C.; Straka, W.A. Flow visualization and the three-dimensional flow in an axial-flow pump. J. Propuls. Power 1996, 12, 250–259. [Google Scholar] [CrossRef]
  32. Zhang, D.S.; Shi, L.; Chen, J.; Pan, Q.; Shi, W.D. Experimental analysis on characteristic of cavitation in tip region of axial flow pump impeller. J. Zhejiang Univ. 2016, 8, 1585–1592. [Google Scholar]
  33. Zhang, D.S.; Shi, L.; Shi, W.; Zhao, R.; Wang, H.; van Esch, B.P.M. Numerical analysis of unsteady tip leakage vortex cavitation cloud and unstable suction-side-perpendicular cavitating vortices in an axial flow pump. Int. J. Multiph. Flow 2015, 77, 244–259. [Google Scholar] [CrossRef]
Figure 1. 3D model of pump device: (a) shaft front-positioned tubular pump device; (b) shaft rear-positioned tubular pump device.
Jmse 10 00008 g001
Figure 2. Arrangement of pressure monitoring points.
Jmse 10 00008 g002
Figure 3. Grid independence analysis.
Jmse 10 00008 g003
Figure 4. Figures of grids: (a) impeller; (b) grid refinement of impeller tip; (c) guide vane.
Jmse 10 00008 g004
Figure 5. Physical diagrams of experiment: (a) impeller; (b) guide vane; (c) pump device.
Jmse 10 00008 g005aJmse 10 00008 g005b
Figure 6. Comparison of the experimental and numerical simulation results.
Jmse 10 00008 g006
Figure 7. The performance comparison between shaft front-positioned and shaft rear-positioned tubular pump devices.
Jmse 10 00008 g007
Figure 8. Streamlines and velocity contour on cross section in shaft front-positioned tubular pump device: (a) Q/Qd = 0.8; (b) Q/Qd = 1.0; (c) Q/Qd = 1.2.
Jmse 10 00008 g008aJmse 10 00008 g008b
Figure 9. Streamlines and velocity contour on cross section in shaft rear-positioned tubular pump device: (a) Q/Qd = 0.8; (b) Q/Qd = 1.0; (c) Q/Qd = 1.2.
Jmse 10 00008 g009
Figure 10. Hydraulic loss of inlet passage.
Jmse 10 00008 g010
Figure 11. Comparison of Vu and θ at the inlet passage outlet.
Jmse 10 00008 g011
Figure 12. Hydraulic loss of outlet passage.
Jmse 10 00008 g012
Figure 13. Time domain of pressure pulsation at impeller inlet (Q = Qd): (a) shaft front positioned tubular pump device; (b) shaft rear positioned tubular pump device.
Jmse 10 00008 g013
Figure 14. Frequency domain of pressure pulsation at impeller inlet (Q = Qd): (a) shaft front-positioned tubular pump device; (b) shaft rear-positioned tubular pump device.
Jmse 10 00008 g014
Figure 15. Time domain of pressure pulsation at impeller outlet (Q = Qd): (a) shaft front positioned tubular pump device; (b) shaft rear-positioned tubular pump device.
Jmse 10 00008 g015
Figure 16. Frequency domain of pressure pulsation at impeller outlet (Q = Qd): (a) shaft front positioned tubular pump device; (b) shaft rear positioned tubular pump device.
Jmse 10 00008 g016
Figure 17. Time domain of pressure pulsation at guide vane outlet (Q = Qd): (a) shaft front positioned tubular pump device; (b) shaft rear positioned tubular pump device.
Jmse 10 00008 g017
Figure 18. Frequency domain of pressure pulsation at guide vane outlet (Q = Qd): (a) shaft front positioned tubular pump device; (b) shaft rear positioned tubular pump device.
Jmse 10 00008 g018
Table 1. The main design parameters of pump devices.
ParameterImpeller Diameter D (mm)Rotation Speed n (r/min)Design Flow Qd (L/s)Blade NumberGuide Vane Number
Value300145038835
Table 2. The boundary conditions and calculation settings.
InletOutletWallTime Step (s)Total Time (s)Convergence Accuracy
Setting1 atmMass flow rateNo-slip1.15 × 10−40.3311 × 10⁻⁴
Table 3. Main test instruments of test bench.
Measuring ItemsInstrumentInstrument ModelAccuracy
HeadDifferential pressure transmitterLDG-500s±0.1%
Flow rateElectromagnetic flowmeterV15712-HD1A1D7D±0.2%
Torque and rotation speedTorque and speed sensorJCZL2-500±0.1%
Publisher’s Note: MDPI stays neutral with regard to jurisdictional claims in published maps and institutional affiliations.

