
Multi-Ship Encounter Situation Identification and Analysis Based on AIS Data and Graph Complex Network Theory


Abstract
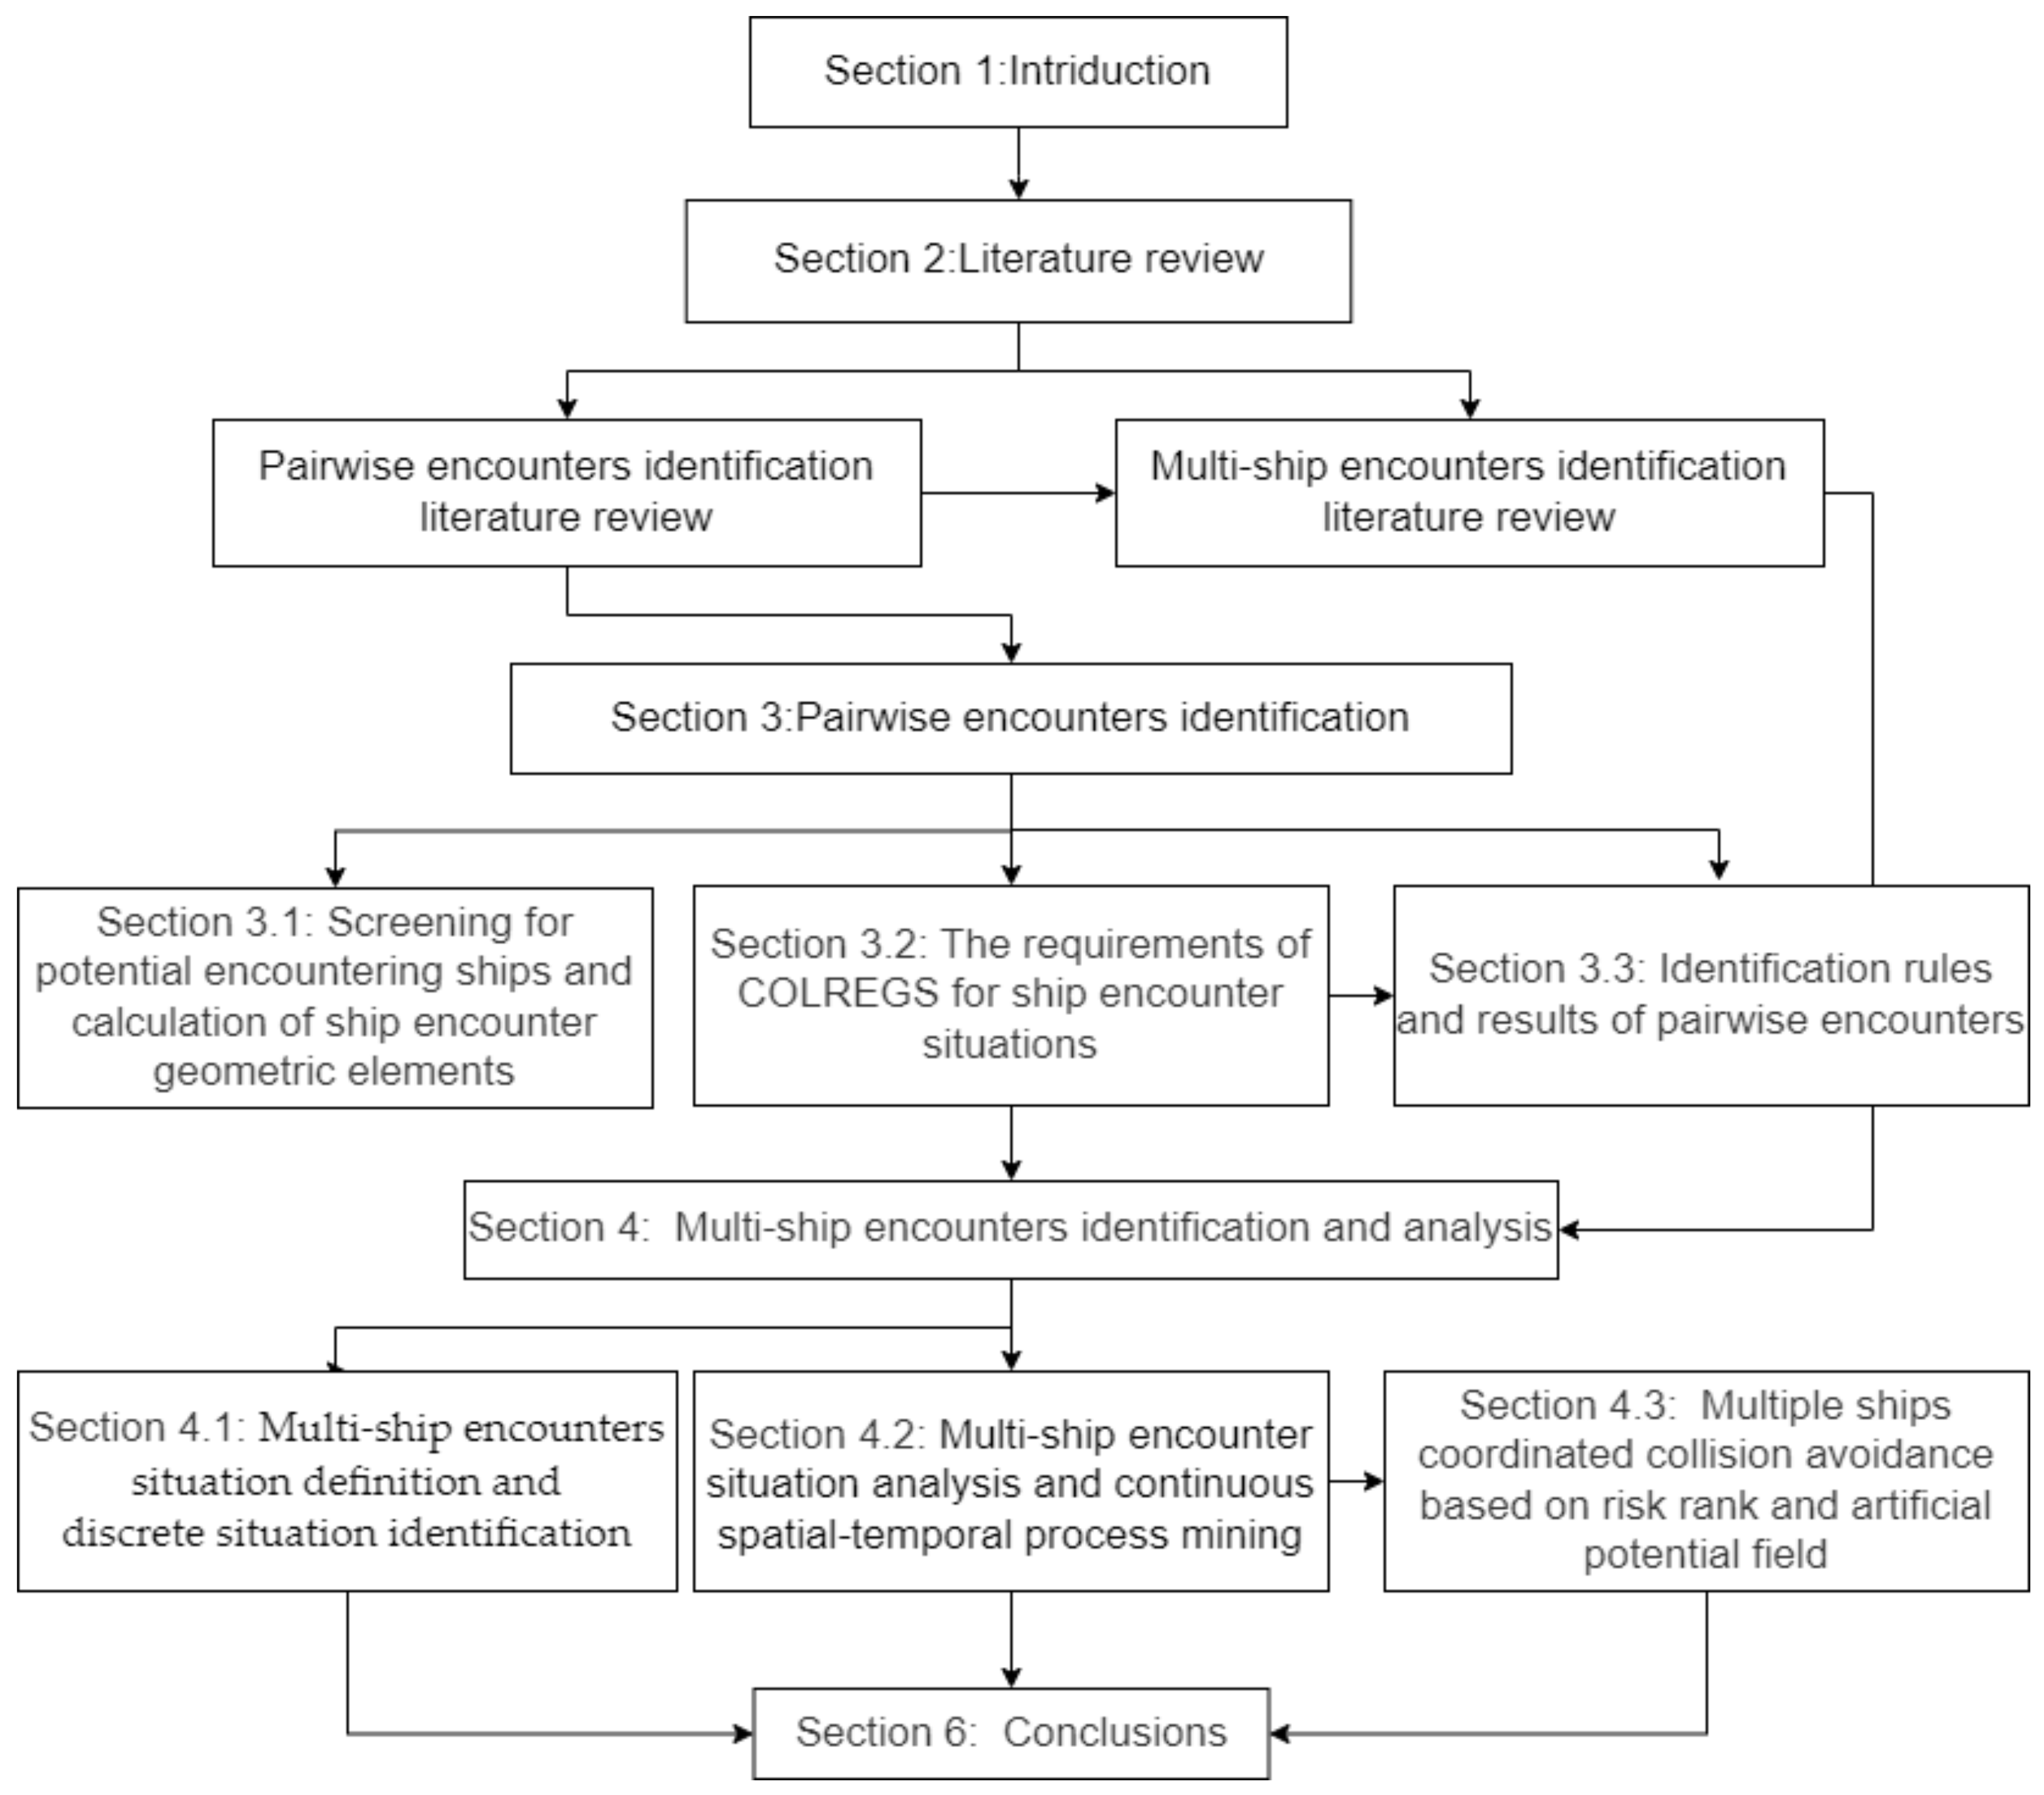
:1. Introduction
2. Literature Review
3. Pairwise Encounters Identification
3.1. Screening for Potential Encountering Ships and Calculation of Ship Encounter Geometric Elements
3.2. The Requirements of COLREGS for Ship Encounter Situations
3.3. Identification Rules and Results of Pairwise Encounters
4. Multi-Ship Encounter Identification and Analysis
4.1. Multi-Ship Encounters Situation Definition and Discrete Situation Identification
4.2. Multiple Ships Encounter Situation Analysis and Continuous Spatial-Temporal Process Mining
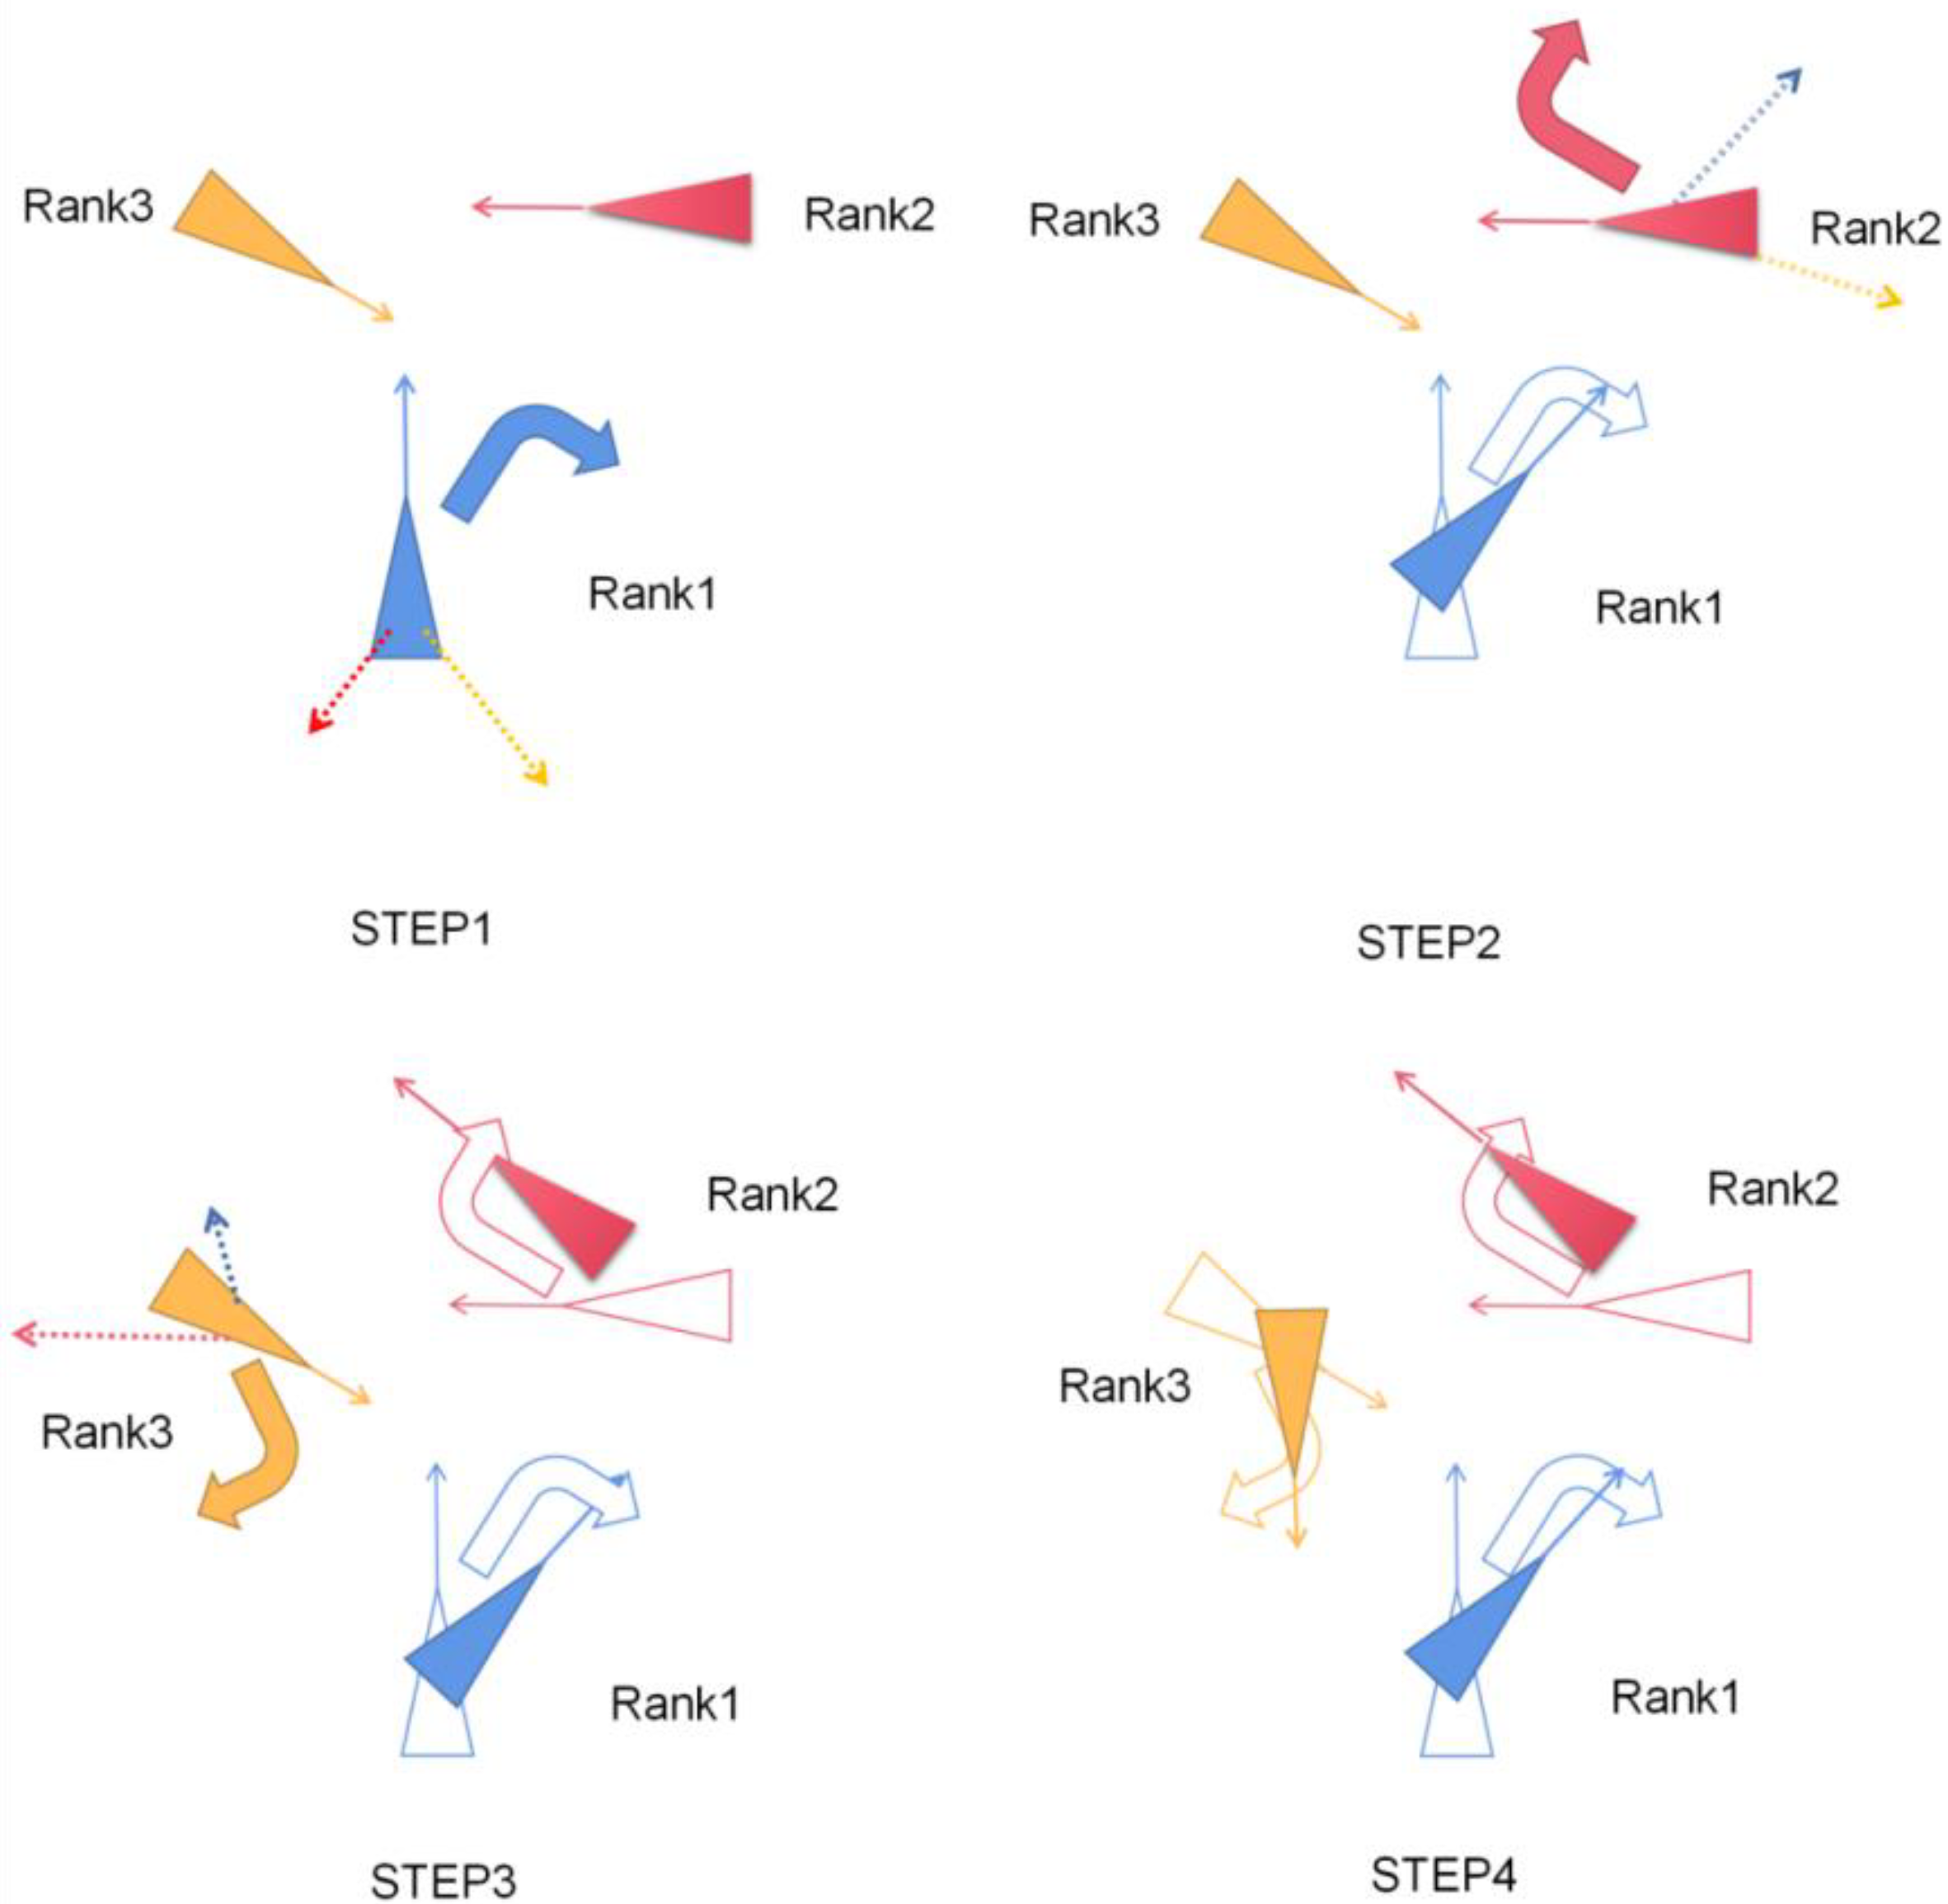
4.3. Multiple Ships Coordinated Collision Avoidance Based on Risk Rank and Artificial Potential Field
5. Conclusions
Author Contributions
Funding
Institutional Review Board Statement
Informed Consent Statement
Data Availability Statement
Conflicts of Interest
References
- Deng, N.; Xu, J.; Deng, D. Reactive Collision Avoidance Planning for Intelligent Ships. Ship Eng. 2020, 42, 115–121. [Google Scholar]
- Wen, Y.; Zheng, H.; Zhou, C.; Xiao, C.; Navigation, S.O. Multi-ship collision avoidance simulation based on complexity map. J. Wuhan Univ. Technol. (Traffic Sci. Eng. Ed.) 2017, 41, 401–405+410. [Google Scholar]
- Wen, Y.; Du Lei, H.Y.; Sun, T.; Xiao, C.; Zhou, C. Modeling and Simulation of Marine Traffic Macroscopic Flow Complexity. J. Syst. Simul. 2017, 29, 826–831. [Google Scholar]
- Future Proofed? Autonomous Shipping Research. Available online: https://www.nautilusint.org/en/news-insight/resources/nautilus-reports/autounomous-shipping-research/ (accessed on 8 September 2022).
- Wu, C.J.; Li, J.Q. A brief talk on the definition and division of the multi-ship meeting situation. J. Wuhan Shipbuild. Inst. 2009, 8, 23–26. [Google Scholar]
- Gao, M.; Kang, Z.; Zhang, A.; Liu, J.; Zhao, F. MASS autonomous navigation system based on AIS big data with dueling deep Q networks prioritized replay reinforcement learning. Ocean Eng. 2022, 249, 110834. [Google Scholar] [CrossRef]
- Gang, L.; Zheng, Z.; Le, Q.I.; University, D.M. The extraction method of ship encounter information in AIS data. Chin. Sci. Technol. Pap. 2017, 12, 802–805. [Google Scholar]
- Zhang, W.; Goerlandt, F.; Kujala, P.; Wang, Y. An advanced method for detecting possible near miss ship collisions from AIS data. Ocean Eng. 2016, 124, 141–156. [Google Scholar] [CrossRef]
- Ren, Y.L. Study on Ship Encounter Characteristics Based on AIS Data. Master’s Thesis, Wuhan University Of Technology, Wuhan, China, 2013. [Google Scholar]
- Jie, M.A.; Liu, Q.; Zhang, C.; Liu, K.; Zhang, Y.; Navigation, S.O. A method for extracting ship encounter situation based on spatial-temporal analysis of AIS data. China Saf. Sci. J. 2019, 29, 111–116. [Google Scholar]
- Gao, M.; Shi, G.-Y.; Liu, J. Ship encounter azimuth map division based on automatic identification system data and support vector classification. Ocean Eng. 2020, 213, 107636. [Google Scholar] [CrossRef]
- Zhen, R.; RIVEIRO, M.; Jin, Y. A real-time identification method for ship encounter based on DBSCAN. J. Shanghai Marit. Univ. 2018, 39, 1–5. [Google Scholar]
- Wen, Y.; Huang, Y.; Zhou, C.; Yang, J.; Xiao, C.; Wu, X. Modelling of marine traffic flow complexity. Ocean Eng. 2015, 104, 500–510. [Google Scholar] [CrossRef]
- Sui, Z.; Wen, Y.; Huang, Y.; Zhou, C.; Du, L.; Piera, M.A. Node importance evaluation in marine traffic situation complex network for intelligent maritime supervision. Ocean Eng. 2022, 247, 110742. [Google Scholar] [CrossRef]
- Cauteruccio, F.; Corradini, E.; Terracina, G.; Ursino, D.; Virgili, L. Investigating Reddit to detect subreddit and author stereotypes and to evaluate author assortativity. J. Inf. Sci. 2020, 0165551520979869. [Google Scholar] [CrossRef]
- Li, Y.P.; Liu, Z.J.; Kai, J.S. Study on complexity model and clustering method of ship to ship encountering risk. J. Mar. Sci. Technol. 2019, 27, 153–160. [Google Scholar]
- Hu, W.-B.; Huang, W.; Hu, G.-C. Trajectory adjoint pattern analysis based on OPTICS clustering and association analysis. Comput. Mod. 2017, 12, 82–87. [Google Scholar]
- Zhen, R.; Shi, Z. A Novel Adaptive Visual Analytics Framework for Multiship Encounter Identification. J. Adv. Transp. 2021, 6, 3063957. [Google Scholar] [CrossRef]
- Gao, F. Research on Multi-Ship Collision Avoidance Strategy Based on Particle Swarm Optimization Algorithm. Master’s Thesis, Dalian Maritime University, Dalian, China, 2020. [Google Scholar]
- Li, Y.; Liu, Z.; Zheng, Z. Study on complexity of marine traffic based on traffic instrinsic features and data mining. J. Comput. Methods Sci. Eng. 2019, 19, 619–633. [Google Scholar]
- Zhou, W.; Li, L.; Xiong, Z.; Yang, S. Intelligent collision avoidance decision and simulation for multiple ships in urgent and dangerous situation. J. Jimei Univ. (Nat. Sci. Ed.) 2010, 15, 347–352. [Google Scholar]
- Wu, C.; Hu, S.; Chen, J. Simulation Analysis and Evaluation of Traffic Risk in Wusongkou Water Area. J. Navig. China 2009, 32, 62–67. [Google Scholar]
- Ni, S.K. Research on Key Technologies of Rule-Based Intelligent Collision Avoidance Decision Making. Ph.D. Thesis, Dalian Maritime University, Dalian, China, 2020. [Google Scholar]
- Wang, Q.Y. Research on Dynamic Collision Avoidance Path Planning Algorithm for Multi-Ship Encounter. Master’s Thesis, Harbin Engineering University, Harbin, China, 2020. [Google Scholar]
- Zheng, Z.Y. Decision Study of Multi-ship Encounter Collision Avoidance--Definition and partition of Multi-ship Encounter. Technol. Navig. 2000, 32, 9–12. [Google Scholar]
- Bi, J.; Gao, M.; Zhang, W.; Zhang, X.; Bao, K.; Xin, Q. Research on Navigation Safety Evaluation of Coastal Waters Based on Dynamic Irregular Grid. J. Mar. Sci. Eng. 2022, 10, 733. [Google Scholar] [CrossRef]
- Wolsing, K.; Roepert, L.; Bauer, J.; Wehrle, K. Anomaly Detection in Maritime AIS Tracks: A Review of Recent Approaches. J. Mar. Sci. Eng. 2022, 10, 112. [Google Scholar] [CrossRef]
- Dong, F.; Xu, J.; Su, K. Judgment of ship encounter situation. Technol. Navig. 2007, 1, 2–5. [Google Scholar]
- Liu, J.; Liu, K.; Yang, X.; Xiong, Y.; Yuan, Z.; Wu, X. COLREGS-Based Multi-Ship Coordinated Collision Avoidance Decision Algorithm and Simulation Verification. J. Navig. China 2020, 43, 8–14. [Google Scholar]
- Mao, Y.; Song, L.; Xiang, Z.; Zhou, Y.; Mao, P.; Yan, Z. Multi-obstacle intelligent collision avoidance strategy for unmanned surface vehicle. J. Dalian Marit. Univ. 2015, 41, 8–13. [Google Scholar]
- Xiong, Y.; He, Y.; Huang, L. Multi-Ship Collision Avoiding Control Considering Velocity Obstacle. J. Navig. China 2015, 38, 46–51. [Google Scholar]
- Wang, Y.L. Research on Auxiliary Decision Making for Collision Avoidance in Multi-Ship Encounter Situation. Master’s Thesis, Wuhan University of Technology, Wuhan, China, 2019. [Google Scholar]
- Chen, G.Q. Research on Key Technologies of Ship Collision Avoidance Automation. Ph.D. Thesis, Dalian Maritime University, Dalian, China, 2016. [Google Scholar]
- Zhang, J.; Zhang, D.; Yan, X.; Haugen, S.; Soares, C.G. A distributed anti-collision decision support formulation in multi-ship encounter situations under COLREGS. Ocean Eng. 2015, 105, 336–348. [Google Scholar] [CrossRef]
- Yang, S.H. Ship Collision Avoidance Decision Support System Based on Multi-Agent. Master’s Thesis, Shanghai Maritime University, Shanghai, China, 2008. [Google Scholar]
- Hu, Q.; Hu, Q. Design and Analysis of Negotiation-Based Ship Collision Avoidance Simulation System. J. Navig. China 2009, 32, 54–59. [Google Scholar]
- He, S.; Wang, M.; Dai, S.-L.; Luo, F. Leader-Follower Formation Control of USVs With Prescribed Performance and Collision Avoidance. IEEE Trans. Ind. Inform. 2019, 15, 572–581. [Google Scholar] [CrossRef]
- Hu, Y.; Zhang, A.; Tian, W.; Zhang, J.; Hou, Z. Multi-Ship Collision Avoidance Decision-Making Based on Collision Risk Index. J. Mar. Sci. Eng. 2020, 8, 640. [Google Scholar] [CrossRef]


| Authors’ Name | Situation | Method |
|---|---|---|
| Gang, L.H. et al. [7] | pairwise encounter situation | metric elements and COLREGS |
| Zhang, W. et al. [8] | pairwise encounter situation | metric elements and COLREGS |
| Ren et al. [9] | pairwise encounter situation | ship domain |
| Ma [10] | pairwise encounter situation | support vector machine. |
| Gao et al. [11] | pairwise encounter situation | support vector classification |
| Zhen et al. [12] | pairwise encounter situation | DBSCAN |
| Wen et al. [13] | multi-ship encounter situation | complexity azimuth map |
| Li et al. [16] | multi-ship encounter situation | ST-DBSCAN |
| Hu et al. [17] | multi-ship encounter situation | DBSCAN |
| Zhen et al. [18] | multi-ship encounter situation | adaptive DBSCAN |
| Distance |  | GAO [22], LI [23] |
| Distance, pairwise encounters identification results |  | ZHOU [24], WU [25] |
| Distance, uncoordinated actions to avoid collision |  | Ni [26], Wang [27], ZHENG [28] |
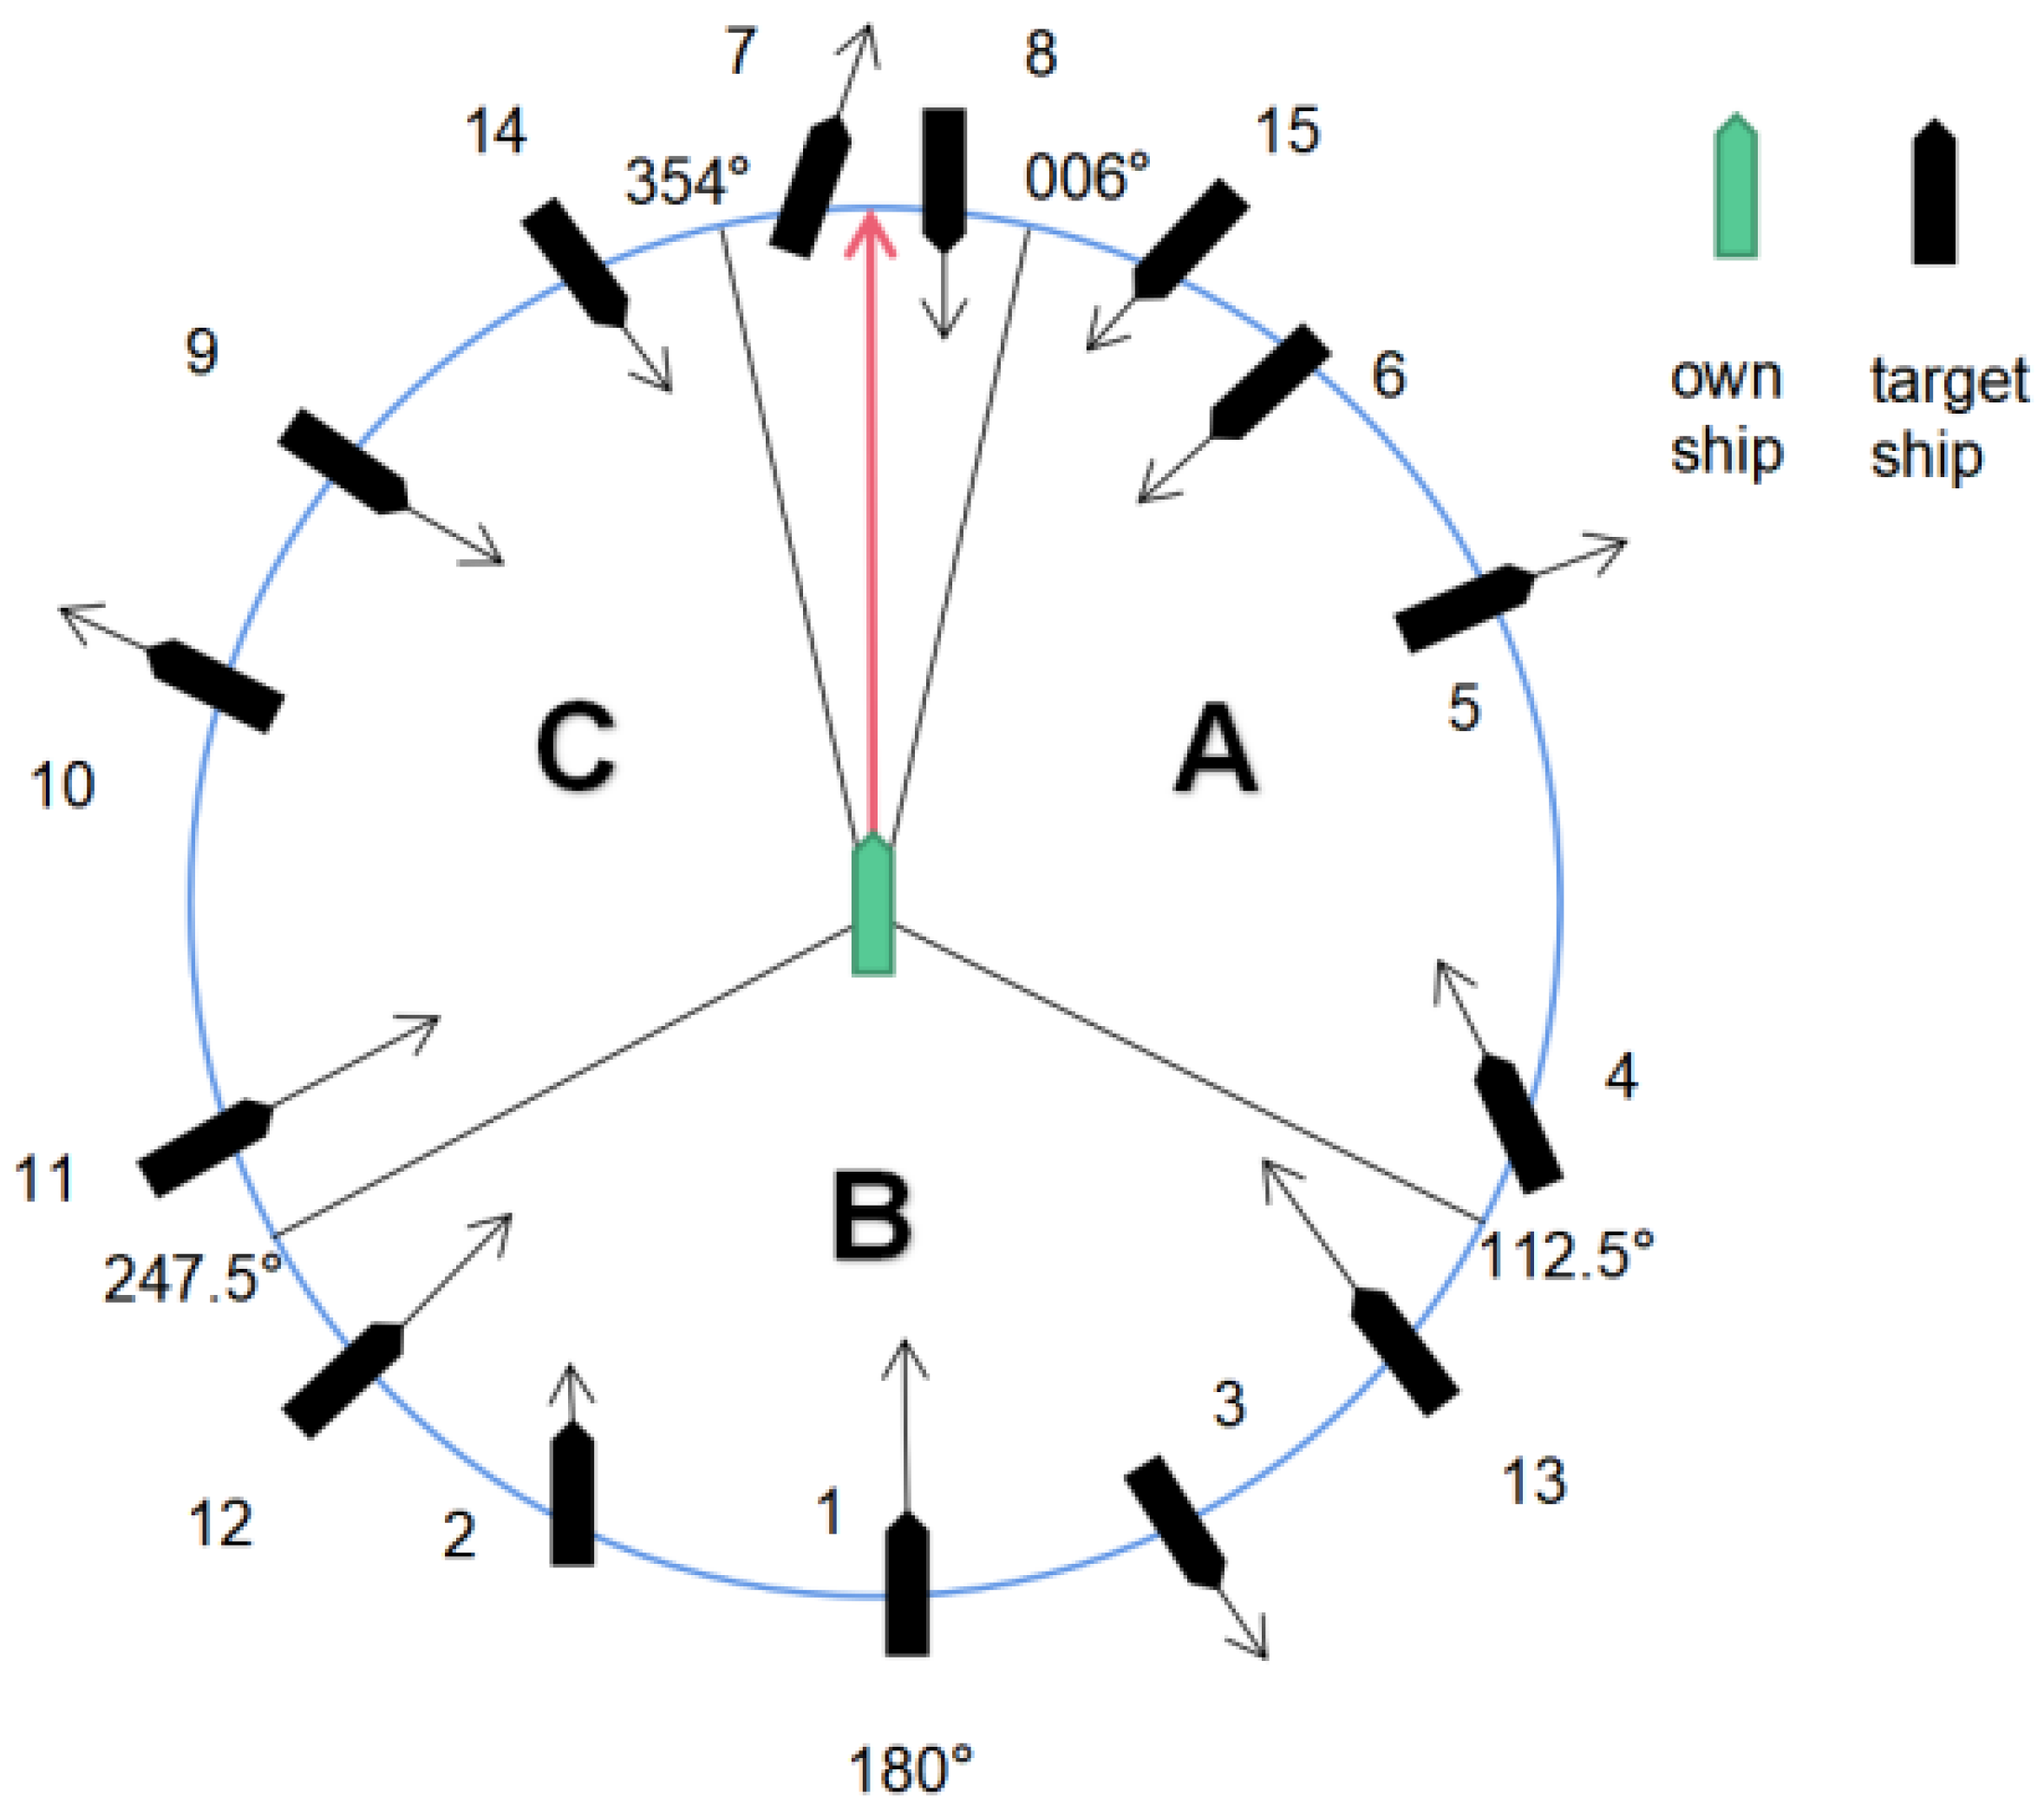
| Situation | Common Cases | Special Cases and Their Reasons |
|---|---|---|
| crossing | Ship 6, ship 9, ship 14, ship 15 | Ship 5 and ship 10: do not intersect with their own ship |
| head on | ship8 | Ship 7: the heading is not opposite or close to opposite their own ship |
| overtaking | Ship 1, ship 12, ship 13 | Ship 2: the speed of target ship 2 is less than the speed of its own ship Ship 3: the distance between ship 3 and their own ship is becoming larger Ship 4, ship11: from a direction more than 22.5 degrees abaft their own ship |
| Situation | Left-to-Left | Right-to-Right |
|---|---|---|
| Head on situation | ||
| overtaken from the right side | overtaken from the left side | |
| Overtaken situation | ||
| crossing the stern | crossing the bow | |
| Crossing situation |
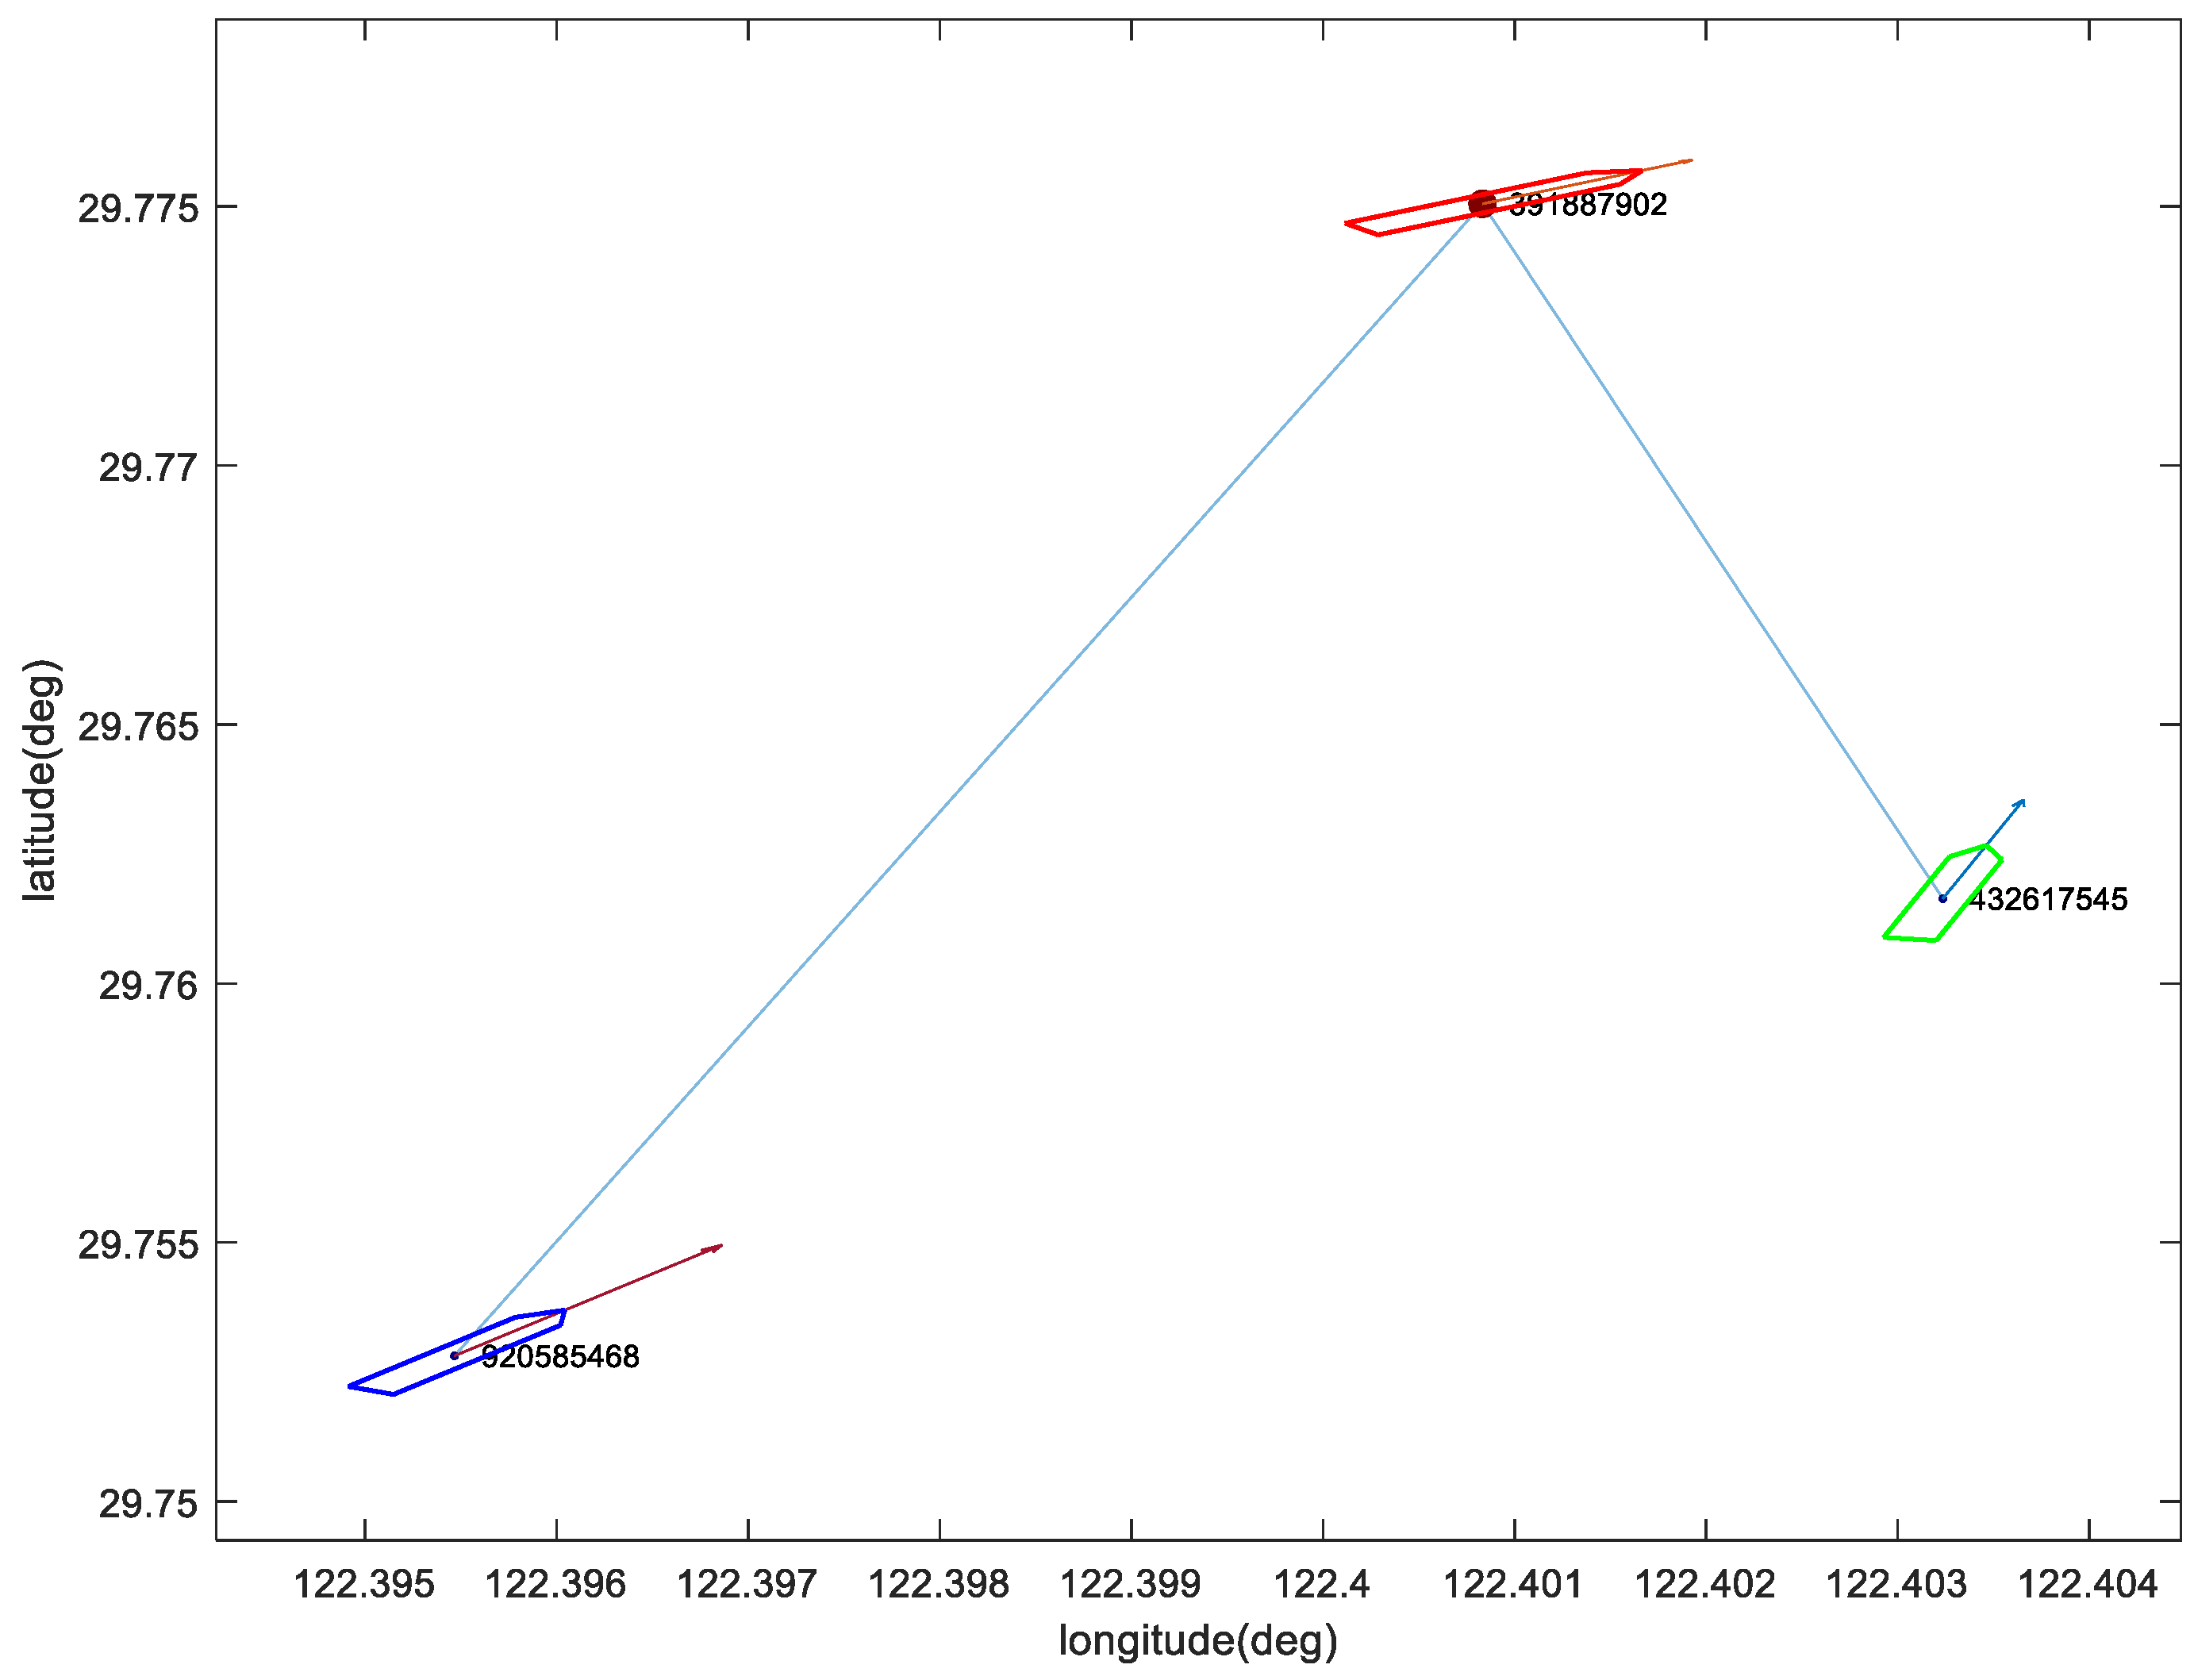
| MMSI | LAT | LON | PageRank Score | Rank |
|---|---|---|---|---|
| 391887902 | 29.7759 | 122.4008 | 0.3332 | 2 |
| 432617545 | 29.7616 | 122.4032 | 0.3347 | 1 |
| 920585468 | 29.7528 | 122.3955 | 0.3322 | 3 |
Publisher’s Note: MDPI stays neutral with regard to jurisdictional claims in published maps and institutional affiliations. |
© 2022 by the authors. Licensee MDPI, Basel, Switzerland. This article is an open access article distributed under the terms and conditions of the Creative Commons Attribution (CC BY) license (https://creativecommons.org/licenses/by/4.0/).
Share and Cite
Zhu, J.; Gao, M.; Zhang, A.; Hu, Y.; Zeng, X. Multi-Ship Encounter Situation Identification and Analysis Based on AIS Data and Graph Complex Network Theory. J. Mar. Sci. Eng. 2022, 10, 1536. https://doi.org/10.3390/jmse10101536
Zhu J, Gao M, Zhang A, Hu Y, Zeng X. Multi-Ship Encounter Situation Identification and Analysis Based on AIS Data and Graph Complex Network Theory. Journal of Marine Science and Engineering. 2022; 10(10):1536. https://doi.org/10.3390/jmse10101536
Chicago/Turabian StyleZhu, Jixiang, Miao Gao, Anmin Zhang, Yingjun Hu, and Xi Zeng. 2022. "Multi-Ship Encounter Situation Identification and Analysis Based on AIS Data and Graph Complex Network Theory" Journal of Marine Science and Engineering 10, no. 10: 1536. https://doi.org/10.3390/jmse10101536
APA StyleZhu, J., Gao, M., Zhang, A., Hu, Y., & Zeng, X. (2022). Multi-Ship Encounter Situation Identification and Analysis Based on AIS Data and Graph Complex Network Theory. Journal of Marine Science and Engineering, 10(10), 1536. https://doi.org/10.3390/jmse10101536