
Arctic Nearshore Sediment Dynamics—An Example from Herschel Island—Qikiqtaruk, Canada
 ,
,  , ,
, ,
Abstract
:1. Introduction
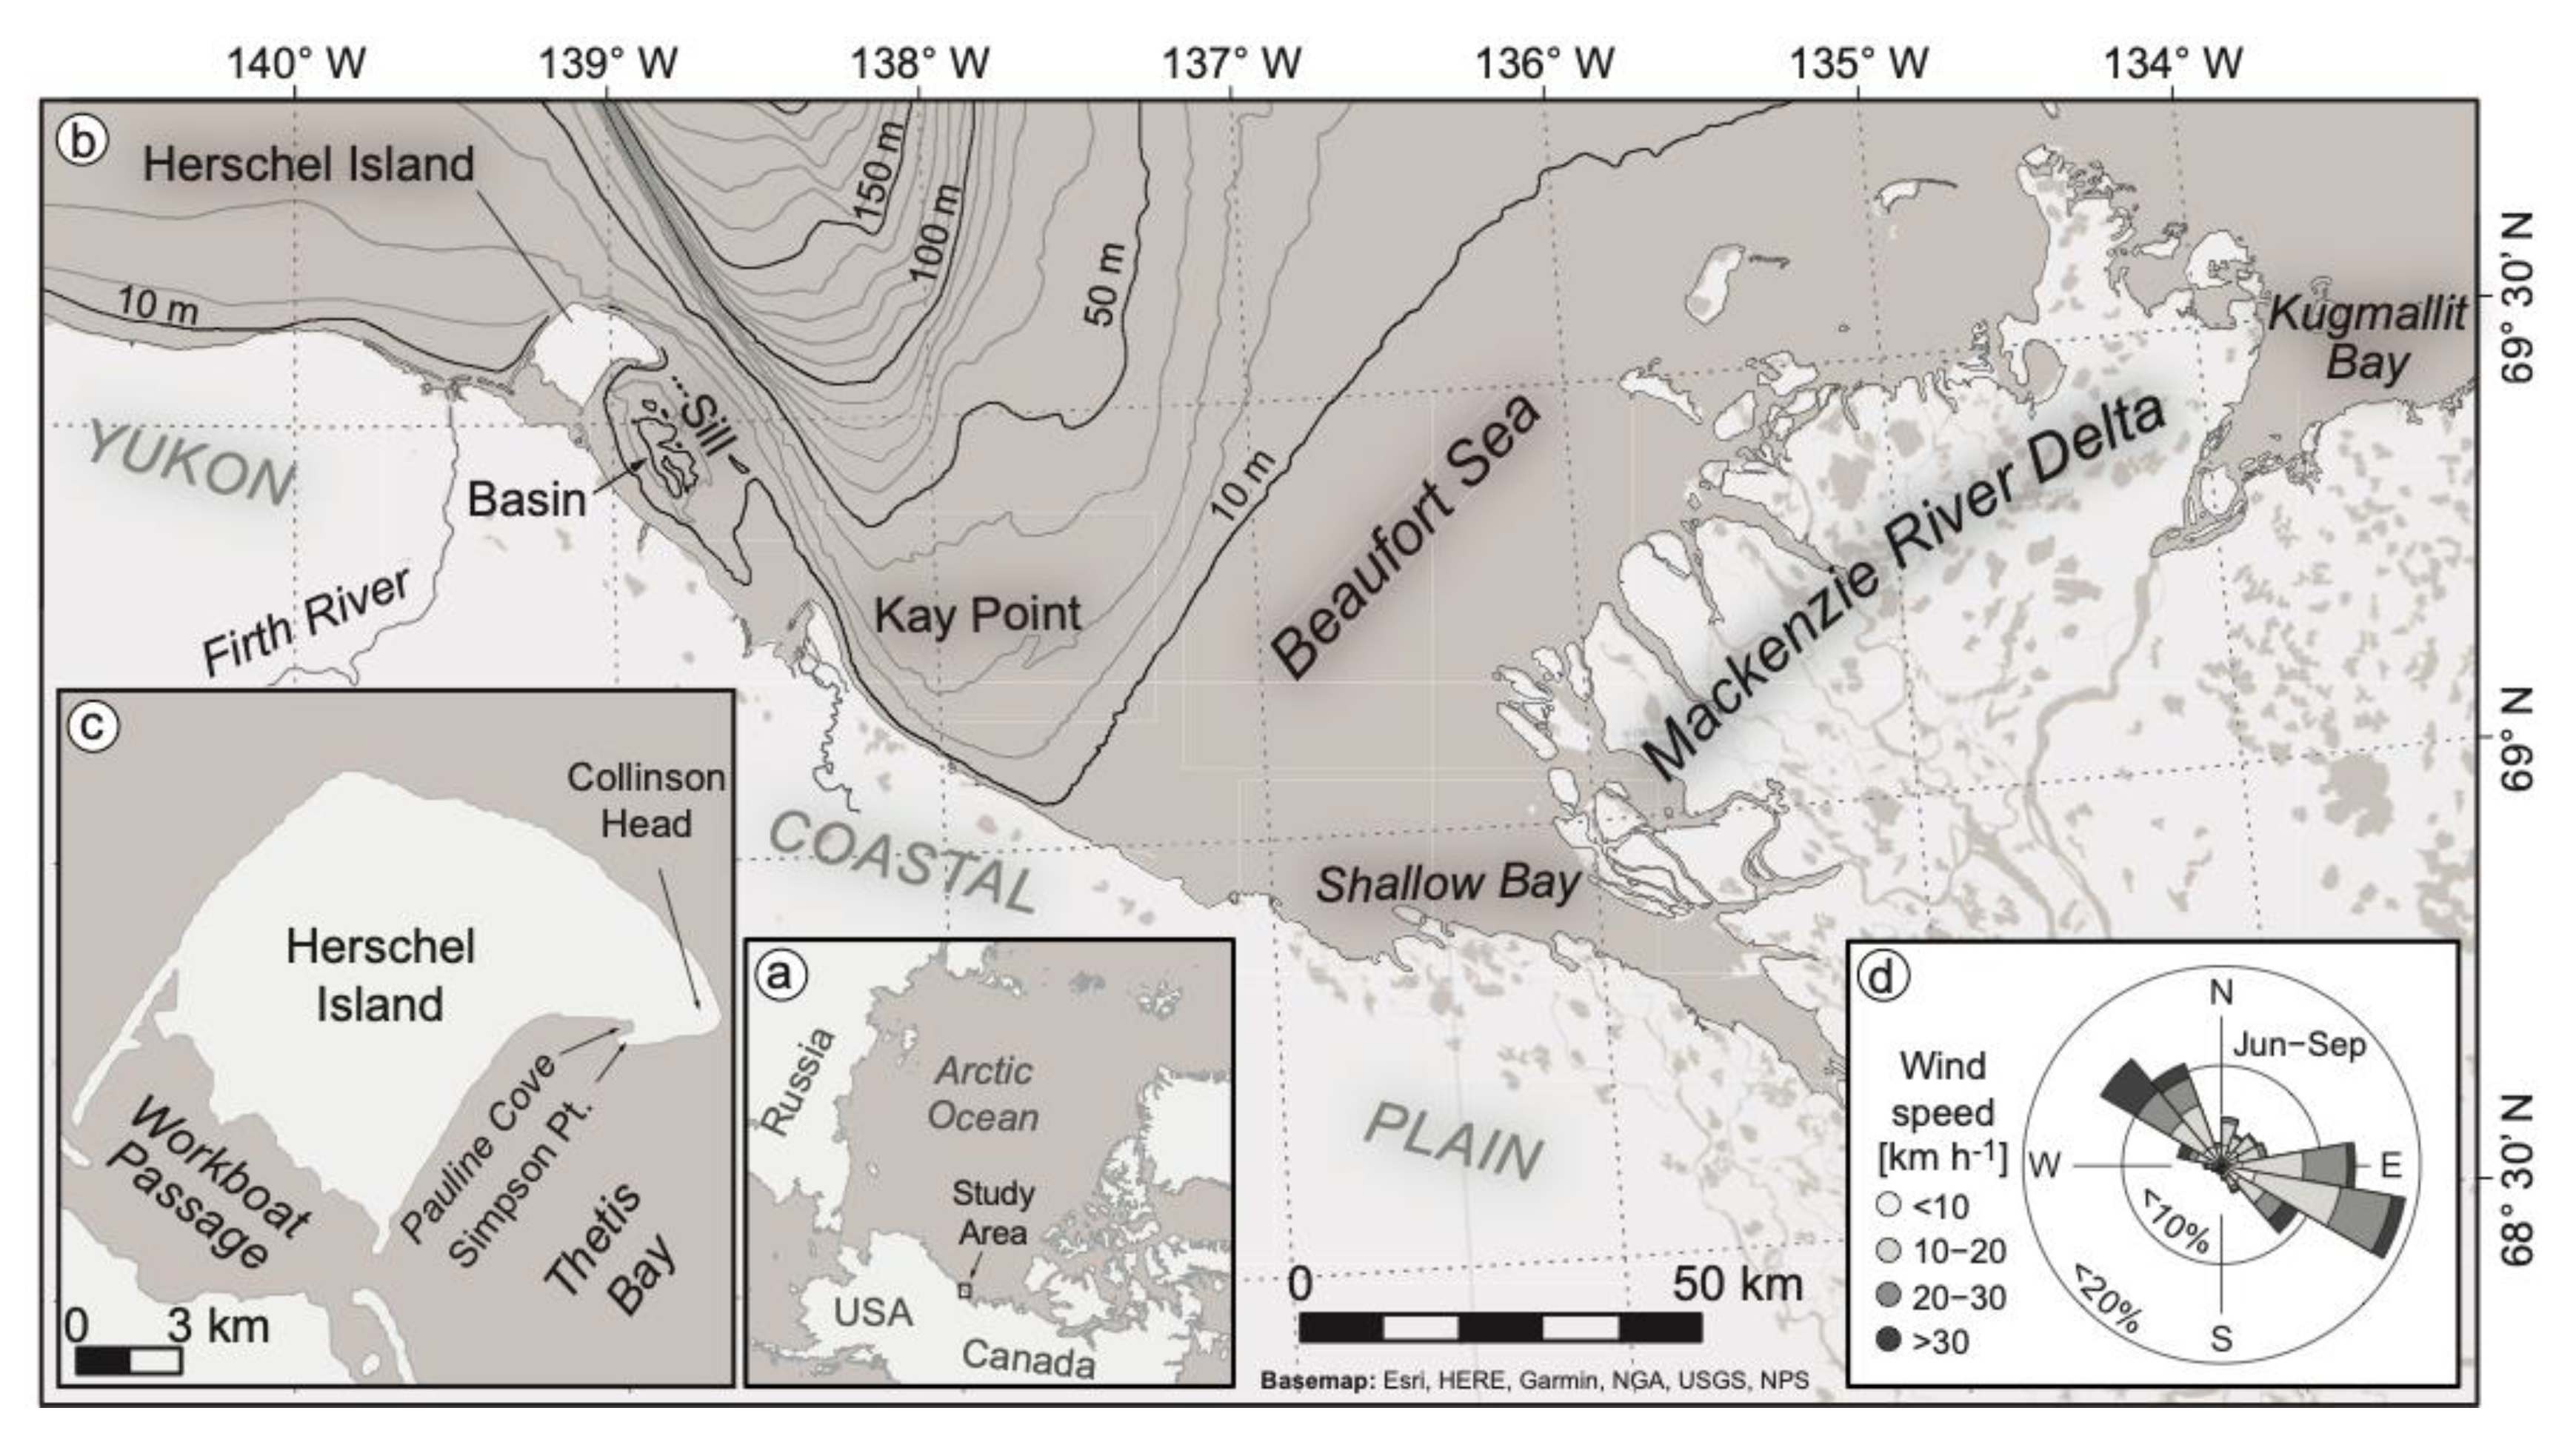
2. Study Area
2.1. Meteorological Conditions and Physical Processes
2.2. Coastal Geomorphology and Local Sediment Sources
3. Materials and Methods
3.1. Grain Size Analysis
3.2. Bulk Geochemical Analyses
3.3. Comparisons with Other Studies
4. Results
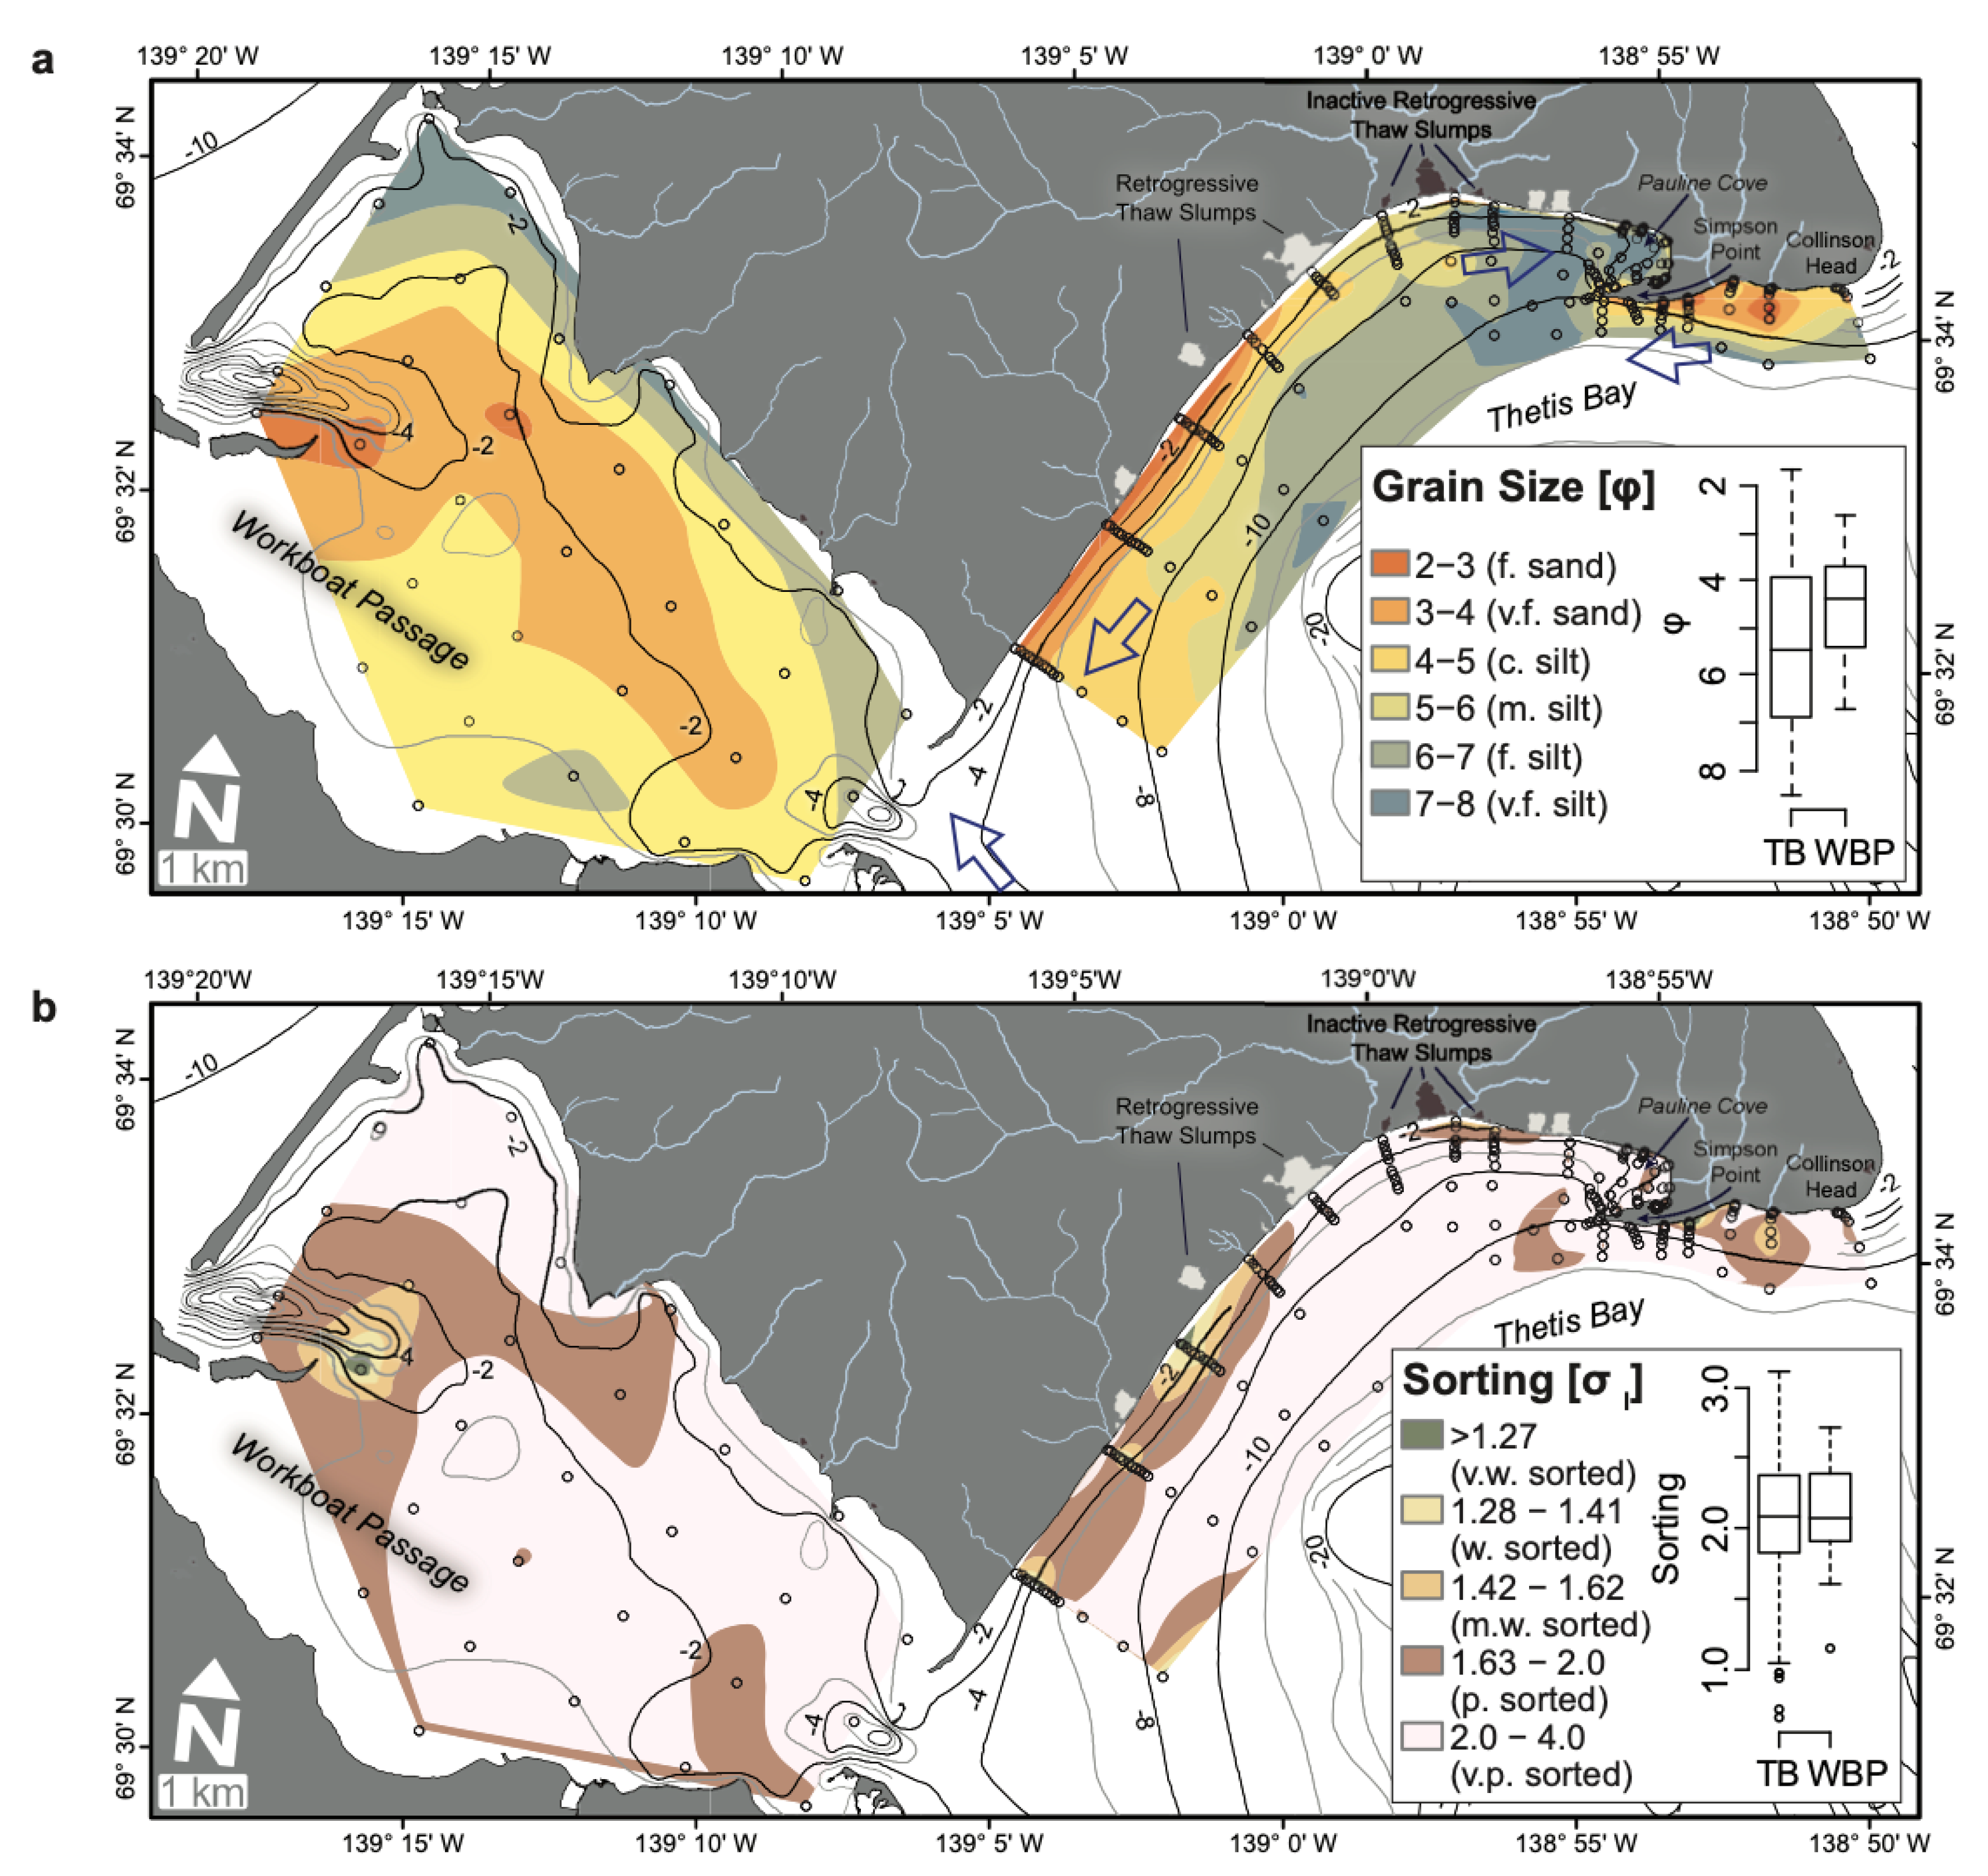
4.1. Granulometry
4.2. Bulk Geochemical Data
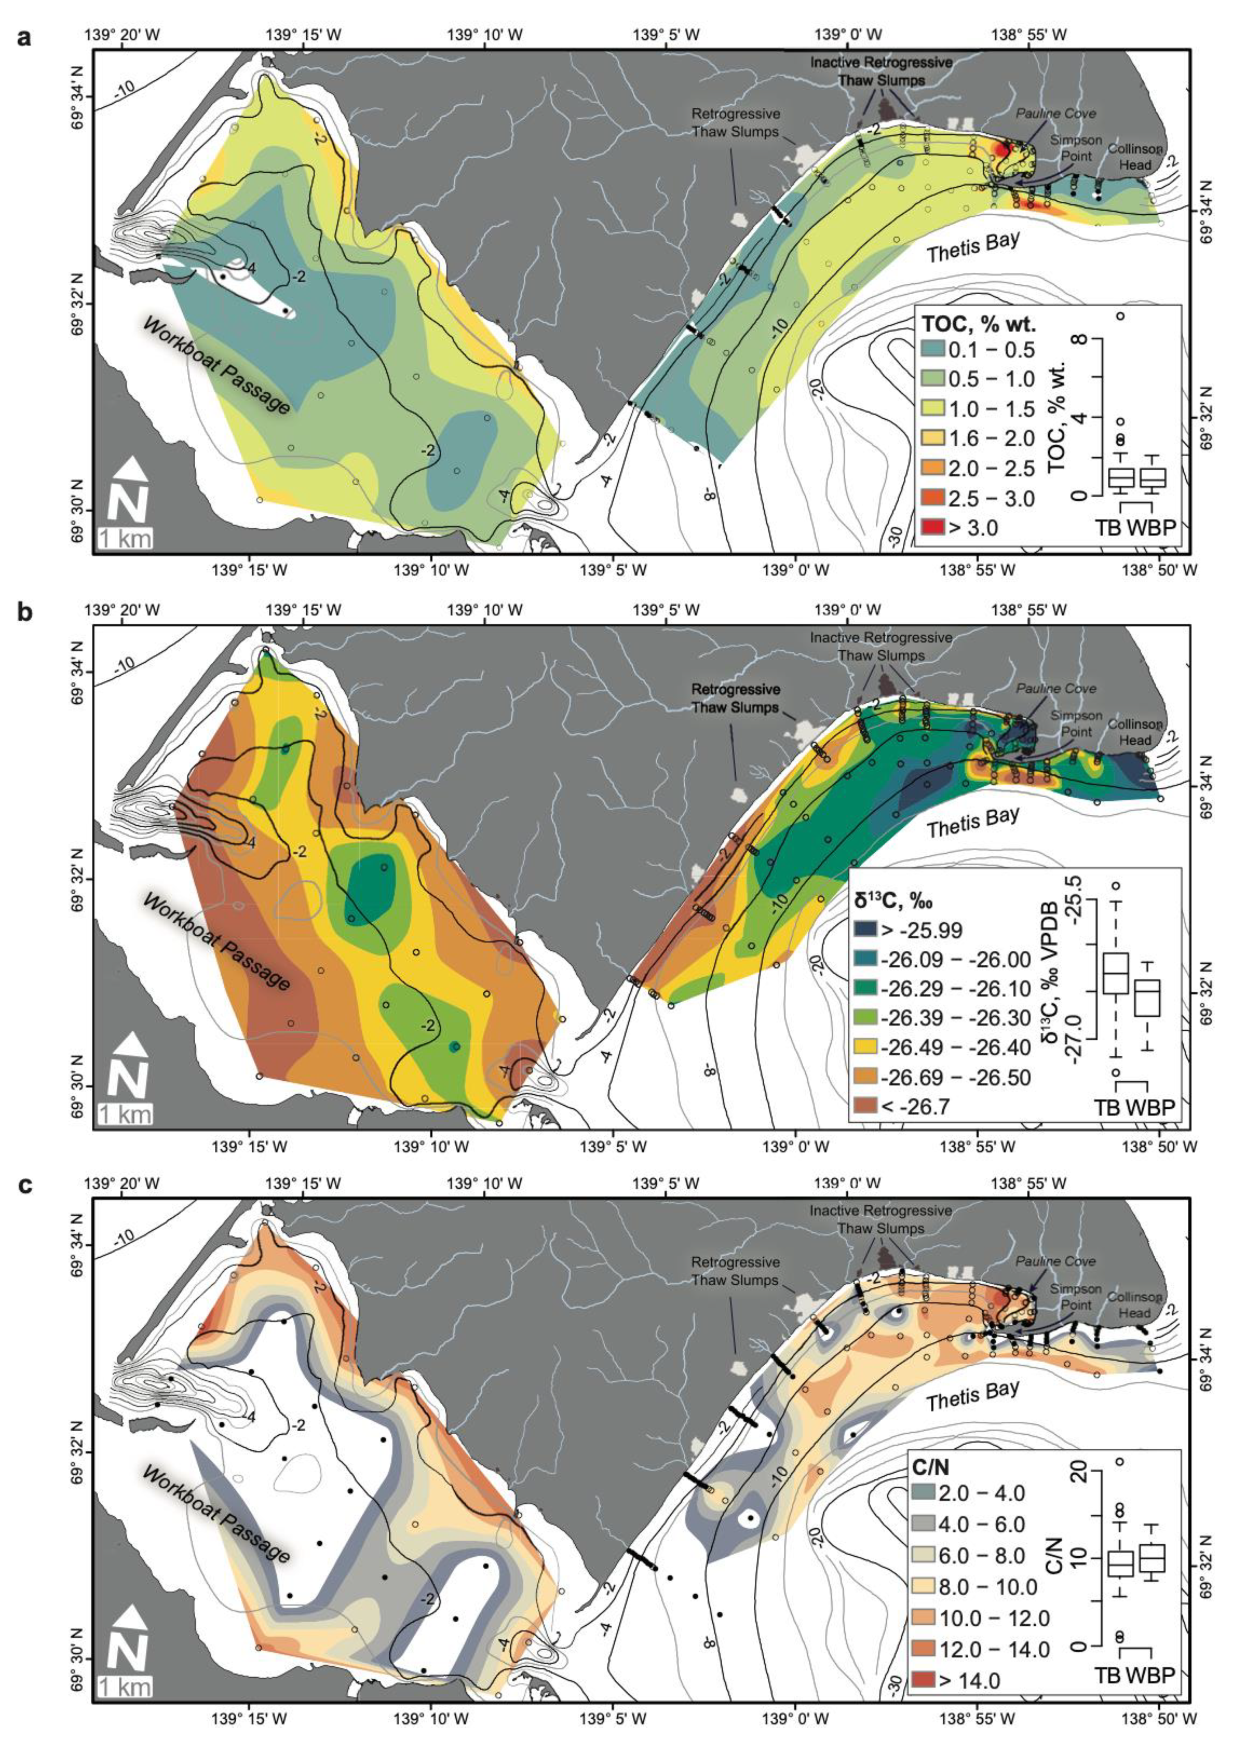
4.2.1. Total Organic Carbon
4.2.2. Stable Carbon Isotopes and C/N Ratios
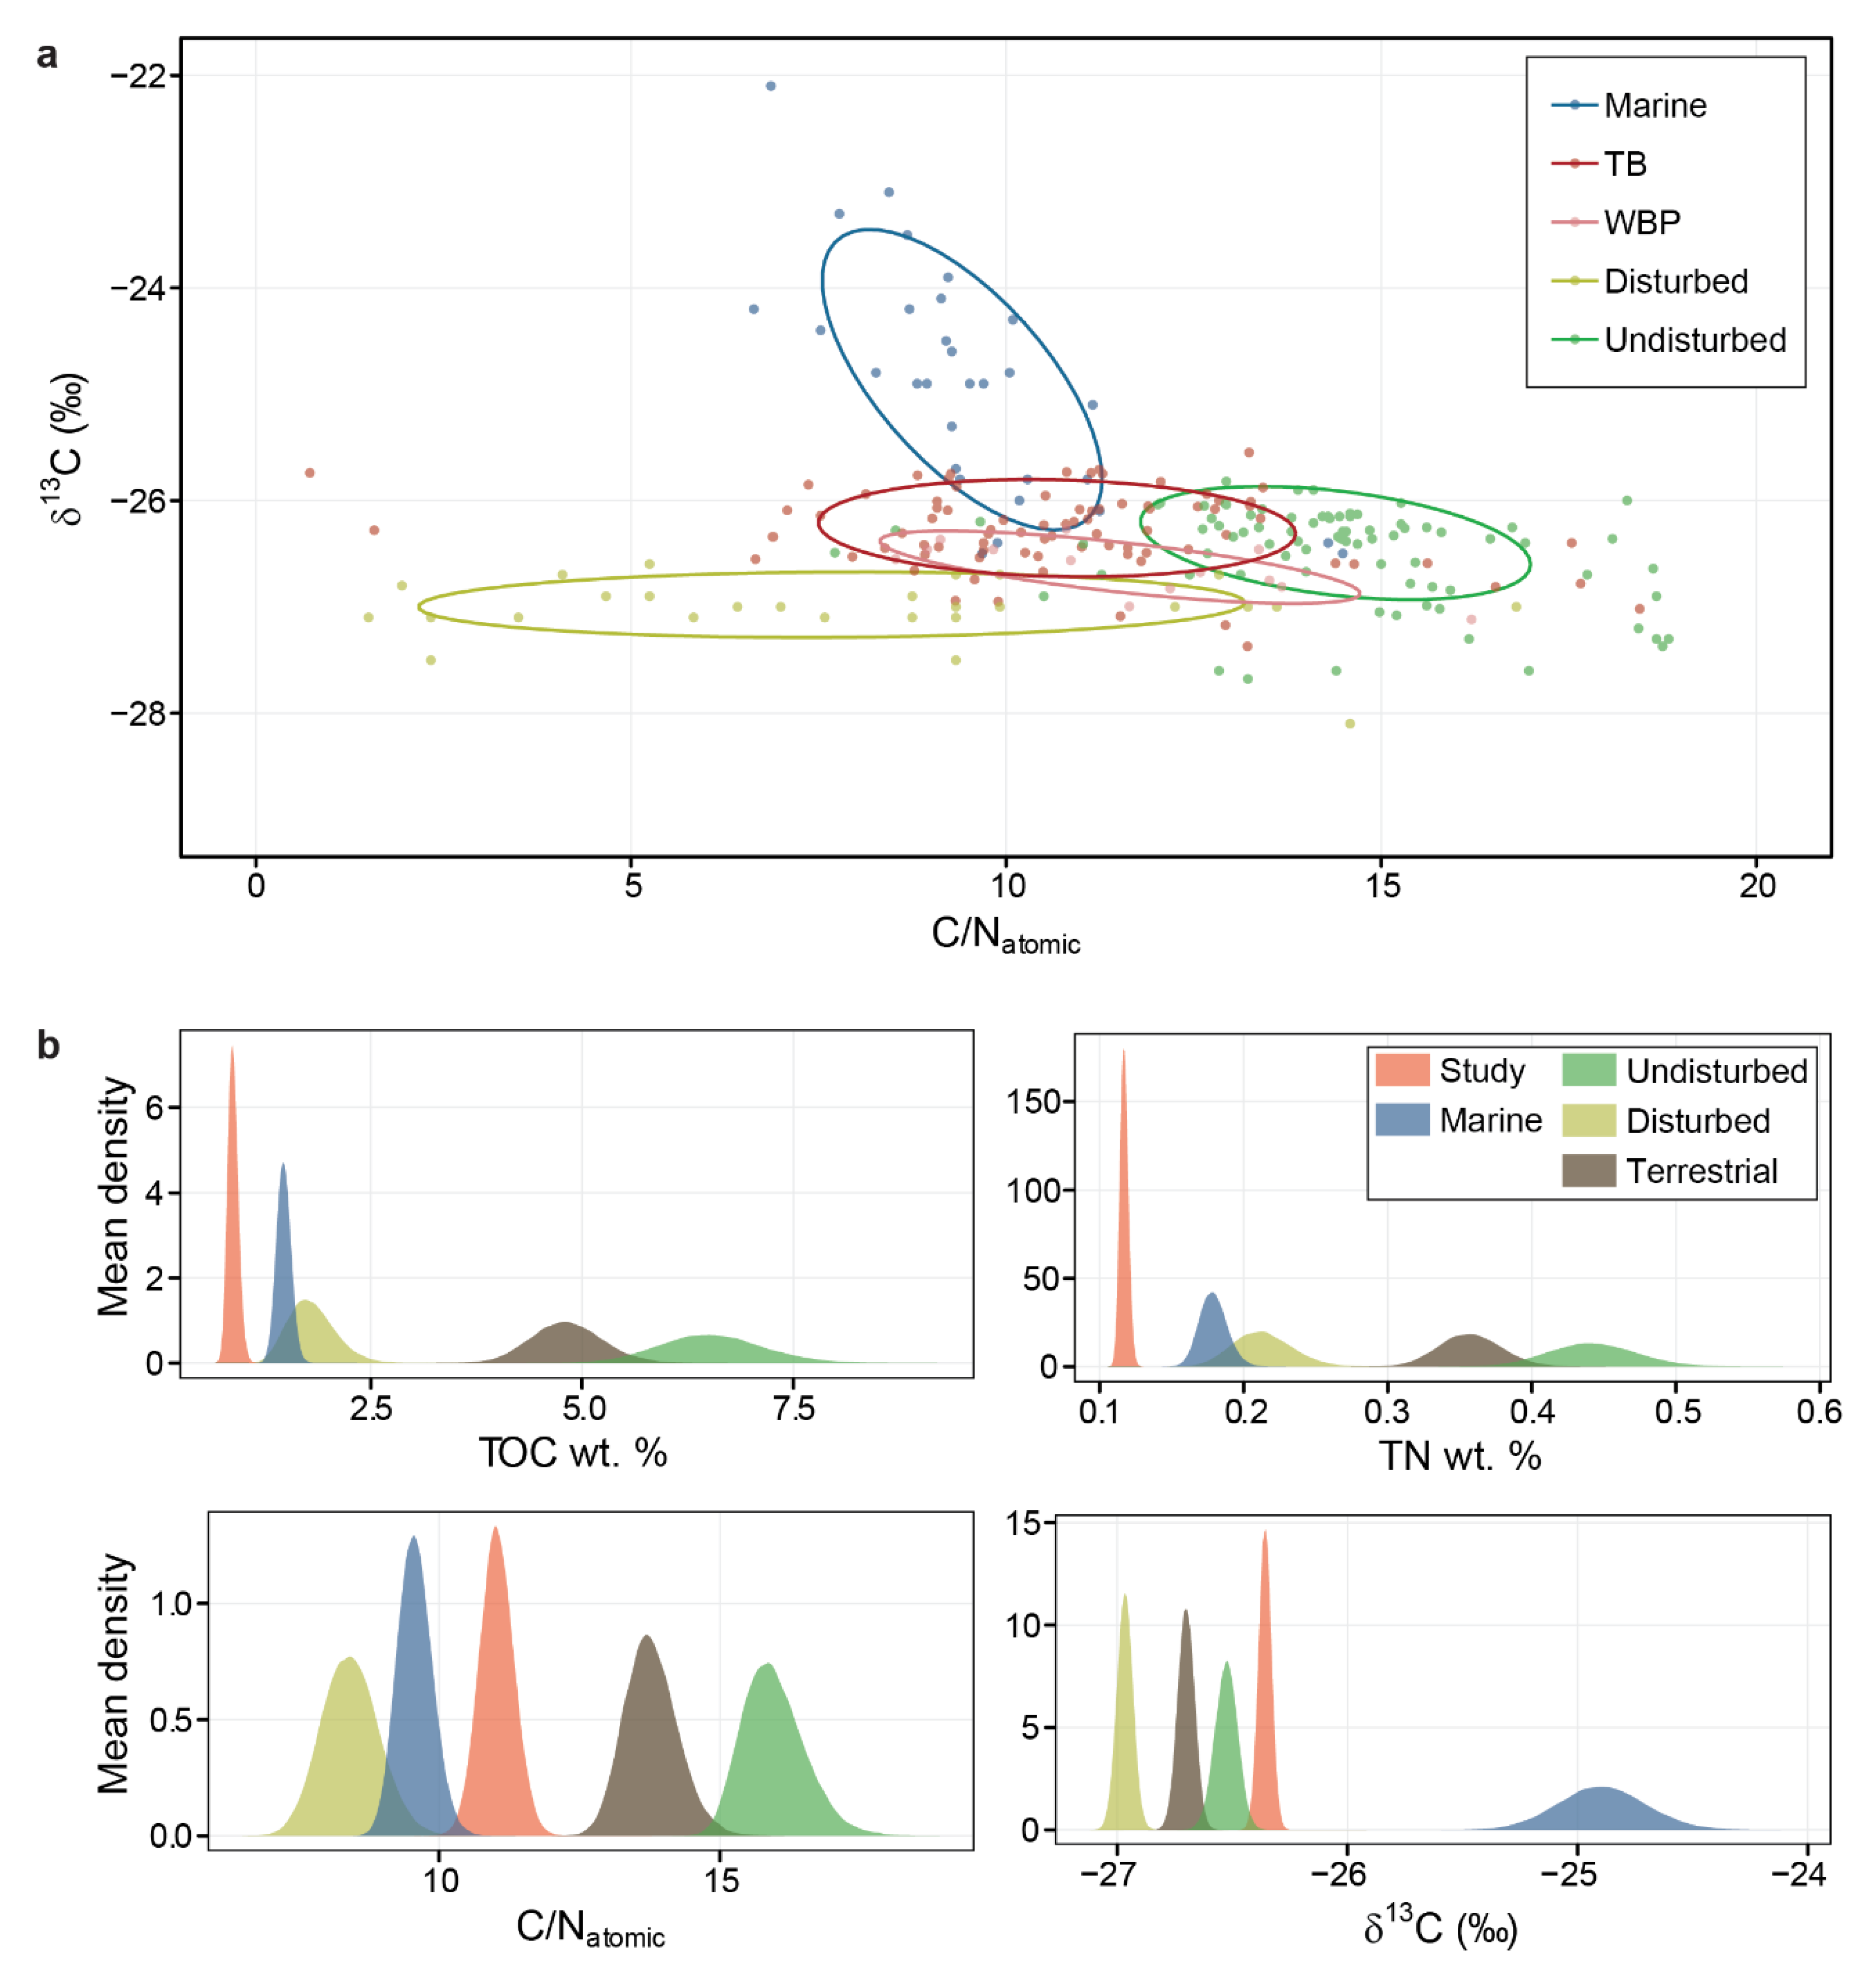
4.3. Bootstrap Comparisons with Other Studies
5. Discussion
5.1. Sediment Dispersal, Accumulation and Redistribution
5.2. Total Organic Carbon Content
5.3. Nearshore Organic Matter Characteristics
6. Conclusions
Supplementary Materials
Author Contributions
Funding
Institutional Review Board Statement
Informed Consent Statement
Data Availability Statement
Acknowledgments
Conflicts of Interest
References
- Wegner, C.; Bennett, K.E.; de Vernal, A.; Forwick, M.; Fritz, M.; Heikkilä, M.; Łącka, M.; Lantuit, H.; Laska, M.; Moskalik, M.; et al. Variability in Transport of Terrigenous Material on the Shelves and the Deep Arctic Ocean during the Holocene. Polar Res. 2015, 34, 24964. [Google Scholar] [CrossRef] [Green Version]
- Rachold, V.; Eicken, H.; Gordeev, V.V.; Grigoriev, M.N.; Hubberten, H.-W.; Lisitzin, A.P.; Shevchenko, V.P.; Schirrmeister, L. Modern Terrigenous Organic Carbon Input to the Arctic Ocean. In The Organic Carbon Cycle in the Arctic Ocean; Stein, R., Macdonald, R.W., Eds.; Springer: Berlin/Heidelberg, Germany, 2004; pp. 33–55. ISBN 978-3-642-18912-8. [Google Scholar]
- Barnhart, K.R.; Overeem, I.; Anderson, R.S. The Effect of Changing Sea Ice on the Vulnerability of Arctic Coasts. Cryosphere 2014, 8, 1777–1799. [Google Scholar] [CrossRef] [Green Version]
- Manson, G.K.; Solomon, S.M. Past and Future Forcing of Beaufort Sea Coastal Change. Atmosphere-Ocean 2007, 45, 107–122. [Google Scholar] [CrossRef]
- Overeem, I.; Anderson, R.S.; Wobus, C.W.; Clow, G.D.; Urban, F.E.; Matell, N. Sea Ice Loss Enhances Wave Action at the Arctic Coast. Geophys. Res. Lett. 2011, 38, L17503. [Google Scholar] [CrossRef]
- Günther, F.; Overduin, P.P.; Baranskaya, A.; Opel, T.; Grigoriev, M.N. Observing Muostakh Island Disappear: Erosion of a Ground-Ice-Rich Coast in Response to Summer Warming and Sea Ice Reduction on the East Siberian Shelf. Cryosphere 2015, 9, 151–178. [Google Scholar] [CrossRef] [Green Version]
- Irrgang, A.M.; Hugues, L.; Manson, G.K.; Frank, G.; Guido, G.; Overduin, P.P. Variability in Rates of Coastal Change Along the Yukon Coast, 1951 to 2015. J. Geophys. Res. Earth Surf. 2018, 123, 779–800. [Google Scholar] [CrossRef] [Green Version]
- Jones, B.M.; Arp, C.D.; Jorgenson, M.T.; Hinkel, K.M.; Schmutz, J.A.; Flint, P.L. Increase in the Rate and Uniformity of Coastline Erosion in Arctic Alaska. Geophys. Res. Lett. 2009, 36, 1–5. [Google Scholar] [CrossRef]
- Radosavljevic, B.; Lantuit, H.; Pollard, W.; Overduin, P.; Couture, N.; Sachs, T.; Helm, V.; Fritz, M. Erosion and Flooding—Threats to Coastal Infrastructure in the Arctic: A Case Study from Herschel Island, Yukon Territory, Canada. Estuaries Coasts 2015, 39, 900–915. [Google Scholar] [CrossRef] [Green Version]
- Lantuit, H.; Overduin, P.P.; Couture, N.; Wetterich, S.; Aré, F.; Atkinson, D.; Brown, J.; Cherkashov, G.; Drozdov, D.; Forbes, D.L. The Arctic Coastal Dynamics Database: A New Classification Scheme and Statistics on Arctic Permafrost Coastlines. Estuaries Coasts 2012, 35, 383–400. [Google Scholar] [CrossRef] [Green Version]
- Jorgenson, M.T.; Brown, J. Classification of the Alaskan Beaufort Sea Coast and Estimation of Carbon and Sediment Inputs from Coastal Erosion. Geo-Mar. Lett. 2005, 25, 69–80. [Google Scholar] [CrossRef]
- Knoblauch, C.; Beer, C.; Sosnin, A.; Wagner, D.; Pfeiffer, E.-M. Predicting Long-Term Carbon Mineralization and Trace Gas Production from Thawing Permafrost of Northeast Siberia. Glob. Change Biol. 2013, 19, 1160–1172. [Google Scholar] [CrossRef] [PubMed]
- Koven, C.D.; Schuur, E.A.G.; Schädel, C.; Bohn, T.J.; Burke, E.J.; Chen, G.; Chen, X.; Ciais, P.; Grosse, G.; Harden, J.W.; et al. A Simplified, Data-Constrained Approach to Estimate the Permafrost Carbon–Climate Feedback. Philos. Trans. R. Soc. Lond. Math. Phys. Eng. Sci. 2015, 373, 20140423. [Google Scholar] [CrossRef] [PubMed] [Green Version]
- Macdonald, R.W.; Kuzyk, Z.Z.A.; Johannessen, S.C. The Vulnerability of Arctic Shelf Sediments to Climate Change. Environ. Rev. 2015, 23, 461–479. [Google Scholar] [CrossRef]
- Opsahl, S.; Benner, R.; Amon, R.M.W. Major Flux of Terrigenous Dissolved Organic Matter through the Arctic Ocean. Limnol. Oceanogr. 1999, 44, 2017–2023. [Google Scholar] [CrossRef] [Green Version]
- Rachold, V.; Grigoriev, M.N.; Are, F.E.; Solomon, S.; Reimnitz, E.; Kassens, H.; Antonow, M. Coastal Erosion vs. Riverine Sediment Discharge in the Arctic Shelf Seas. Int. J. Earth Sci. 2000, 89, 450–460. [Google Scholar] [CrossRef]
- Schuur, E.A.G.; Abbott, B.W.; Bowden, W.B.; Brovkin, V.; Camill, P.; Canadell, J.G.; Chanton, J.P.; Chapin, F.S.; Christensen, T.R.; Ciais, P.; et al. Expert Assessment of Vulnerability of Permafrost Carbon to Climate Change. Clim. Chang. 2013, 119, 359–374. [Google Scholar] [CrossRef] [Green Version]
- Ramage, J.L.; Irrgang, A.M.; Morgenstern, A.; Lantuit, H. Increasing Coastal Slump Activity Impacts the Release of Sediment and Organic Carbon into the Arctic Ocean. Biogeosciences 2018, 15, 1483–1495. [Google Scholar] [CrossRef] [Green Version]
- Fritz, M.; Vonk, J.E.; Lantuit, H. Collapsing Arctic Coastlines. Nat. Clim. Chang. 2017, 7, 6. [Google Scholar] [CrossRef] [Green Version]
- Dunton, K.H.; Weingartner, T.; Carmack, E.C. The Nearshore Western Beaufort Sea Ecosystem: Circulation and Importance of Terrestrial Carbon in Arctic Coastal Food Webs. Prog. Oceanogr. 2006, 71, 362–378. [Google Scholar] [CrossRef]
- Hill, P.R.; Nadeau, O.C. Storm-Dominated Sedimentation on the Inner Shelf of the Canadian Beaufort Sea. J. Sediment. Res. 1989, 59, 455–468. [Google Scholar] [CrossRef]
- Retamal, L.; Bonilla, S.; Vincent, W.F. Optical Gradients and Phytoplankton Production in the Mackenzie River and the Coastal Beaufort Sea. Polar Biol. 2007, 31, 363–379. [Google Scholar] [CrossRef]
- Laruelle, G.G.; Dürr, H.H.; Lauerwald, R.; Hartmann, J.; Slomp, C.P.; Goossens, N.; Regnier, P.A.G. Global Multi-Scale Segmentation of Continental and Coastal Waters from the Watersheds to the Continental Margins. Hydrol. Earth Syst. Sci. 2013, 17, 2029–2051. [Google Scholar] [CrossRef] [Green Version]
- Blair, N.E.; Aller, R.C. The Fate of Terrestrial Organic Carbon in the Marine Environment. Annu. Rev. Mar. Sci. 2012, 4, 401–423. [Google Scholar] [CrossRef] [PubMed]
- Hyde, K.D.; Jones, E.B.G.; Leaño, E.; Pointing, S.B.; Poonyth, A.D.; Vrijmoed, L.L.P. Role of Fungi in Marine Ecosystems. Biodivers. Conserv. 1998, 7, 1147–1161. [Google Scholar] [CrossRef]
- Estapa, M.L.; Mayer, L.M. Photooxidation of Particulate Organic Matter, Carbon/Oxygen Stoichiometry, and Related Photoreactions. Mar. Chem. 2010, 122, 138–147. [Google Scholar] [CrossRef]
- Lintern, D.G.; Macdonald, R.W.; Solomon, S.M.; Jakes, H. Beaufort Sea Storm and Resuspension Modeling. J. Mar. Syst. 2013, 127, 14–25. [Google Scholar] [CrossRef]
- Reimnitz, E.; Kempema, E.W.; Barnes, P.W. Anchor Ice, Seabed Freezing, and Sediment Dynamics in Shallow Arctic Seas. J. Geophys. Res. 1987, 92, 14671–14678. [Google Scholar] [CrossRef]
- Walker, T.R.; Grant, J.; Cranford, P.; Lintern, D.G.; Hill, P.; Jarvis, P.; Barrell, J.; Nozais, C. Suspended Sediment and Erosion Dynamics in Kugmallit Bay and Beaufort Sea during Ice-Free Conditions. J. Mar. Syst. 2008, 74, 794–809. [Google Scholar] [CrossRef]
- Stark, N.; Radosavljevic, B.; Quinn, B.; Lantuit, H. Application of Portable Free-Fall Penetrometer for Geotechnical Investigation of Arctic Nearshore Zone. Can. Geotech. J. 2016, 54, 31–46. [Google Scholar] [CrossRef] [Green Version]
- Bianchi, T.S. The Role of Terrestrially Derived Organic Carbon in the Coastal Ocean: A Changing Paradigm and the Priming Effect. Proc. Natl. Acad. Sci. USA 2011, 108, 19473–19481. [Google Scholar] [CrossRef]
- Belicka, L.L.; Macdonald, R.W.; Harvey, H.R. Sources and Transport of Organic Carbon to Shelf, Slope, and Basin Surface Sediments of the Arctic Ocean. Deep Sea Res. Part Oceanogr. Res. Pap. 2002, 49, 1463–1483. [Google Scholar] [CrossRef]
- Bröder, L.; Tesi, T.; Andersson, A.; Eglinton, T.I.; Semiletov, I.P.; Dudarev, O.V.; Roos, P.; Gustafsson, Ö. Historical Records of Organic Matter Supply and Degradation Status in the East Siberian Sea. Org. Geochem. 2016, 91, 16–30. [Google Scholar] [CrossRef] [Green Version]
- Couture, N.J.; Irrgang, A.; Pollard, W.; Lantuit, H.; Fritz, M. Coastal Erosion of Permafrost Soils Along the Yukon Coastal Plain and Fluxes of Organic Carbon to the Canadian Beaufort Sea. J. Geophys. Res. Biogeosci. 2018, 123, 406–422. [Google Scholar] [CrossRef] [Green Version]
- Goñi, M.A.; Yunker, M.B.; Macdonald, R.W.; Eglinton, T.I. Distribution and Sources of Organic Biomarkers in Arctic Sediments from the Mackenzie River and Beaufort Shelf. Mar. Chem. 2000, 71, 23–51. [Google Scholar] [CrossRef]
- Goñi, M.A.; Yunker, M.B.; Macdonald, R.W.; Eglinton, T.I. The Supply and Preservation of Ancient and Modern Components of Organic Carbon in the Canadian Beaufort Shelf of the Arctic Ocean. Mar. Chem. 2005, 93, 53–73. [Google Scholar] [CrossRef]
- Macdonald, R.W.; Naidu, A.S.; Yunker, M.B.; Gobeil, C. The Beaufort Sea: Distribution, Sources, Fluxes and Burial of Organic Carbon. In The Organic Carbon Cycle in the Arctic Ocean; Stein, R., Macdonald, R.W., Eds.; Springer Publishing Company: Berlin, Germany, 2004; pp. 177–193. [Google Scholar]
- Naidu, A.S.; Cooper, L.W.; Finney, B.P.; Macdonald, R.W.; Alexander, C.; Semiletov, I.P. Organic Carbon Isotope Ratios (Δ13C) of Arctic Amerasian Continental Shelf Sediments. Int. J. Earth Sci. 2000, 89, 522–532. [Google Scholar] [CrossRef]
- Schreiner, K.M.; Bianchi, T.S.; Eglinton, T.I.; Allison, M.A.; Hanna, A.J.M. Sources of Terrigenous Inputs to Surface Sediments of the Colville River Delta and Simpson’s Lagoon, Beaufort Sea, Alaska: Inputs to the colville river delta, AK. J. Geophys. Res. Biogeosciences 2013, 118, 808–824. [Google Scholar] [CrossRef]
- Schubert, C.J.; Stein, R. Deposition of Organic Carbon in Arctic Ocean Sediments: Terrigenous Supply vs. Marine Productivity. Org. Geochem. 1996, 24, 421–436. [Google Scholar] [CrossRef]
- Vonk, J.E.; Sánchez-García, L.; van Dongen, B.E.; Alling, V.; Kosmach, D.; Charkin, A.; Semiletov, I.P.; Dudarev, O.V.; Shakhova, N.; Roos, P.; et al. Activation of Old Carbon by Erosion of Coastal and Subsea Permafrost in Arctic Siberia. Nature 2012, 489, 137–140. [Google Scholar] [CrossRef]
- Schreiner, K.M.; Bianchi, T.S.; Rosenheim, B.E. Evidence for Permafrost Thaw and Transport from an Alaskan North Slope Watershed. Geophys. Res. Lett. 2013, 41, 3117–3126. [Google Scholar] [CrossRef]
- Pelletier, B.R. Sediment Dispersal in the Southern Beaufort Sea; Beaufort Sea Project, Department of the Environment, Natural Resources Canada: Victoria, BC, Canada, 1975. [Google Scholar]
- Marine Science Atlas of the Beaufort Sea: Sediments/Atlas Des Sciences Marines de La Mer de Beaufort: Sédiments; Minister of Supply and Services: Ottawa, ON, Canada, 1984; ISBN 0-660-52681-6.
- Jerosch, K. Geostatistical Mapping and Spatial Variability of Surficial Sediment Types on the Beaufort Shelf Based on Grain Size Data. J. Mar. Syst. 2013, 127, 5–13. [Google Scholar] [CrossRef] [Green Version]
- Jong, D.; Bröder, L.; Tanski, G.; Fritz, M.; Lantuit, H.; Tesi, T.; Haghipour, N.; Eglinton, T.I.; Vonk, J.E. Nearshore Zone Dynamics Determine Pathway of Organic Carbon from Eroding Permafrost Coasts. Geophys. Res. Lett. 2020, 47, e2020GL088561. [Google Scholar] [CrossRef] [PubMed]
- Fritz, M.; Wetterich, S.; Schirrmeister, L.; Meyer, H.; Lantuit, H.; Preusser, F.; Pollard, W.H. Eastern Beringia and beyond: Late Wisconsinan and Holocene Landscape Dynamics along the Yukon Coastal Plain, Canada. Palaeogeogr. Palaeoclimatol. Palaeoecol. 2012, 319–320, 28–45. [Google Scholar] [CrossRef] [Green Version]
- Mackay, J.R. Glacier Ice-Thrust Features of the Yukon Coast. Geogr. Bull. 1959, 13, 5–21. [Google Scholar]
- Rampton, V.N. Quaternary Geology of the Yukon Coastal Plain; Geological Survey of Canada: Ottawa, ON, Canada, 1982; ISBN 0-660-10637-X.
- Pollard, W.H. The Nature and Origin of Ground Ice in the Herschel Island Area, Yukon Territory. In Proceedings of the Fifth Canadian Permafrost Conference, Quebec, QC, Canada, 6–8 June 1990; pp. 23–30. [Google Scholar]
- Thompson, F. Illustrations from: An Interpretive Manual for Reports on Granular Deposits in the Inuvialuit Settlement Region: Part of the Inuvialuit Final Agreement Implementation Program, Task 7-Sand and Gravel; Indian and Northern Affairs Canada; Northern Affairs Program: Ottawa, ON, Canada, 1994; p. 53.
- Wessel, P.; Smith, W.H.F. A Global, Self-Consistent, Hierarchical, High-Resolution Shoreline Database. J. Geophys. Res. Solid Earth 1996, 101, 8741–8743. [Google Scholar] [CrossRef] [Green Version]
- Environment and Climate Change Canada Historical Data-Climate-Environment and Climate Change Canada. Available online: http://climate.weather.gc.ca/historical_data/search_historic_data_e.html (accessed on 24 April 2017).
- Héquette, A.; Barnes, P.W. Coastal Retreat and Shoreface Profile Variations in the Canadian Beaufort Sea. Mar. Geol. 1990, 91, 113–132. [Google Scholar] [CrossRef]
- Solomon, S.M. Spatial and Temporal Variability of Shoreline Change in the Beaufort-Mackenzie Region, Northwest Territories, Canada. Geo-Mar. Lett. 2005, 25, 127–137. [Google Scholar] [CrossRef]
- Pelletier, B.R.; Medioli, B.E. Environmental Atlas of the Beaufort Coastlands; Natural Resources Canada/ESS/Scientific and Technical Publishing Services: Victoria, BC, Canada, 2014. [Google Scholar]
- Giovando, L.F.; Herlinveaux, R.H. A Discussion of Factors Influencing the Dispersion of Pollutants in the Beaufort Sea; Pacific Marine Science Report; Institute of Ocean Sciences: Sidney, BC, Canada, 1981; p. 198. [Google Scholar]
- Harper, J.R.; Reimer, P.D.; Collins, A.D. Canadian Beaufort Sea: Physical Shore-Zone Analysis; Geological Survey of Canada: Ottawa, ON, Canada, 1985; p. 105. [Google Scholar]
- Héquette, A.; Desrosiers, M.; Barnes, P.W. Sea Ice Scouring on the Inner Shelf of the Southeastern Canadian Beaufort Sea. Mar. Geol. 1995, 128, 201–219. [Google Scholar] [CrossRef] [Green Version]
- Atkinson, D.E. Observed Storminess Patterns and Trends in the Circum-Arctic Coastal Regime. Geo-Mar. Lett. 2005, 25, 98–109. [Google Scholar] [CrossRef]
- Thomson, J.; Rogers, W.E. Swell and Sea in the Emerging Arctic Ocean. Geophys. Res. Lett. 2014, 41, 3136–3140. [Google Scholar] [CrossRef]
- Pinchin, B.M.; Nairn, R.B.; Philpott, K.L. Beaufort Sea Coastal Sediment Study: Numerical Estimation of Sediment Transport and Nearshore Profile Adjustment at Coastal Sites in the Canadian Beaufort Sea; Geological Survey of Canada: Ottawa, ON, Canada, 1985; p. 712.
- Forbes, D.L.; Taylor, R.B. Ice in the Shore Zone and the Geomorphology of Cold Coasts. Prog. Phys. Geogr. Earth Environ. 1994, 18, 59–89. [Google Scholar] [CrossRef]
- Hill, P.R.; Blasco, S.M.; Harper, J.R.; Fissel, D.B. Sedimentation on the Canadian Beaufort Shelf. Proc. Can. Cont. Shelf Seabed Symp. CS 1991, 11, 821–842. [Google Scholar] [CrossRef]
- Macdonald, R.W.; Solomon, S.M.; Cranston, R.E.; Welch, H.E.; Yunker, M.B.; Gobeil, C. A Sediment and Organic Carbon Budget for the Canadian Beaufort Shelf. Mar. Geol. 1998, 144, 255–273. [Google Scholar] [CrossRef]
- Yang, D.; Shi, X.; Marsh, P. Variability and Extreme of Mackenzie River Daily Discharge during 1973–2011. Quat. Int. 2015, 380–381, 159–168. [Google Scholar] [CrossRef]
- Lantuit, H.; Pollard, W.H. Fifty Years of Coastal Erosion and Retrogressive Thaw Slump Activity on Herschel Island, Southern Beaufort Sea, Yukon Territory, Canada. Geomorphology 2008, 95, 84–102. [Google Scholar] [CrossRef]
- Ayles, G.B.; Snow, N.B. Canadian Beaufort Sea 2000: The Environmental and Social Setting. Arctic 2002, 55, 4–17. [Google Scholar] [CrossRef] [Green Version]
- Obu, J.; Lantuit, H.; Fritz, M.; Pollard, W.H.; Sachs, T.; Günther, F. Relation between Planimetric and Volumetric Measurements of Permafrost Coast Erosion: A Case Study from Herschel Island, Western Canadian Arctic. Polar Res. 2016, 35, 30313. [Google Scholar] [CrossRef] [Green Version]
- Radosavljevic, B.; Lantuit, H.; Plessen, B.; Knoblauch, C. Granulometry and Bulk Geochemistry of Nearshore Sediments, Herschel Island, Yukon Territory, Canada; Pangaea: Bremerhaven, Germany, 2016. [Google Scholar] [CrossRef]
- Radosavljevic, B. Tools for Statistical Evaluation and Exploration of Granulometric and Bulk Geochemical Data; GFZ Data Services: Potsdam, Germany, 2018. [Google Scholar] [CrossRef]
- Folk, R.L.; Ward, W.C. Brazos River Bar: A Study in the Significance of Grain Size Parameters. J. Sediment. Petrol. 1957, 27, 3–26. [Google Scholar] [CrossRef]
- Krumbein, W.C.; Pettijohn, F.J. Manual of Sedimentary Petrography; Appleton-Century-Crofts: New York, NY, USA, 1938; Volume 549. [Google Scholar]
- Blott, S.J.; Pye, K. GRADISTAT: A Grain Size Distribution and Statistics Package for the Analysis of Unconsolidated Sediments. Earth Surf. Process. Landf. 2001, 26, 1237–1248. [Google Scholar] [CrossRef]
- Meyers, P.A. Preservation of Elemental and Isotopic Source Identification of Sedimentary Organic Matter. Chem. Geol. 1994, 114, 289–302. [Google Scholar] [CrossRef] [Green Version]
- Stein, R.; Macdonald, R.W. Organic Carbon Budget: Arctic Ocean vs. Global Ocean. In The Organic Carbon Cycle in the Arctic Ocean; Stein, R., Macdonald, R.W., Eds.; Springer: Berlin/Heidelberg Germany, 2004; pp. 315–322. [Google Scholar]
- Tanski, G.; Lantuit, H.; Ruttor, S.; Knoblauch, C.; Radosavljevic, B.; Strauss, J.; Wolter, J.; Irrgang, A.M.; Ramage, J.; Fritz, M. Transformation of Terrestrial Organic Matter along Thermokarst-Affected Permafrost Coasts in the Arctic. Sci. Total Environ. 2017, 581–582, 434–447. [Google Scholar] [CrossRef] [PubMed] [Green Version]
- Obu, J.; Lantuit, H.; Myers-Smith, I.; Heim, B.; Wolter, J.; Fritz, M. Effect of Terrain Characteristics on Soil Organic Carbon and Total Nitrogen Stocks in Soils of Herschel Island, Western Canadian Arctic. Permafr. Periglac. Process. 2015, 28, 92–107. [Google Scholar] [CrossRef] [Green Version]
- Efron, B.; Tibshirani, R. Bootstrap Methods for Standard Errors, Confidence Intervals, and Other Measures of Statistical Accuracy. Stat. Sci. 1986, 1, 54–75. [Google Scholar] [CrossRef]
- R Core Team R: A Language and Environment for Statistical Computing; R Foundation for Statistical Computing: Vienna, Austria, 2018.
- Radosavljevic, B. Workboat Passage Bathymetry Isobaths; Pangaea: Bremerhaven, Germany, 2018. [Google Scholar] [CrossRef]
- Ramage, J.L.; Konopczak, A.M.; Herzschuh, U.; Morgenstern, A.; Couture, N.; Lantuit, H. Coastal Retrogressive Thaw Slumps along the Yukon Coast (Canada), Link to Shapefile; Pangaea: Bremerhaven, Germany, 2016. [Google Scholar] [CrossRef]
- Fritz, M.; Wolter, J.; Rudaya, N.; Palagushkina, O.; Nazarova, L.; Obu, J.; Rethemeyer, J.; Lantuit, H.; Wetterich, S. Holocene Ice-Wedge Polygon Development in Northern Yukon Permafrost Peatlands (Canada). Quat. Sci. Rev. 2016, 147, 279–297. [Google Scholar] [CrossRef] [Green Version]
- Klein, K.P.; Lantuit, H.; Heim, B.; Fell, F.; Doxaran, D.; Irrgang, A.M. Long-Term High-Resolution Sediment and Sea Surface Temperature Spatial Patterns in Arctic Nearshore Waters Retrieved Using 30-Year Landsat Archive Imagery. Remote Sens. 2019, 11, 2791. [Google Scholar] [CrossRef] [Green Version]
- Reimnitz, E.; Toimil, L.; Barnes, P. Arctic Continental Shelf Morphology Related to Sea-Ice Zonation, Beaufort Sea, Alaska. Mar. Geol. 1978, 28, 179–210. [Google Scholar] [CrossRef]
- Smith, C.A.S.; Kennedy, C.E.; Hargrave, A.E.; McKenna, K.M. Soil and Vegetation of Herschel Island, Yukon Territory. Yukon Soil Survey Report, Vol. 1. Land Resource Research Centre; Research Branch, Agriculture Canada: Ottawa, ON, Canada, 1989.
- Grotheer, H.; Meyer, V.; Riedel, T.; Pfalz, G.; Mathieu, L.; Hefter, J.; Gentz, T.; Lantuit, H.; Mollenhauer, G.; Fritz, M. Burial and Origin of Permafrost-Derived Carbon in the Nearshore Zone of the Southern Canadian Beaufort Sea. Geophys. Res. Lett. 2020, 47, e2019GL085897. [Google Scholar] [CrossRef]
- Visher, G.S. Grain-Size Distributions and Depositional Processes. J. Sediment. Petrol. 1969, 39, 1074–1106. [Google Scholar]
- Kempema, E.W.; Reimnitz, E.; Barnes, P.W. Sea Ice Sediment Entrainment and Rafting in the Arctic. J. Sediment. Res. 1989, 59, 308–317. [Google Scholar] [CrossRef]
- Bauch, H.A.; Kassens, H.; Naidina, O.D.; Kunz-Pirrung, M.; Thiede, J. Composition and Flux of Holocene Sediments on the Eastern Laptev Sea Shelf, Arctic Siberia. Quat. Res. 2001, 55, 344–351. [Google Scholar] [CrossRef]
- Fahl, K.; Stein, R. Modern Organic Carbon Deposition in the Laptev Sea and the Adjacent Continental Slope: Surface Water Productivity vs. Terrigenous Input. Org. Geochem. 1997, 26, 379–390. [Google Scholar] [CrossRef]
- Martens, J.; Romankevich, E.; Semiletov, I.; Wild, B.; van Dongen, B.; Vonk, J.; Tesi, T.; Shakhova, N.; Dudarev, O.V.; Kosmach, D.; et al. CASCADE–The Circum-Arctic Sediment CArbon DatabasE. Earth Syst. Sci. Data 2021, 13, 2561–2572. [Google Scholar] [CrossRef]
- Wijsman, J.; Herman, P.; Gomoiu, M. Spatial Distribution in Sediment Characteristics and Benthic Activity on the Northwestern Black Sea Shelf. Mar. Ecol. Prog. Ser. 1999, 181, 25–39. [Google Scholar] [CrossRef] [Green Version]
- Burdige, D.J. Burial of Terrestrial Organic Matter in Marine Sediments: A Re-Assessment. Glob. Biogeochem. Cycles 2005, 19. [Google Scholar] [CrossRef] [Green Version]
- Keil, R.G.; Tsamakis, E.; Fuh, C.B.; Giddings, J.C.; Hedges, J.I. Mineralogical and Textural Controls on the Organic Composition of Coastal Marine Sediments: Hydrodynamic Separation Using SPLITT-Fractionation. Geochim. Cosmochim. Acta 1994, 58, 879–893. [Google Scholar] [CrossRef]
- Pedrosa-Pàmies, R.; Sanchez-Vidal, A.; Calafat, A.; Canals, M.; Durán, R. Impact of Storm-Induced Remobilization on Grain Size Distribution and Organic Carbon Content in Sediments from the Blanes Canyon Area, NW Mediterranean Sea. Prog. Oceanogr. 2013, 118, 122–136. [Google Scholar] [CrossRef]
- Tesi, T.; Miserocchi, S.; Goñi, M.A.; Langone, L. Source, Transport and Fate of Terrestrial Organic Carbon on the Western Mediterranean Sea, Gulf of Lions, France. Mar. Chem. 2007, 105, 101–117. [Google Scholar] [CrossRef]
- Lantuit, H.; Pollard, W.H.; Couture, N.; Fritz, M.; Schirrmeister, L.; Meyer, H.; Hubberten, H.-W. Modern and Late Holocene Retrogressive Thaw Slump Activity on the Yukon Coastal Plain and Herschel Island, Yukon Territory, Canada. Permafr. Periglac. Process. 2012, 23, 39–51. [Google Scholar] [CrossRef]
- Grosse, G.; Harden, J.; Turetsky, M.; McGuire, A.D.; Camill, P.; Tarnocai, C.; Frolking, S.; Schuur, E.A.G.; Jorgenson, T.; Marchenko, S.; et al. Vulnerability of High-Latitude Soil Organic Carbon in North America to Disturbance. J. Geophys. Res. Biogeosci. 2011, 116, G00K06. [Google Scholar] [CrossRef] [Green Version]
- Dutta, K.; Schuur, E.A.G.; Neff, J.C.; Zimov, S.A. Potential Carbon Release from Permafrost Soils of Northeastern Siberia. Glob. Chang. Biol. 2006, 12, 2336–2351. [Google Scholar] [CrossRef]
- Rivkina, E.; Gilichinsky, D.; Wagener, S.; Tiedje, J.; McGrath, J. Biogeochemical Activity of Anaerobic Microorganisms from Buried Permafrost Sediments. Geomicrobiol. J. 1998, 15, 187–193. [Google Scholar] [CrossRef]
- Schuur, E.A.G.; Vogel, J.G.; Crummer, K.G.; Lee, H.; Sickman, J.O.; Osterkamp, T.E. The Effect of Permafrost Thaw on Old Carbon Release and Net Carbon Exchange from Tundra. Nature 2009, 459, 556. [Google Scholar] [CrossRef] [PubMed]
- Schädel, C.; Schuur, E.A.G.; Bracho, R.; Elberling, B.; Knoblauch, C.; Lee, H.; Luo, Y.; Shaver, G.R.; Turetsky, M.R. Circumpolar Assessment of Permafrost C Quality and its Vulnerability over Time using Long-Term Incubation Data. Glob. Chang. Biol. 2014, 20, 641–652. [Google Scholar] [CrossRef]
- Mann, P.J.; Eglinton, T.I.; McIntyre, C.P.; Zimov, N.; Davydova, A.; Vonk, J.E.; Holmes, R.M.; Spencer, R.G.M. Utilization of Ancient Permafrost Carbon in Headwaters of Arctic Fluvial Networks. Nat. Commun. 2015, 6, 7856. [Google Scholar] [CrossRef] [PubMed] [Green Version]
- Fritz, M.; Opel, T.; Tanski, G.; Herzschuh, U.; Meyer, H.; Eulenburg, A.; Lantuit, H. Dissolved Organic Carbon (DOC) in Arctic Ground Ice. Cryosphere Discuss. 2015, 9, 77–114. [Google Scholar] [CrossRef] [Green Version]
- Zimov, S.A.; Davydov, S.P.; Zimova, G.M.; Davydova, A.I.; Schuur, E.A.G.; Dutta, K.; Chapin, F.S. Permafrost Carbon: Stock and Decomposability of a Globally Significant Carbon Pool. Geophys. Res. Lett. 2006, 33, L20502. [Google Scholar] [CrossRef] [Green Version]
- Dou, F.; Ping, C.-L.; Guo, L.; Jorgenson, T. Estimating the Impact of Seawater on the Production of Soil Water-Extractable Organic Carbon during Coastal Erosion. J. Environ. Qual. 2008, 37, 2368–2374. [Google Scholar] [CrossRef]
- Magen, C.; Chaillou, G.; Crowe, S.A.; Mucci, A.; Sundby, B.; Gao, A.; Makabe, R.; Sasaki, H. Origin and Fate of Particulate Organic Matter in the Southern Beaufort Sea–Amundsen Gulf Region, Canadian Arctic. Estuar. Coast. Shelf Sci. 2010, 86, 31–41. [Google Scholar] [CrossRef]
- Belicka, L.L.; Harvey, H.R. The Sequestration of Terrestrial Organic Carbon in Arctic Ocean Sediments: A Comparison of Methods and Implications for Regional Carbon Budgets. Geochim. Cosmochim. Acta 2009, 73, 6231–6248. [Google Scholar] [CrossRef]
- Tyson, R.V. Sedimentary Organic Matter: Organic Facies and Palynofacies; Chapman & Hall: London, UK; New York, NY, USA, 1995; ISBN 0-412-36350-X. [Google Scholar]
- Fritz, M.; Wetterich, S.; Meyer, H.; Schirrmeister, L.; Lantuit, H.; Pollard, W.H. Origin and Characteristics of Massive Ground Ice on Herschel Island (Western Canadian Arctic) as Revealed by Stable Water Isotope and Hydrochemical Signatures. Permafr. Periglac. Process. 2011, 22, 26–38. [Google Scholar] [CrossRef] [Green Version]
- Schubert, C.J.; Calvert, S.E. Nitrogen and Carbon Isotopic Composition of Marine and Terrestrial Organic Matter in Arctic Ocean Sediments: Implications for Nutrient Utilization and Organic Matter Composition. Deep Sea Res. Part Oceanogr. Res. Pap. 2001, 48, 789–810. [Google Scholar] [CrossRef]
- Burdige, D.J. Preservation of Organic Matter in Marine Sediments: Controls, Mechanisms, and an Imbalance in Sediment Organic Carbon Budgets? Chem. Rev. 2007, 107, 467–485. [Google Scholar] [CrossRef] [PubMed]
- Shepard, F.P. Nomenclature Based on Sand-Silt-Clay Ratios. J. Sediment. Res. 1954, 24, 151. [Google Scholar] [CrossRef]

| Sample Means (0.99 CI) | ||||
|---|---|---|---|---|
| TOC [wt.%] | TN [wt.%] | C/N [Atomic] | δ13C [‰ VPDB] | |
| Study | 0.87 (0.74, 1.02) | 0.12 (0.11, 0.12) | 11.03 (10.33, 11.75) | −26.36 (−26.42, −26.29) |
| Marine | 1.47 (1.28, 1.67) | 0.18 (0.16, 0.2) | 9.57 (8.9, 10.33) | −24.89 (−25.33, −24.45) |
| Terrestrial (overall) | 4.82 (3.9, 5.84) | 0.36 (0.31, 0.41) | 13.78 (12.78, 14.99) | −26.7 (−26.79, −26.62) |
| Terrestrial (Undisturbed) | 6.53 (5.2, 8.01) | 0.44 (0.37, 0.51) | 15.95 (14.89, 17.41) | −26.53 (−26.64, −26.42) |
| Terrestrial (Disturbed) | 1.8 (1.27, 2.53) | 0.21 (0.17, 0.26) | 8.43 (7.32, 9.68) | −26.97 (−27.05, −26.89) |
Publisher’s Note: MDPI stays neutral with regard to jurisdictional claims in published maps and institutional affiliations. |
© 2022 by the authors. Licensee MDPI, Basel, Switzerland. This article is an open access article distributed under the terms and conditions of the Creative Commons Attribution (CC BY) license (https://creativecommons.org/licenses/by/4.0/).
Share and Cite
Radosavljevic, B.; Lantuit, H.; Knoblauch, C.; Couture, N.; Herzschuh, U.; Fritz, M. Arctic Nearshore Sediment Dynamics—An Example from Herschel Island—Qikiqtaruk, Canada. J. Mar. Sci. Eng. 2022, 10, 1589. https://doi.org/10.3390/jmse10111589
Radosavljevic B, Lantuit H, Knoblauch C, Couture N, Herzschuh U, Fritz M. Arctic Nearshore Sediment Dynamics—An Example from Herschel Island—Qikiqtaruk, Canada. Journal of Marine Science and Engineering. 2022; 10(11):1589. https://doi.org/10.3390/jmse10111589
Chicago/Turabian StyleRadosavljevic, Boris, Hugues Lantuit, Christian Knoblauch, Nicole Couture, Ulrike Herzschuh, and Michael Fritz. 2022. "Arctic Nearshore Sediment Dynamics—An Example from Herschel Island—Qikiqtaruk, Canada" Journal of Marine Science and Engineering 10, no. 11: 1589. https://doi.org/10.3390/jmse10111589
APA StyleRadosavljevic, B., Lantuit, H., Knoblauch, C., Couture, N., Herzschuh, U., & Fritz, M. (2022). Arctic Nearshore Sediment Dynamics—An Example from Herschel Island—Qikiqtaruk, Canada. Journal of Marine Science and Engineering, 10(11), 1589. https://doi.org/10.3390/jmse10111589