Communication

Comparing Catch Efficiency of Crayfish (Procambarus clarkii) Traps with Different Entrance Numbers

1
School of Environmental Science and Engineering, Hubei Polytechnic University, Huangshi 435003, China
2
TriNav Fisheries Consultants, Dartmouth, NS B3B 1N3, Canada
3
College of Fisheries, Ocean University of China, Qingdao 266003, China
4
School of Resources and Environmental Engineering, Wuhan University of Technology, Wuhan 430070, China
*
Author to whom correspondence should be addressed.
J. Mar. Sci. Eng. 2022, 10(11), 1708; https://doi.org/10.3390/jmse10111708
Submission received: 27 September 2022 / Revised: 30 October 2022 / Accepted: 8 November 2022 / Published: 9 November 2022
(This article belongs to the Section Marine Aquaculture)

Abstract

:
Traps with various designs have been developed for improving catch efficiency. Traditionally, traps with two or three entrances have been used in recreational crayfish (Procambarus clarkii) fisheries in China. More recently, traps with more than three entrances have been used in fisheries; however, it is unclear whether increasing the number of entrances on a trap increases crayfish capture efficiency. In this research, we evaluated and compared the capture efficiency of crayfish with traps varying in numbers of entrances (2–7). We assessed the catch per unit effort (CPUE) of crayfish in traps through 10 fishing trials. Our results suggested that CPUE did not differ significantly (p = 0.070) among the tested traps; however, CPUE by weight did vary significantly (p = 0.029) among the traps. The tested six-entrance traps caught more crayfish by weight than the five-entrance traps (p = 0.019). The results also revealed that the entrance number did not significantly (p = 0.29) affect the size of crayfish captured. The results are of practical significance for stakeholders to choose traps with efficient designs, and they are important for understanding and improving the catch efficiency of traps.

1. Introduction

Crayfish (Procambarus clarkii), native to south-central United States and north-eastern Mexico, is regarded as an invasive species in many countries around the world [1]. It was introduced to China in the early 20th century and can be found in most provinces of China [2,3]. Although it is an invasive species in China, crayfish has become one of the most important farmed crustacean species rather than being an economic, social, or ecological threat [4]. From 2015 to 2020, the annual production of farmed crayfish in China increased from 0.7 to 2.4 million tons, and the total commercial value of the crayfish industry in 2020 was about USD 54 billion [5]. It is also an important species in recreational and commercial fisheries in China and many other countries, although its economic value is unknown [1,6,7,8].
Traps (or pots) are commonly used to catch crayfish in recreational and commercial fisheries. They are also used to harvest crayfish in aquaculture industries or to control the spread of crayfish as an invasive species [9,10,11,12]. Traps are generally designed with metal frames covered with netting materials. Fish or crustacean species are attracted to the inside of the trap through tapered entrances, while escaping through the entrance is difficult. Using traps in fisheries have many benefits. These include easy operation, fuel efficiency, and relatively low negative impacts to the environment when compared to some mobile fishing gears, such as bottom trawls and dredges [13,14,15]. In addition, physical injuries to catches suffered from fishing operations are minimal, which lowers fishing mortality and increases catch quality [16,17,18]. However, the catch efficiency of traps is generally low for many fish and crustacean species [19,20,21].
Many studies have been carried out to improve catch efficiency through changing trap designs [18,19,20,21,22]. Researchers have revealed that the trap entrance is an important factor influencing catch efficiency (e.g., Refs. [23,24,25]). Whether the entrance facilitates fish to enter the trap and the ability of its designs to retain the catch inside affect catch efficiency [26]. Before entering the trap, locating the entrance is a prerequisite step for fish trying to enter [27]. Increasing the number of trap entrances helps fish to more easily locate the entrance, which could be a potential way to improve its catch efficiency.
Traps with more entrances than the traditional two or three ones have been developed for improving trap catching efficiency. However, whether the modifications are effective at improving catch efficiency is unknown. The objective of this study is to evaluate and compare the catch efficiency of crayfish traps with different entrance numbers. The catch per unit effort (CPUE) of six cylindrical traps that only differed in entrance number was assessed through fishing experiments.

2. Material and Methods

We tested six identical cylindrical traps with varying numbers of entrances (2–7). Each trap was 700 mm in diameter and 250 mm in height, with three braces between the top and bottom panels. The entrances were evenly distributed around the trap center and the angular distance between two near entrances were the same for each trap. Each entrance was 190 mm in diameter and 210 mm deep. The traps were made from steel frame covered with 4 mm nylon mesh (Figure 1).
We carried out fishing experiments at a crayfish farming pond at Leishanhu Farm Ltd. located in Huangshi, Hubei province of China (30°6′49″ N, 115°7′27″ E). The pond is 200 m long and 50 m wide. The average water depth was 1.5 m during the experiment. We tested the six traps each day for 10 consecutive days (2–11 September 2021). During each experiment, we randomly deployed all the traps on the bottom of a pond, and the distance between two traps was always at least 10 m. The soak time was 24 h for each experiment. We attached a bait box with around 100 g feed pellets to the trap. We measured all caught crayfish immediately after hauling back the traps. We measured total weight of catch from each trap on a digital scale with 0.1 g accuracy. We measured carapace length (CL) of each individual crayfish to the nearest 0.1 mm. After the measurement, we released the crayfish back into the pond before the next experiment.
We expressed CPUE as the total number (CPUEN) and total weight (CPUEW) of crayfish retained in a trap. We compared CPUE and CL separately among the traps with different entrance numbers. We performed all data analysis using R software [28]; therefore, all “packages” mentioned hereafter refer to data packages loaded in R. The dependent variables were continuous, and the independent variables were categorical; therefore, we used generalized linear mixed models (GLMM). GLMMs are able to handle unbalanced data with a mix of random and fixed independent variables [29]. For the following analyses, the independent variables were the number of entrances on a trap (En = 2, 3, 4, 5, 6, 7; fixed, categorical) and fishing date (D = 2–11; random, categorical).
For analyzing CPUEN, the dependent variable was count data (discrete); therefore, we considered both negative binomial and Poisson error structures. In this case, the model with the Poisson error structure had an overdispersion parameter that was significantly larger than one; therefore, we found the negative binomial error structure to be a better fit (Equation (1)). We used lme4 R package in version 1.1-17 [30] for fitting the models.
log(CPUEN) = α + βEn + D + ε
where CPUEN is the catch per unit effort in terms of count, α is the intercept, β is the regression coefficient, En represents entrance number, and D is the random variable representing the variability among fishing dates. D is assumed to be normally distributed with mean 0 and variance σ2. ε is the error term.
For the analysis of CPUEW (Equation (2)) and CL (Equation (3)), we used a Gaussian error structure because the dependent variables were a measurement (continuous). The dependent variable was total weight of crayfish in grams. Carapace length in mm was the dependent variable in the length analysis.
CPUEW = α + βEn + D + ε
CL = α + βEn + D + ε
where CPUEW is the catch per unit effort in terms of weight and CL is the carapace length of crayfish caught by each trap. For each equation above (Equations (2) and (3)), α is the intercept, β is the regression coefficient, En represents entrance number, and D is the random variable representing the variability among experiment dates. D is assumed to be normally distributed with mean 0 and variance σ2. ε is the error term.
To estimate how much of the variance was explained by fitted and random effects, we calculated conditional and marginal pseudo-R2 values for each mixed-effect model [31] using MuMIn version 0.12.2 [32]. If the conditional and marginal pseudo-R2 values for a model were equal, we determined that the inclusion of random effects was not making significant improvements to the model and, therefore, a generalized linear model without the random effect would have been more appropriate.
We verified all model assumptions by plotting residuals versus fitted values, versus each covariate in the model, and versus each covariate not in the model. We visually assessed normality using quantile–quantile plots. Model validation indicated no problems. We used Tukey post hoc testing to determine where specific differences lied within significant independent variables.

3. Results

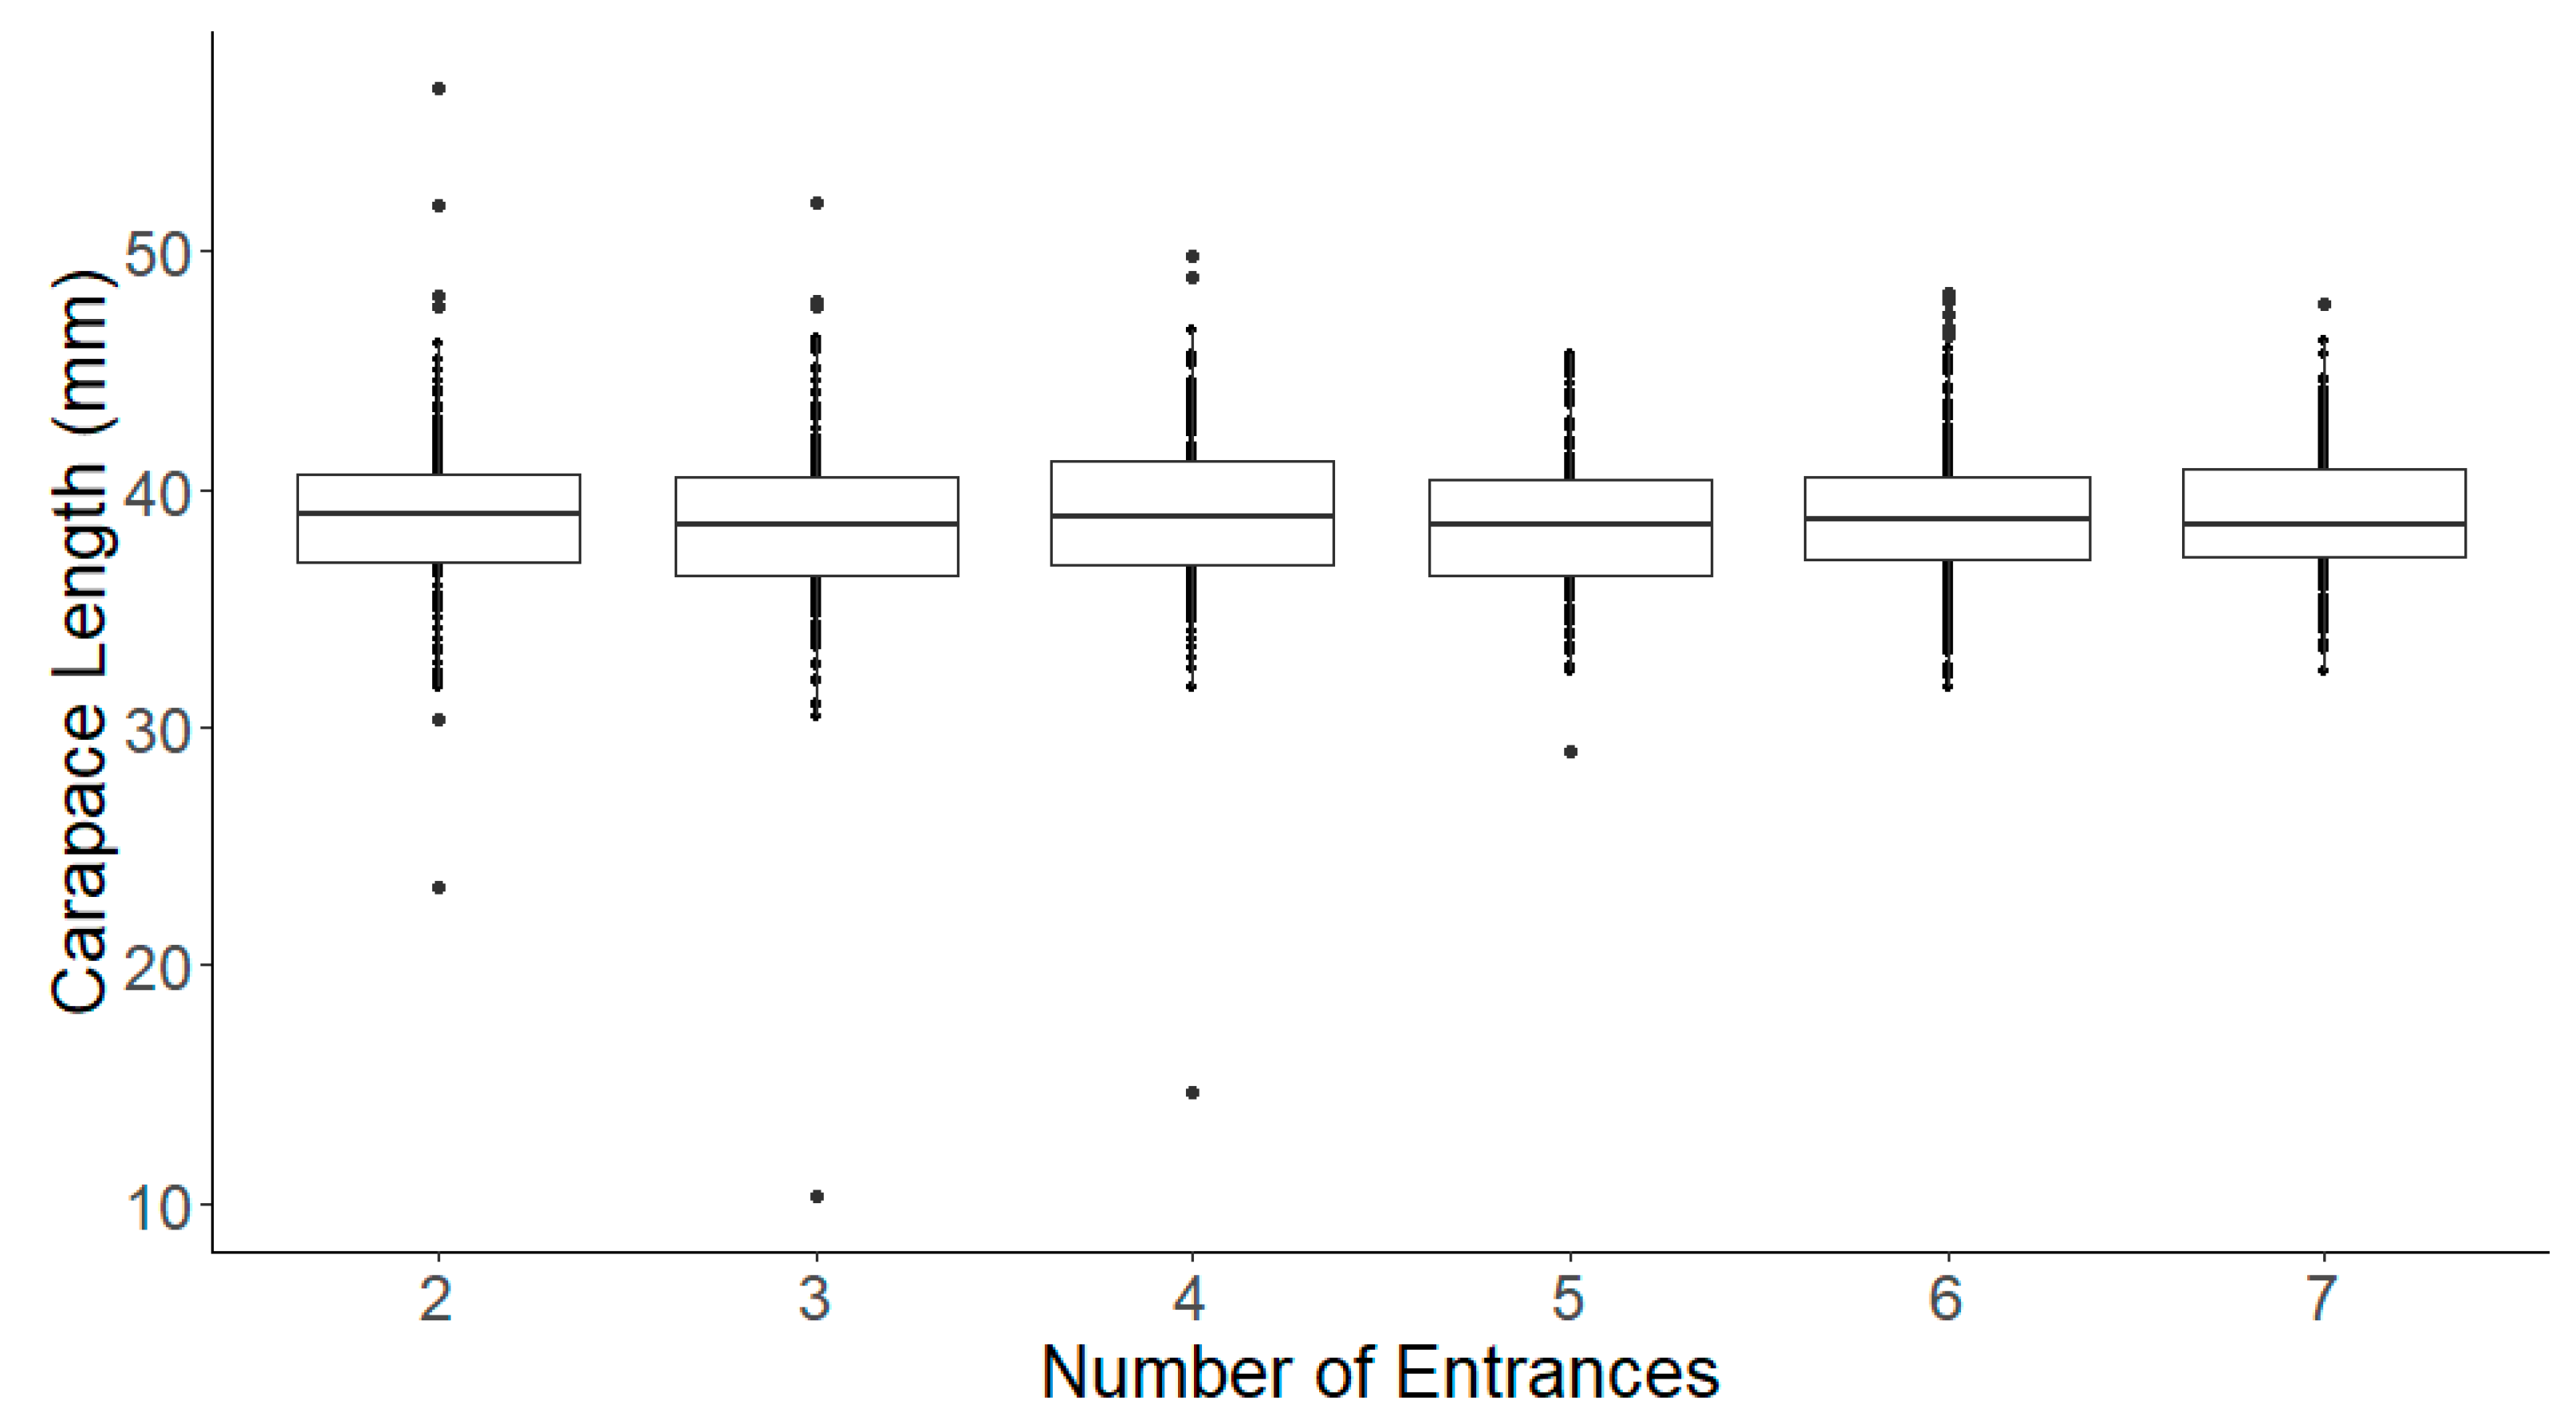
A total of 1264 crayfish were caught over 10 days using six traps with entrance numbers ranging from two to seven. The mean CL of the crayfish captured in all traps was 38.9 mm. The mean CL of the crayfish captured in the traps with three–seven entrances did not significantly differentiate from those caught in two-entrance traps (Figure 2). Model regression results are summarized in Table 1. For the CL model with only fixed effects, the marginal pseudo-R2 was 0.005. For the fixed and random effects, the conditional pseudo-R2 was 0.123 (Table 1). This indicated that the inclusion of random effects made improvements to the model fit. Overall, the number of entrances did not significantly affect the size of the crayfish captured (F5,1210 = 1.23, p = 0.292) (Figure 2, Table 1).
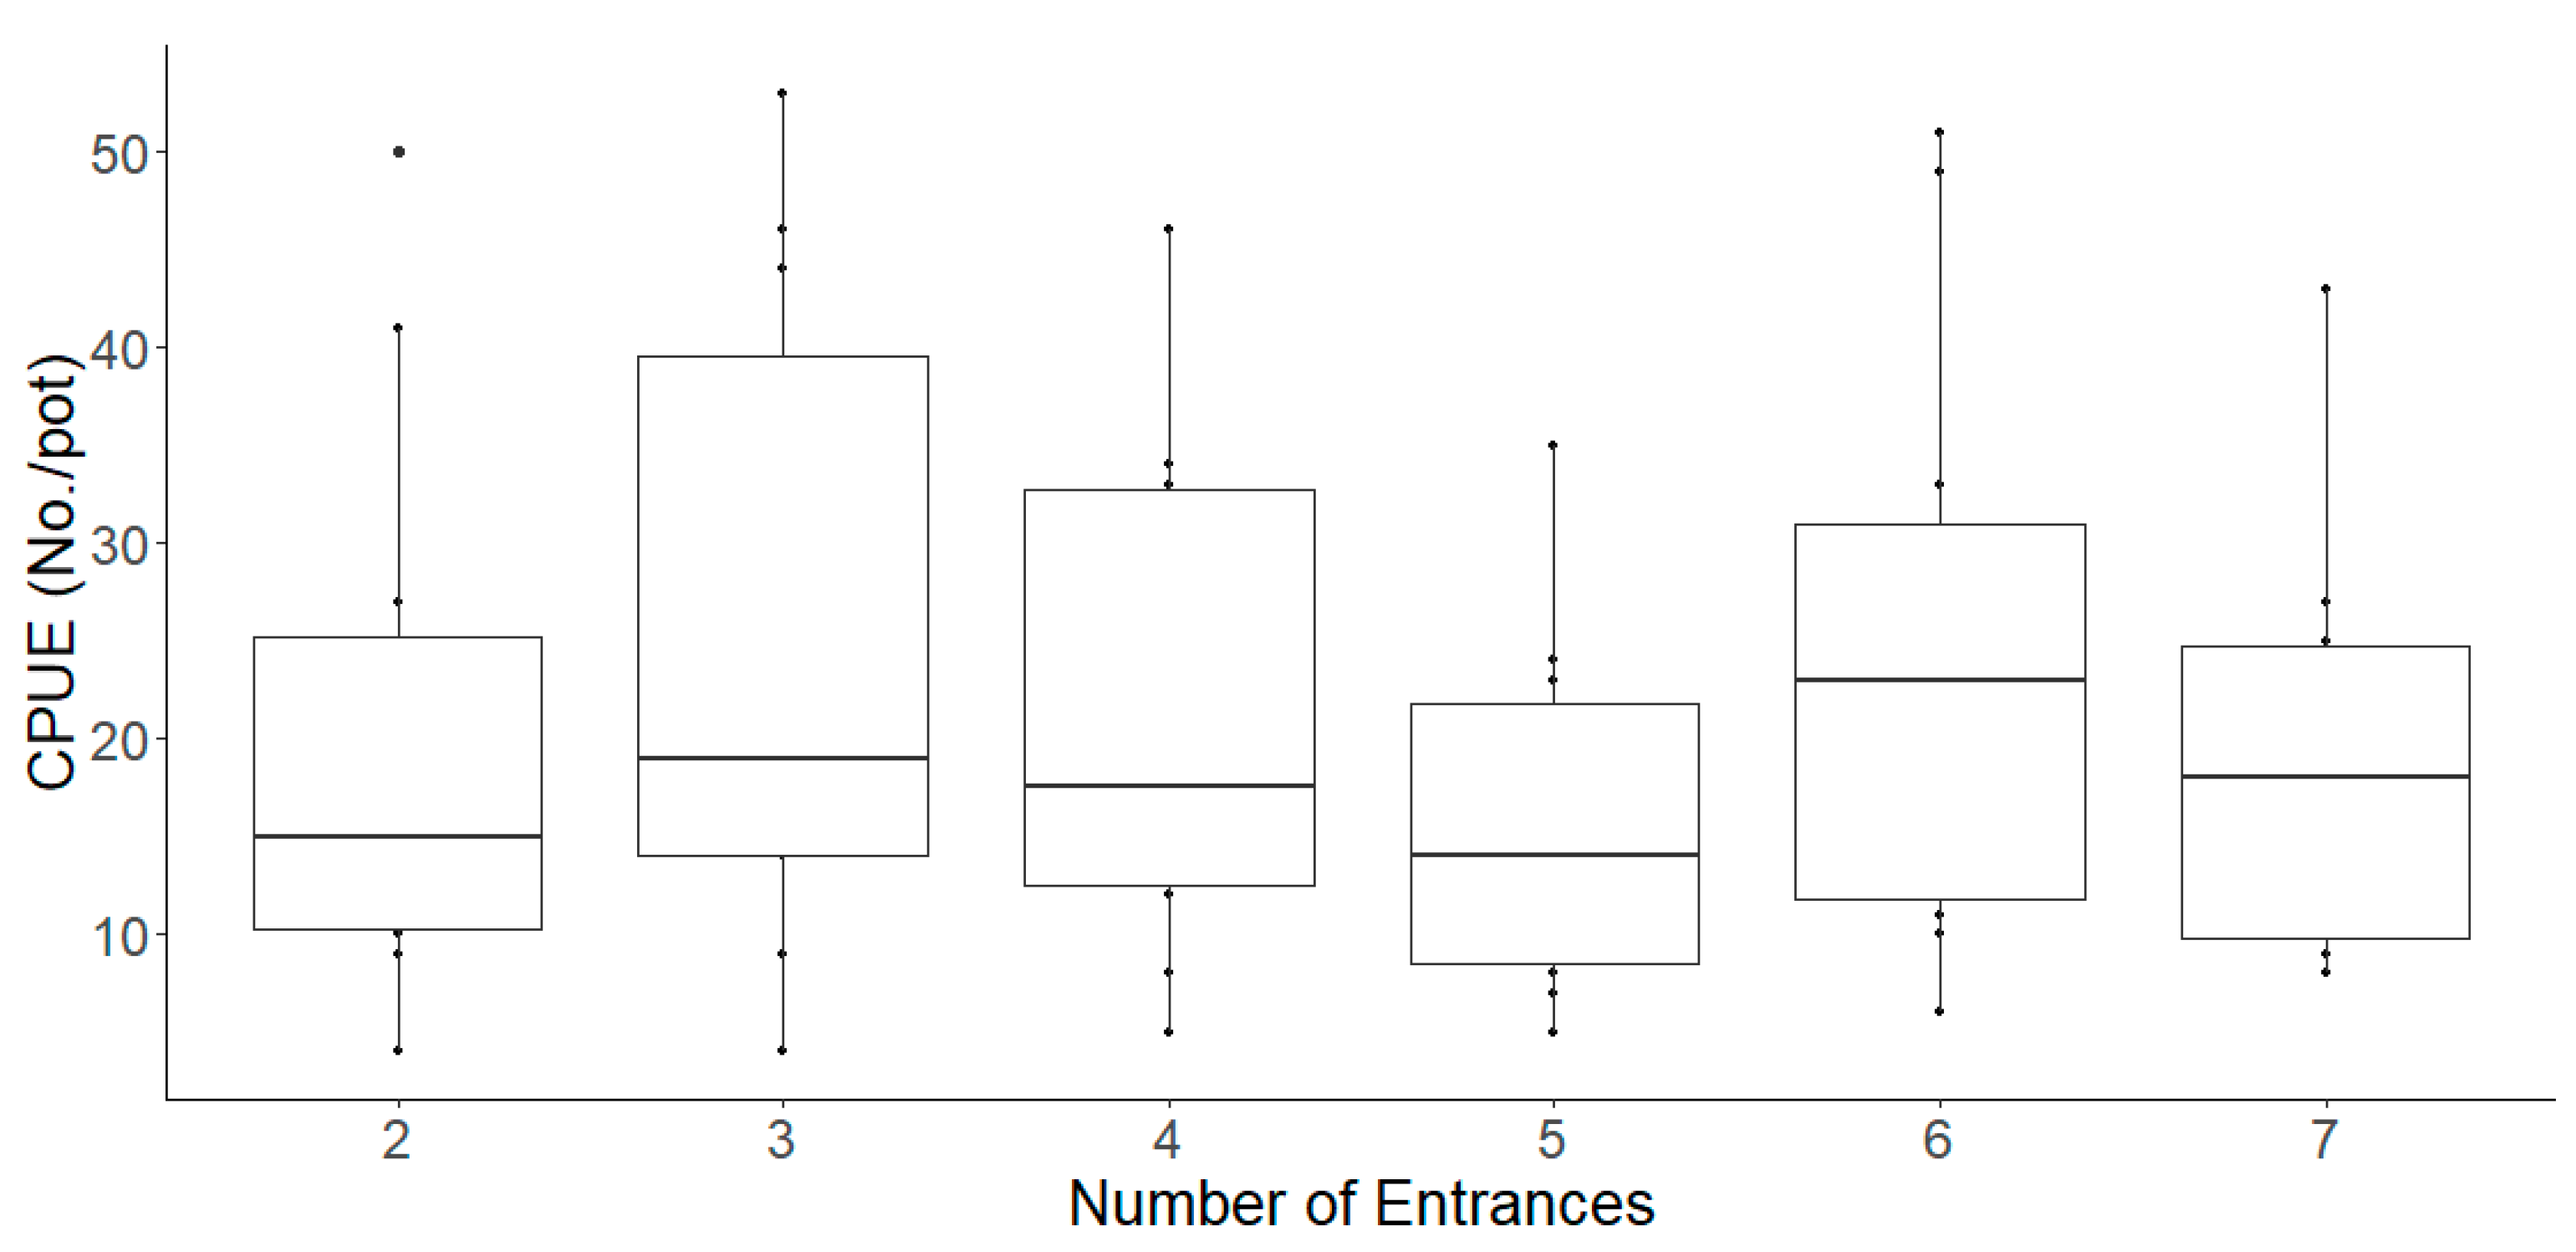
For CPUEN, the model’s marginal and conditional pseudo-R2 values suggested that adding the random effect to the model improves the model fitting (Table 1). The CPUEN of the traps with two–seven entrances was 20, 25, 22, 16, 25, and 19, respectively. CPUEN did not differ significantly among traps with different amounts of entrances (F5,54 = 2.17, p = 0.070; Figure 3, Table 1).
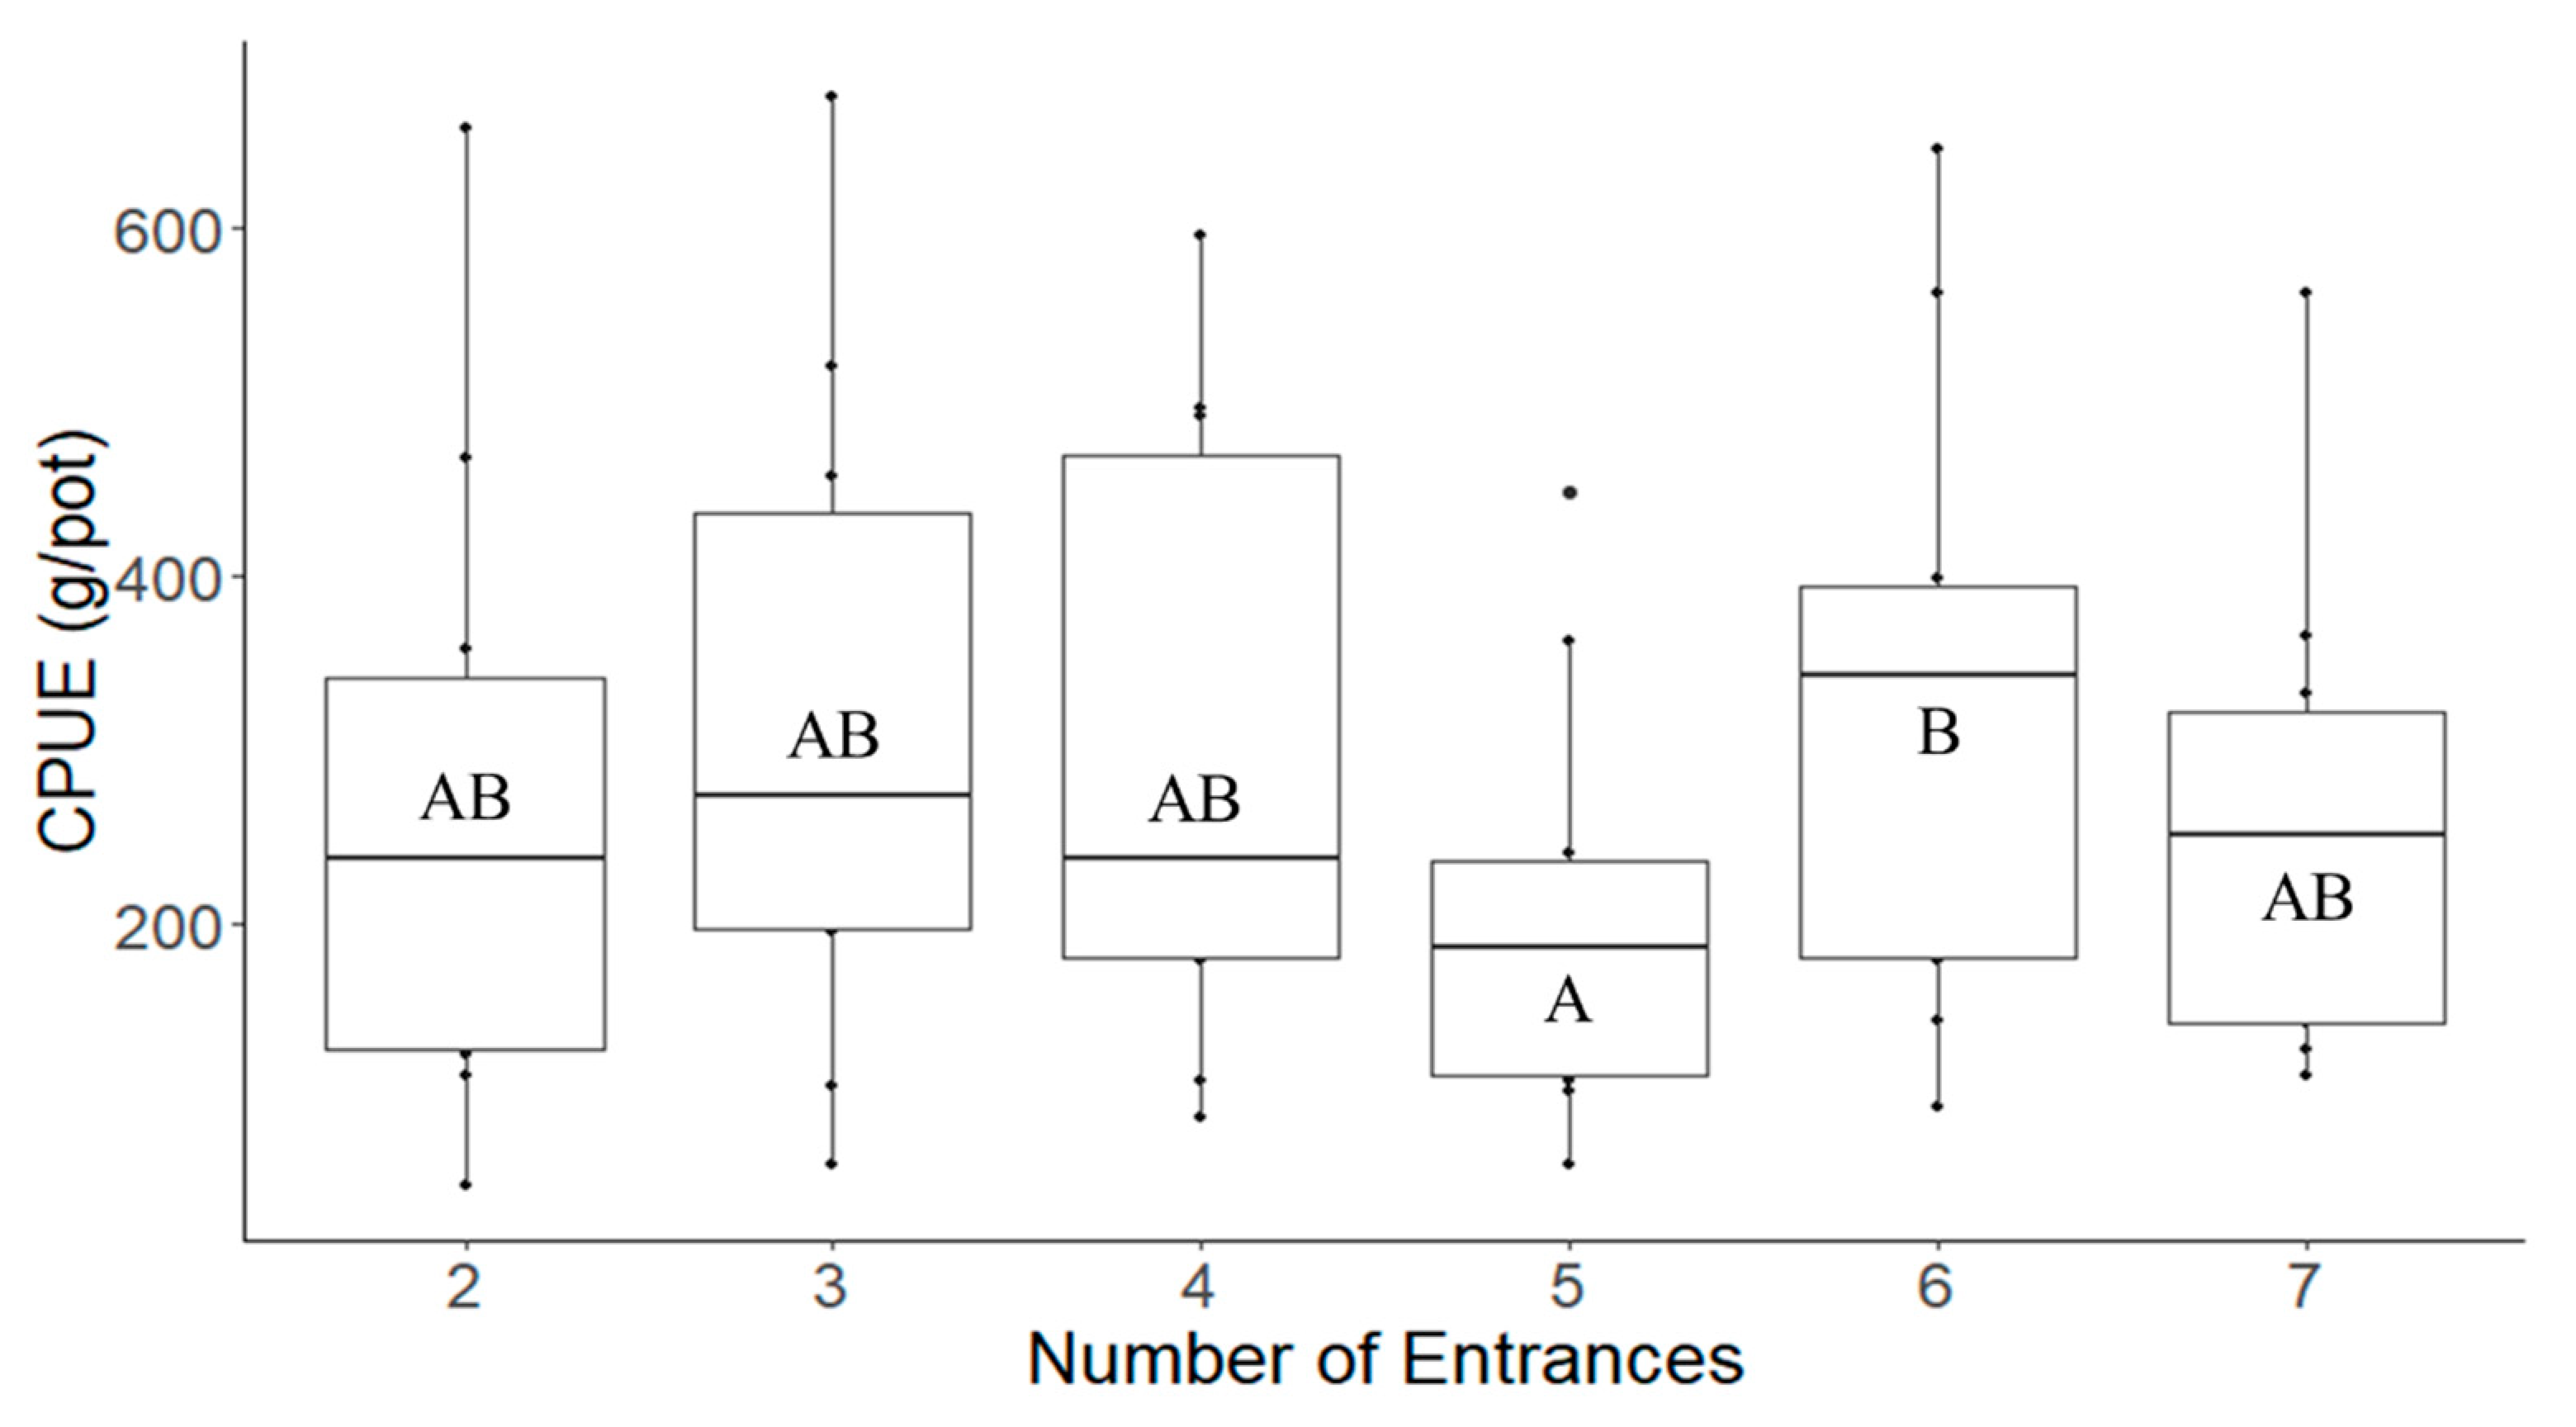
CPUEW did differ significantly by number of trap entrances (F5,54 = 2.71, p = 0.029). The mean catch by weight (g) per trap was 267, 314, 302, 204, 328, and 258 for entrance numbers from two to seven. respectively. Tukey post hoc analysis revealed that significantly more crayfish by weight (p = 0.019) were captured in six-entrance traps than in five-entrance traps (Figure 4). The difference between the marginal pseudo-R2 and the conditional pseudo-R2 suggested that random effects account for a large amount of the variability in the results (Table 1).

4. Discussion

Catch per unit effort was based on the counts and weight of the traps, and only differences in the number of entrances were evaluated and compared. The results showed that the traps did not differ significantly in CPUEN, while the CPUEW of six-entrance traps was significantly higher than that of five-entrance traps. According to the results, trap entrance number did not significantly affect the CL of the captured crayfish. The findings are not limited to recreational crayfish fisheries. They are of practical significance for commercial fisheries, where the total weight of the catch is considered to be more important than the catch number. For stakeholders more concerned with catch number (e.g., invasive crayfish controlling), the results are also useful for selecting traps with effective entrance numbers. However, the interpretations and applications of the results should be performed with caution considering the limitations of the research.
This study was carried out in a crayfish farming pond instead of a natural environment, such as a wild pond, river, or lake, because a lack of crayfish individuals in the waters where the traps are deployed could mask the differences in catch efficiency (e.g., CPUEN) among the tested traps. The population density of crayfish in a farming pond is generally higher than in natural waters; therefore, we can gather enough catch data for analysis. It should also be noted that the experimental conditions were relatively controllable compared to natural waters, which reduced the uncertainty of the research. The pond has been used for farming crayfish for many years and traps are the main fishing gears to harvest crayfish. The CLs of crayfish caught in the pond showed no significant differences. This was probably due to the tested traps using the same mesh sizes. Mesh size is one of the most significant factors affecting the size selectivity of fishing gears [33,34].
Previous studies have investigated the capture efficiency of traps used in various fisheries. Many factors are known to impact a trap’s capture efficiency, such as soak time, bait type, entrance designs, netting material, and so on (e.g., Refs. [25,35,36,37]). However, these factors were considered controlled variables in this research, remaining consistent among tested traps during the experiment; therefore, they were not the focus of this study. According to Meintzer et al. [23], pots with four entrances landed significantly more catch in number than the two-entrance pots used in commercial cod fisheries. However, another research by Tran et al. [22] demonstrated that modified one-entrance pots harvested more crabs than traditional three-entrance pots. Contrary to these findings, our results showed no significant difference in catch efficiency (CPUEN) among traps with different entrance numbers.
To further improve the catch efficiency of crayfish traps, a combination of different trap designs and fishing methods is recommended. According to the findings of García de Lomas et al. [38], the combined use of traps and fish-keeping nets increased crayfish catch efficiency. Some related studies also suggested the combined use of different traps to maximize CPUE [39,40]. In this study, the relative catch efficiency (i.e., comparison of CPUE under the same experiment conditions) was considered more important than the CPUE figures. The CPUE of the traps varied with experiment conditions. Different fishing seasons, bait types, soak times, or crayfish abundance can produce different CPUE results. When comparing the catch efficiency among the traps, the effects of control variables (e.g., fishing season, bait type, soak time, etc.) were canceled out. The independent variables in this study, including the number of entrances, explained some of the differences in CPUE numbers among the tested traps. However, variation between fishing experiments existed, and there were still some unexplained factors affecting the results (see Table 1). The territorial behavior (e.g., attack, defense) of crayfish could limit the number of individuals one trap can fit [41,42]. Crayfish already in the trap may affect those trying to enter. Further studies are required to reveal the interactions between trap designs and crayfish behaviors. Video recording (e.g., Ref. [24]) is suggested as a method to further investigate the effects of trap designs on catch efficiency.

Author Contributions

Conceptualization, Z.C. and M.H.F.; investigation, Z.C. and L.H.; data curation, Z.C. and M.H.F.; writing—original draft preparation, Z.C. and M.H.F.; writing—review and editing, Z.C., M.H.F., L.H. and Y.L.; supervision, L.H. and Y.L. All authors have read and agreed to the published version of the manuscript.

Funding

This research was supported by Hubei Polytechnic University through the Recruitment Program of Talents, grant number 21xjz13R.

Institutional Review Board Statement

Not applicable.

Informed Consent Statement

Not applicable.

Data Availability Statement

Data sharing not applicable.

Acknowledgments

We would like to thank many staff from Wangren Town People’s Government who assisted with the project, including Xindou Wei, Jinsuo Xu, Guowang Cheng, and Baolin Xu. We are also grateful to Fang Tong and Nan Li from Hubei Polytechnic University for their contributions to the fieldwork.

Conflicts of Interest

The authors declare no conflict of interest.

References

  1. Oficialdegui, F.J.; Sánchez, M.I.; Clavero, M. One century away from home: How the red swamp crayfish took over the world. Rev. Fish Biol. Fish. 2020, 30, 121–135. [Google Scholar] [CrossRef]
  2. Yue, G.H.; Li, J.; Bai, Z.; Wang, C.M.; Feng, F. Genetic diversity and population structure of the invasive alien red swamp crayfish. Biol. Invasions 2010, 12, 2697–2706. [Google Scholar] [CrossRef]
  3. Wang, C.; Li, Z.; Liang, H.; Hu, G.; Wu, Q.; Zou, G.; Luo, X. Genetic diversity in four Procambarus clarkia populations in the lower reaches of the Yangtze River. Biodivers. J. 2009, 17, 518. [Google Scholar]
  4. Wang, Q.; Ding, H.; Tao, Z.; Ma, D. Crayfish (Procambarus clarkii) Cultivation in China: A Decade of Unprecedented Development. In Aquaculture in China; John Wiley & Sons Ltd.: Chichester, UK, 2018; pp. 363–377. [Google Scholar]
  5. Ministry of Agriculture and Rural Affairs of the People’s Republic of China. China Crayfish Industry Development Report; Ministry of Agriculture and Rural Affairs of the People’s Republic of China: Beijing, China, 2021; Volume 7, pp. 27–33. (In Chinese)
  6. Farrag, M.M.S.; El-Geddawy, M.A.; Ahmed, Z.S.A. More evidences for the nutritional quality and future exploitation of the invasive crayfish Procambarus clarkii (Girard, 1852) from the River Nile, Egypt. Egypt. J. Aquat. Res. 2022, 48, 151–156. [Google Scholar] [CrossRef]
  7. Hady, F.; Deeb, R.; Saad, A.; Rahman, F. Effect of partial or total replacement of fish meal with Procambarus clarkii by-product meal in Oreochromis niloticus diets. Egypt. J. Exp. Biol. 2019, 15, 277. [Google Scholar] [CrossRef]
  8. Sara, S.; Abdelouahab, S.; Ahcen, M.; Habib, E.J.; Majida, E.A.E.M. Socioeconomic impact following the introduction of the red swamp crayfish Procambarus clarkii (Girard, 1852) in Morocco. Int. J. Adv. Eng. Sci. Appl. Math. 2020, 9, 8–17. [Google Scholar]
  9. Kvistad, J.; Galarowicz, T.; Clapp, D.; Chadderton, L.; Tucker, A.; Herbert, M. An evaluation of three trap designs for invasive rusty crayfish (Faxonius rusticus) suppression on critical fish spawning habitat in northern Lake Michigan. Manag. Biol. Invasions 2021, 12, 975–996. [Google Scholar] [CrossRef]
  10. Stevens, B.G. The ups and downs of traps: Environmental impacts, entanglement, mitigation, and the future of trap fishing for crustaceans and fish. ICES J. Mar. Sci. 2020, 78, 584–596. [Google Scholar] [CrossRef]
  11. Bills, T.D.; Marking, L.L. Control of Nuisance Populations of Crayfish with Traps and Toxicants. Progress. Fish-Cult. 1988, 50, 103–106. [Google Scholar] [CrossRef]
  12. Larson, E.R.; Olden, J.D. The State of Crayfish in the Pacific Northwest. Fisheries 2011, 36, 60–73. [Google Scholar] [CrossRef]
  13. Suuronen, P.; Chopin, F.; Glass, C.; Løkkeborg, S.; Matsushita, Y.; Queirolo, D.; Rihan, D. Low impact and fuel efficient fishing–Looking beyond the horizon. Fish. Res. 2012, 135–146. [Google Scholar] [CrossRef]
  14. Richardson, K.; Hardesty, B.D.; Wilcox, C. Estimates of fishing gear loss rates at a global scale: A literature review and meta-analysis. Fish Fish. 2019, 20, 1218–1231. [Google Scholar] [CrossRef]
  15. Uhlmann, S.S.; Broadhurst, M.K. Mitigating unaccounted fishing mortality from gillnets and traps. Fish Fish. 2013, 16, 183–229. [Google Scholar] [CrossRef]
  16. Nguyen, K.Q.; Morris, C.J. Fishing for Atlantic cod (Gadus morhua) with pots and gillnets: A catch comparison study along the southeast coast of Labrador. Aquac. Fish. 2022, 7, 433–440. [Google Scholar] [CrossRef]
  17. Leland, J.C.; Butcher, P.A.; Broadhurst, M.K.; Paterson, B.D.; Mayer, D.G. Relative trap efficiency for recreationally caught eastern Australian blue swimmer crab (Portunus pelagicus) and associated injury and mortality of discards. Fish. Res. 2013, 147, 304–311. [Google Scholar] [CrossRef]
  18. Huner, J.V.; Paret, J. Trap harvest of crawfish (Procambarus spp.) from a South Louisiana commercial pond: Effectiveness of different baits and species composition. Freshw. Crayfish 1995, 8, 376–390. [Google Scholar]
  19. Winger, P.D.; Walsh, P.J. Selectivity, efficiency, and underwater observations of modified trap designs for the snow crab (Chionoecetes opilio) fishery in Newfoundland and Labrador. Fish. Res. 2011, 109, 107–113. [Google Scholar] [CrossRef]
  20. Bechler, D.; Hightower, P.; Rousy, J.; Smith, M. The use of nest-traps to study behavior, population structure and li fe history of Procambarus spiculifer. Freshw. Crayfish 2014, 20, 7–16. [Google Scholar] [CrossRef]
  21. Parkyn, S.; DiStefano, R.; Imhoff, E. Comparison of constructed microhabitat and baited traps in Table Rock Reservoir, Missouri, USA. Freshw. Crayfish 2011, 18, 69–74. [Google Scholar] [CrossRef]
  22. Tran, P.D.; Nguyen, L.T.; To, P.V.; Nguyen, K.Q. Effects of the trap entrance designs on the catch efficiency of swimming crab Charybdis feriata fishery. Fish. Res. 2020, 232, 105730. [Google Scholar] [CrossRef]
  23. Meintzer, P.; Walsh, P.; Favaro, B. Comparing catch efficiency of five models of pot for use in a Newfoundland and Labrador cod fishery. PLoS ONE 2018, 13, e0199702. [Google Scholar] [CrossRef] [PubMed]
  24. Folkins, M.H. Using Underwater Video Observations to Improve Capture Efficiency of Fishing Gear. Master’s Thesis, Memorial University of Newfoundland, St. John’s, Canada, 2019. [Google Scholar]
  25. Bergshoeff, J.A.; McKenzie, C.H.; Favaro, B. Improving the efficiency of the Fukui trap as a capture tool for the invasive European green crab (Carcinus maenas) in Newfoundland, Canada. PeerJ 2019, 7, e6308. [Google Scholar] [CrossRef] [PubMed] [Green Version]
  26. Anders, N.; Fernö, A.; Humborstad, O.-B.; Løkkeborg, S.; Utne-Palm, A.C. Species specific behaviour and catchability of gadoid fish to floated and bottom set pots. ICES J. Mar. Sci. 2016, 74, 769–779. [Google Scholar] [CrossRef]
  27. Anders, N. The Effect of Pot Design on Behaviour and Catch Efficiency of Gadoids. Master’s Thesis, The University of Bergen, Bergen, Norway, 2015. [Google Scholar]
  28. R Development Core Team. R: A Language and Environment for Statistical Computing. Vienna, Austria. 2009. Available online: http://www.R-project.org (accessed on 8 December 2021).
  29. Harrison, X.A.; Donaldson, L.; Correa-Cano, M.E.; Evans, J.; Fisher, D.N.; Goodwin, C.E.D.; Robinson, B.S.; Hodgson, D.J.; Inger, R. A brief introduction to mixed effects modelling and multi-model inference in ecology. PeerJ 2018, 6, e4794. [Google Scholar] [CrossRef] [Green Version]
  30. Bates, D.; Maechler, M.; Bolker, B.; Walker, S. lme4: Linear Mixed-Effects Models Using Eigen and S4. R Package Version 1.1–7. 2014. Available online: http://CRAN.R-project.org/package=lme4 (accessed on 8 December 2021).
  31. Nakagawa, S.; Schielzeth, H. A general and simple method for obtaining R2 from generalized linear mixed-effects models. Methods Ecol. Evol. 2012, 4, 133–142. [Google Scholar] [CrossRef]
  32. Barton, K. Mu-MIn: Multi-Model Inference. R Package Version 0.12.2/r18. Available online: http://R-Forge.R-project.org/projects/mumin/ (accessed on 8 December 2021).
  33. Cheng, Z.; Winger, P.D.; Bayse, S.M.; Kebede, G.E.; DeLouche, H.; Einarsson, H.A.; Pol, M.V.; Kelly, D.; Walsh, S.J. Out with the Old and in with the New: T90 Codends Improve Size Selectivity in the Canadian Redfish (Sebastes Mentella) Trawl Fishery. Can. J. Fish. Aquat. Sci. 2020, 77, 1711–1720. [Google Scholar] [CrossRef]
  34. Wileman, D.A.; Council, I. Manual of Methods of Measuring the Selectivity of Towed Fishing Gears. ICES Coop. Res. Rep. 1996, 215, 1–216. [Google Scholar]
  35. Folkins, M.H.; Grant, S.M.; Walsh, P. A feasibility study to determine the use of baited pots in Greenland halibut (Reinhardtius hippoglossoides) fisheries, supported by the use of underwater video observations. PeerJ 2021, 9, e10536. [Google Scholar] [CrossRef]
  36. Araya-Schmidt, T.; Olsen, L.; Rindahl, L.; Larsen, R.B.; Winger, P.D. Alternative bait trials in the Barents Sea snow crab fishery. PeerJ 2019, 7, e6874. [Google Scholar] [CrossRef]
  37. Jørgensen, T.; Løkkeborg, S.; Furevik, D.; Humborstad, O.B.; De Carlo, F. Floated cod pots with one entrance reduce probability of escape and increase catch rates compared with pots with two entrances. Fish. Res. 2017, 187, 41–46. [Google Scholar] [CrossRef]
  38. García-de-Lomas, J.; Dana, E.D.; González, R. Traps and netting, better together than alone: An innovative approach to improve Procambarus Clarkii management. Knowl. Manag. Aquat. 2020, 421, 39. [Google Scholar] [CrossRef]
  39. Budnick, W.; Roth, B.; Nathan, L.; Thomas, S.; Smith, K.; Walker, S.; Herbst, S. Evaluation of Five Trap Designs for Removal of Invasive Red Swamp Crayfish (Procambarus Clarkii Girard, 1852) in Southern Michigan: Catch per Unit Effort, Body Size, and Sex Biases. Manag. Biol. Invasions 2022, 13, 369–390. [Google Scholar] [CrossRef]
  40. De Palma-Dow, A.; Curti, J.; Fergus, E. It’s a Trap! An Evaluation of Different Passive Trap Types to Effectively Catch and Control the Invasive Red Swamp Crayfish (Procambarus Clarkii) in Streams of the Santa Monica Mountains. Manag. Biol. Invasions 2020, 11, 44–62. [Google Scholar] [CrossRef] [Green Version]
  41. Figler, M.H.; Finkelstein, J.E.; Twum, M.; Peeke, H.V.S. Intruding male red swamp crayfish, Procambarus clarkii, immediately dominate members of established communities of smaller, mixed-sex conspecifics. Aggress. Behav. 1995, 21, 225–236. [Google Scholar] [CrossRef]
  42. Hedgärde, M.; Berg, C.W.; Kindt-Larsen, L.; Lunneryd, S.G.; Königson, S. Explaining the catch efficiency of different cod pots using underwater video to observe cod entry and exit behaviour. J. Ocean Technol. 2016, 11, 67–90. [Google Scholar]
Figure 1. A top-down view of an experimental seven-entrance trap. Black square around the center of the bottom panel is the position for setting a bait box.
Jmse 10 01708 g001
Figure 2. Boxplot of the mean carapace length (mm) of crayfish captured in six traps varying in number of entrances. Horizontal line within each box represents the mean. Lower and upper hinges of the boxes represent the first and third quartile, respectively. Lower and upper whiskers depict scores outside the interquartile range. Black dots correspond to the outliers.
Jmse 10 01708 g002
Figure 3. Number of crayfish captured using 6 different traps varying in entrance numbers. Horizontal line within each box represents the median. Lower and upper hinges of the boxes represent the first and third quartile, respectively. Lower and upper whiskers depict scores outside the interquartile range. Black dots correspond to the outliers.
Jmse 10 01708 g003
Figure 4. Catch per unit effort (g/trap) of crayfish in six different traps varying in the number of entrances. Horizontal line within each box represents the median. Lower and upper hinges of the boxes represent the first and third quartile, respectively. Lower and upper whiskers depict scores outside the interquartile range. Black dots correspond to the outliers.
Jmse 10 01708 g004
Table 1. Summarized regression results for the models presented in Equations (1)–(3). CPUEN represents catch per unit effort by counts. CPUEW is catch per unit effort by weight (g). CL represents carapace length of crayfish in mm.
Dependent
Variable
Marginal
Pseudo-R2
Conditional
Pseudo-R2
Random
Variables
Fixed
Variables
EstimateStd. Errorz/t Valuep-Value
CL0.0050.123DateIntercept39.2200.40696.534<0.001
En3−0.2600.287−0.9070.406
En40.1330.2950.4540.669
En5−0.4990.319−1.5660.178
En60.1040.2900.3590.734
En7−0.0680.303−0.2250.831
CPUEN0.0480.769DateIntercept2.8450.20314.014<0.001
En30.1970.1431.3780.168
En40.0820.1450.5650.572
En5−0.2000.151−1.3270.185
En60.2050.1431.4310.152
En7−0.0310.147−0.2160.829
CPUEW0.0570.752DateIntercept267.30053.7204.9760.004
En346.40038.9301.1920.287
En434.60038.9300.8890.415
En5−63.00038.930−1.6180.167
En660.50038.9301.5540.181
En7−9.30038.930−0.2390.821
Publisher’s Note: MDPI stays neutral with regard to jurisdictional claims in published maps and institutional affiliations.