Article

Anchor Chain Optimization Design of a Catenary Anchor Leg Mooring System Based on Adaptive Sampling

1
Faculty of Vehicle Engineering and Mechanics, Dalian University of Technology, Dalian 116023, China
2
Dalian Shipbuilding Industry Co., Ltd., Dalian 116005, China
*
Author to whom correspondence should be addressed.
J. Mar. Sci. Eng. 2022, 10(11), 1739; https://doi.org/10.3390/jmse10111739
Submission received: 12 October 2022 / Revised: 4 November 2022 / Accepted: 8 November 2022 / Published: 13 November 2022

Abstract

:
A catenary anchor leg mooring system (CALM) is one of the main kinds of offshore transport terminals. Its buoyancy is connected by multiple anchor chains fixed on the seabed. Because a large deformation characterizes the anchor chain, it is prone to fatigue failure under dynamic loads in marine environments. These factors lead to many challenges in the design optimization of anchor chains. This study aims to develop a rapid optimization design framework for a mooring anchor chain with cost minimization as the design objective. In this framework, an approximation model of the mooring analysis is built based on an adaptive sampling method, and a combination of a genetic algorithm and a sequential quadratic programming method is utilized to optimize the established approximation model. The results show that the framework significantly reduces the computation time, and the error of the final optimization result obtained by adaptive sampling is significantly reduced. We found that using a quadratic or elliptic function as an adaptive function is good enough to obtain the optimization result.

1. Introduction

Owing to the increasing global demand for offshore oil and gas, the development and research of marine equipment have become increasingly popular. A single-point mooring system is one of the main techniques used for offshore oil terminals. Unlike the traditional duck, the single-point mooring system employs “point” mooring system. Hence, the very large crude carrier (VLCC) can be moored to it and directly operated at sea. Currently, the catenary anchor leg mooring system (CALM) is the most widely used in single-point mooring systems.
Due to its low initial investment and high efficiency, many companies have competitively developed CALM. The design of the mooring configuration and analysis of the strength of anchor chains have always been the focus of research in CALM. The efficient design of the configuration of the mooring anchor chain and analysis of its dynamic response characteristics is key to the preliminary design of the CALM. In addition, the variety of anchor chain lengths and tension angle arrangements has increased the difficulty of the configuration design. To meet engineering requirements and specifications, engineers base the preliminary design of the CALM on previous engineering experience. Mooring anchor chain design involves many parameters and usually requires considerable computational time and cost; however, the final result is sometimes not ideal. It is not easy to quickly and effectively evaluate the rationality of design parameters. Therefore, a rapid optimization design framework for the CALM is essential.
Felix-Gonzalez et al. [1] established a fully symmetrical and bilaterally symmetric two-dimensional static equivalent mooring system model. The root mean square error of equivalent model displacement and root mean square error of numerical model displacement are taken as objective functions, and the genetic algorithm is used to optimize. Shafieefar et al. [2] proposed a program to optimize the mooring design of floating platforms to reduce the dynamic response of floating platforms. Aqdam et al. [3] established a radial neural network for the damage diagnosis of mooring lines, considering the uncertainty of the mooring line boundary of floating structures. Thomsen et al. [4] used an approximation model to determine the mooring parameters that affect the mooring cost and find a cheap and reliable mooring solution. Sun et al. [5] optimized the cable length and used the breakage strength of the anchor chains as a constraint condition to minimize the longitudinal and transverse values in each wave direction of floating production storage and offloading (FPSO) and obtained more reasonable design parameters. Yetkin et al. [6] used the simulation results of mooring tensions and tanker displacements for the four-point tanker-buoy mooring system to train the ANN structure and created an algorithm to obtain quick predictions. Pillai et al. [7] optimized a mooring system design using a random forest-based surrogate model-assisted multi-objective genetic algorithm. Bruno da Fonseca Monteiro et al. [8] used Particle Swarm to obtain a solution for the mooring system radius. Girón et al. [9] summarized the mooring design method and pointed out the optimization objectives of a mooring system. Li et al. [10] applied Kriging metamodels as surrogates for the responses of time-domain simulations and used a gradient-based search algorithm to find the optimal solutions by exploring the design space. Gumley et al. [11] used metocean and GPS data from an FPSO to train a model using Kriging and neural network methods, and the identified mooring system change was used to predict a mooring line failure. Christiansen N H et al. [12] raised a hybrid method for fatigue analysis to balance the accuracy and time consumption due to more sea states for floating offshore platforms anchored by mooring lines. Saad A M et al. [13] used neural networks to detect mooring line failure in near real-time based on measured motion to predict spread moored FSPO motion.
In a detailed mooring system analysis, many parameters must be obtained through experiments or finite element calculations, all of which require considerable computation cost and time. In optimizing the approximation model, this method can effectively reduce the number of sample points to obtain higher model accuracy, saving considerable time and cost. Sasena et al. [14] adopted a SuperEGO algorithm suitable for adaptive sampling to optimize the approximation model. Hao [15] developed a set of adaptive anchor box optimization algorithms to optimize the kriging model and iteratively solved the problems caused by a large range of design variables. Tian et al. [16] selected competitive sample points to optimize the approximation model based on specific criteria, thereby significantly improving the model calculation efficiency; however, the model accuracy slightly decreased. Hao et al. [15] reduced the design variable space by setting an adaptive function and improving optimization efficiency.
This study optimized platform mooring under the influence of environmental distribution forces and the tension and length of the mooring cables were optimized under the influence of the material and size of each mooring cable. To minimize the total sampling points, an approximation model is established to obtain a global solution roughly, and based on an adaptive sampling technique, a local solution is revised exactly. A combination of a genetic algorithm and a sequential quadratic programming method is utilized to optimize the approximation model to find a set of design parameters for the mooring anchor chains that maximize economic benefits under safety conditions.
The manuscript is structured as follows: Section 3 and Section 4 introduce the approximation model and optimization algorithm adopted in this study, Section 5 discusses the adaptive sampling method based on the approximation model, and Section 6 uses the above program framework to analyze specific examples and verify it with commercial software.

2. Problem Description

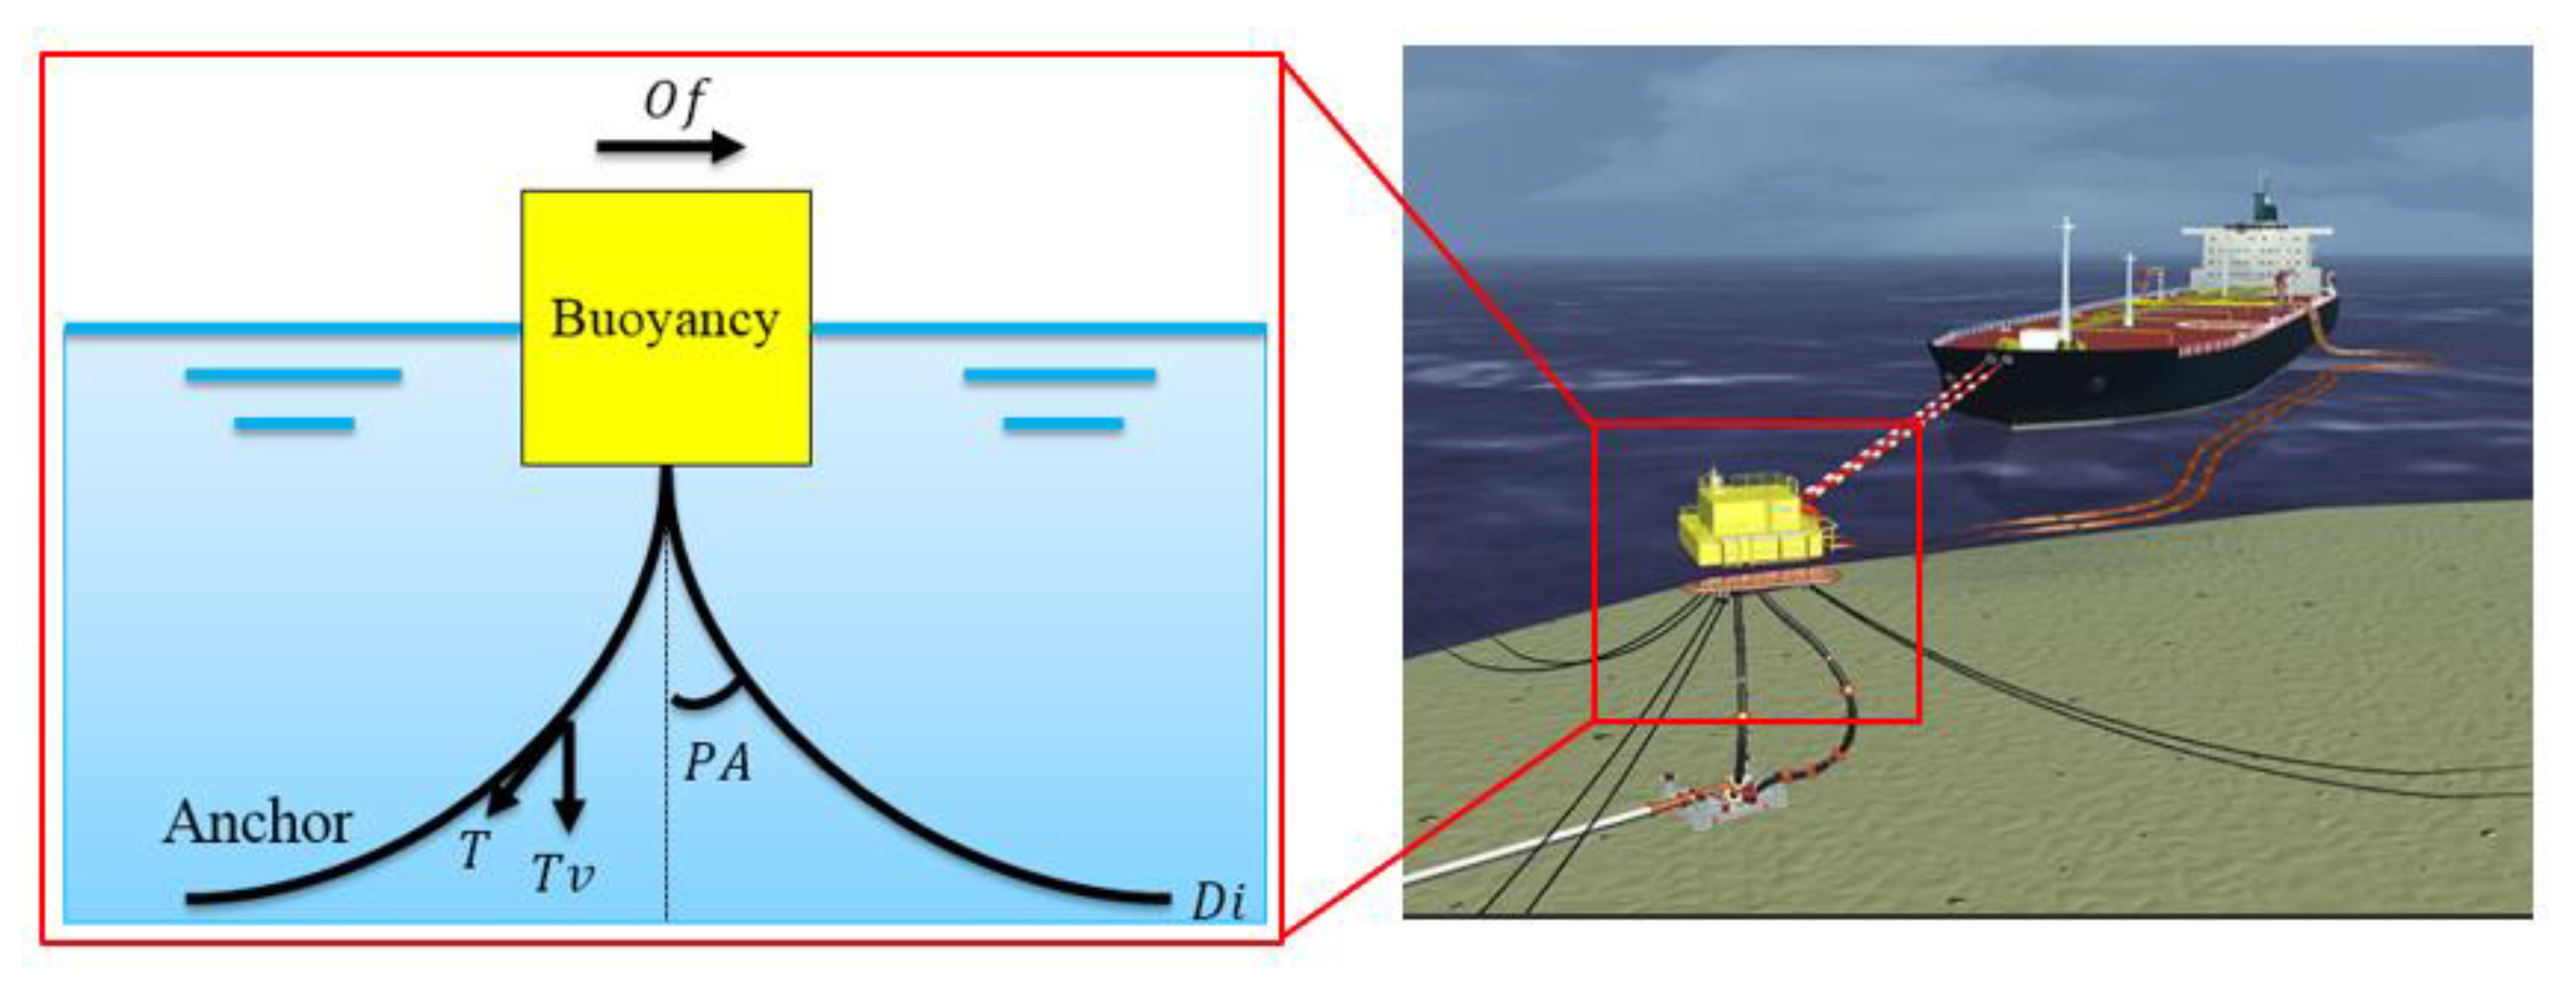
Figure 1 shows a schematic of the CALM, which consists of an upper buoyancy system and mooring chains. Under working conditions, the anchor chain is subjected to tensile forces, gravity, and buoyancy caused by the buoyancy system and seawater. A tanker is connected to the CALM buoy. The mooring ship in this study is a 300,000-ton large oil tanker with a scale of 320 m long, 60 m wide, and 30.5 m height. Considering that ballast draft and full load draft are typical loading conditions of mooring, CALM can replace the wharves to transfer crude oil from tanker to shore by pipelines. CALM has the advantage of less investment compared to wharves. However, it is complicated and tedious to choose a scheme with good mooring performance and economy, which brings challenges to mooring design. This study is to establish a program to quickly obtain an optimal mooring scheme to solve this problem.
To ensure the safe operation of the system, engineers must consider various conditions and limit the anchor chain pretension angle and buoyancy system offset within a certain range. The conditions contain environment—wind, current, and wave; tanker loading—full load and ballast or away from the buoy; and the mooring system—intact or one anchor line broken, involving many variables in mooring analysis, which will make the computation complex and time-consuming. Here, we give the optimization formula for the optimized anchor chain system in Equation (1). In the equations, the design objective is to minimize the cost   C o , the design variables are the anchor diameter   D i and pretension angle   P A , and the constraints are the buoyancy offset   O f , anchor chain tension safe factor   T (the ratio of maximum chain tension and actual tension), fatigue damage   D m , and vertical force   T v . The list of all parameters are shown in Table A2 of Appendix A.
The constraint conditions are further refined as follows. It can be seen that the derivation of each constraint almost depends on a large amount of numerical calculation work. Since the calculation of these parameters is not the focus of this paper, the paper lists the constraints for the main variables.
O b j e c t : min ( C o )
F u n c t i o n : C o = f ( O f , T , D m , D i , T v , P A )
D e s i g n   v a r i a b l e s { D i l o w e r D i D i b o u n d P A l o w e r P A P A b o u n d
s . t { O f = m a x ( O f f u l l , O f b a l l a s t , O f s u r ) 6 m T 1 = [ T ] / m a x ( O f f u l l | i n t a c t , O f b a l l a s t | i n t a c t , O f s u r | i n t a c t ) 3 T 2 = [ T ] / m a x ( O f f u l l | b r o k e n , O f b a l l a s t | b r o k e n , O f s u r | b r o k e n ) 3 D m = i = 1 i = n D m i 0.33 T v 105 t
Because the anchor chain is slim, it usually exhibits large deformations. The wind and wave loads in a marine environment are simultaneous random loads. All of these factors cause fatigue damage. Traditionally, engineering design relies on experience and experiments to obtain optimal variables. However, this work relies on sample point data calculated by AQWA and uses MATLAB and ISIGHT to independently develop optimization programs to achieve a rapid automatic design of the anchor chains. The workflow is shown in Figure 2.

3. Establishment of the Approximation Model

The essential feature of the approximation model is using the response values of the sample points in the numerical experiment to predict the response values of the unknown points in the design space. In other words, the sample data obtained from the experimental design were fitted to establish an approximate relationship between input and output parameters.

3.1. Design of Experiment

The experimental design is based on probability and mathematical statistics. Without prior knowledge, it studies how to efficiently and reasonably conduct experiments and effectively analyze and process the experimental design results. The number and quality of the experimental design samples directly affected the approximation model’s effectiveness for the real solution. If the number of samples is too small or not representative, it cannot reflect the mapping between the approximation model and the real solution. Too many samples cause overfitting, making it impossible to establish the correct mapping relationship.
In this study, the Latin hypercube sampling (LHS) method [17,18] was used to sample the design variables. This method can evenly distribute sample points into the design space and does not have overlapping sample points in small neighborhoods. The main advantage of the LHS is that the generated sample points represent all parts of the vector space, and knowing the problem’s dimensions is unnecessary.

3.2. Radial Basis Function (RBF)

At present, approximation models include the response surface method, Kriging method, and radial basis function method with a high nonlinear mapping capability. Because the optimization problem of mooring anchor chains involves relatively high nonlinearity, the radial basis function method (RBF) [19,20] is adopted in this study.
The RBF model uses the distance between the measured and sample points as the independent basis functions and is constructed using linear weighting. It can approximate continuous or discrete functions with arbitrary precision. The RBF model consists of three layers: the input, hidden, and output layers. Each node of the hidden layer uses a Gaussian function (Equation (2)) as the radial basis function; that is, the data transformation from the input layer to the hidden layer is nonlinear. After the radial basis functions are determined, the results of these functions are weighted and linearly summed to obtain the output value of the RBF neural network (Equation (3)), as shown in Figure 3.
h ( x ) = exp ( ( x c ) 2 r 2 )
f ( x ) = j = 1 m w j h j ( x )
Here, x represents the design variable, c represents the central point, r represents the distance between the sample and measured points, h j ( x ) represents the radial function, and w j represents the weight factor.

4. Optimization Algorithm

After the approximation model was established, a combination of a genetic algorithm and a sequential quadratic programming method was selected for optimization. In other words, the global optimization algorithm (GA) is first used to determine the global optimum, and after the preliminary solution is determined, the local quadratic programming method is used for a local optimization to find the final optimization value.

4.1. Genetic Algorithm

The genetic algorithm [21] is a computational model that simulates the natural and biological mechanisms of biological evolution [22,23]. Its main feature is that it directly operates on the structure, with no derivative and function continuity limitations. It has inherent hidden parallelism and a better global optimization ability. It mainly uses a probabilistic optimization method that can automatically obtain and guide the optimized search space without determining rules and adaptively adjusts the search direction.
The genetic algorithm selects sample points based on the fitness function and uses the genetic operators of natural genetics to perform crossover and mutation to generate new individuals that are more suitable for the environment, thereby determining the optimal solution. This process is illustrated in Figure 4.

4.2. Sequential Quadratic Programming

Sequential quadratic programming [24] is currently one of the most effective methods for solving constrained nonlinear optimization problems. It has quicker convergence, higher computing efficiency, and strong boundary search capabilities than other gradient-based optimization algorithms. These advantages have received extensive attention and applications. However, each step of the iterative process must solve one or more quadratic programming problems. Generally, it is difficult to use the sparseness and symmetry of the original problem when solving quadratic programming problems. As the scale of the optimization problem increases, the calculation workload and required storage quickly increase. Therefore, the current sequential quadratic programming method generally only applies to small- and medium-sized problems. In addition, because large quadratic programming problems are usually solved using iterative methods, they require higher accuracy and more time while being more unstable than other methods.
Mathematical programming problems with general nonlinear constraints are such that:
{ m i n   f ( x ) g ( x ) 0 h ( x ) = 0
where x   is the design variable, f ( x ) is the objective function, and g ( x ) and h ( x ) are the inequality and equality constraint functions, respectively.
The Taylor function was used to simplify the objective function of the nonlinear constraint at the iteration point to simplify the quadratic function, and the constraint function was reduced to a linear function to obtain the following quadratic programming problem:
{ m i n   f ( x ) = 1 2 [ X X k ] T 2 f ( X k ) [ X X k ] + f ( X k ) T [ X X k ] s . t   g ( X k ) T [ X X k ] + g ( X k ) 0 h ( X k ) T [ X X k ] + h ( X k ) = 0
This problem approximates the original constraint optimization problem, but its solution is not necessarily a feasible point of the original problem.
S = X X k
Turning the above quadratic programming problem into a question about   S   gives
m i n   f ( x ) = 1 2 S T 2 f ( X k ) S + f ( X k ) T S s . t       g ( X k ) T S + g ( X k ) 0 s . t       h ( X k ) T S + h ( X k ) = 0
Translating the above formula into the general form of the quadratic programming problem gives
{ m i n   1 2 S T H S + C T A S B A e q = B e q
By solving this quadratic programming problem, taking its optimal solution S as the next search direction S k   of the original problem, and performing a constrained one-dimensional search of the objective function of the original constraint problem in this direction, an approximate solution X k + 1   of the original constraint problem can be obtained. The optimal solution to the original problem can be obtained by repeating this process.

5. Adaptive Sampling

The adaptive experimental design obtains relevant information through early sampling to guide later sampling. This method can be used for approximation-model optimization. Because this study’s sample point acquisition must be obtained by AQWA calculation, the calculation time of each group of sample points is approximately 2 h. Therefore, we consider the adaptive function method proposed by Hao et al. [15] to reduce the design space and avoid spending much time updating the approximation model, as shown in Figure 5.
Δ = | X i o p t X i i n i | X i l i m X i i n i
In the formula, X i o p t   represents the first-step optimization value of the i -th variable, X i i n i represents the initial value of the i -th variable, and X i l i m represents the upper and lower limits of the i -th variable.
In the second optimization step, the sample point distribution can be determined using the function F ( ) . The sampling interval function F ( ) is used to describe the sampling interval of the design variable in the adaptation, see Figure 5. For the F ( ) function, the sampling interval of the variable is set to decrease from the center to the optimization value of the first step. Variables with optimization results close to the upper and lower limits in the first step are considered monotonic with the optimization goal and do not participate in sampling. Based on the above principles, the adaptive function F ( ) can be selected independently. When the form of F ( ) is determined, the sampling interval of the design variable can be expressed as [ ( max ( F ( ) ) , 1 ) , ( min ( + F ( ) ) , 1 ) ] .

6. Case Study

6.1. Mooring Chain Configuration Optimization Based on the Established Approximation Model

In some areas of China, the water depth is relatively shallow, and the docking of large ships, in this case, usually requires a new terminal, which is extremely expensive. Thus, a relatively low-cost single-point mooring method for oil and gas transportation is considered in this study. This section considers the single-point mooring system applied in the Bohai Sea as an example for verifying the proposed approximation model. The constraints are set by the API and ABS specifications [25,26], as shown in Equation (10). The value range of the anchor chain diameter for this project was 60,200, and the range of the pretension angle was from 10° to 80°. This study used the Latin hypercube method to take 50 sampling points for the diameter and tension angle, as shown in Figure 6. The sample point information for each variable after the AQWA calculation is shown in Table A1 of Appendix A. The anchor chain tension safe factor   T 1 is the ratio of maximum allowable chain tension and actual tension under operation conditions when the VLCC is connected to the CALM buoyancy, while T 2 is the ratio under the survival condition when there is the CALM buoyancy only without the VLCC.
s . t { O f 6 m T 1 , T 2 3 D m 0.33 T v 105 t
This study adopted the optimization framework shown in Figure 1 to analyze the sample data. In the genetic algorithm, the number of initialized populations was set to 100, the crossover probability of genetic factors was set to 0.8, and the probability of mutation was set to 0.1. The RBF approximation model established based on the sample data in Figure 6 is shown in Figure 7. It can be observed from the figure that the maximum cost occurs when the inner diameter of the anchor chain is maximized, and the tension angle is minimized. Because the cost is proportional to the mass of the anchor chain, an increase in the anchor chain’s inner diameter increases the mass of the anchor chain. When the anchor chain’s inner diameter is maximum, the cost increases with a decrease in the anchor chain’s tension angle. Additionally, the larger inner diameter of the anchor chain requires a larger pipeline tension, increasing pipeline quality and cost.
Simultaneously, the commercial software ISIGHT was used to verify the optimization framework proposed in this study. Table 1 shows the optimization results of the ISIGHT and this study. The table shows that the results obtained in this study are 3.2% smaller than those of the ISIGHT software optimization, indicating that the proposed program has slightly greater efficiency. To assess the accuracy of the optimized variables, we used AQWA to verify the study’s parameters. Figure 8 compares the results of the two optimization processes with those calculated using AQWA. The table shows that, except for fatigue damage   Dm , the calculation errors of the other optimization parameters and AQWA are all less than 2%. However, there was a large error between the fatigue damage Dm results optimized by the program proposed in this study and the calculated values of AQWA. The two optimized results were 71.88% and 92.22%, respectively. Further analysis showed that the fatigue strength of the anchor chain was affected by the uncertainty of the long-period dynamic load in the AQWA calculation. Therefore, the feedback of the sample data had some singularities, leading to errors in the fitting of the approximate model.

6.2. Adaptive Sampling Optimization

Figure 8 shows a large difference between the optimization results and AQWA calculations for the fatigue life Dm . This difference is owing to mainly the approximation model’s low accuracy. To solve the above problems, we perform a secondary optimization on the approximation model to obtain better results. First, we used Equation (14) to calculate the dimensionless coefficient of the design variables. Then, we set F ( ) to determine the adaptive sampling interval and used the LHS method for sampling. We used 20 samples, which required less time than 50 sample points. This study selects the primary, quadratic, and elliptic functions as adaptive functions to reduce the interval, as shown in Figure 9.
The adaptive sampling optimization of the approximation model is presented in Table 2, Table 3 and Table 4. From the data in the tables, the model’s accuracy after the second optimization is improved, and errors in the computation of fatigue life are reduced. The optimization time was significantly shortened due to the number of sampling points reduction. Compared with the optimization results of the three adaptive functions, the error of the fatigue damage calculated by the linear function is 9.37%, which is larger than those of the other two models. The fatigue damage calculated with AQWA employing an elliptic function was 0.34, which is outside the constraint range. From this perspective, this model is unsuitable for the calculation example selected in this study. The quadratic function is used for adaptive sampling, and not only are all variables controlled within the constraint range, but all errors are controlled within 5%. In summary, a better target optimization value is obtained under the constraint conditions when the quadratic function is selected for adaptive sampling.

7. Conclusions

In this paper, a fast optimization framework of the mooring anchor chain is established. The optimization framework is to use RBF to construct the approximate model and then use a genetic algorithm to carry out global optimization of the approximate model. In order to reduce the fatigue damage error, adaptive sampling is carried out on the basis of the global optimal solution, and the sequential quadratic programming algorithm is used to carry out local optimization. Compared with the results calculated by AQWA, all variables satisfy the constraint conditions, and more accurate optimization results are obtained. At the same time, the adaptive sampling method is added to the optimization program to reduce the calculation time and the number of sample points and improve the accuracy of the approximate model. By comparing different types of adaptive functions, the quadratic function is determined to be suitable for anchor chain optimization.

Author Contributions

Study design, data collection, literature search—Q.S., writing, data analysis, figures—W.L., data analysis—R.L., figures—D.P. and Q.G., literature search—Y.Z., study design—Q.Y. and W.Z. All authors have read and agreed to the published version of the manuscript.

Funding

This research was funded by National Natural Science Foundation of China: U1906233; Fundamental Research Funds for the Central Universities: DUT20ZD213, DUT20LAB308.

Institutional Review Board Statement

Not applicable.

Informed Consent Statement

Informed consent was obtained from all subjects involved in the study.

Data Availability Statement

Not applicable.

Conflicts of Interest

The authors declare no conflict of interest.

Appendix A

Table A1. List of all parameters with units.
SymbolUnit
C O (CNY)Yuan
O f (m)Buoyancy offset distance
D i (mm)Anchor diameter
PA (°)Pretension angle
Tv (N)Vertical force
TAnchor chain tension safe factor T (the ratio of maximum chain tension and actual tension)
DmFatigue damage factor
Table A2. List of the sample point information by AQWA.
Di (mm)PA (°)Tv (t)T1 (-)T2 (-)Of (m)Dm (-)Co (CNY)
177.1430245.149.62528.77491.6380.1701.516 × 107
77.1424.2962.962.76262.42363.10615.7992.876 × 106
122.8675.7144.624.45414.408713.2710.0647.295 × 106
91.4331.4367.743.46773.12983.7113.3864.040 × 106
171.4360113.358.74217.77717.2220.0101.420 × 107
20032.86271.0611.382710.47171.6160.0931.933 × 107
142.8672.8662.944.78905.795911.6790.0199.863 × 106
165.717088.267.80007.352710.1780.0071.327 × 107
168.5710270.922.97652.78010.2700.4641.373 × 107
117.1418.57180.885.00724.21101.1481.9846.632 × 106
14045.71104.206.68465.88184.9320.1229.472 × 106
128.5765.7158.415.09695.09699.7710.0447.989 × 106
131.4311.43270.953.33713.05690.4451.3748.348 × 106
65.7144.2924.581.59981.97057.31511.0552.087 × 106
71.4334.2938.092.07282.22335.1997.7502.466 × 106
191.4312.86270.953.58263.35930.2560.2951.771 × 107
12047.1474.924.89524.65305.7200.1576.959 × 106
111.4328.57109.075.03154.29812.6021.8226.001 × 106
105.7138.5772.424.14053.92984.5380.7495.401 × 106
125.7137.14105.115.87155.16223.7060.5327.637 × 106
134.2955.7177.225.68405.49337.1030.0438.715 × 106
188.5767.14118.989.99778.82218.7680.0041.718 × 107
1608069.135.92286.574814.1910.0091.237 × 107
88.5771.4325.262.50962.756312.8371.0833.791 × 106
10047.1452.573.58823.54896.3190.4104.833 × 106
151.4317.14270.965.49564.86910.6430.6191.108 × 107
102.8678.5729.902.86593.233715.0940.0555.113 × 106
97.1421.43110.723.99193.43421.9965.0074.560 × 106
8051.4330.742.26212.58977.9942.1333.093 × 106
62.8615.7164.792.29151.81122.26179.3891.910 × 106
185.7140202.4811.46669.23052.9740.1091.667 × 107
74.2964.2920.361.62492.249411.3744.6462.667 × 106
108.5768.5739.803.15713.808511.1970.1785.697 × 106
18050152.0110.68048.56474.8970.0431.566 × 107
85.7141.4344.612.76502.79185.8011.4913.550 × 106
154.2952.86106.947.59236.74006.0430.0341.150 × 107
162.8642.86148.459.12737.56403.8210.1361.282 × 107
197.1457.14155.7511.71849.46046.0920.0131.878 × 107
148.5762.8681.586.60736.37508.4840.0171.067 × 107
82.8614.29121.093.06392.52121.38415.4873.318 × 106
94.2961.4334.492.95213.21219.7100.5564.297 × 106
68.5774.2914.431.42831.924117.2945.9032.272 × 106
6054.2916.331.28191.75059.72428.0181.740 × 106
182.8677.1494.117.58358.329912.3840.0031.616 × 107
194.2922.86271.077.53996.83150.5950.1881.824 × 107
134.2925.71171.616.42875.69071.7490.7518.715 × 106
145.7135.71144.677.77936.46272.9680.3581.026 × 107
157.1427.14217.748.09737.27571.5480.3271.193 × 107
174.2920270.976.47225.99640.6050.3141.468 × 107
114.2958.5753.254.33034.31188.3060.1166.313 × 106

References

  1. Felix-Gonzalez, I.; Mercier, R.S. Optimized design of statically equivalent mooring systems. Ocean. Eng. 2016, 111, 384–397. [Google Scholar] [CrossRef]
  2. Shafieefar, M.; Rezvani, A. Mooring optimization of floating platforms using a genetic algorithm. Ocean. Eng. 2007, 34, 1413–1421. [Google Scholar] [CrossRef]
  3. Aqdam, H.R.; Ettefagh, M.M.; Hassannejad, R. Health monitoring of mooring lines in floating structures using artificial neural networks. Ocean. Eng. 2018, 164, 284–297. [Google Scholar] [CrossRef]
  4. Thomsen, J.B.; Ferri, F.; Kofoed, J.P.; Black, K. Cost optimization of mooring solutions for large floating wave energy converters. Energies 2018, 11, 159. [Google Scholar] [CrossRef] [Green Version]
  5. Sun, L.P.; Zhang, W.; Ai, S.M. Mooring length optimization based on neural network and genetic algorithm. Ship Eng. 2015, 37, 88–91. [Google Scholar]
  6. Yetkin, M.; Mentes, A. Optimization of spread mooring systems with Artificial Neural Networks. In Towards Green Marine Technology and Transport; CRC Press: Boca Raton, FL, USA, 2015; pp. 233–238. ISBN 978-1-138-02887-6. [Google Scholar]
  7. Pillai, A.C.; Thies, P.R.; Johanning, L. Mooring system design optimization using a surrogate assisted multi-objective genetic algorithm. Eng. Optim. 2019, 51, 1370–1392. [Google Scholar] [CrossRef] [Green Version]
  8. da Fonseca Monteiro, B.; Albrecht, C.H.; Jacob, B.P. Application of the Particle Swarm Optimization Method on the Optimization of Mooring Systems for Offshore Oil Exploitation. In Proceedings of the Second International Conference on Engineering Optimization, Lisbon, Portugal, 6–9 September 2010. [Google Scholar]
  9. Girón, A.R.C.; Corrêa, F.N.; Hernández, A.O.V.; Jacob, B.P. An integrated methodology for the design of mooring systems and risers. Mar. Struct. 2014, 39, 395–423. [Google Scholar] [CrossRef]
  10. Li, L.; Jiang, Z.; Ong, M.C.; Hu, W. Design optimization of mooring system: An application to a vessel-shaped offshore fish farm. Eng. Struct. 2019, 197, 109363. [Google Scholar] [CrossRef]
  11. Gumley, J.M.; Henry, M.J.; Potts, A.E. A novel method for predicting the motion of moored floating bodies. In Proceedings of the International Conference on Offshore Mechanics and Arctic Engineering, American Society of Mechanical Engineers, Busan, Korea, 19–24 June 2016. [Google Scholar]
  12. Christiansen, N.H.; Torbergsen Voie, P.E.; Høgsberg, J.; Sødahl, N. Efficient mooring line fatigue analysis using a hybrid method time domain simulation scheme. In Proceedings of the International Conference on Offshore Mechanics and Arctic Engineering, American Society of Mechanical Engineers, Nantes, France, 9–14 June 2013. [Google Scholar]
  13. Saad, A.M.; Schopp, F.; Barreira, R.A.; Santos, I.H.; Tannuri, E.A.; Gomi, E.S.; Costa, A.H.R. Using Neural Network Approaches to Detect Mooring Line Failure. IEEE Access 2021, 9, 27678–27695. [Google Scholar] [CrossRef]
  14. Sasena, M.J.; Parkinson, M.; Reed, M.P.; Papalambros, P.Y.; Goovaerts, P. Improving an ergonomics testing procedure via approximation-based adaptive experimental design. J. Mech. Des. 2005, 127, 1006–1013. [Google Scholar] [CrossRef] [Green Version]
  15. Hao, W.; Ying, Y.; Wei, Y.; Baohua, L. Adaptive approximation-based optimization of composite advanced grid-stiffened cylinder. Chin. J. Aeronaut. 2010, 23, 423–429. [Google Scholar] [CrossRef]
  16. Tian, K.; Wang, B.; Zhang, K.; Zhang, J.; Hao, P.; Wu, Y. Tailoring the optimal load-carrying efficiency of hierarchical stiffened shells by competitive sampling. Thin-Walled Struct. 2018, 133, 216–225. [Google Scholar] [CrossRef]
  17. Stein, M. Large sample properties of simulations using Latin hypercube sampling. Technometrics 1987, 29, 143–151. [Google Scholar] [CrossRef]
  18. McKay, M.D.; Beckman, R.J.; Conover, W.J. A comparison of three methods for selecting values of input variables in the analysis of output from a computer code. Technometrics 2000, 42, 55–61. [Google Scholar] [CrossRef]
  19. Hardy, R.L. Multiquadric equations of topography and other irregular surfaces. J. Geophys. Res. 1971, 76, 1905–1915. [Google Scholar] [CrossRef]
  20. Zhou, L.R.; Yan, G.R.; Ou, J.P. Response surface method based on radial basis functions for modeling large-scale structures in model updating. Comput. Aided Civ. Infrastruct. Eng. 2013, 28, 210–226. [Google Scholar] [CrossRef]
  21. Darwin, C. On the Origin of Species, 1859; Routledge: Oxfordshire, UK, 2004. [Google Scholar]
  22. Tanese, R. Distributed Genetic Algorithms; George Mason University: Fairfax, VI, USA, 1989; pp. 434–439. [Google Scholar]
  23. Mitchell, M. An Introduction to Genetic Algorithms; MIT Press: Cambridge, MA, USA, 1998. [Google Scholar]
  24. Chen, B.L. Optimization Theory and Algorithm; Tsinghua University: Beijing, China, 2005. [Google Scholar]
  25. API (American Petroleum Institute). Design and Analysis of Station Keeping Systems for Floating Structures; API: New York, NY, USA, 2005. [Google Scholar]
  26. ABS (American Bureau of Shipping). Rules for Building and Classing Single Point Moorings; American Bureau of Shipping: Spring, TX, USA, 2019; pp. 3–49. [Google Scholar]
Figure 1. Schematic diagram of the catenary anchor leg mooring system.
Jmse 10 01739 g001
Figure 2. Flowchart of mooring anchor chain optimization based on an approximation model.
Jmse 10 01739 g002
Figure 3. Schematic diagram of the radial basis function network.
Jmse 10 01739 g003
Figure 4. Schematic diagram of the genetic algorithm work-flowchart.
Jmse 10 01739 g004
Figure 5. Schematic diagram of the adaptive sampling process.
Jmse 10 01739 g005
Figure 6. Sampling point distribution of design variables.
Jmse 10 01739 g006
Figure 7. Surrogate Model of Anchor Chain Cost.
Jmse 10 01739 g007
Figure 8. Comparison of this study’s error with that of the AQWA calculation results.
Jmse 10 01739 g008
Figure 9. Adaptive function F ( ) and adaptive sampling interval.
Jmse 10 01739 g009
Table 1. Comparison of ISIGHT results and optimization results in this study.
This StudyISIGHTError
Co (CNY)4,112,3004,248,1593.2%
Table 2. Linear function adaptive sampling optimization results.
Method Considered in This StudyAQWAError
Di (mm)104.11104.11
PA (°)49.0149.01
Tv (t)55.4254.950.86%
Dm (-)0.320.299.37%
Of (m)6.216.514.60%
T 1 (-)3.00002.97110.96%
T 2 (-)3.23083.37734.34%
Table 3. Secondary function adaptive sampling optimization results.
Method Considered in This StudyAQWAError
Di (mm)104.69104.69
PA (°)46.1746.17
Tv (t)58.7059.290.99%
Dm (-)0.330.323.06%
Of (m)5.875.920.84%
T 1 (-)3.00003.06812.22%
T 2 (-)3.28033.30420.72%
Table 4. Elliptic function adaptive sampling optimization results.
Method Considered in This StudyAQWAError
Di (mm)104.64104.64
PA (°)46.3546.35
Tv (t)58.9959.040.85%
Dm (-)0.330.342.95%
Of (m)5.855.961.85%
T 1 (-)3.00003.06472.11%
T 2 (-)3.28163.30650.75%
Publisher’s Note: MDPI stays neutral with regard to jurisdictional claims in published maps and institutional affiliations.

