Article

Long-Term Spatiotemporal Changes in Ecosystem Services Caused by Coastal Wetland Type Transformation in China’s Hangzhou Bay

1
Ocean College, Zhejiang University, Zhoushan 316021, China
2
Hainan Institute, Zhejiang University, Sanya 572025, China
3
Key Laboratory of Ocean Space Resource Management Technology, MNR, Marine Academy of Zhejiang Province, Hangzhou 310012, China
*
Author to whom correspondence should be addressed.
J. Mar. Sci. Eng. 2022, 10(11), 1781; https://doi.org/10.3390/jmse10111781
Submission received: 16 September 2022 / Revised: 9 November 2022 / Accepted: 14 November 2022 / Published: 19 November 2022
(This article belongs to the Section Coastal Engineering)

Abstract

:
Coastal wetlands provide essential ecosystem services, while usually experiencing land transformation or degradation mainly due to intense anthropogenic activities and climate changes. Understanding the changes in wetlands ecosystem services is essential to decision makers for generating sound coastal planning. Hangzhou Bay is rich in wetland resources, and the urbanization of Hangzhou Bay in the past three decades has caused fundamental changes in the wetlands in the region. Based on the remote sensing images of the Hangzhou Bay area from 1990 to 2020, this paper analyzes the land use situation of the Hangzhou Bay area in seven periods. This paper calculates the area transfer matrix of various types of wetlands. It uses the InVEST model to evaluate the changes in the function of wetland ecosystem services in the Hangzhou Bay area. Hangzhou Bay wetlands show a trend of transferring natural wetlands to artificial and non-wetlands from 1990 to 2020. Carbon stocks fell by 14.24%. The annual water production decreased by 33.93% and then returned to the original level. The area of habitat degradation increased by 79.94%. The main influencing factors are paddy field degradation, increase in non-wetland area, and decrease in sea area. This paper proposes that the development and construction of farmland in the “red line” area and established wetland reserves are prohibited, and to strengthen the training of wetland management personnel, establish a sound decision-making consultation mechanism, and increase the scientific research expenditure on wetlands in the region.

1. Introduction

Ecosystem services are the natural environmental conditions created by ecosystems and the utility required for human survival from them. They are all the benefits that humans obtain directly or indirectly from ecosystems, including both tangible services (such as food production) and intangible services (such as aesthetic or cultural values) [1]. A coastal wetland is the transition zone between the continent and the inland sea. It contains organisms, water cycles, soils that are rare in terrestrial ecosystems, and some rare resources, such as minerals. It has many ecosystem services that inland wetlands do not have, such as protecting coastal zones and reducing the impact of marine disasters [2]. It accounts for only about 15% of the global area of natural wetlands. Still, it accounts for 43.1% of the total monetary value of global ecosystem services for all natural wetland categories (USD 20.4 trillion per year) [3].
The common methods to study ecosystem services include ecosystem service mapping and scenario simulation. Ecosystem service mapping is a method for spatially mapping ecosystem services and calculating the amount of each service through computational geometry and spatial extraction on a GIS platform. It is commonly used in land use/land cover mapping studies. The advantages of this method are high availability, strong practicability, purposefulness, and clear geographic information. The scenario simulation simulates subsequent land use/land cover scenarios by setting up different policy “red line” scenarios and evaluating ecosystem services on this basis. Among them, CLUE-S, meta-automata, multi-intelligent bodies, and dynamic simulation of land systems (DLS) are common scenario simulation methods. Among them, the Integrated Valuation of Ecosystem Services and Tradeoffs (InVEST) model from Stanford University, The Nature Conservancy (TNC), and the World Wide Fund for Nature (WWF) have received increasing attention and application in recent research. The InVEST model can evaluate most ecosystem services (including supply services, reconciliation services, cultural services, and support services) and predict the subsequent changes of various ecosystem services in different settings.
The Hangzhou Bay wetlands are located on the north–south divide of China’s coastal wetlands. Hangzhou Bay coastal mudflats are one of the eight saline wetlands in China [4], and an essential regional ecological security barrier around the Hangzhou Bay area. Wetlands offer ecosystem services to the Hangzhou Bay area and provide many land resources for the development of coastal cities in Zhejiang. During urbanization and urban expansion in the past 30 years, land use/cover in Hangzhou Bay has changed dramatically. The change in land-use types will inevitably affect the original ecosystem services. Therefore, it is significant to explore the impacts of land-use change on wetland ecosystem services in the Hangzhou Bay area.
For this paper, we chose five phases of Landsat 4–5 TM remote sensing images of Hangzhou Bay in 1990, 1995, 2000, 2005, and 2010, and two phases of Landsat 8 OLl_TIRS remote sensing images in 2015 and 2020. These were used as data sources. In this paper, we used ArcGIS 10.2 for human–machine interactive interpretation mainly and visual interpretation to produce seven stages of land use/land cover maps. We used Excel to create an area transfer matrix of land-use types between each five years to analyze the stage-specific characteristics of land-use change. We used the modules in the InVEST 3.10.1 model to assess the carbon storage, water production, and habitat quality in the Hangzhou Bay from 1990 to 2020, to analyze the characteristics of changes in the above services with land-use types. The purpose of our research is to provide a theoretical reference for future policy making in the study area and provide examples and a basis for other coastal wetland ecological service analysis.

2. Materials and Methods

2.1. Study Area

We take Hangzhou Bay as the study area, which is located in the southern part of the Yangtze River estuary and the eastern part of Zhejiang Province, with latitude and longitude information from 29.98° N to 30.74° N and from 120.63° E to 121.63° E. (Figure 1) The study area is in the shape of a trumpet. The mouth of the bay is connected with the East China Sea, and the top of the bay is connected with the mouth of the Qiantang River [5]. Hangzhou Bay is low and flat, with many rivers, lakes, vast wetlands, and abundant mudflat resources. The water depth in the bay is about 10 m, and there are more sediments. The study area is in the subtropical monsoon zone and belongs to the subtropical blast climate. Typhoons and other meteorological disasters are relatively frequent and have severe impacts [6]. It has many plains and sufficient precipitation, so the plant species are diverse, and the main types are beach sand vegetation, meadow, hilltop peat bog, evergreen coniferous forest, et al. [7]. The study area has a land area of 45,400 km2, accounting for 44% of the area of Zhejiang Province, and is located in the center of Hangzhou, Ningbo, and Shanghai, which has a unique location advantage [8]. As of 2013, the total population of the Hangzhou Bay area is 26,651,800, the total economic volume is CNY 25,321,134 billion, and the urbanization rate has reached 64% [9].

2.2. Data Source and Processing

The data required for the study includes Landsat TM/OLl remote sensing image data from 1990 to 2020 were downloaded from the Chinese Academy of Sciences Geospatial Data Cloud (https://www.gscloud.cn/, accessed on 3 April 2022) with a spatial resolution of 30 m; annual precipitation data were downloaded from the Geographic Remote Sensing Ecology Network (http://www.gisrs.cn, accessed on 23 April 2022). The evapotranspiration data were downloaded from a global potential evapotranspiration map (https://cgiarcsi.community/data/global-aridity-and-pet-database/, accessed on 23 April 2022) provided by CGIAR based on WorldClim climate data. The root restriction layer depth data and plant available water content data were downloaded from the global soil data in the Harmonized World Soil Database (https://webarchive.iasa, accessed on 23 April 2022) constructed by the Food and Agriculture Organization of the United Nations (FAO) and the International Institute for Applied Systems (IIASA), https://webarchive.iiasa.ac.at/Research/LUC/External-World-soil-database/HTML/, accessed on 23 April 2022) with a spatial resolution of 1 km; sub-basin data were downloaded from the DEM-extracted Chinese watershed and river network dataset provided by the Institute of Geography, Chinese Academy of Sciences (https://www.resdc.cn/data.aspx?DATAID=226, accessed on 28 April 2022); the road and highway data were downloaded from the National Geographic Information Resource Catalogue Service (http://www.webmap.cn/main.do?method=index, accessed on 28 April 2022).
With reference to the LUCC National Land Use Classification System [10] and the classification of wetland types from previous studies [11,12] conducted in the region, the images were classified into seven categories: sea area, silty beaches, river, lakes, paddy field, reservoir ponds, and non-wetland. (Table 1).
Land use/cover maps of Hangzhou Bay wetlands were obtained for seven periods: 1990, 1995, 2000, 2005, 2010, and 2020. These seven maps were calibrated in ArcGIS 10.2 by the confusion matrix method, using Google Earth images of the same period as the real images. The Kappa coefficients of all classification results were above 0.6, and the classification accuracy was above 70%, which meets the requirements of the follow-up study. This paper also compares the results of other papers on land-use classification of Landsat images in the study area, which are more accurate than using Google Images [11,12].

2.3. Methods

2.3.1. Land-Use Change

This paper uses tools such as cross, fusion, and computational geometry in ArcGIS 10.2 to count the area of each wetland type for each year from 1990 to 2020, and Excel to produce a land use/cover area transfer matrix between each wetland type between each five years.

2.3.2. Carbon Storage

This study uses the carbon storage module of the InVEST model to assess the carbon storage services of the Hangzhou Bay wetlands from 1990 to 2020. The model uses land use/cover maps and four carbon pools (aboveground carbon content, belowground carbon content, soil organic matter, and dead organic matter) to estimate the amount of carbon stored in the current land use/cover maps. The model maps the study results onto the carbon storage density of the land use/cover map and aggregates the output of the total carbon storage in the study area. The carbon storage calculation principle is expressed in the following equation.
C t o t a l = C a b o v e + C b e l o w + C s o i l + C d e a d
where, Ctotal is the total carbon storage, Cabove is the aboveground carbon content, Cbelow is the underground carbon content, Csoil is the soil organic matter, and Cdead is the dead organic matter.

2.3.3. Annual Water Output

This study uses the annual water yield module of the InVEST model to assess the water yield service of the Hangzhou Bay wetlands from 1990 to 2020. The module uses a simplified water balance approach based on Budyko curves, and average annual precipitation runs to estimate water production in the current land use/cover map. The Budyko framework has been successfully applied to interpret and predict changes in the terrestrial hydrological cycle [13]. The equation for annual water yield for each raster is:
Y x = 1 A E T x P x · P x
where, Y(x) is the annual water yield of grid x, AET(x) is the average yearly evapotranspiration of grid x, and P(x) is the average yearly precipitation on grid x.

2.4. Habitat Quality

This study uses the habitat quality module of the InVEST model to assess the ecosystem services of the Hangzhou Bay wetlands from 1990 to 2020. The model uses a utility function of three factors to assess habitat quality in the current land use/cover map: the relative impact of threats; the distance from the habitat to the threat source and the way the threat decays; and the relative sensitivity of the habitat type to each type of threat source. The equation for habitat quality is:
Q x j = H j 1 D x j z D x j z + k z
where, Hj is the habitat suitability of habitat type j, z is a built-in parameter of the model taking a value of 2.5, and k is a half-saturation parameter with a default value of 0.5, which needs to be run once first and set to half of the degradation level Dxj.

3. Results

3.1. Land-Use/Cover Change

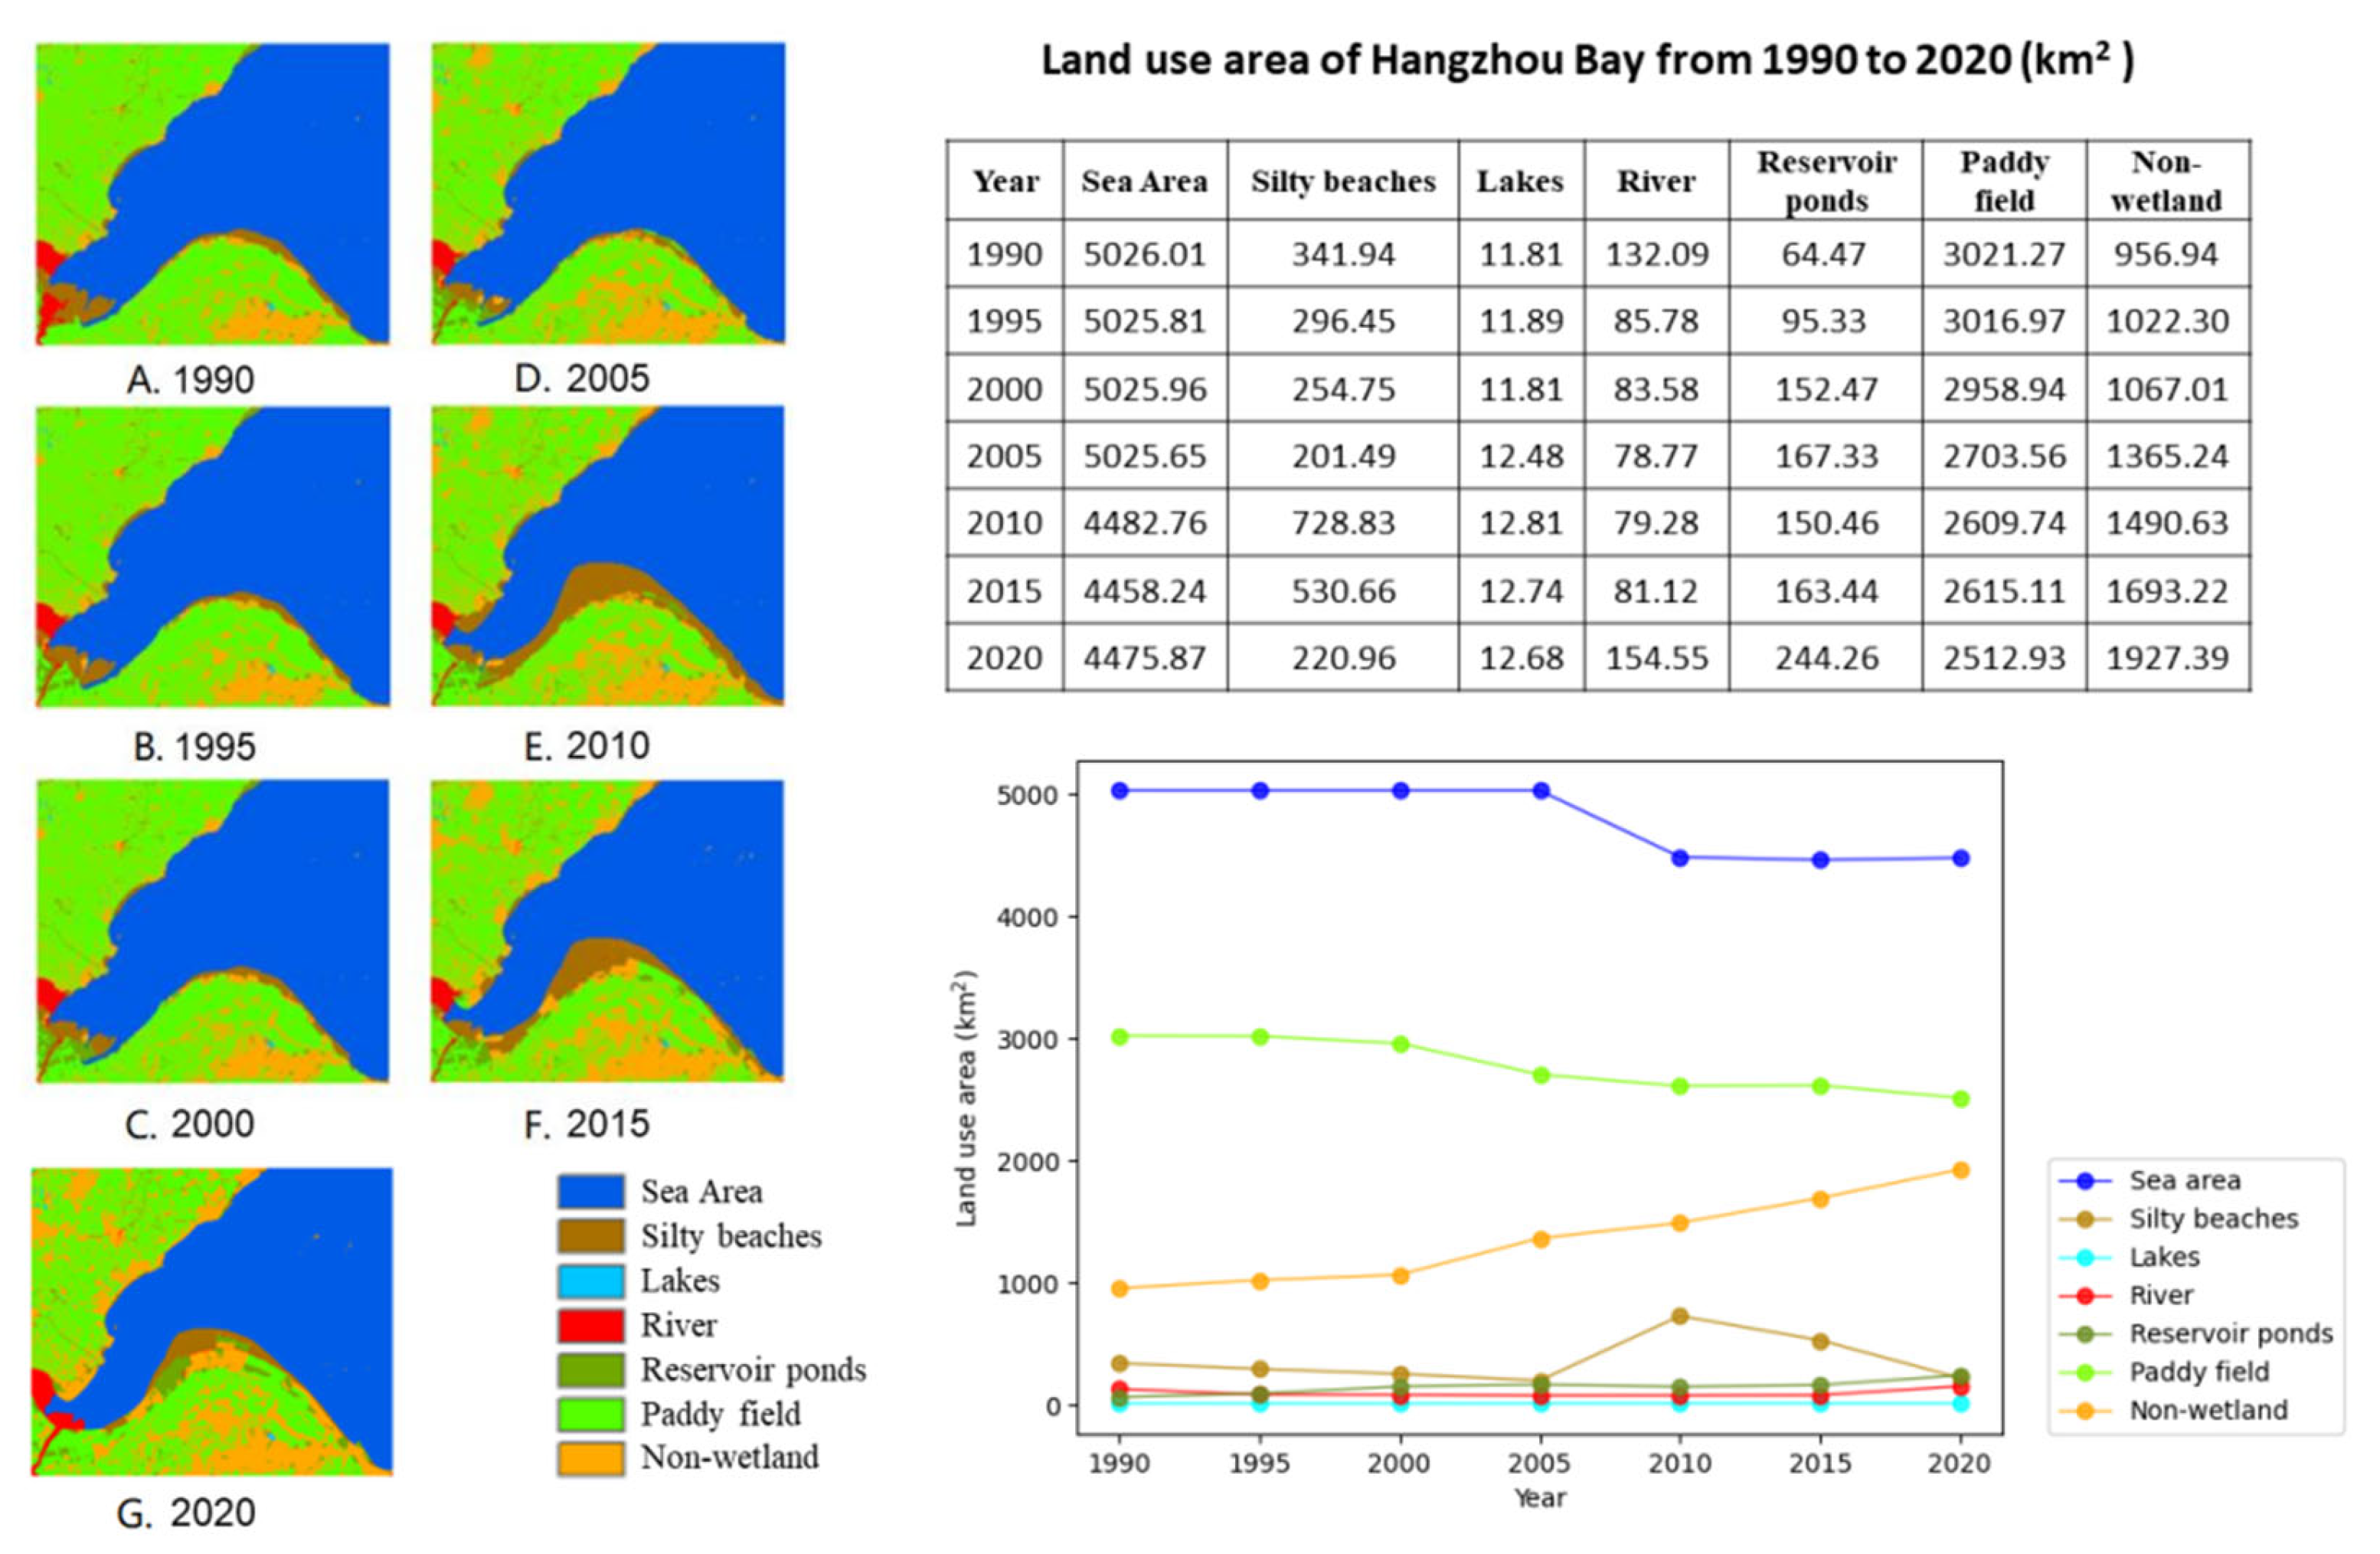
The area of wetlands in the Hangzhou Bay area was larger than the area of non-wetlands before 1990. The area of natural wetlands is larger than that of artificial wetlands. Of the wetland types, sea areas are the largest and paddy fields the second largest. At this time, the right side of the Cao’e River produced some silted land, but it was not yet available. The southern shore of Hangzhou Bay had not yet formed siltation and the opposite bank of the Cao’e River had not yet formed a fixed river bank. The southern shore of Hangzhou Bay subsequently underwent a process of conversion from silty beaches to other land types due to sea enclosures and coastal reclamation. The area of the sea was thus reduced. With the process of urbanization, the non-wetland areas, where several cities are located, expanded and the total area of reservoirs and ponds continued to increase. The decline in water areas around the cities accelerated in the early stages of urbanization and gradually slowed down in the later stages.
From 1990 to 2020, the area of water and paddy fields in Hangzhou Bay shrunk. The sea area decreased by 10.9% due to land reclamation rather than natural degradation, and the area of paddy fields decreased by 16.8%. Reservoirs, ponds, and non-wetland areas increased. The non-wetland area increased by 101.4%, and the reservoir pond increased by 278.9%. The type of silt beach is unstable, and the area fluctuates to a certain extent. In 2010, the area was the largest, but then it changed to other land-use types, and there was no stable increase or decrease trend. The types of rivers and lakes are relatively stable types, with small areas and small fluctuations in area. (Figure 2).

3.2. Changes in Transfer between Wetland Types

The area transfer matrix is often used to show the process of interconversion of different land-use types over a period of time. The figure below shows the main processes of wetland type transfer in Hangzhou Bay over a 30-year period (Figure 3). The thickness of the arrows represents the size of the transferred area, with processes where the transferred area is greater than 100 km2 marked by numbers. The largest transfer area was from agricultural land to non-wetland, followed by the transfer area from sea to silty beaches. There is area transfer between wetland types, but the area transferred from lakes and rivers to the rest of the wetland types is too small, so there are no arrows in the figure to indicate their transfer process.
There have been several drastic changes in the area in the past 30 years. The largest conversion of paddy field to non-wetland occurred between 2000 and 2005, covering an area of 323.52 km2. The largest sea area conversion to silty beaches occurred from 2005 to 2010, with an area of 543.01 km2. From 2010 to 2020, a large number of silty beaches were converted to other land types (Table 2).

3.3. Changes in Carbon Storage

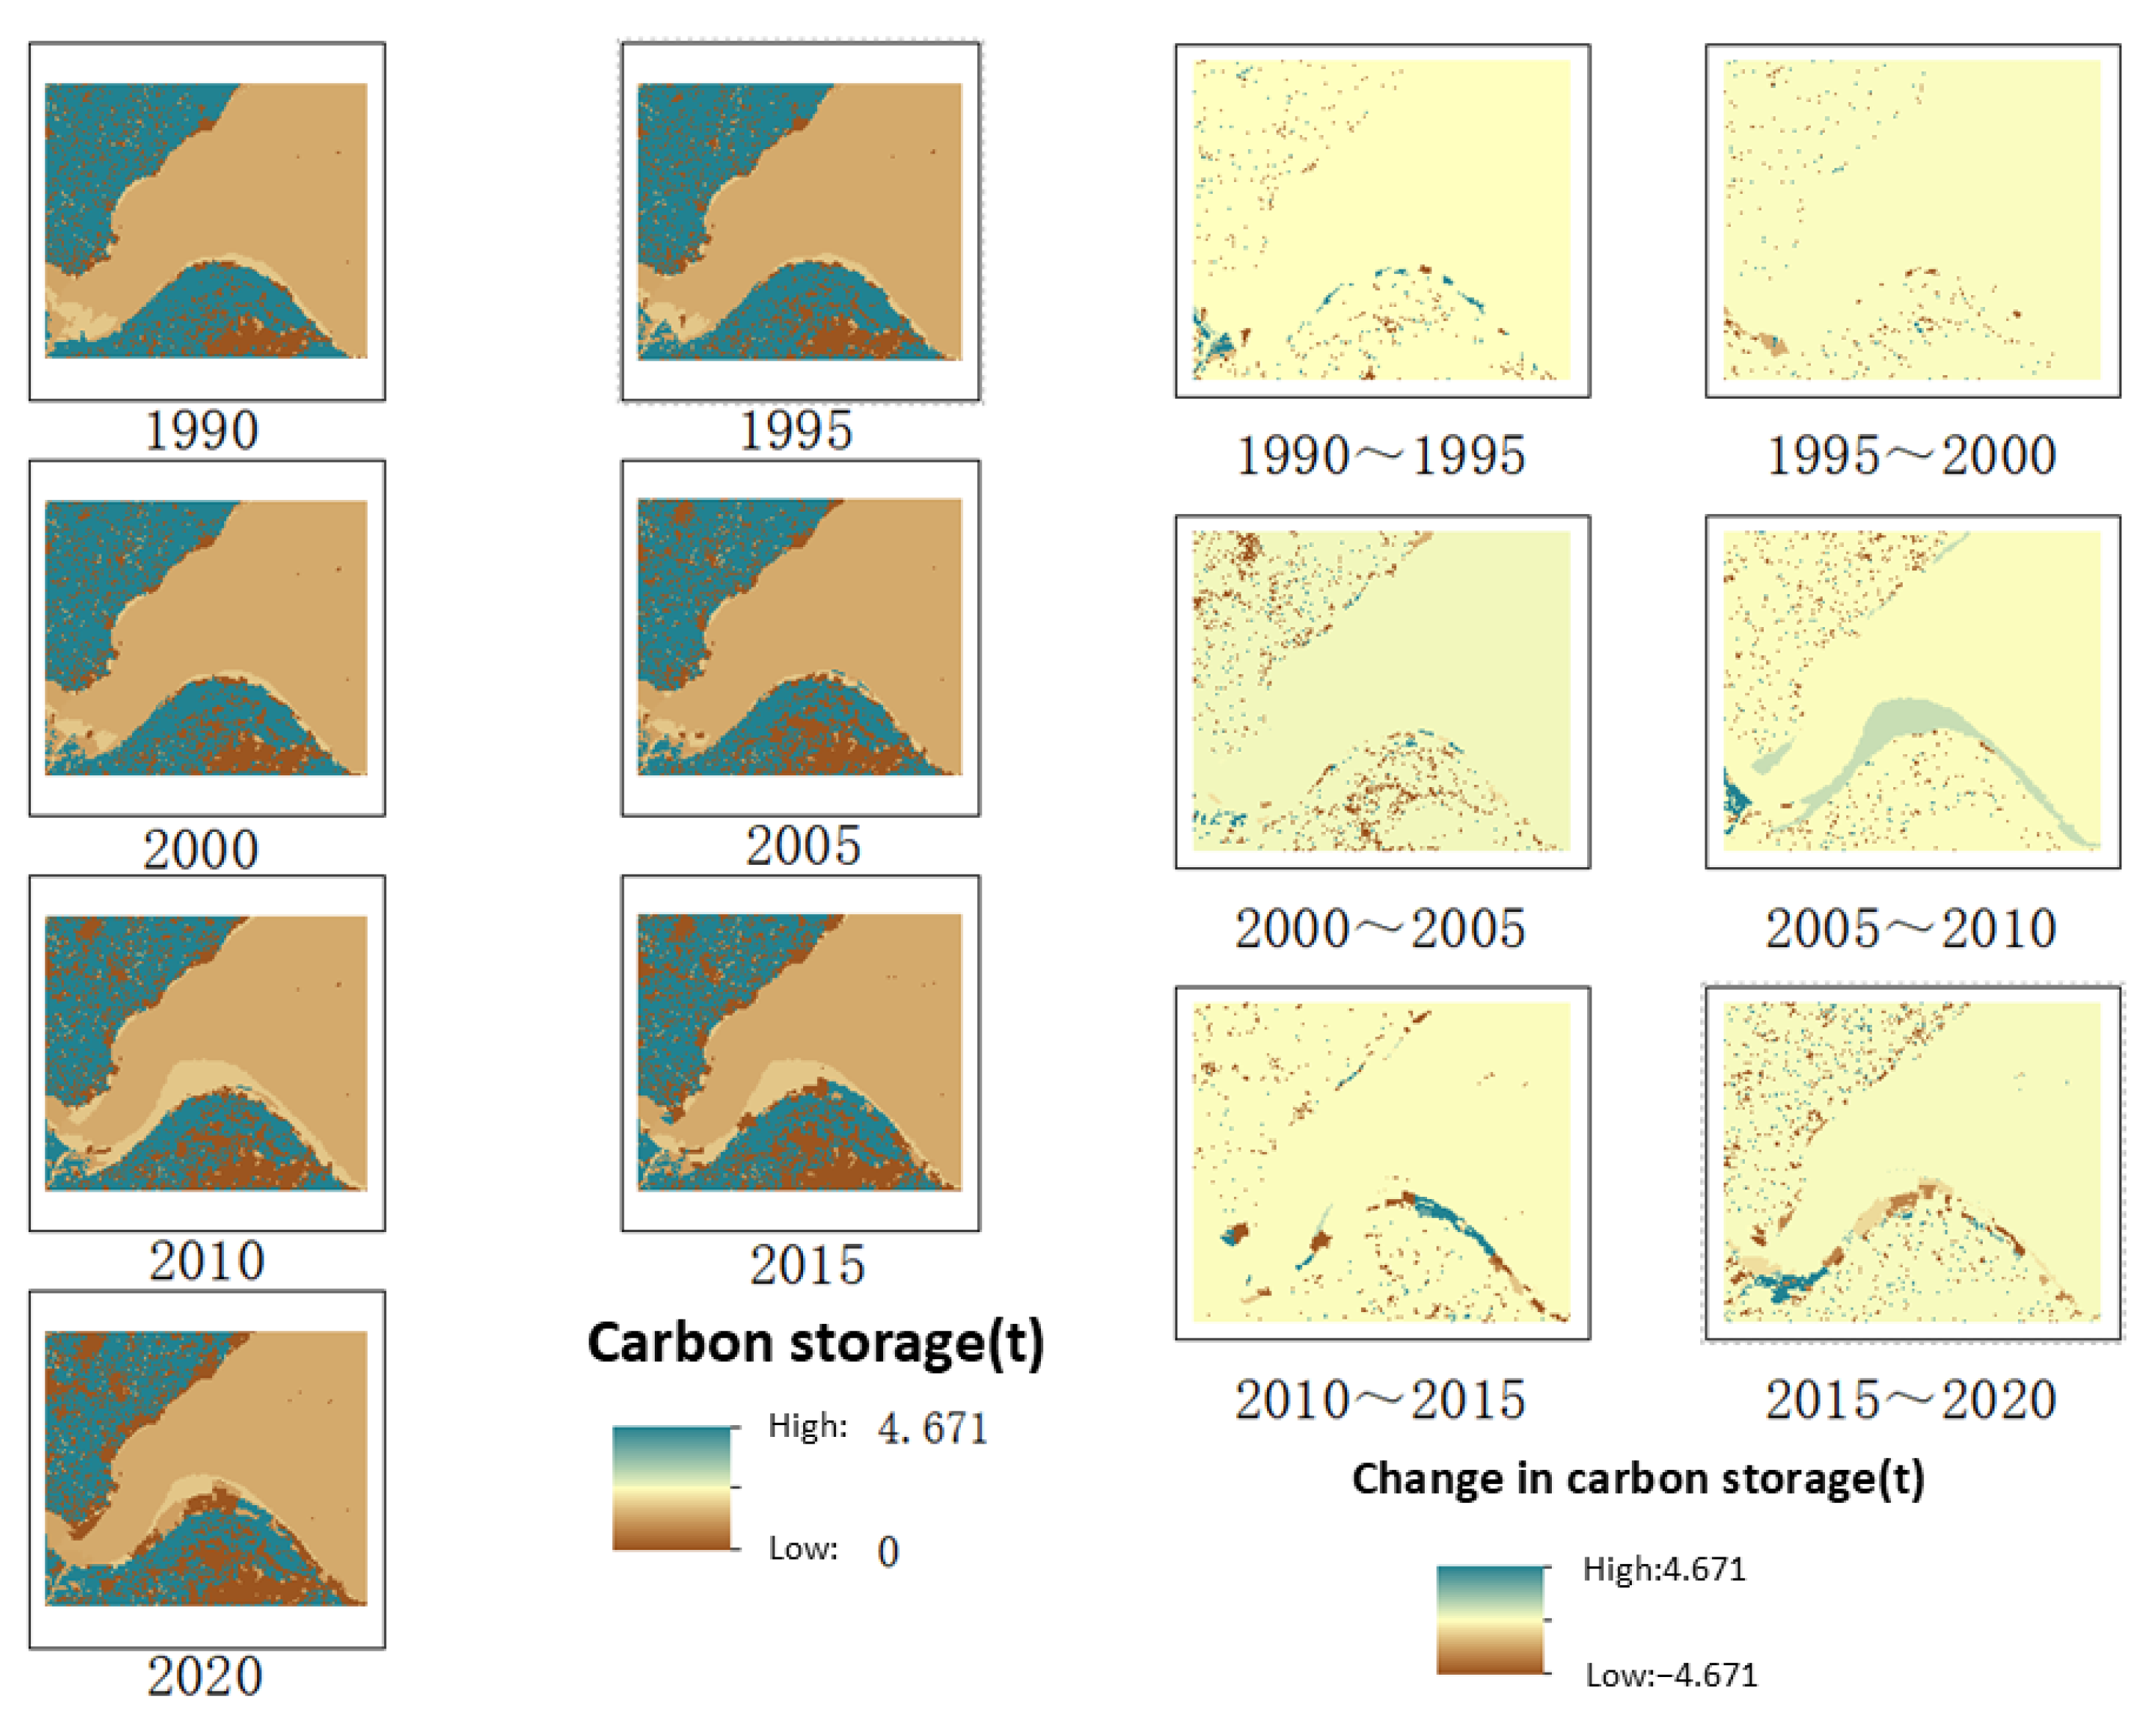
Between 1990 and 2020, the carbon stocks in Hangzhou Bay showed a general decreasing trend. The overall decrease in carbon storage was 3,359,868.29 t, which is approximately 14.24% of the carbon storage in 1990, a relatively serious decrease. The largest decline was between 2000 and 2005, with a decrease of −1409415.84 t, or −6.09%.
Wetlands have a strong carbon storage capacity relative to other terrestrial ecosystems [14]. Among the wetland systems in Hangzhou Bay, the paddy landscapes have the most vital carbon storage capacity (Figure 4, left), and carbon storage in paddy landscapes is also the central part of the total carbon storage in the Hangzhou Bay wetlands, accounting for about 60% (Table 3). The rest of the wetland types constitute 10% of the total carbon storage in the Hangzhou Bay wetlands. From this, we conclude that paddy fields play a significant role in the ecological services of carbon storage in the Hangzhou Bay.
The series of diagrams on the right-hand side show the distribution of carbon stock changes over each five-year period. The blue areas imply an increase in carbon stocks while the orange areas imply a decrease (Figure 4, right). In the former period, a considerable part of the mountainous area on the south bank and the flat terrain on the north bank allowed extensive cultivation of paddy fields. In the later period, the paddy fields around urban sites on both the north and south shores degraded one after another, which was the main factor for the decline of carbon storage on both the north and south shores. On the south coast, due to land reclamation and siltation, the sea area was transformed into new beaches and then into usable land, resulting in the change of the sea area with weak carbon sequestration capacity into other land types with stronger carbon sequestration capacity. It has largely slowed down the declining trend of carbon storage on the south coast. On the other hand, there is no new land use type with high carbon sequestration capacity on the north coast, and the expansion of urban areas leads to the reduction of surrounding wetlands, so the carbon storage on the north coast decreases more rapidly.

3.4. Changes in Annual Water Yield

The annual water production in the Hangzhou Bay from 1990 to 2020 shows a fluctuating trend. The maximum value arose in 2020 with a total of 8.021 billion m3, and the minimum value was in 2005 with a total of 5.203 billion m3 (Figure 5).
The water production capacity of the various wetland types in Hangzhou Bay is not very much. Among them, silts, reservoirs, and ponds have a strong water production capacity, while paddy fields have the weakest water production capacity, which is about two-thirds of the remaining wetland types (Figure 5). It can be concluded that natural wetland types dominate the water-producing ecological services of the Hangzhou Bay wetlands. Changes in land-use types near the northern inlet, around rivers on the southern shore and along the shoreline edge, have seen a decrease in some wetland types with high water yield. In addition, the total area of water-producing wetlands is decreasing in size. Although the overall water production has not decreased, the ecological service production of water production in these areas is not promising.
The results above suggest that there appears to be no linear relationship, or even a correlation, between water yield and the change in area of wetlands. The reason for this uncanny phenomenon is that water yield is a convolution of two factors, land type and precipitation, and it is inappropriate to consider only isolated effects of either climate or land use [15]. There is no doubt that wetlands have a powerful water storage function. It can be assumed that the early downward trend in water yield is related to the reduction in wetland area due to urbanization. In some years, however, rare increases in precipitation during the year can make water yield change ‘unusually’.
The net annual water yield is the difference between the precipitation that falls in that watershed and total evapotranspiration, assuming that there is no net storage in vegetation or soils over the course of a year [16]. The global map of potential evapotranspiration provided by CGIAR is also based on this definition, so the map does not include large sections of the sea. This is also the explanation for the fact that land reclamation increases water production, essentially increasing the size of the watershed in the area.

3.5. Changes in Habitat Quality

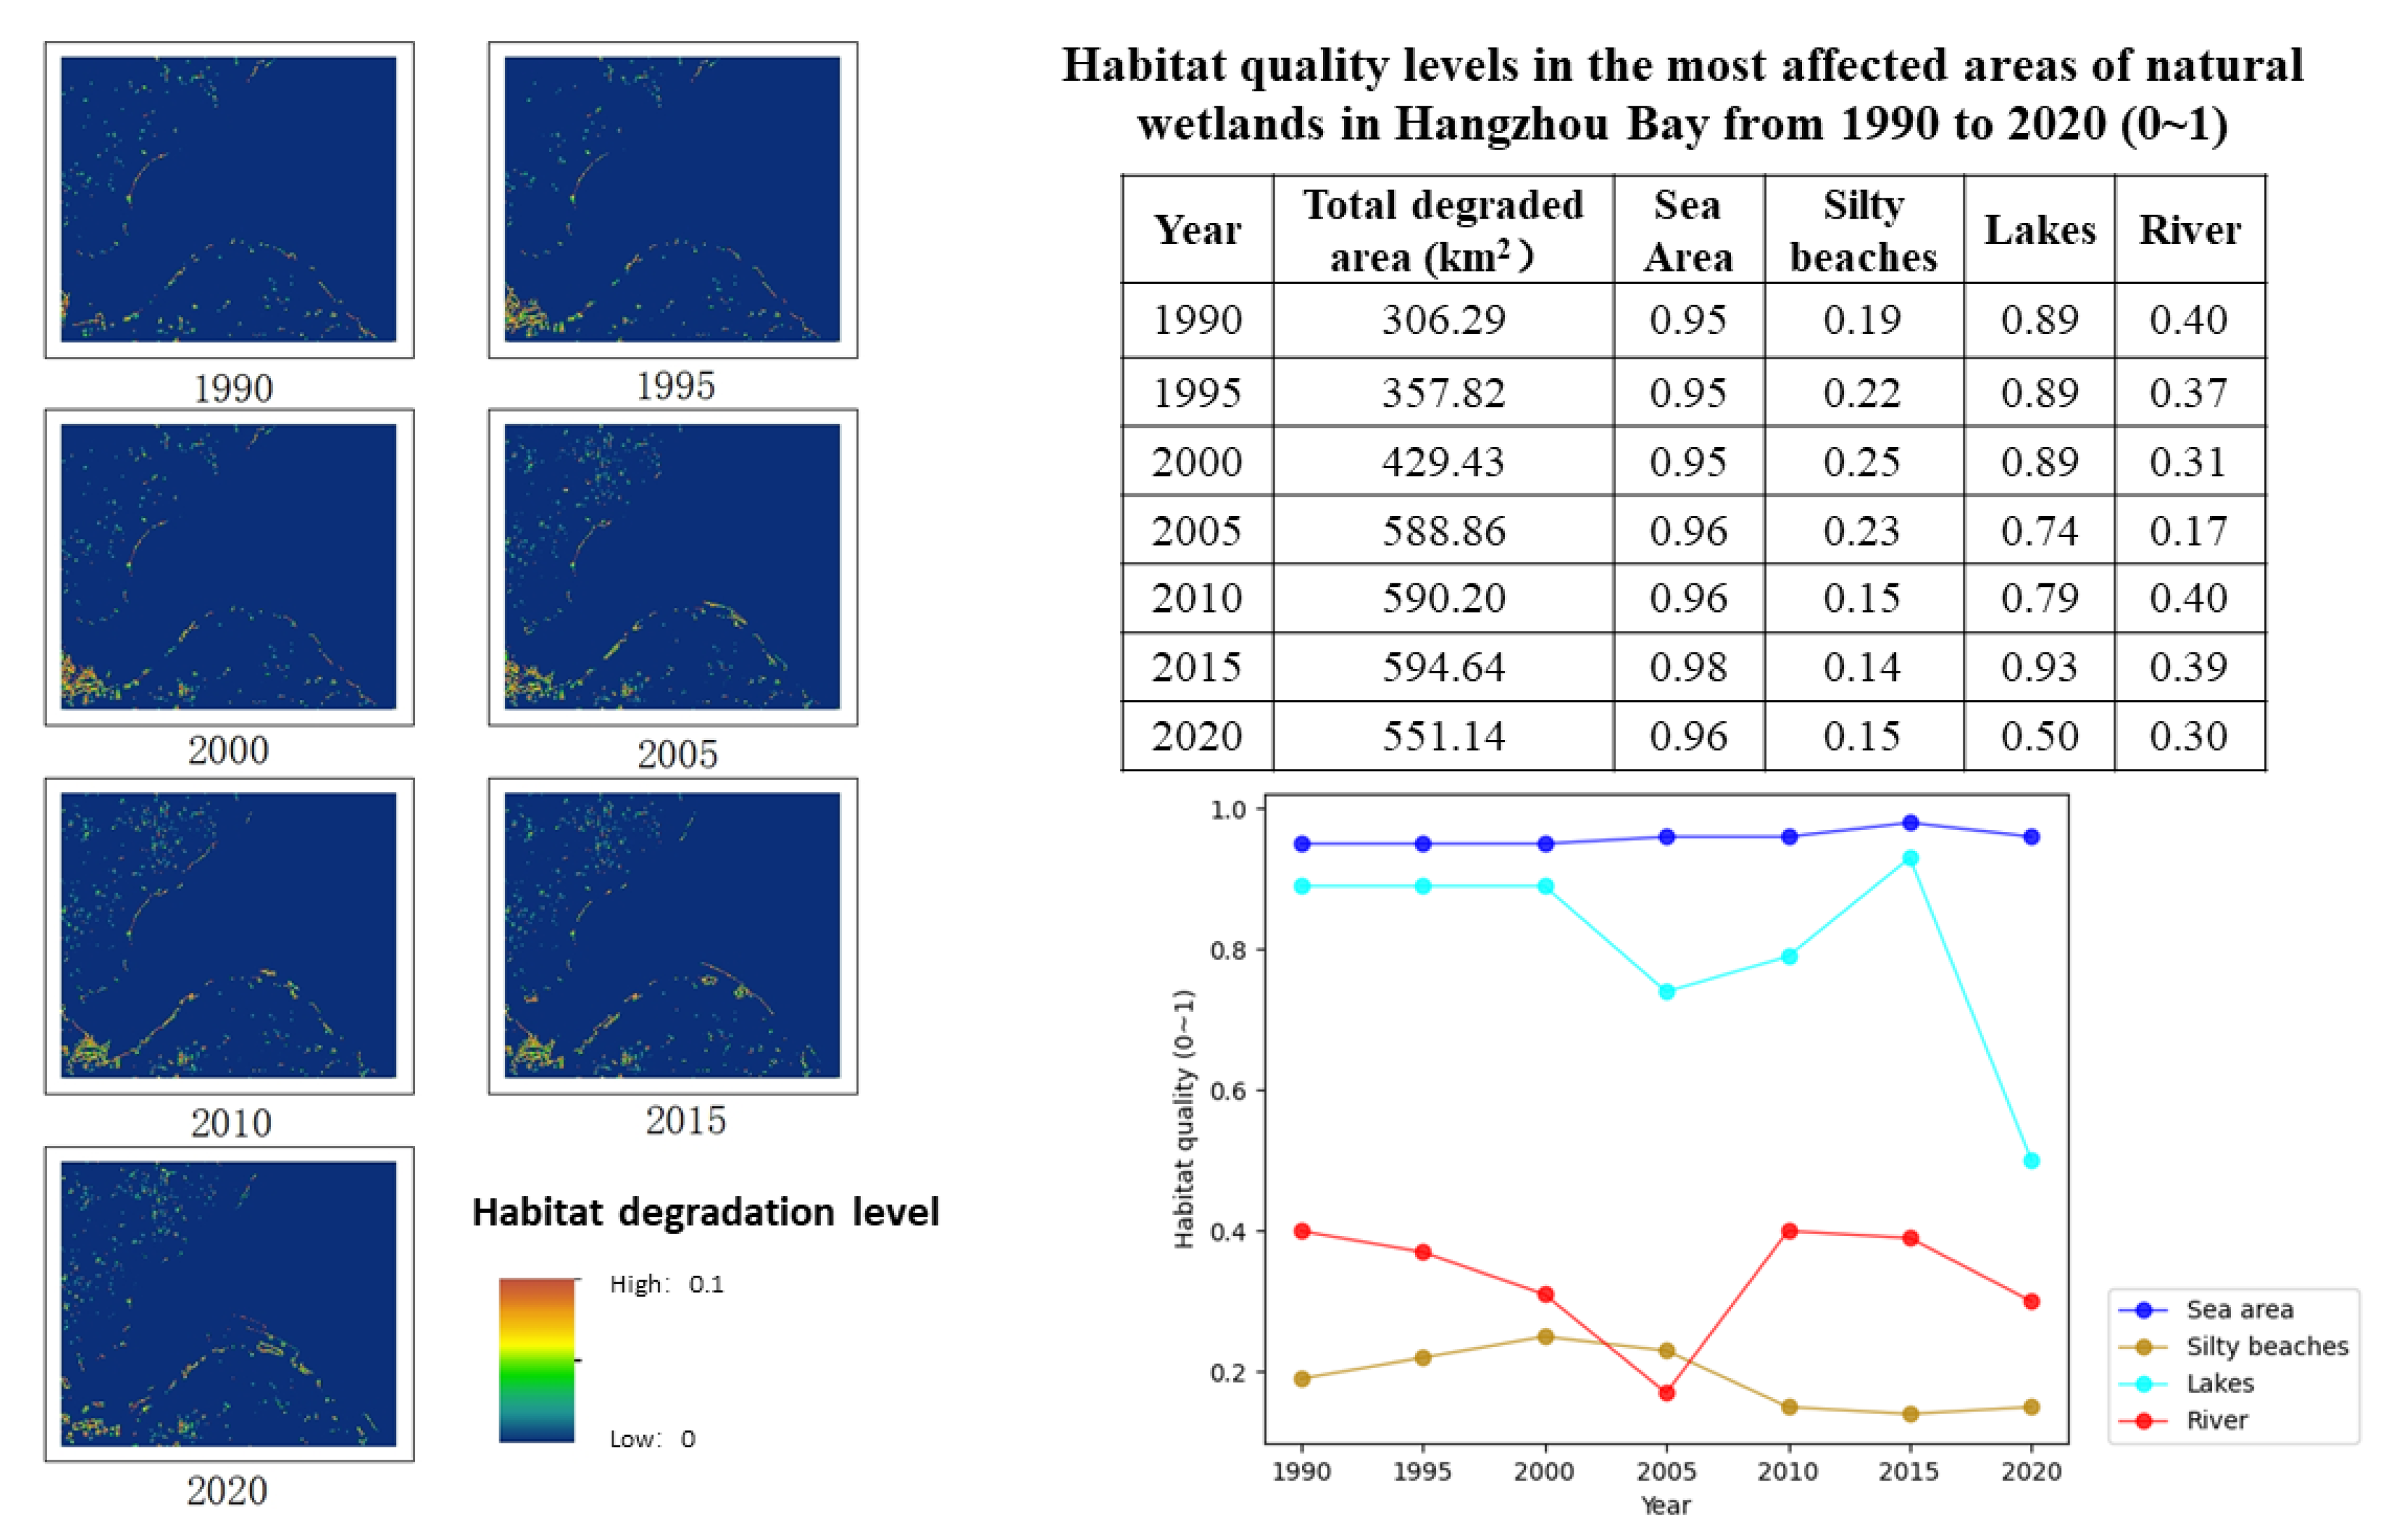
The degraded area of Hangzhou Bay shows a trend of increasing and then decreasing, i.e., the overall habitat quality decreases and then improves. The smallest degraded area was 306.29 km2 in 1990, and the maximum degraded area was 594.64 km2 in 2015 (Figure 6). Hundreds of square kilometers of habitat degradation indicates that the industrialization of Hangzhou Bay has had a considerable impact on the quality of local habitats.
Habitat quality values are between 0 and 1. As the extent of the impact of habitat threat sources is small compared to the overall area of the habitat, the data for the most impacted areas in the habitat have been selected for display in the table in order to increase the variation in the threat to different wetlands. Habitat quality in the sea has been less susceptible to impacts and has remained high over the last 30 years. The habitat quality of the silty beach is easily affected, showing a trend of first increasing and then decreasing, and the overall quality is at a low level. Lake habitat quality fluctuated greatly and showed a downward trend, and some lakes were affected during 2015–2020. The habitat quality of the river fluctuates somewhat, reaching its lowest point in 2005 and then recovering to the levels of previous years (Figure 6).
The spatial distribution of habitat quality in Hangzhou Bay is relatively homogeneous. The marine area of Hangzhou Bay is not affected by artificial factors, and the habitat quality in the terrestrial region is poor because artificial wetlands and non-wetlands occupy most of the land area. Changes in habitat quality are reflected in the effects of land-based artificial wetlands on natural wetlands in the sea. In addition, there are some land-based artificial wetlands on land-based natural wetlands. The degraded areas are mainly distributed on both sides of the Cao’e River and on the north and south coastlines of Hangzhou Bay, which coincides with the change trend of the above land-use types (Figure 6). Once the coastline changes, the habitat quality in the area where the sea area changes to land will decline rapidly. Except for this, there is no specific difference in habitat quality on the inland land between the north and south shores, where the habitat status of rivers and lakes remains good.

4. Discussion

We quantitatively estimate several ecological services in the Hangzhou Bay area, which have been verified by other data in the study area [17,18,19]. We found that changes in wetlands and transformations between wetland types have a profound impact on ecosystem services. However, again, trends in ecosystem services are not derived from just one of these factors, but a combination of many. The main cause of wetland change is the development of coastal urban agglomerations in the Hangzhou Bay region over the past thirty years, including activities such as urban sprawl, land reclamation around the sea, and the occupation of agricultural land by industrial land. These activities have led to a reduction in marine area, an increase in non-wetland area, and a reduction in agricultural land, thus affecting local ecological services. This is in line with the consistent findings of most scientific researchers studying the impact of coastal urban expansion on the ecology of the coastal zone [20,21].
Based on the land transfer matrix, it is easier to observe the shifts between different wetland types during the process. Comparing changes in wetland type area with changes in ecosystem services, the following conclusions can be drawn. The degradation of paddy fields is a major factor in the decline of carbon stocks in wetlands. The process of conversion of silty beaches to other land types has slowed the decline in carbon stocks. The decrease in wetland area due to urbanization and the increase in higher water yielding wetland types due to land reclamation can simultaneously affect local water yield. The increase in the area of non-wetlands and the decrease in marine area directly led to an increase in the area of habitat degradation. However, there is a positive impact on habitat quality from the decline in the area of artificial wetlands. The conclusions reached in this paper are generally consistent with those of other literature in the study area [22].
This study uses the scenario analysis method of non-monetary estimation methods to introduce the InVEST model into the study of the Hangzhou Bay wetlands. Other methods used to quantify ecosystem services are monetary estimation methods, which have the advantage that the results are intuitive and meet the need for accurate calculations. However, many ecosystem services exist as public goods and market-based valuation may not be the best way to assess them, and new methods of valuing ecosystem services are needed [23]. Alternatively, transfer-based methods can provide spatially de-coarsened estimates of value [24]. This paper innovatively combines a land transfer matrix to analyze changes in ecosystem services, making the process of change clearer. The scale of ecosystem services must be considered when assessing ecosystem services [25]. Previous studies of wetlands in Hangzhou Bay have focused on coastal wetlands along the southern shore. This study will simultaneously expand the scope of the study in space and time to comprehensively reflect the impacts of changes in wetland ecosystem services across the bay.
Some caveats also exist for the study. The carbon cycle module of the InVEST model assumes that carbon storage changes are linear and constant in time, ignoring differences in spatial distribution and carbon transfer due to unnatural factors. The annual water production module ignores unconventional precipitation scenarios, anomalous water balance processes due to complex topography, and intra-annual variability in production and sink flows. The habitat quality module assumes that all threats are cumulative and ignores sources of threats outside the study area boundary [26]. Despite the aforementioned limitations of InVEST, several models selected for this study have been widely used and their reliability and realistic reference value have been recognized by the industry. Therefore, we believe that the errors generated in the estimation of the InVEST model do not affect the results of the study.
In this study, the remote sensing images were classified by visual interpretation, so the accuracy of the produced land use/land cover maps is low. Visual interpretation is one of the most common and basic methods, and many scientific research results are derived by combining visual interpretation [27], so we believe that the results of visual interpretation in this paper are credible. The wetland classification system used in this study is not consistent with the wetland classification in the new Wetland Protection Law [28], which was introduced on 1 June 2022. It would be more relevant if the study adopted the newly implemented wetland classification system. However, in practice, there is little difference between the two wetland classifications. The use of the traditional classification can be validated against the results of previous papers, adding credibility to the results in another way. Due to the impact of the epidemic and time constraints, the parameters in the InVEST model used in this study were not available in the field. They were primarily referred to other literature, which may lead to less accurate results in the assessment of ecosystem services. This paper ensures maximum parameter reliability by cross-validating with other articles studying wetlands in the Hangzhou Bay region.
Sun [29] have proposed some strategies for the overall management of coastal wetlands in China. It should be recognized that improving ecosystem services and economic development are not in conflict [30], just that more work needs to be done in regional development planning. Combining the above strategies with the situation in the study area, this paper suggests that, in order to curb the reduction of coastal wetlands and their functional degradation, farmland development and construction activities should be prohibited in the “red line” area and the established wetland protection zones. In order to improve the management of coastal wetlands, training for wetland managers should be strengthened and a sound consultation mechanism for decision making should be established. In order to explore the response of coastal wetlands to human activities, expenditure on scientific research in the region’s wetlands should be increased, and the introduction of advanced concepts and technologies for the conservation or restoration of coastal wetlands should be further strengthened.

5. Conclusions

We selected Landsat remote sensing images as the data source and obtained land use maps for the seven phases of the study area through visual interpretation. The land area transfer matrix, the carbon storage module, the annual water production module, and the habitat quality module of the InVEST model were used to evaluate the ecosystem services of the Hangzhou Bay wetlands. We conclude that during the period 1990–2020, with the urbanization of the Hangzhou Bay area, there is a process of conversion from wetlands to non-wetlands and from natural wetlands to artificial wetlands. At the same time, carbon storage in the Hangzhou Bay area continues to decline, annual water yield fluctuates up and down, and habitat quality decreases. As a result, we recommend that managers of the study area cease development activities in nature reserves and “red line” areas in a timely manner. At the same time, managers should increase their learning on wetland conservation, consult professionals when necessary, and encourage research on wetlands.

Author Contributions

Conceptualization, H.L. and G.Y.; methodology, H.L. and G.Y.; validation, H.L.; formal analysis, H.L.; investigation, H.L.; resources, H.L.; data curation, H.L.; writing—original draft preparation, H.L.; writing—review and editing, H.L., G.Y., C.C. and K.W.; visualization, H.L.; supervision, H.L.; project administration, C.C. and G.Y. All authors have read and agreed to the published version of the manuscript.

Funding

National Natural Science Foundation of China 42176216. Major Soft Science Project of Zhejiang Provincial Science and Technology Department 2022C15008. Open Research Fund Support Project of Key Laboratory of Marine Ecosystem Dynamics, Ministry of Natural Resources MED202001. Fujian Provincial Key Laboratory of Marine Ecological Protection and Restoration Open Research Fund Support Project EPR2021003. Special Project for Interdisciplinary Pre-research of Zhejiang University. China National Offshore Oil Marine Environment and Ecological Protection Public Welfare Fund.

Institutional Review Board Statement

Not applicable.

Informed Consent Statement

Not applicable.

Data Availability Statement

The data required for the study includes Landsat TM/OLl remote sensing image data from 1990 to 2020 were downloaded from the Chinese Academy of Sciences Geo-spatial Data Cloud (https://www.gscloud.cn/, accessed on 3 April 2022) with a spatial resolution of 30 m; annual precipitation data were downloaded from the Geo-graphic Remote Sensing Ecology Network (http://www.gisrs.cn, accessed on 23 April 2022). The evapotranspiration data were downloaded from a global potential evapo-transpiration map (https://cgiarcsi.community/data/global-aridity-and-pet-database/, accessed on 23 April 2022) provided by CGIAR based on WorldClim climate data. The root restriction layer depth data and plant available water content data were down-loaded from the global soil data in the Harmonized World Soil Database (https://webarchive.iasa, accessed on 23 April 2022) constructed by the Food and Agri-culture Organization of the United Nations (FAO) and the International Institute for Applied Systems (IIASA), (Vien-na..ac.at/Research/LUC/External-World-soil-database/HTML/, https://webarchive.iiasa.ac.at/Research/LUC/External-World-soil-database/HTML/, accessed on 23 April 2022) with a spatial resolution of 1 km; sub-basin data were down-loaded from the DEM-extracted Chinese watershed and river network dataset provided by the Institute of Geography, Chinese Academy of Sciences (https://www.resdc.cn/data.aspx?DATAID=226, accessed on 28 April 2022); the road and highway data were downloaded from the National Geographic Information Resource Catalogue Service (http://www.webmap.cn/main.do?method=index, accessed on 28 April 2022).

Acknowledgments

This is a contribution of the Ocean College, Zhejiang University, Haiji Liang and Guanqiong Ye.

Conflicts of Interest

The authors declare no conflict of interest.

References

  1. Costanza, R.; d’Arge, R.; de Groot, R.; Farber, S.; Grasso, M.; Hannon, B.; Limburg, K.; Naeem, S.; O’Neil, R.V.; Paruelo, J.; et al. The Value of the World’s Ecosystem Services and Natural Capital. Nature 1997, 387, 253–260. [Google Scholar] [CrossRef]
  2. Narayan, S.; Beck, M.W.; Wilson, P.; Thomas, C.J.; Guerrero, A.; Shepard, C.C.; Reguero, B.G.; Franco, G.; Ingram, J.C.; Trespalacios, D. The Value of Coastal Wetlands for Flood Damage Reduction in the Northeastern USA. Sci. Rep. 2017, 7, 9463. [Google Scholar] [CrossRef] [PubMed] [Green Version]
  3. Davidson, N.C.; van Dam, A.A.; Finlayson, C.M.; McInnes, R.J. Worth of Wetlands: Revised Global Monetary Values of Coastal and Inland Wetland Ecosystem Services. Mar. Freshw. Res. 2019, 70, 1189–1194. [Google Scholar] [CrossRef]
  4. Xiao, N.; Mimi, H.; Xuexin, S.; Ming, W. Assessment of Ecological Service Functions of Coastal Wetlands on the South Bank of Hangzhou Bay. Ecol. Sci. 2017, 36, 166–176. [Google Scholar] [CrossRef]
  5. Yingjun, F.; Yan, L.; Qinchun, X.; Liren, Z. Geomorphology of Hangzhou Bay and the activity of the sedimentary interface. J. Oceanogr. 1990, 12, 11. [Google Scholar]
  6. Yang, S.; Guo, S. Analysis of the climatic characteristics of Hangzhou Bay area. East China Sea Mar. 1985, 4, 16–26. [Google Scholar]
  7. Li, L. Research on Remote Sensing Monitoring and Change of Vegetation Cover along Hangzhou Bay. Master’s Thesis, Shanghai Normal University, Shang Hai, China, 2015. [Google Scholar]
  8. Zhou, X. Study on the Economic and Industrial Development of the Hangzhou Bay Rim. Econ. Perspect. Next 2012, 5, 4. [Google Scholar]
  9. Chenwei, D.; Yu, C.; Yongzhong, T. Urban sprawl and vegetation change around Hangzhou Bay based on nighttime lighting data. J. Appl. Ecol. 2017, 28, 8. [Google Scholar]
  10. Classification of Land Use Status; China Land Survey and Planning Institute, and Department of Cadastral Management, Ministry of Land and Resources: Beijing, China, 2017.
  11. Liu, J.; Hu, T.; Pan, S.; Zhang, D.; Zhang, L.; Li, Y.; Li, M. A study on the distribution and changes of wetlands along the south coast of Hangzhou Bay during three periods since 2006. Wetl. Sci. 2018, 16, 502–508. [Google Scholar] [CrossRef]
  12. Liu, C.W. Ecological Response Analysis of Wetland Landscape Pattern Changes Based on Invest. Master’s Thesis, Zhejiang University, Hang Zhou Shi, China, 2014. [Google Scholar]
  13. Xi, Y.; Peng, S.; Liu, G.; Ducharne, A.; Ciais, P.; Prigent, C.; Li, X.; Tang, X. Trade-Off between Tree Planting and Wetland Conservation in China. Nat. Commun. 2022, 13, 1–11. [Google Scholar] [CrossRef]
  14. Weisscher, S.A.H.; Baar, A.W.; van Belzen, J.; Bouma, T.J.; Kleinhans, M.G. Transitional Polders Along Estuaries: Driving Land-Level Rise and Reducing Flood Propagation. Nat. Based Solut. 2022, 2, 100022. [Google Scholar] [CrossRef]
  15. Zhang, L.; Cheng, L.; Chiew, F.; Fu, B. Understanding the Impacts of Climate and Landuse Change on Water Yield. Curr. Opin. Environ. Sustain. 2018, 33, 167–174. [Google Scholar] [CrossRef]
  16. Vigerstol, K.; Abell, R.; Brauman, K.; Buytaert, W.; Vogl, A. Addressing Water Security through Nature-Based Solutions. In Nature-Based Solutions and Water Security; Elsevier: Amsterdam, The Netherlands, 2021; pp. 37–62. [Google Scholar]
  17. Xu, L.; Nianpeng, H.; Guirui, Y. 2010s China Terrestrial Ecosystem Carbon Density Dataset. China Sci. Data Chin. Engl. Online 2019, 4, 7. [Google Scholar]
  18. Pan, Y.; Haijun, B.; Lingyan, H.; Jinxia, Z. The evolution of the spatiotemporal pattern of coastal urbanization in Zhejiang and its impact on habitat quality: A study based on the invest model. Shanghai Land Resour. 2020, 41, 7. [Google Scholar]
  19. Cai, M.; Lu, H.; Lijiao, Y. The temporal and spatial variation characteristics of annual water production in typical years in Hangzhou based on the invest model and its influencing factors. J. Zhejiang A&F Univ. 2022, 39, 9. [Google Scholar]
  20. Yang, Z.; Cifang, W.; Yong, L. Assessment of Wetland Vulnerability in Rapid Urbanization Areas—A Case Study of Hangzhou Bay Wetland. Resour. Sci. 2009, 31, 243–249. [Google Scholar]
  21. He, Q.; Bertness, M.D.; Bruno, J.F.; Li, B.; Chen, G.Q.; Coverdale, T.C.; Altieri, A.H.; Bai, J.; Sun, T.; Pennings, S.C.; et al. Economic Development and Coastal Ecosystem Change in China. Sci. Rep. 2014, 4, 5995. [Google Scholar] [CrossRef] [Green Version]
  22. Lin, Q.Y.; Yu, S. Losses of Natural Coastal Wetlands by Land Conversion and Ecological Degradation in the Urbanizing Chinese Coast. Sci. Rep. 2018, 8, 15046. [Google Scholar] [CrossRef]
  23. Costanza, R.; Groot, R.D.; Sutton, P.; van der Ploeg, S.; Anderson, S.J.; Kubiszewski, I.; Farber, S.; Turner, R.K. Changes in the Global Value of Ecosystem Services; Elsevier: Amsterdam, The Netherlands, 2014. [Google Scholar]
  24. Camacho-Valdez, V.; Ruiz-Luna, A.; Ghermandi, A.; Berlanga-Robles, C.A.; Nunes, P. Effects of Land Use Changes on the Ecosystem Service Values of Coastal Wetlands. Environ. Manag. 2014, 54, 852–864. [Google Scholar] [CrossRef]
  25. Hein, L.; van Koppen, K.; de Groot, R.S.; van Ierland, E.C. Spatial Scales, Stakeholders and the Valuation of Ecosystem Services. Ecol. Econ. 2006, 57, 209–228. [Google Scholar] [CrossRef]
  26. Sharp, R.; Douglass, J.; WoIny, S.; Arkema, K.; Bernhardt, J.; Bierbower, W.; Chaumont, N.; Denu, D.; Fisher, D.; Glowinski, K.; et al. InVEST 3.10.2.post52+ug.g49d06a1 User’s Guide; University of Minnesota, The Nature Conservancy, and World Wildlife Fund: Minneapolis, MN, USA, 2020; Available online: https://storage.googleapis.com/releases.naturalcapitalproject.org/invest-userguide/latest/index.html (accessed on 16 September 2022).
  27. Zhang, Z.; Liu, F.; Zhao, X.; Wang, X.; Shi, L.; Xu, J.; Yu, S.; Wen, Q.; Zuo, L.; Yi, L.; et al. Urban Expansion in China Based on Remote Sensing Technology: A Review. Chin. Geogr. Sci. 2018, 28, 727–743. [Google Scholar] [CrossRef] [Green Version]
  28. Wetland Protection Law of the People’s Republic of China. Bull. Standing Comm. Natl. People’s Congr. People’s Repub. China 2022, 1, 21–28.
  29. Sun, Z.G.; Sun, W.G.; Tong, C.; Zeng, C.S.; Yu, X.; Mou, X.J. China’s Coastal Wetlands: Conservation History, Implementation Efforts, Existing Issues and Strategies for Future Improvement. Environ. Int. 2015, 79, 25–41. [Google Scholar] [CrossRef] [PubMed]
  30. Ouyang, Z.; Zheng, H.; Xiao, Y.; Polasky, S.; Liu, J.; Xu, W.; Wang, Q.; Zhang, L.; Xiao, Y.; Rao, E.; et al. Improvements in Ecosystem Services from Investments in Natural Capital. Science 2016, 352, 1455–1459. [Google Scholar] [CrossRef] [PubMed]
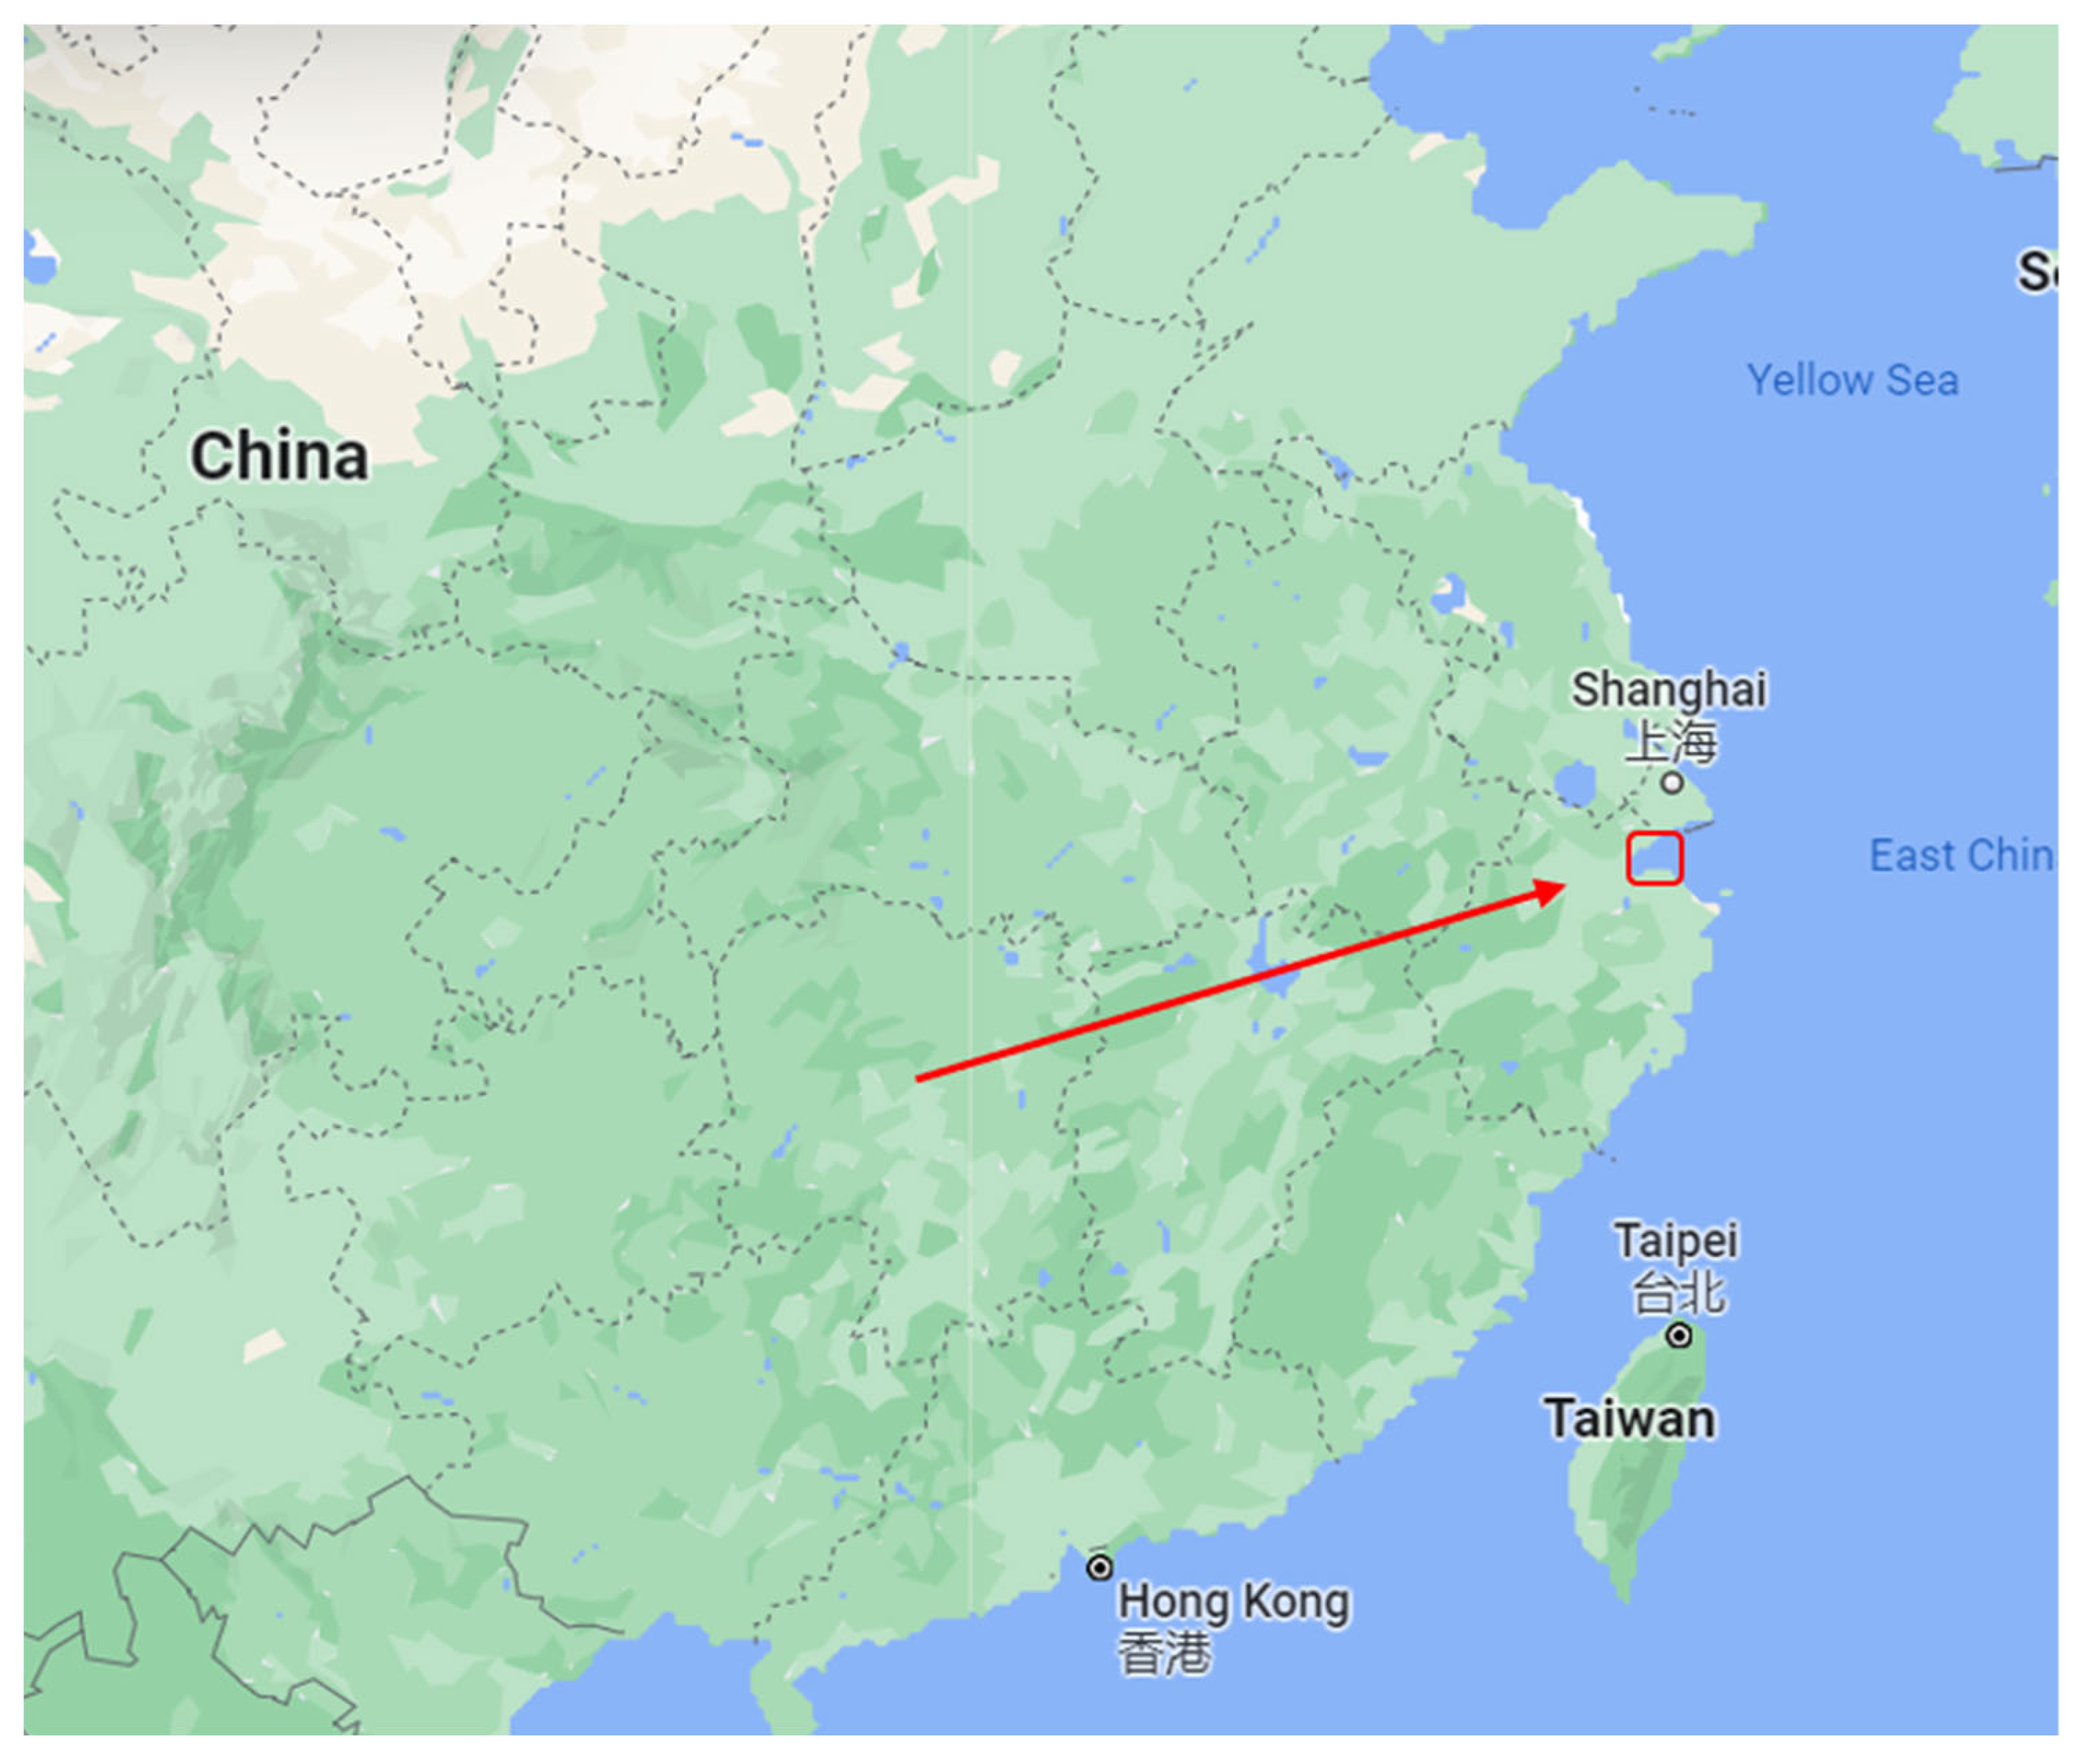
Figure 1. Specific locations of the study area in China.
Jmse 10 01781 g001
Figure 2. Land use/cover map of Hangzhou Bay wetlands from 1990 to 2020.
Jmse 10 01781 g002
Figure 3. The main processes of surface-based transfer of wetland types in Hangzhou Bay during 30 years.
Jmse 10 01781 g003
Figure 4. Carbon storage distribution and changes every five years in the Hangzhou Bay wetlands from 1990 to 2020. The left graphs show the regional distribution of carbon storage in the study area each year. The right graphs show the regional distribution of changes between five years.
Jmse 10 01781 g004
Figure 5. Distribution of water production of Hangzhou Bay wetlands from 1990 to 2020.
Jmse 10 01781 g005
Figure 6. Habitat quality degradation distribution of the Hangzhou Bay wetlands from 1990 to 2020.
Jmse 10 01781 g006
Table 1. Details of wetland classification system.
Land KindLand UseDescription of the Type of Land
Natural wetlandsSea areaOffshore waters where the water level is lower than 6 m at low tide
Silty beachesMuddy shoals and various marshy areas on the coast
LakesFreshwater lakes and lakeside wetlands with an area of more than 8 ha
RiverLinear waterways on land surfaces, including streams and floodplains
Artificial wetlandsReservoir and pondIncluding coastal reservoirs, agricultural ponds, storage ponds, and fish ponds
Paddy fieldLand that can store water for growing aquatic crops, such as rice
Non-wetlandsNon-wetlandsExcluding the above-mentioned land types, including urban and rural settlements, dry land, forest land, etc.
Table 2. Wetland area transfer matrix of Hangzhou Bay from 1990 to 2020 (km2). In: Refers to the conversion from the item under “Sub-list” to the item under “Wetland Type”; Out: Refers to the conversion from the item under “Wetland Type” to the item under “Sub-list”.
Wetland TypeTime
Sub List
1990~19951995~20002000~20052005~20102010~20152015~2020
InOutInOutInOutInOutInOutInOut
Sea areaSilty beaches0.100.130.130.090.080.190.05543.010.0813.3521.261.78
Lakes0.000.000.000.000.000.000.000.000.000.000.000.00
River0.000.000.000.000.010.000.000.010.000.140.150.30
Reservoir ponds0.000.000.000.010.010.070.010.050.005.310.240.70
Paddy field0.010.060.030.000.020.080.010.030.002.050.370.04
Non-wetland0.010.150.140.010.010.130.090.120.023.772.890.99
Total0.150.340.300.140.160.470.16543.220.1024.6224.913.81
Silty beachesSea area0.130.100.090.130.190.08543.010.0513.350.081.7821.26
Lakes0.000.000.000.000.030.010.020.030.010.010.010.05
River13.192.870.060.010.120.110.130.160.091.830.0362.13
Reservoir ponds2.1618.260.0137.300.0829.830.197.230.0428.100.0391.87
Paddy field1.1223.680.041.203.156.170.252.820.0877.040.1432.40
Non-wetland0.1017.270.143.370.3520.971.567.530.20104.872.52106.44
Total16.7062.180.3442.043.9257.17545.1617.8213.77211.934.51314.15
LakesSea area0.000.000.000.000.000.000.000.000.000.000.000.00
Silty beaches0.000.000.000.000.010.030.030.020.010.010.050.01
River0.000.000.000.000.000.000.000.000.000.000.000.00
Reservoir ponds0.000.000.000.020.000.000.010.010.010.000.000.02
Paddy field0.150.070.070.131.280.180.660.350.170.170.680.59
Non-wetland0.010.010.010.010.060.170.140.130.070.150.280.45
Total0.160.080.080.161.350.680.840.510.260.331.011.07
RiverSea area0.000.000.000.000.000.010.010.000.140.000.300.15
Silty beaches2.8713.190.040.060.110.120.160.131.830.0962.130.03
Lakes0.000.000.000.000.000.000.000.000.000.000.000.00
Reservoir ponds0.3313.030.011.950.052.520.130.310.020.040.403.48
Paddy field0.3021.500.360.651.093.022.592.070.410.477.872.15
Non-wetland0.032.130.080.040.420.830.570.420.170.179.450.83
Total3.5349.850.492.701.676.503.462.932.600.7780.156.61
Reservoir pondsSea area0.000.000.010.000.070.010.050.015.310.000.700.24
Silty beaches18.262.1637.30.0129.830.087.230.1928.10.0491.870.03
Lakes0.000.000.020.000.000.000.010.010.000.010.020.00
River13.030.331.950.012.520.050.310.130.040.023.480.40
Paddy field9.557.9216.990.9316.9424.9316.0139.521.1813.7520.7411.77
Non-wetland1.471.042.340.501.0810.501.772.396.4214.2718.7312.25
Total42.3111.1558.611.4550.4135.5725.3812.2511.0528.09135.5454.69
Paddy fieldSea area0.060.010.000.030.080.020.030.012.050.000.040.37
Silty beaches23.681.121.200.046.173.152.820.2577.040.0832.400.14
Lakes0.070.150.130.070.481.280.350.660.170.170.590.68
River21.500.300.650.363.021.092.072.590.470.442.157.87
Reservoir ponds7.929.550.9316.9924.9316.9139.5216.0113.751.1811.7720.74
Non-wetland46.3892.7823.5667.0155.95323.5234.41153.426.85113.0988.36236.29
Total99.61103.9126.1784.590.63346.0079.20172.92120.33114.96165.31266.09
Non-wetlandSea area0.150.040.040.140.130.040.120.093.770.020.992.89
Silty beaches17.270.103.370.1420.970.357.531.56101.870.20106.442.52
Lakes0.010.010.010.010.170.060.130.140.150.070.450.28
River2.130.030.040.080.830.420.420.570.170.170.839.45
Reservoir ponds1.041.470.502.3410.501.082.391.7714.276.4212.2518.73
Paddy field92.7846.3867.0123.56323.5255.95153.4034.41113.0926.85236.2988.36
Total113.3848.0370.9726.27356.1257.90163.9938.54236.3233.73357.25122.23
Table 3. Carbon storage by land use in the Hangzhou Bay wetlands from 1990 to 2020 (Unit: 104 t).
Year1990199520002005201020152020
Land Use
Sea area703.64703.61703.63703.59627.58624.14626.62
Silty beaches62.9154.5546.8737.08134.1197.6440.66
Lakes1.541.551.541.631.671.661.65
River17.1711.1510.8710.2510.3010.5520.09
Reservoir pond8.0811.9419.0820.9518.8520.4730.53
Paddy field1566.401564.151534.071401.631352.881355.791304.21
Non-wetlands0.000.000.000.000.000.000.00
Total volume2359.752346.952316.072175.132145.402110.242023.76
Rate of change of total volume −0.54%−1.32%−6.09%−1.37%−1.64%−4.10%
Publisher’s Note: MDPI stays neutral with regard to jurisdictional claims in published maps and institutional affiliations.