

An Evaluation of Marine Renewable Energy Resources Complementarity in the Portuguese Nearshore


Abstract
:1. Introduction
- (a)
- Provide a complete picture of the solar-wind-wave resource complementarity in the Portuguese nearshore;
- (b)
- Identify some suitable hot-spots for the development of hybrid marine renewable projects;
- (c)
- Establish the performances of some renewable generators (solar, wind and waves) operating in the Portuguese nearshore area.
2. Materials and Methods
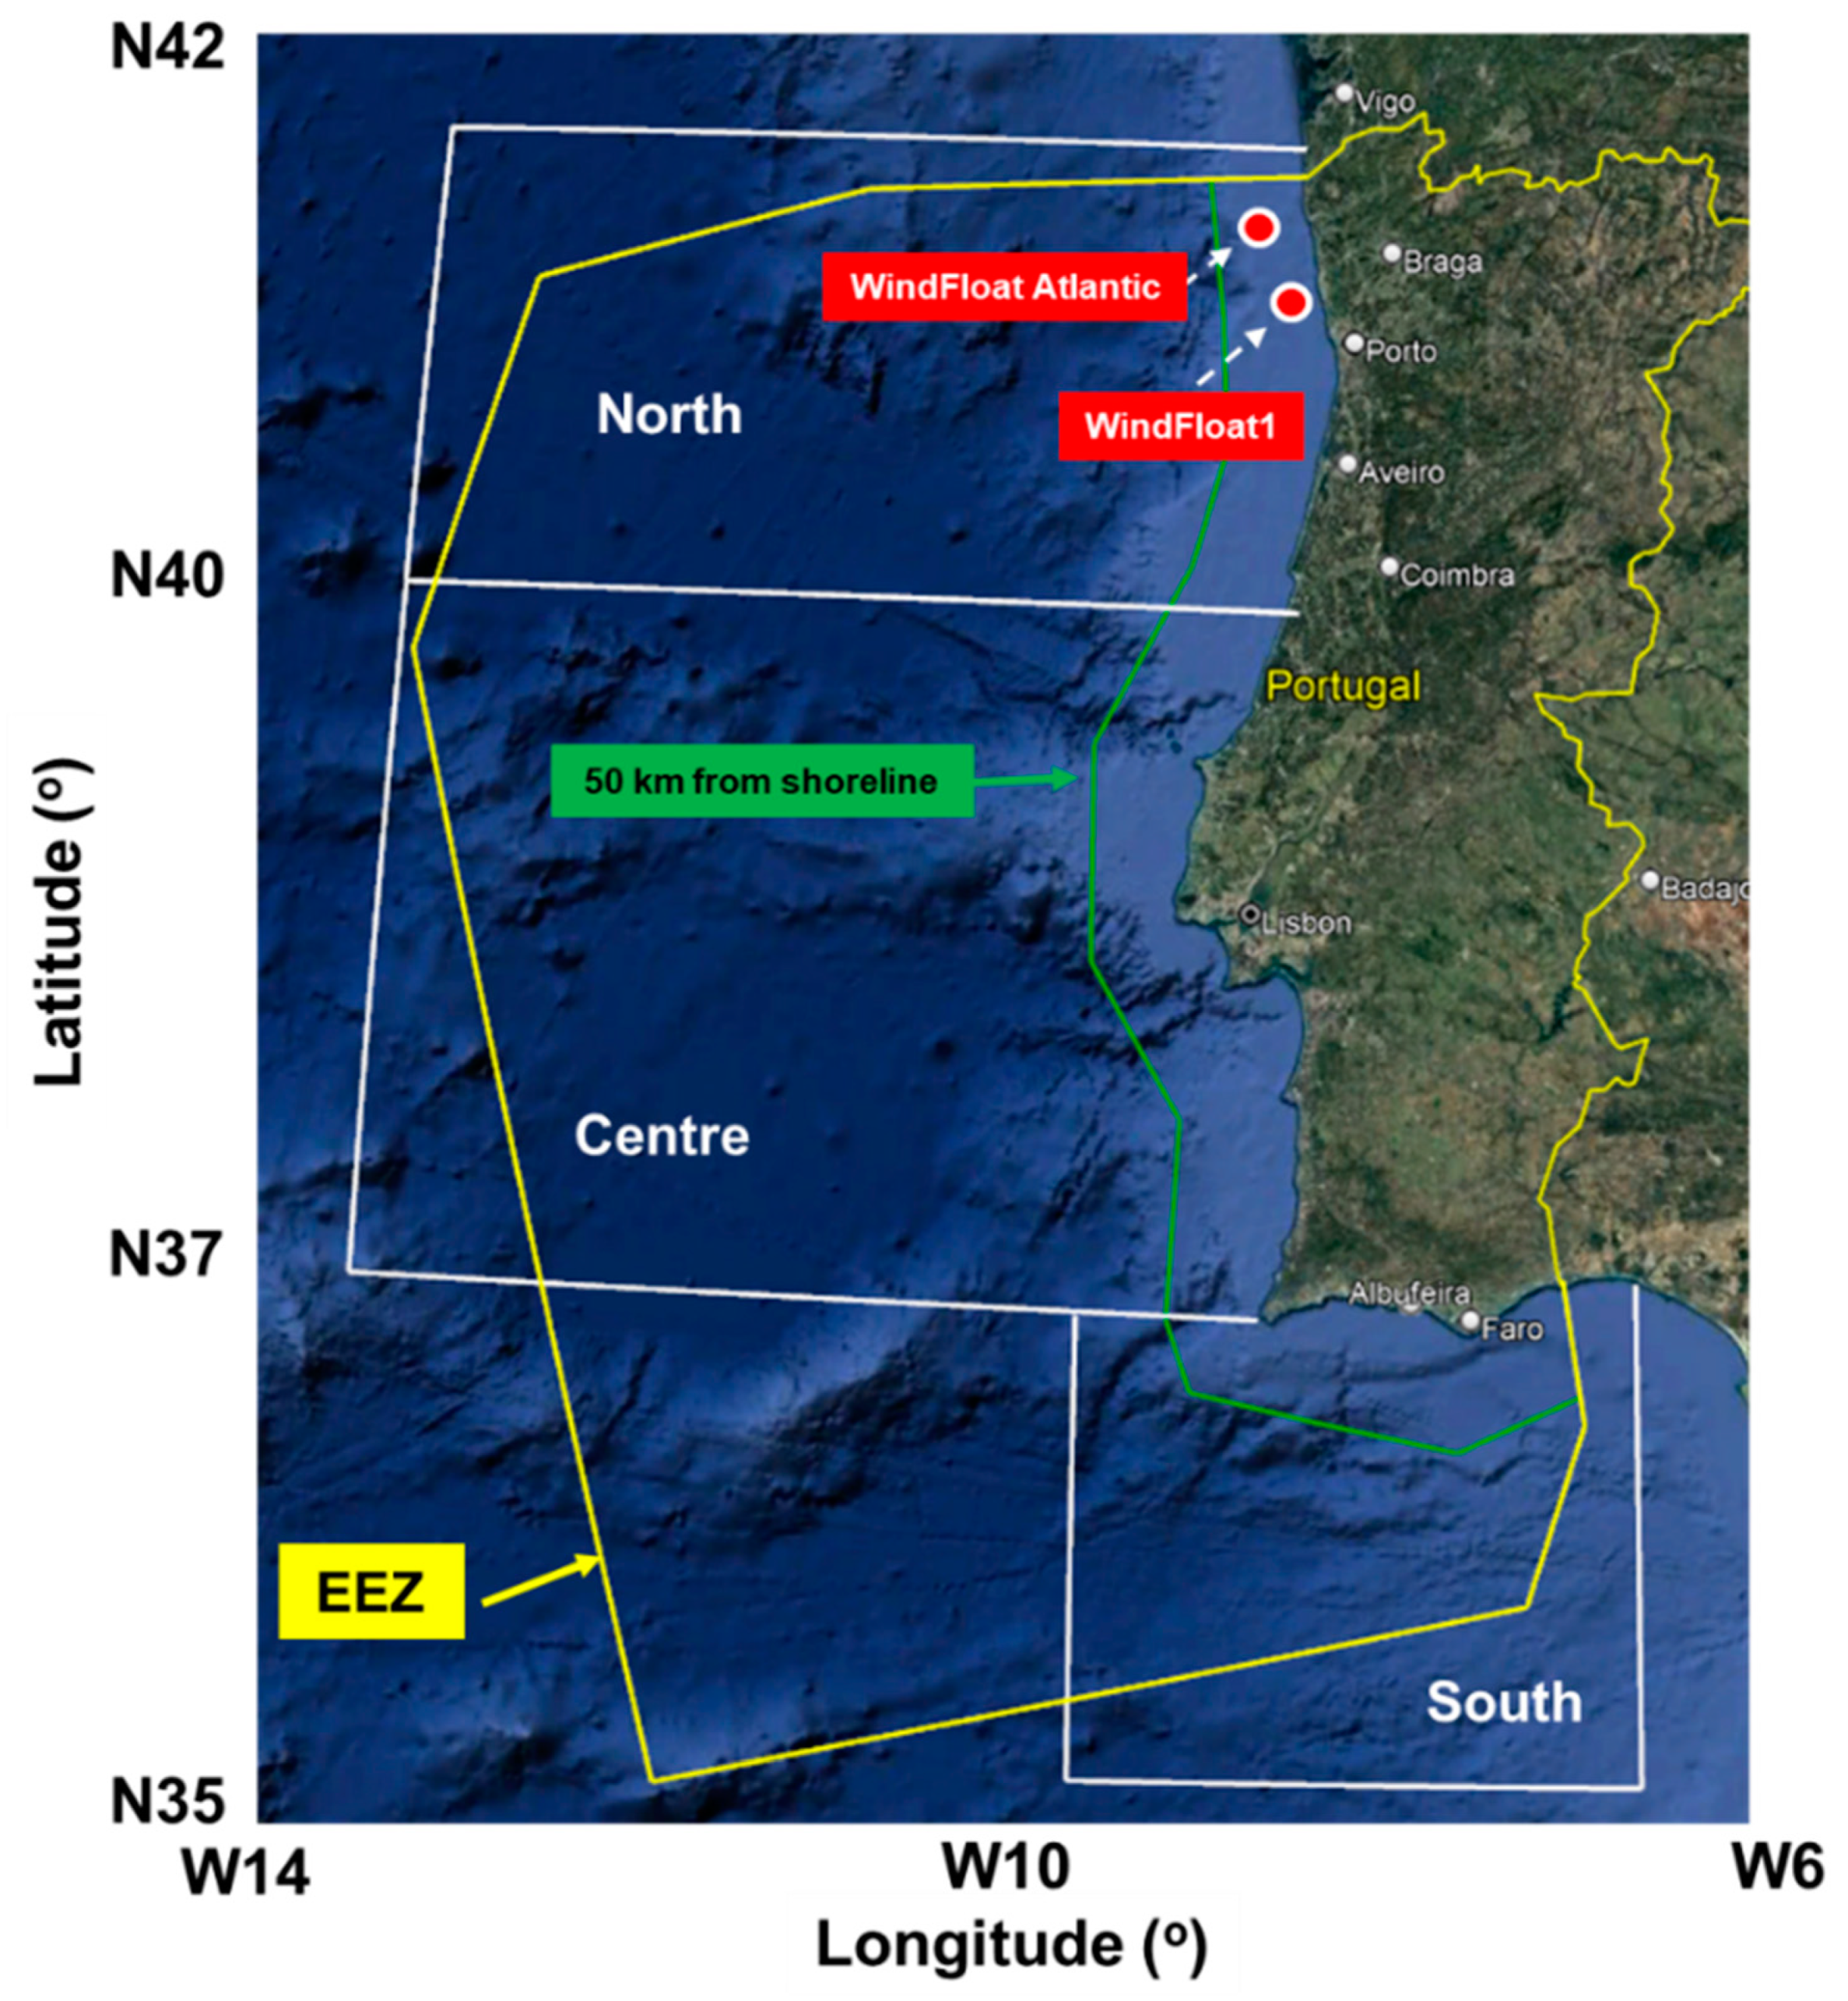
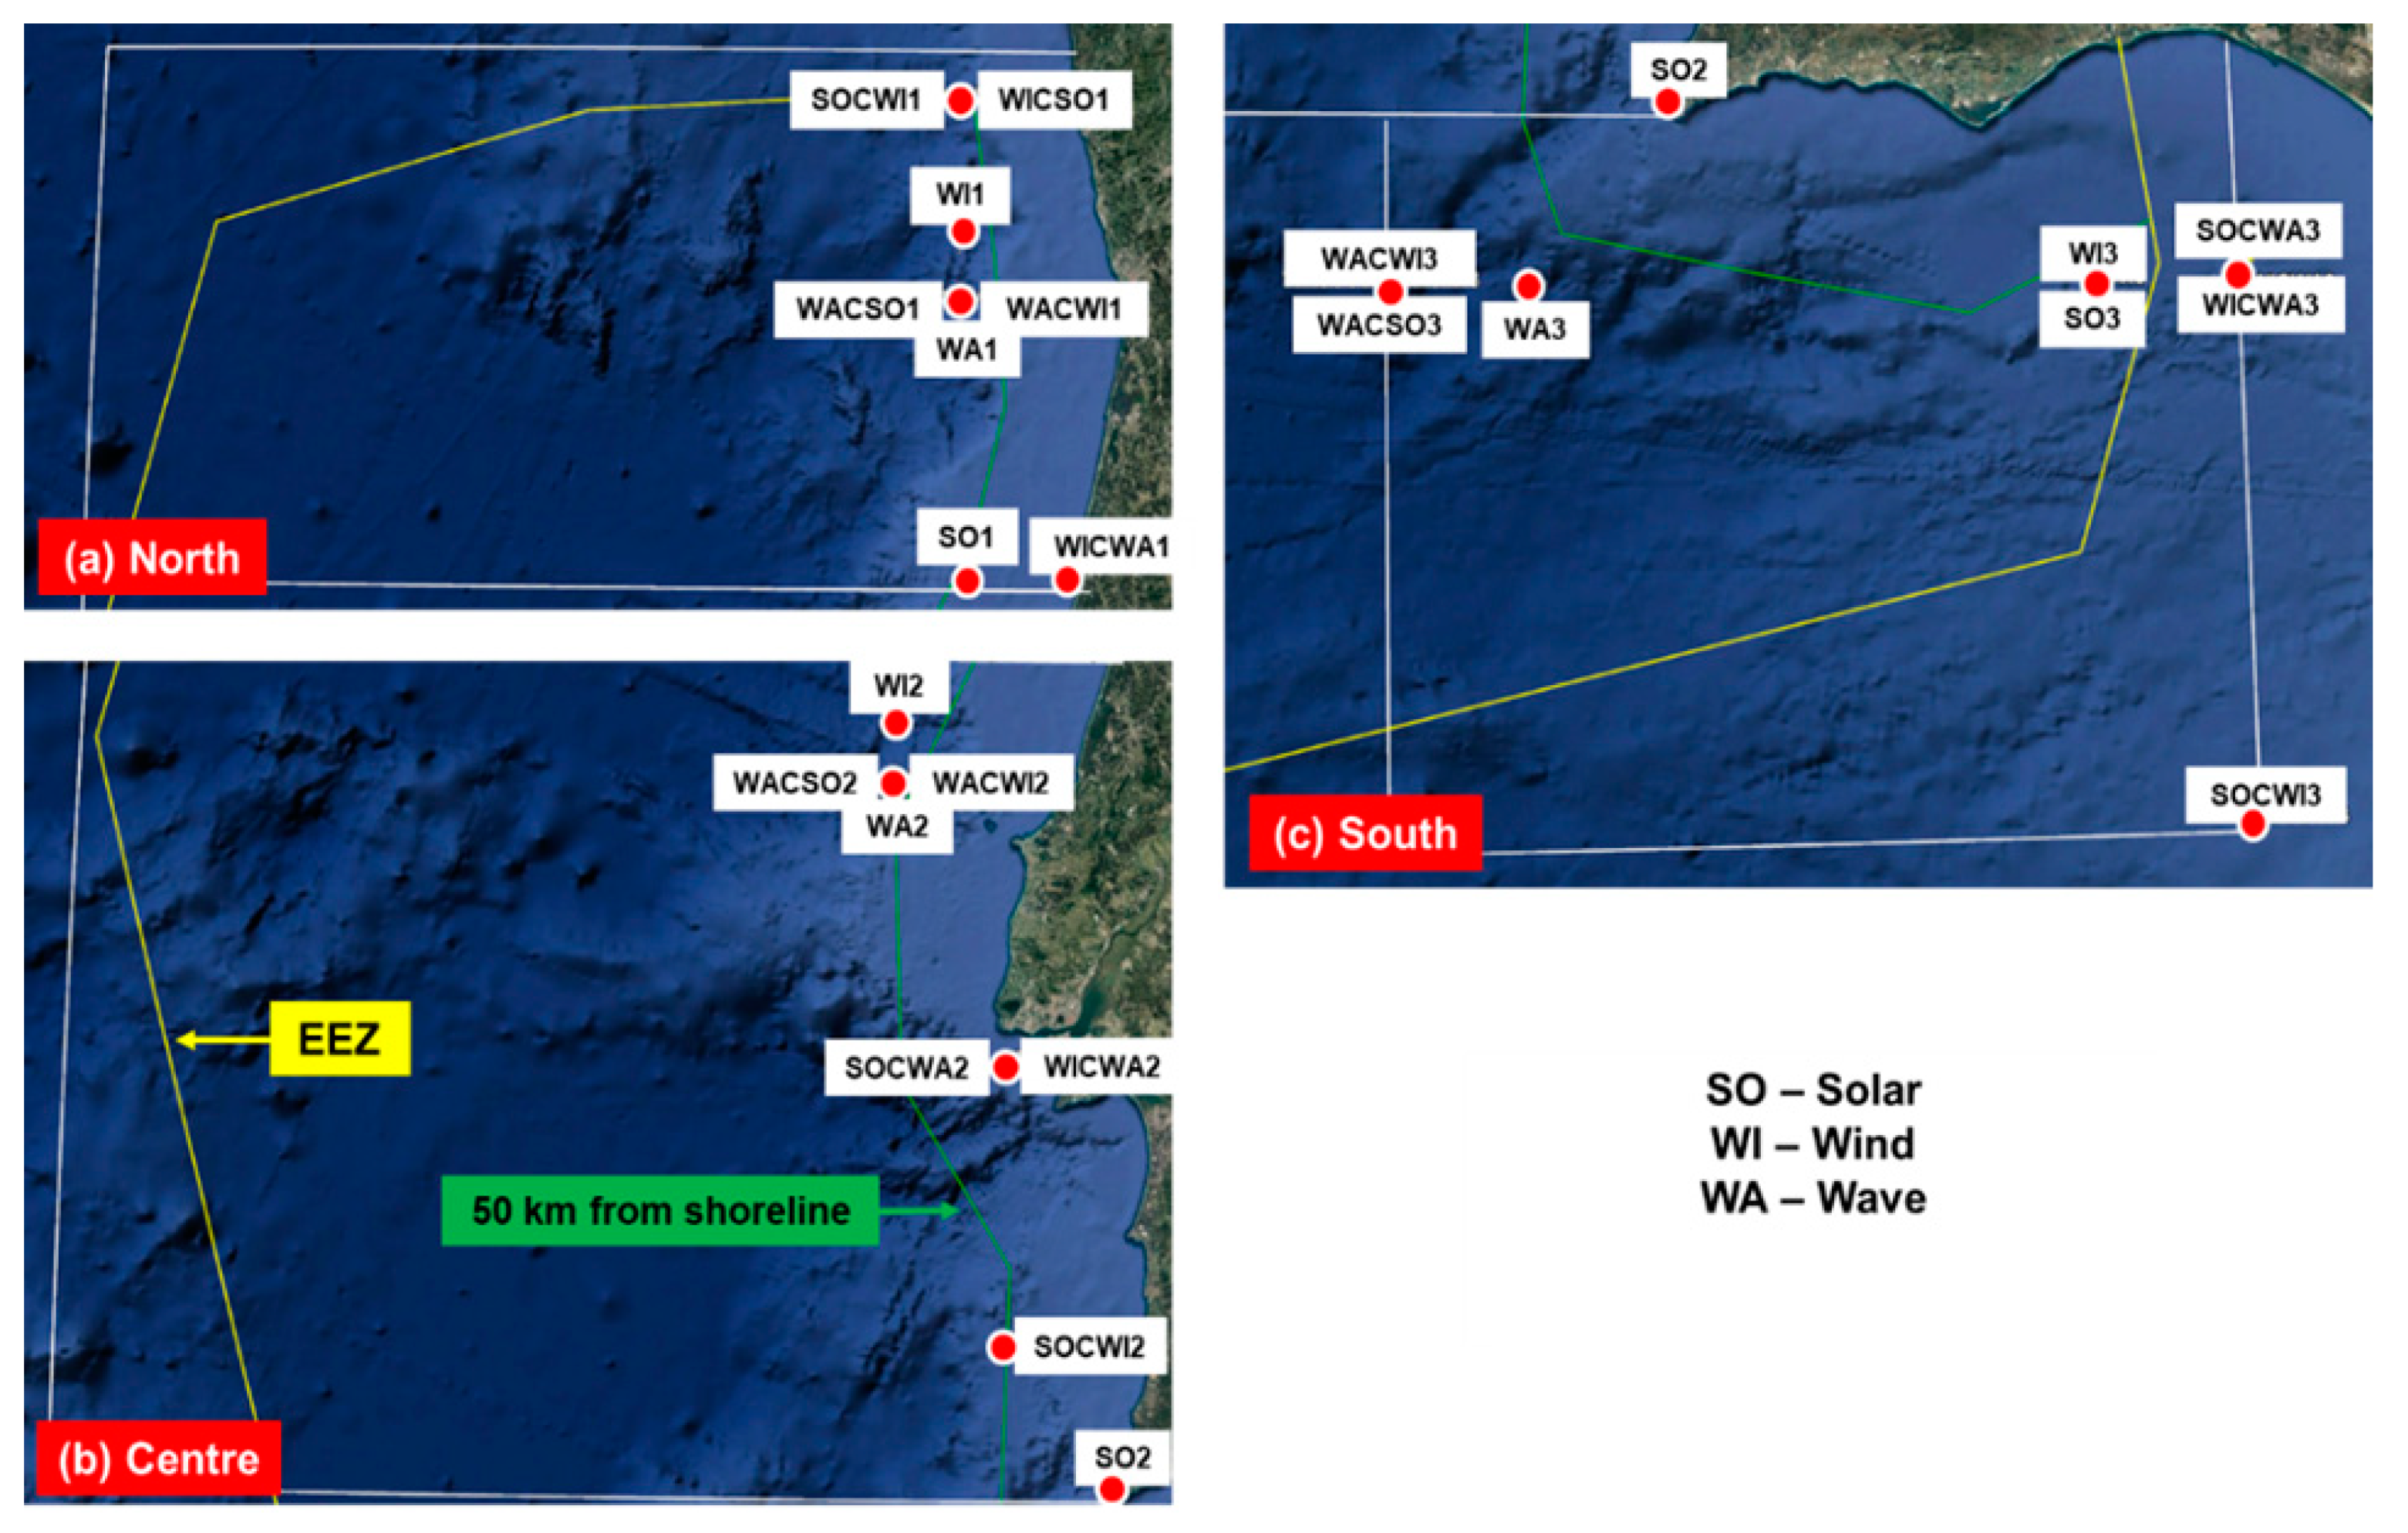
2.1. Target Area
2.2. Dataset
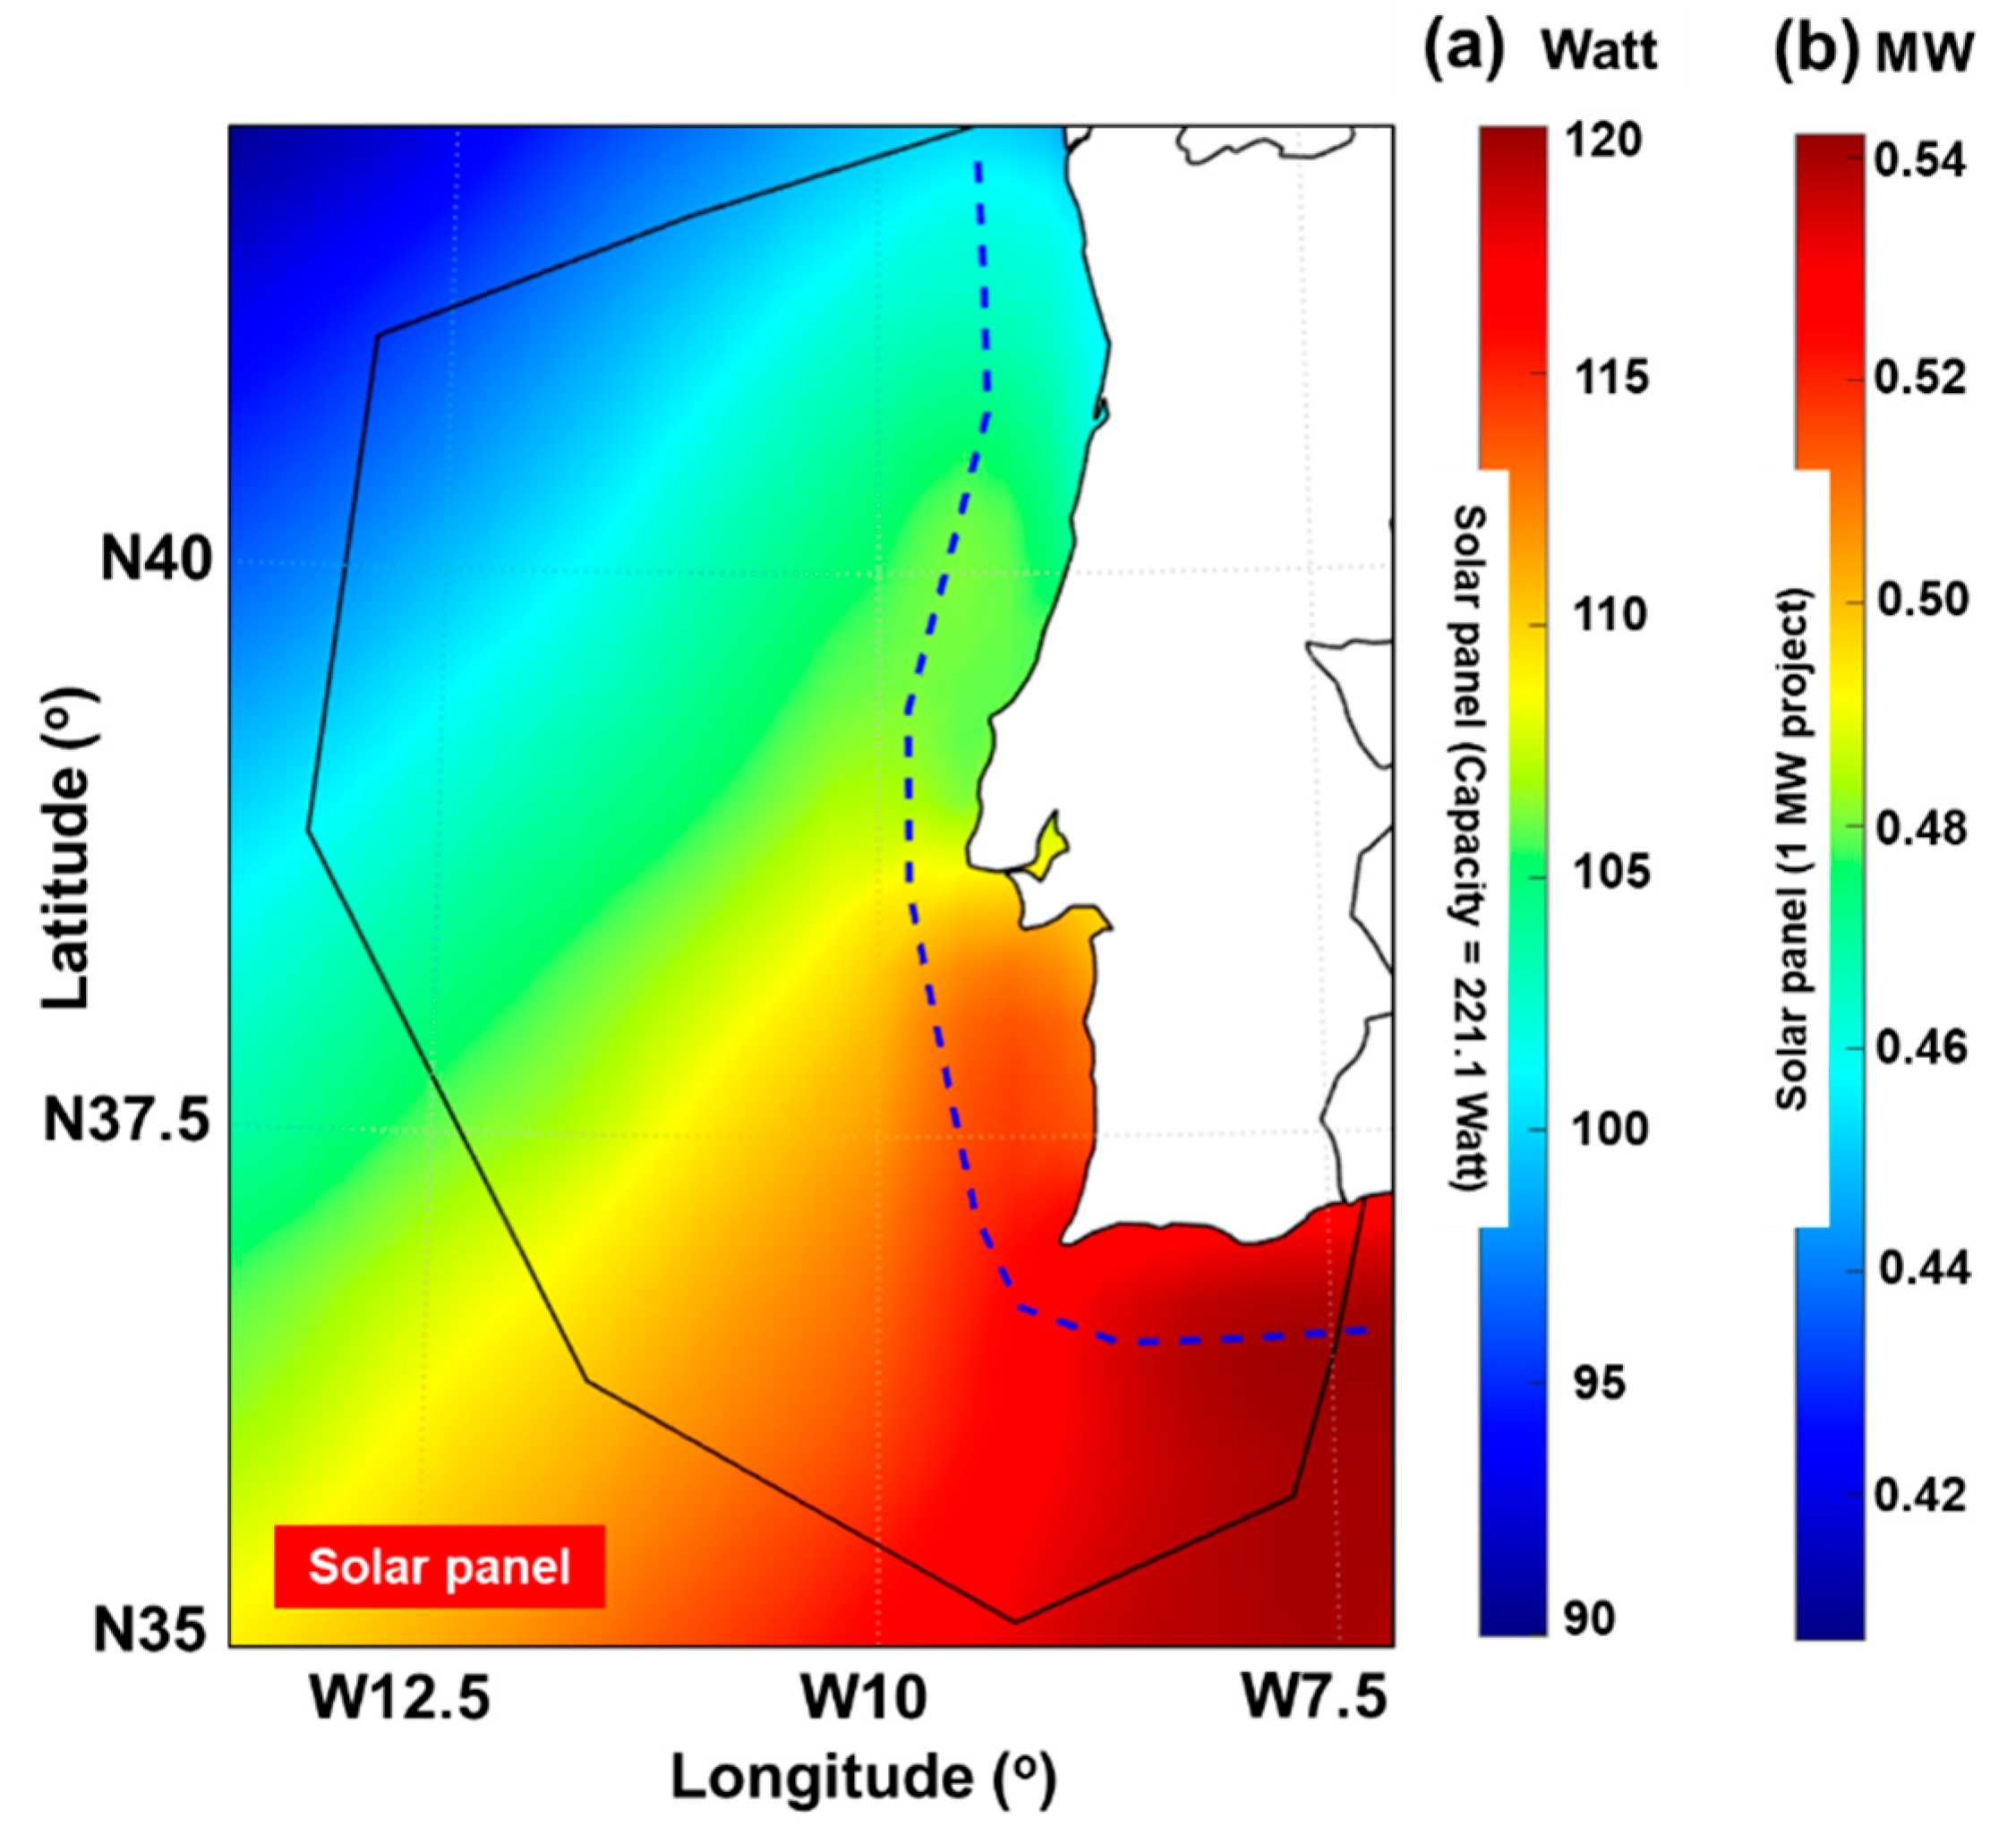
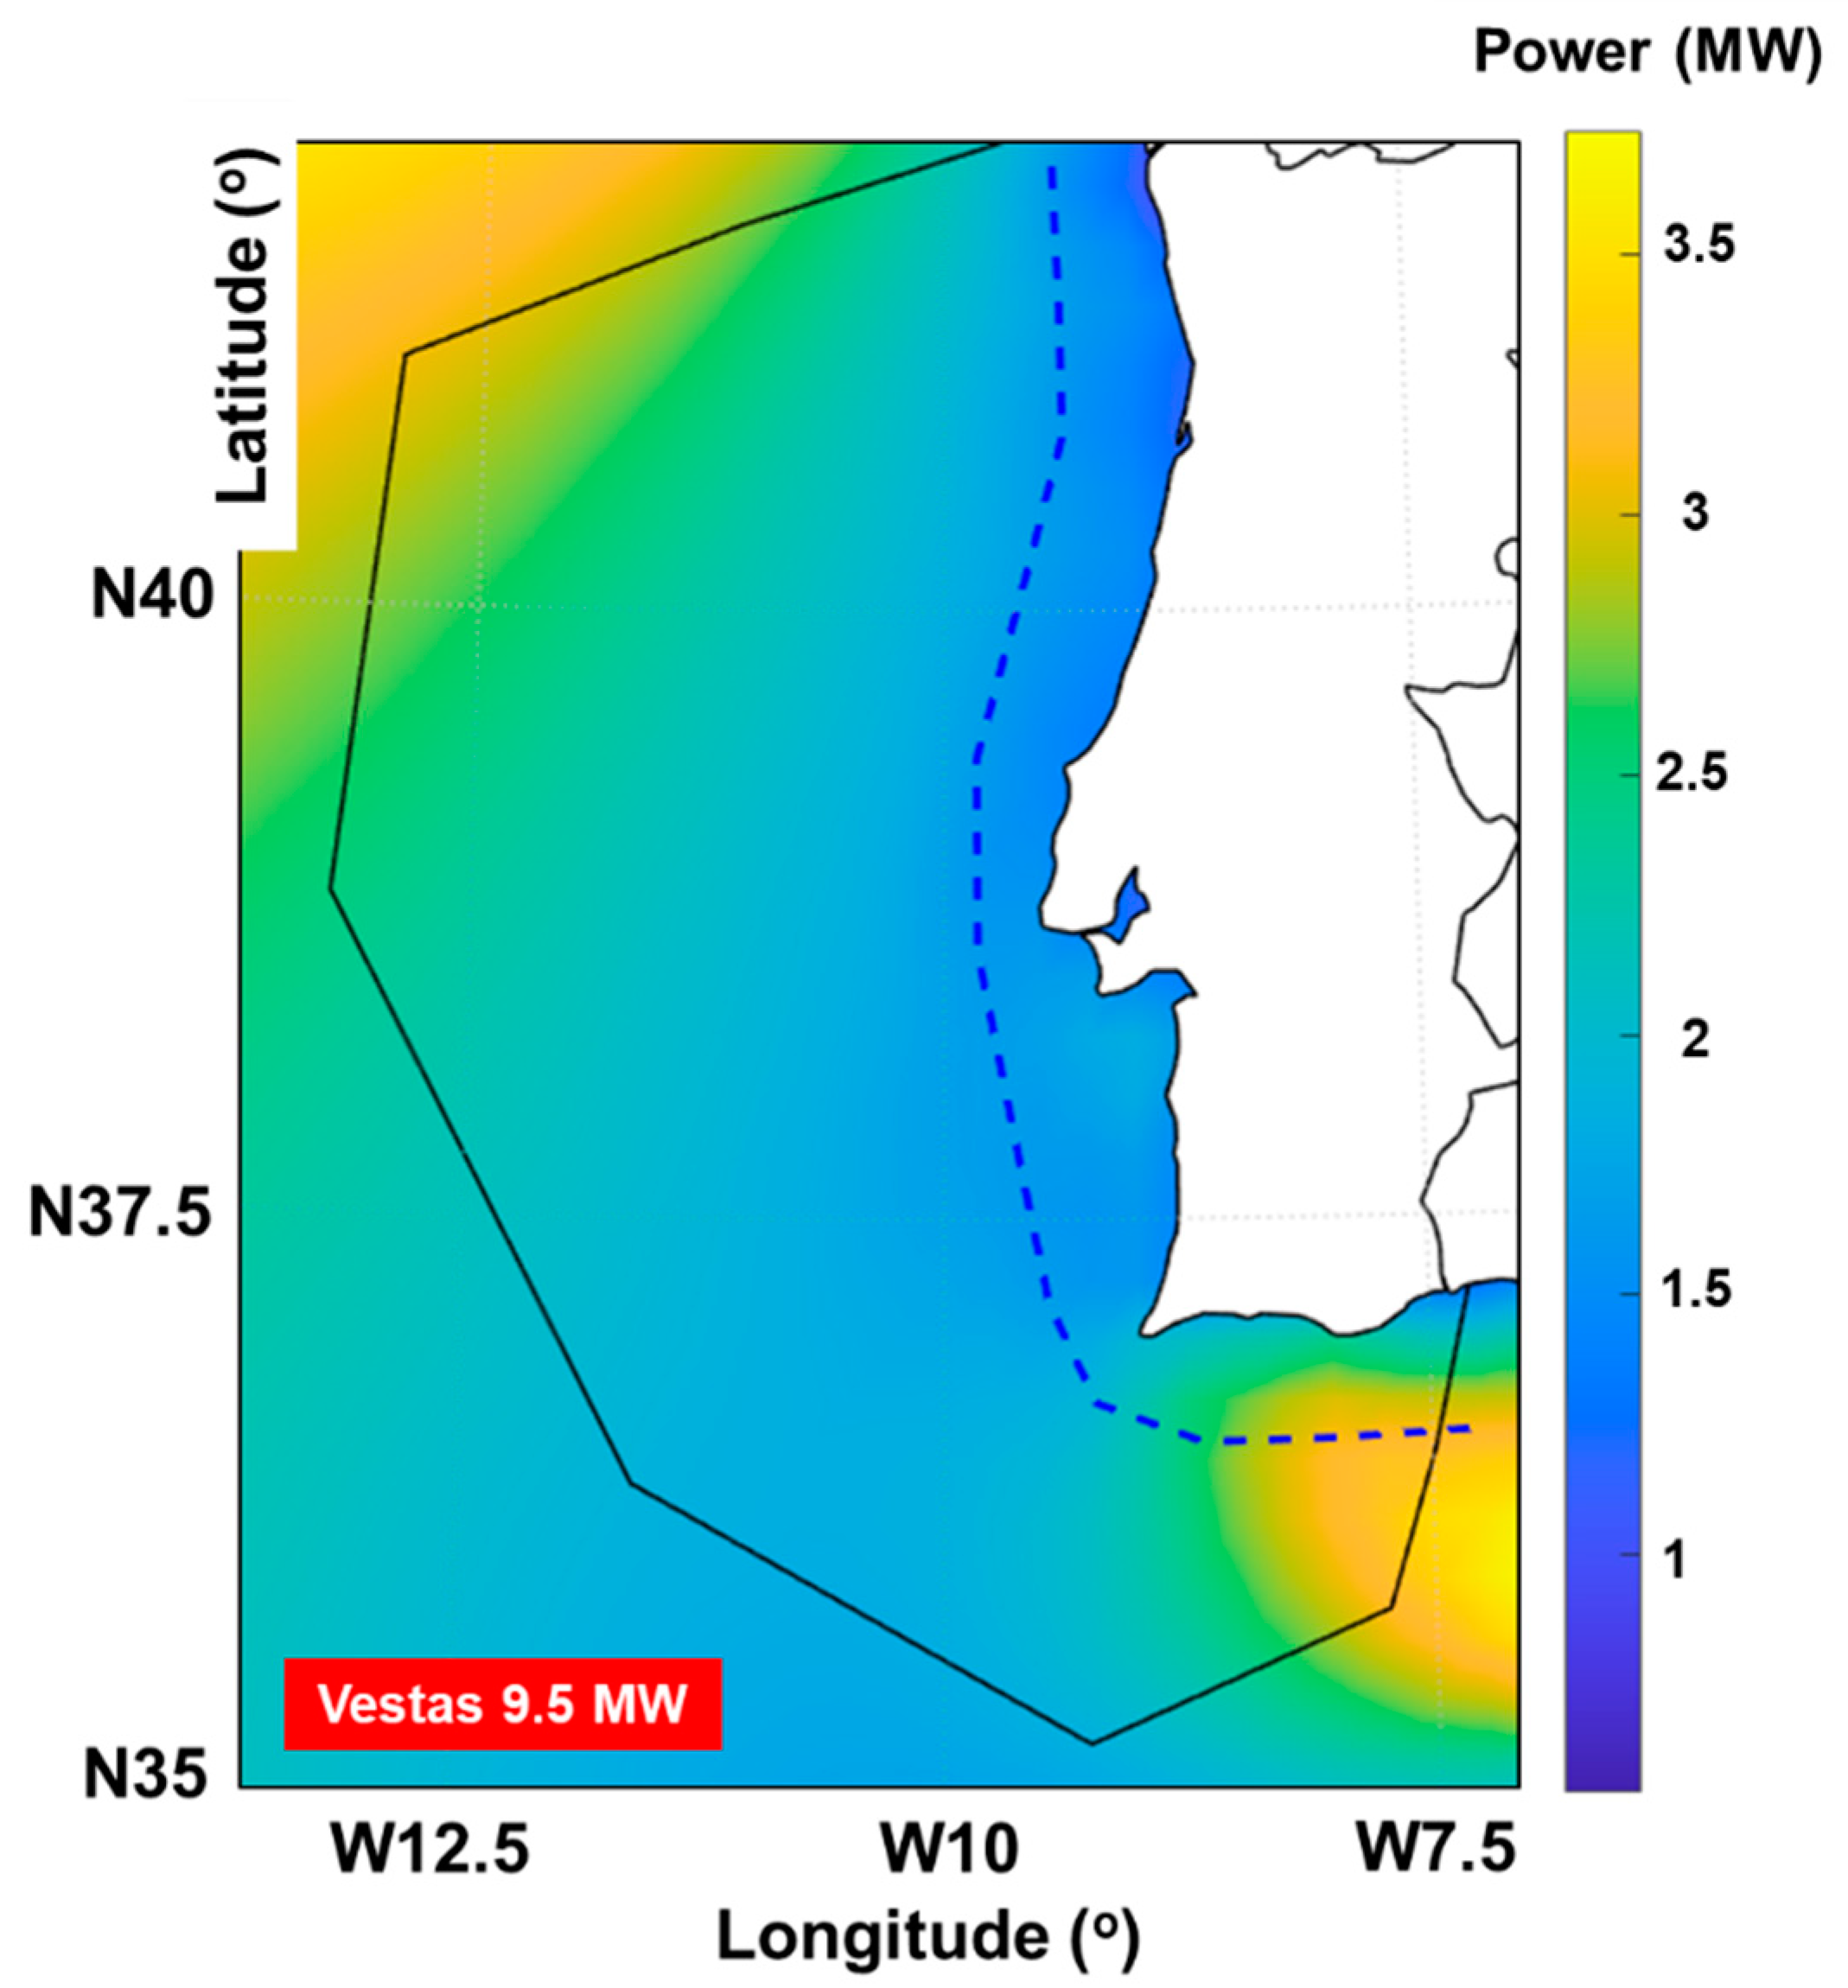
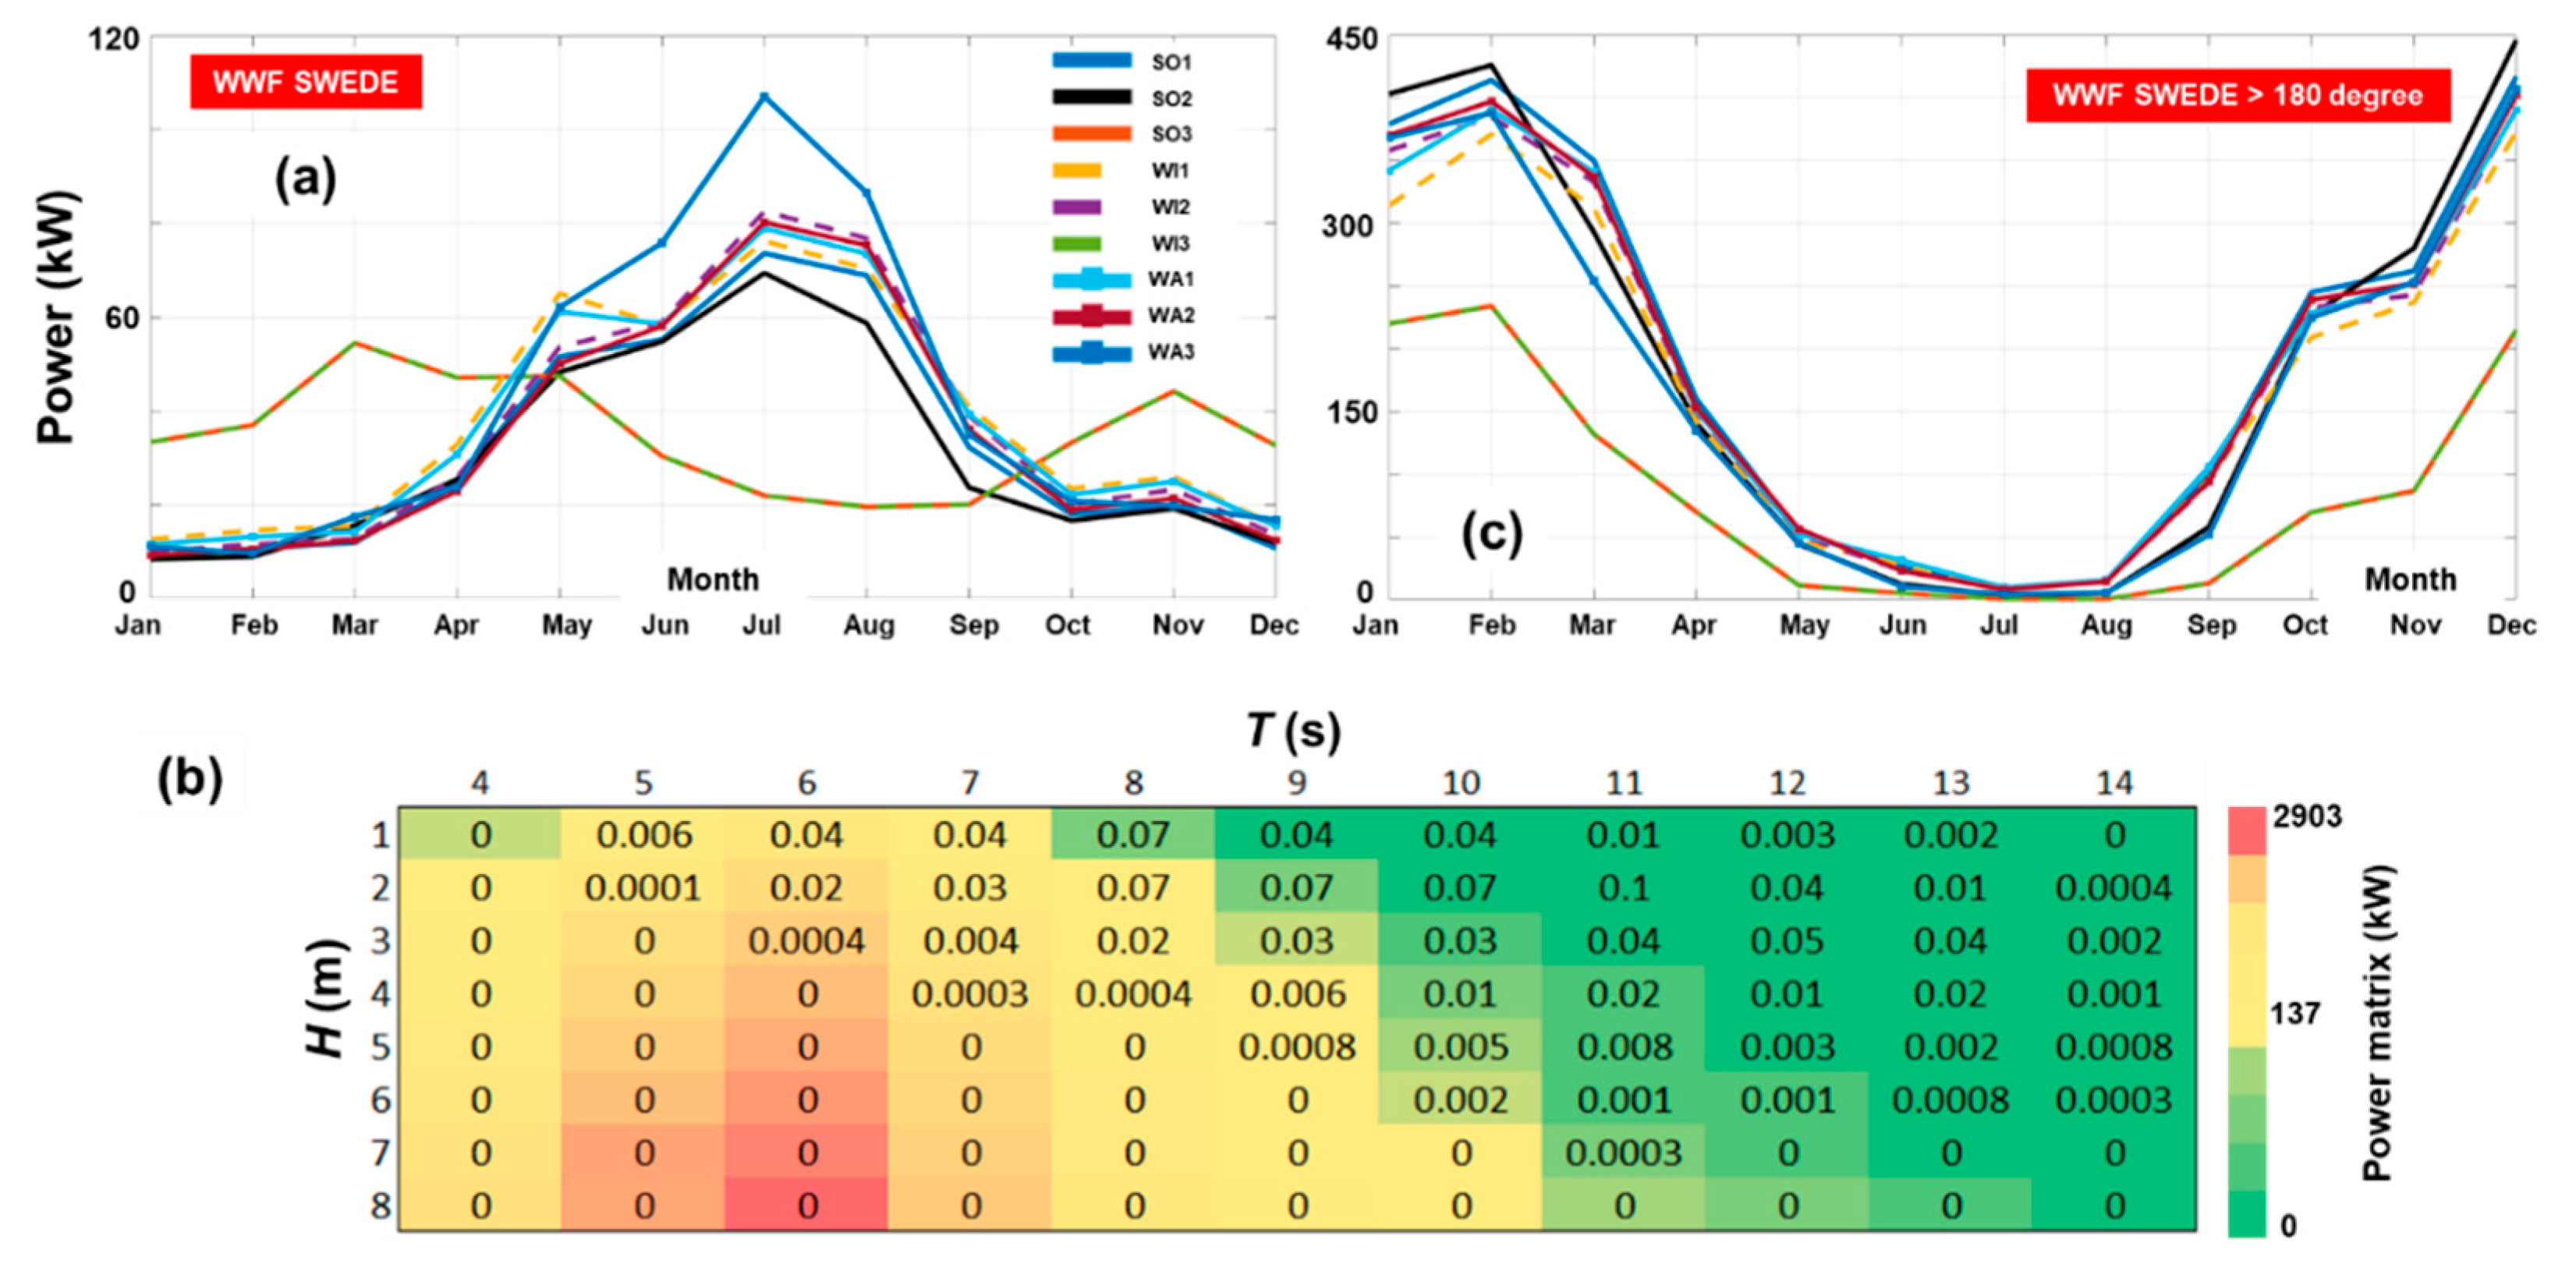
2.3. Solar, Wind and Wave Energy Systems
3. Results
4. Discussion
5. Conclusions
Author Contributions
Funding
Informed Consent Statement
Data Availability Statement
Conflicts of Interest
Abbreviations
| As | solar panel area |
| CORDEX | Coordinated Regional Climate Downscaling Experiment |
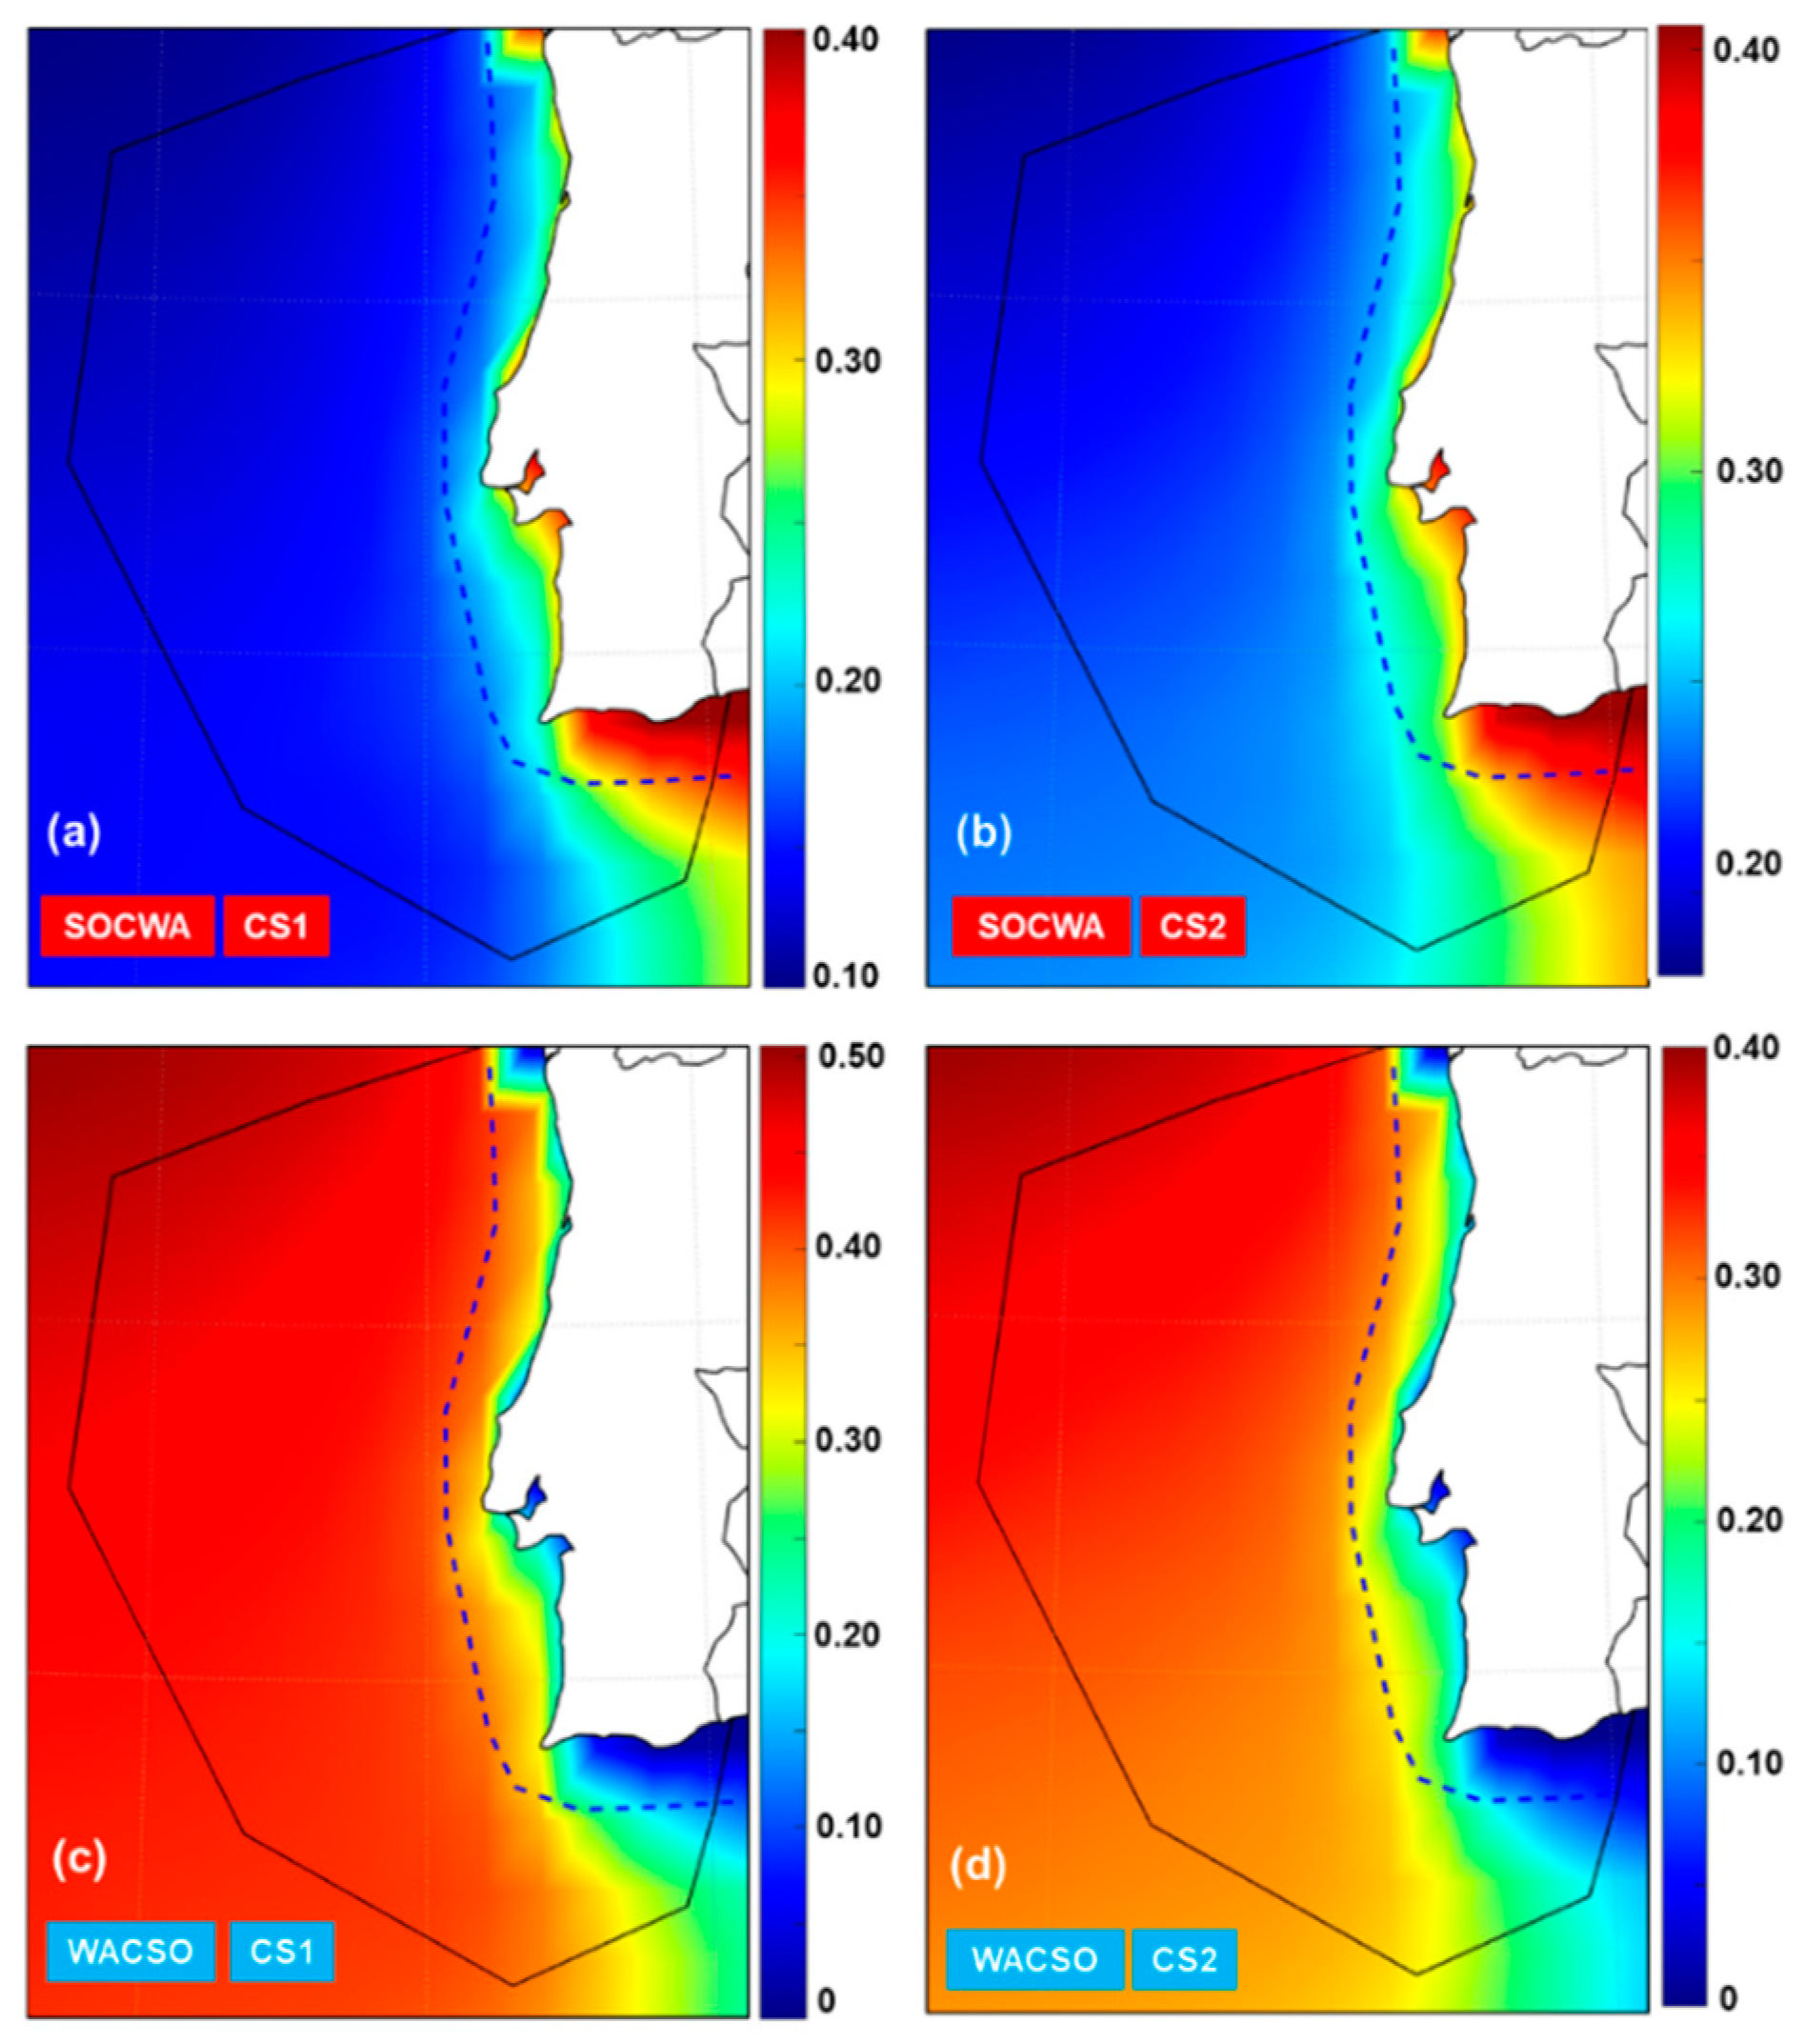
| CS | study case |
| EEZ | Exclusive Economic Zone |
| ERA5 | ECMWF Reanalysis 5th Generation |
| EU | European Union |
| EU-SCORES | European Scalable Offshore Renewable Energy Sources |
| f(u) | Weibull probability density function |
| FR | France |
| g | gravitational acceleration |
| Hs | significant height of combined wind waves and swell |
| LCOE | levelized cost of energy |
| nHs, nTe | number of particular bins |
| P(u) | power curve of a wind turbine |
| PMij | WEC power output related to a particular sea state |
| Psolar | solar power |
| Psolar panel | expected power output from a solar panel |
| PT | Portugal |
| Pturbine | expected power output of a wind turbine |
| PV | Photovoltaic |
| PWEC | expected power output of a wave energy converter |
| PWij | energy percentage related to the bivariate distribution |
| Pwind | wind power |
| Pwave | wave power |
| RCP | Representative Concentration Pathway |
| SOCWA | solar complements wave |
| SOCWI | solar complements wind |
| SSRD | surface solar radiation downwards |
| Te | mean wave period |
| u,v | eastward and northward wind vectors |
| U10, U100 | wind speed reported for a 10 and 100 m height above sea level |
| UK | United Kingdom |
| US | United States |
| WACSO | wave complements solar |
| WACWI | wave complements wind |
| WEC | wave energy converter |
| WICSO | wind complements solar |
| WICWA | wind complements wave |
| WWF SWEDE | WindWaveFloat single point absorber |
| xCy, yCx | complementarity of x to y parameter (or y to x) |
| η | efficiency of a solar panel |
| ρair | air density |
| ρwater | water density |
References
- Silva, D.; Rusu, E.; Soares, C.; Silva, D.; Rusu, E.; Soares, C.G. Evaluation of Various Technologies for Wave Energy Conversion in the Portuguese Nearshore. Energies 2013, 6, 1344–1364. [Google Scholar] [CrossRef] [Green Version]
- Lee, J.; Zhao, F. GWEC Global Wind Report. Glob. Wind Energy Counc. 2022, 158. Available online: https://gwec.net/wp-content/uploads/2022/03/GWEC-GLOBAL-WIND-REPORT-2022.pdf (accessed on 14 September 2022).
- Fakhraian, E.; Forment, M.A.; Dalmau, F.V.; Nameni, A.; Guerrero, M.J.C. Determination of the Urban Rooftop Photovoltaic Potential: A State of the Art. Energy Rep. 2021, 7, 176–185. [Google Scholar] [CrossRef]
- Hassan, Q.; Jaszczur, M.; Abdulateef, J. Optimization of PV/WIND/DIESEL Hybrid Power System in HOMER for Rural Electrification. J. Phys. Conf. Ser. 2016, 745, 032006. [Google Scholar] [CrossRef]
- Ferraz de Andrade Santos, J.A.; de Jong, P.; Alves da Costa, C.; Torres, E.A. Combining Wind and Solar Energy Sources: Potential for Hybrid Power Generation in Brazil. Util. Policy 2020, 67, 101084. [Google Scholar] [CrossRef]
- Rusu, E.; Onea, F. Joint Evaluation of the Wave and Offshore Wind Energy Resources in the Developing Countries. Energies 2017, 10, 1866. [Google Scholar] [CrossRef] [Green Version]
- Stegman, A.; de Andres, A.; Jeffrey, H.; Johanning, L.; Bradley, S. Exploring Marine Energy Potential in the UK Using a Whole Systems Modelling Approach. Energies 2017, 10, 1251. [Google Scholar] [CrossRef] [Green Version]
- Onea, F.; Rusu, E. Sustainability of the Reanalysis Databases in Predicting the Wind and Wave Power along the European Coasts. Sustainability 2018, 10, 193. [Google Scholar] [CrossRef] [Green Version]
- Perez-Collazo, C.; Greaves, D.; Iglesias, G. A Review of Combined Wave and Offshore Wind Energy. Renew. Sust. Energ. Rev. 2015, 42, 141–153. [Google Scholar] [CrossRef] [Green Version]
- Kamarlouei, M.; Gaspar, J.F.; Calvario, M.; Hallak, T.S.; Mendes, M.J.G.C.; Thiebaut, F.; Guedes Soares, C. Experimental Study of Wave Energy Converter Arrays Adapted to a Semi-Submersible Wind Platform. Renew. Energy 2022, 188, 145–163. [Google Scholar] [CrossRef]
- Hu, J.; Zhou, B.; Vogel, C.; Liu, P.; Willden, R.; Sun, K.; Zang, J.; Geng, J.; Jin, P.; Cui, L.; et al. Optimal Design and Performance Analysis of a Hybrid System Combing a Floating Wind Platform and Wave Energy Converters. Appl. Energy 2020, 269, 114998. [Google Scholar] [CrossRef]
- The WindFloat®-Principle Power. Inc. Available online: https://www.principlepower.com/windfloat (accessed on 3 November 2022).
- Hooper, T.; Armstrong, A.; Vlaswinkel, B. Environmental Impacts and Benefits of Marine Floating Solar. Sol. Energy 2021, 219, 11–14. [Google Scholar] [CrossRef]
- Abbasnia, A.; Karimirad, M.; Friel, D.; Whittaker, T. Fully Nonlinear Dynamics of Floating Solar Platform with Twin Hull by Tubular Floaters in Ocean Waves. Ocean Eng. 2022, 257, 111320. [Google Scholar] [CrossRef]
- Hybrid Offshore Renewable Energy Parks. Available online: https://www.tudelft.nl/2022/citg/hybrid-offshore-renewable-energy-parks (accessed on 3 November 2022).
- Reikard, G.; Robertson, B.; Bidlot, J.-R. Combining Wave Energy with Wind and Solar: Short-Term Forecasting. Renew. Energy 2015, 81, 442–456. [Google Scholar] [CrossRef]
- SINN Power GmbH|Germany. Available online: https://www.sinnpower.com (accessed on 3 November 2022).
- Costoya, X.; deCastro, M.; Carvalho, D.; Arguilé-Pérez, B.; Gómez-Gesteira, M. Combining Offshore Wind and Solar Photovoltaic Energy to Stabilize Energy Supply under Climate Change Scenarios: A Case Study on the Western Iberian Peninsula. Renew. Sustain. Energy Rev. 2022, 157, 112037. [Google Scholar] [CrossRef]
- Onea, F.; Rusu, E. The Expected Efficiency and Coastal Impact of a Hybrid Energy Farm Operating in the Portuguese Nearshore. Energy 2016, 97, 411–423. [Google Scholar] [CrossRef]
- Fortes, P.; Simoes, S.G.; Amorim, F.; Siggini, G.; Sessa, V.; Saint-Drenan, Y.-M.; Carvalho, S.; Mujtaba, B.; Diogo, P.; Assoumou, E. How Sensitive Is a Carbon-Neutral Power Sector to Climate Change? The Interplay between Hydro, Solar and Wind for Portugal. Energy 2022, 239, 122106. [Google Scholar] [CrossRef]
- Rusu, E. An Evaluation of the Wind Energy Dynamics in the Baltic Sea, Past and Future Projections. Renew. Energy 2020, 160, 350–362. [Google Scholar] [CrossRef]
- Couto, A.; Estanqueiro, A. Assessment of Wind and Solar PV Local Complementarity for the Hybridization of the Wind Power Plants Installed in Portugal. J. Clean. Prod. 2021, 319, 128728. [Google Scholar] [CrossRef]
- Jerez, S.; Trigo, R.M.; Sarsa, A.; Lorente-Plazas, R.; Pozo-Vázquez, D.; Montávez, J.P. Spatio-Temporal Complementarity between Solar and Wind Power in the Iberian Peninsula. Energy Procedia 2013, 40, 48–57. [Google Scholar] [CrossRef] [Green Version]
- Jurasz, J.; Canales, F.A.; Kies, A.; Guezgouz, M.; Beluco, A. A Review on the Complementarity of Renewable Energy Sources: Concept, Metrics, Application and Future Research Directions. Sol. Energy 2020, 195, 703–724. [Google Scholar] [CrossRef]
- Kies, A.; Schyska, B.U.; von Bremen, L. The Optimal Share of Wave Power in a Highly Renewable Power System on the Iberian Peninsula. Energy Rep. 2016, 2, 221–228. [Google Scholar] [CrossRef] [Green Version]
- INESC TEC Will Demonstrate the Potential of Offshore Hybrid Energy-INESC TEC. Available online: https://www.inesctec.pt/en/news/inesc-tec-will-demonstrate-the-potential-of-offshore-hybrid-energy#about (accessed on 28 November 2022).
- Bueno-Pardo, J.; Nobre, D.; Monteiro, J.N.; Sousa, P.M.; Costa, E.F.S.; Baptista, V.; Ovelheiro, A.; Vieira, V.M.N.C.S.; Chícharo, L.; Gaspar, M.; et al. Climate Change Vulnerability Assessment of the Main Marine Commercial Fish and Invertebrates of Portugal. Sci. Rep. 2021, 11, 2958. [Google Scholar] [CrossRef] [PubMed]
- Flanders Marine Institute (VLIZ). Belgium Maritime Boundaries Geodatabase: Maritime Boundaries and Exclusive Economic Zones (200NM); Flanders Marine Institute (VLIZ): Ostend, Belgium, 2019. [Google Scholar]
- Ritchie, H.; Roser, M.; Rosado, P. Energy. Our World Data 2020. Available online: https://ourworldindata.org/energy (accessed on 14 September 2022).
- Hersbach, H.; Bell, B.; Berrisford, P.; Hirahara, S.; Horányi, A.; Muñoz-Sabater, J.; Nicolas, J.; Peubey, C.; Radu, R.; Schepers, D.; et al. The ERA5 Global Reanalysis. Q. J. R. Meteorol. Soc. 2020, 146, 1999–2049. [Google Scholar] [CrossRef]
- ERA5 Hourly Data on Single Levels from 1959 to Present. Available online: https://cds.climate.copernicus.eu/cdsapp#!/dataset/reanalysis-era5-single-levels?tab=overview (accessed on 7 November 2022).
- de Souza Nascimento, M.M.; Shadman, M.; Silva, C.; de Freitas Assad, L.P.; Estefen, S.F.; Landau, L. Offshore Wind and Solar Complementarity in Brazil: A Theoretical and Technical Potential Assessment. Energy Convers. Manag. 2022, 270, 116194. [Google Scholar] [CrossRef]
- Hasager, C.; Stein, D.; Courtney, M.; Peña, A.; Mikkelsen, T.; Stickland, M.; Oldroyd, A. Hub Height Ocean Winds over the North Sea Observed by the NORSEWInD Lidar Array: Measuring Techniques, Quality Control and Data Management. Remote Sens. 2013, 5, 4280–4303. [Google Scholar] [CrossRef] [Green Version]
- Golbazi, M.; Archer, C.L.; Alessandrini, S. Surface Impacts of Large Offshore Wind Farms. Environ. Res. Lett. 2022, 17, 064021. [Google Scholar] [CrossRef]
- Wen, Y.; Kamranzad, B.; Lin, P. Joint Exploitation Potential of Offshore Wind and Wave Energy along the South and Southeast Coasts of China. Energy 2022, 249, 123710. [Google Scholar] [CrossRef]
- Kardakaris, K.; Boufidi, I.; Soukissian, T. Offshore Wind and Wave Energy Complementarity in the Greek Seas Based on ERA5 Data. Atmosphere 2021, 12, 1360. [Google Scholar] [CrossRef]
- Yue, C.-D.; Wang, I.-C.; Huang, J.-S. Feasibility of Replacing Nuclear and Fossil Fuel Energy with Offshore Wind Energy: A Case for Taiwan. Energies 2022, 15, 2385. [Google Scholar] [CrossRef]
- Alla, W.; Roddier, D.; Banister, K. WindWaveFloat (WWF): Final Scientific Report; Principle Power Inc.: Seattle, WA, USA, 2012; p. 1057931. [Google Scholar]
- Bauer, L. MHI Vestas Offshore V164-9.5 MW-9,50 MW-Wind Turbine. Available online: https://en.wind-turbine-models.com/turbines/1605-mhi-vestas-offshore-v164-9.5-mw (accessed on 8 November 2022).
- Rusu, E.; Onea, F. A Parallel Evaluation of the Wind and Wave Energy Resources along the Latin American and European Coastal Environments. Renew. Energy 2019, 143, 1594–1607. [Google Scholar] [CrossRef]
- Gupta, T.; Baidya Roy, S. Recovery Processes in a Large Offshore Wind Farm. Wind Energy Sci. 2021, 6, 1089–1106. [Google Scholar] [CrossRef]
- Forbush, D.D.; Bacelli, G.; Spencer, S.J.; Coe, R.G. A Self-Tuning WEC Controller For Changing Sea States. IFAC-PapersOnLine 2020, 53, 12307–12312. [Google Scholar] [CrossRef]
- Marco, F.; Sirigu, S.A.; Giorgi, G.; Bracco, G. Expanding Operational Bandwidth and Tuning a Wave Energy Converter Using U-Shaped Sloshing Tanks. In Proceedings of the I4SDG Workshop, Online, 25–26 November 2021; Springer: Cham, Germany, 2022; pp. 78–86. [Google Scholar]
- Rusu, L.; Onea, F. The Performance of Some State-of-the-Art Wave Energy Converters in Locations with the Worldwide Highest Wave Power. Renew. Sust. Energ. Rev. 2017, 75, 1348–1362. [Google Scholar] [CrossRef]
- López, M.; Rodríguez, N.; Iglesias, G. Combined Floating Offshore Wind and Solar PV. JMSE 2020, 8, 576. [Google Scholar] [CrossRef]
- Campos, R.M.; Guedes Soares, C. Spatial Distribution of Offshore Wind Statistics on the Coast of Portugal Using Regional Frequency Analysis. Renew. Energy 2018, 123, 806–816. [Google Scholar] [CrossRef]
- de Andres, A.; Guanche, R.; Vidal, C.; Losada, I.J. Adaptability of a Generic Wave Energy Converter to Different Climate Conditions. Renew. Energy 2015, 78, 322–333. [Google Scholar] [CrossRef]


| Case Study | Renewable | Renewable | Ref. |
|---|---|---|---|
| CS1 | Solar | Percentile of 5% related to the current target area | [32] |
| Wind | 80 W/m2 | [35] | |
| Wave | 2.5 kW/m2 | ||
| CS2 | Solar | Percentile of 5% related to the current target area | [32] |
| Wind | 280 W/m2 | [36] | |
| Wave | 5 kW/m2 | ||
| Complementarity indices | |||
| SOCWI | Solar complements wind | ||
| WICSO | Wind complements solar | ||
| SOCWA | Solar complements wave | ||
| WACSO | Wave complements solar | ||
| WICWA | Wind complements wave | ||
| WACWI | Wave complements wind | ||
| (a) Solar Panel [32] | (b) Wind—Vestas Offshore V164-9.5 MW [37] | (c) Wave—WWF SWEDE [38] | |||
|---|---|---|---|---|---|
| Type | Silicon crystalline | Power rating | 9.5 MW | Rated power | 2.4 MW |
| Efficiency | 26.8% | Cut-in wind speed | 3 m/s | Sphere radius | 5 m |
| Output capacity | 221.1 W | Nominal wind speed | 14 m/s | Cut-in | 1 m/1 s |
| Panel area | 2 m2 | Cut-out wind speed | 25 m/s | Cut-out | 8 m/14 s |
| Rotor diameter | 164 m | Type | Single point absorber | ||
| Hub height | 100 m | ||||
Publisher’s Note: MDPI stays neutral with regard to jurisdictional claims in published maps and institutional affiliations. |
© 2022 by the authors. Licensee MDPI, Basel, Switzerland. This article is an open access article distributed under the terms and conditions of the Creative Commons Attribution (CC BY) license (https://creativecommons.org/licenses/by/4.0/).
Share and Cite
Onea, F.; Rusu, E. An Evaluation of Marine Renewable Energy Resources Complementarity in the Portuguese Nearshore. J. Mar. Sci. Eng. 2022, 10, 1901. https://doi.org/10.3390/jmse10121901
Onea F, Rusu E. An Evaluation of Marine Renewable Energy Resources Complementarity in the Portuguese Nearshore. Journal of Marine Science and Engineering. 2022; 10(12):1901. https://doi.org/10.3390/jmse10121901
Chicago/Turabian StyleOnea, Florin, and Eugen Rusu. 2022. "An Evaluation of Marine Renewable Energy Resources Complementarity in the Portuguese Nearshore" Journal of Marine Science and Engineering 10, no. 12: 1901. https://doi.org/10.3390/jmse10121901
APA StyleOnea, F., & Rusu, E. (2022). An Evaluation of Marine Renewable Energy Resources Complementarity in the Portuguese Nearshore. Journal of Marine Science and Engineering, 10(12), 1901. https://doi.org/10.3390/jmse10121901